DOI:10.32604/cmc.2021.014253
| Computers, Materials & Continua DOI:10.32604/cmc.2021.014253 | |
| Article |
Social Media and Stock Market Prediction: A Big Data Approach
1School of Computing, Faculty of Engineering, University Teknologi Malaysia, Johor, Malaysia
2Department of Software Engineering, University of Management and Technology, Lahore, Pakistan
3Collage of Business, Abu Dhabi University, Abu Dhabi, United Arab Emirates
4Oxford Center for Islamic Studies, The University of Oxford, Oxford, UK
5The University of Liverpool Management School, The University of Liverpool, Liverpool, UK
6Department of Computer Engineering, National University of Technology, Islamabad, Pakistan
7School of Computing, UTM Big Data Centre, Universiti Teknologi Malaysia, Johor, Malaysia
*Corresponding Author: Mazhar Javed Awan. Email: mazhar.awan@umt.edu.pk
Received: 09 September 2020; Accepted: 21 December 2020
Abstract: Big data is the collection of large datasets from traditional and digital sources to identify trends and patterns. The quantity and variety of computer data are growing exponentially for many reasons. For example, retailers are building vast databases of customer sales activity. Organizations are working on logistics financial services, and public social media are sharing a vast quantity of sentiments related to sales price and products. Challenges of big data include volume and variety in both structured and unstructured data. In this paper, we implemented several machine learning models through Spark MLlib using PySpark, which is scalable, fast, easily integrated with other tools, and has better performance than the traditional models. We studied the stocks of 10 top companies, whose data include historical stock prices, with MLlib models such as linear regression, generalized linear regression, random forest, and decision tree. We implemented naive Bayes and logistic regression classification models. Experimental results suggest that linear regression, random forest, and generalized linear regression provide an accuracy of 80%–98%. The experimental results of the decision tree did not well predict share price movements in the stock market.
Keywords: Big data; analytics; artificial intelligence; machine learning; stock market; social media; business analytics
Big data consists of massive structured and unstructured information that can be manipulated by machine models, unlike earlier structures such as relational databases [1]. The increasing importance of big data springs from the common use of new technology and smart devices such as smartphones and tablets. Big data analytics help to manage large amounts of data generated by different companies and can be used to predict trends [2].
Spark provides a basic machine learning library with tools such as scalability, design, and languages such as Scala, R, and Python. To use machine learning in a sequential environment has many weaknesses, such as long execution time with large datasets, task-dependency, non-scalability, and limited memory. Spark provides tools to address these problems, and it facilitates data engineering and science [3]. Every investor needs to predict stock prices, which helps them to make correct decisions to buy or sell. Forecasting the market is the main challenge to investors. Information such as from news and social media can be used to predict the market [4].
External factors such as social media [5] and blogs can be used to analyze a company’s performance. It is difficult to accurately analyze a massive amount of data. Forecasting the stock market requires a system, which can be built using machine learning algorithms. Machine learning models and other data mining techniques like time series analysis helps to forecast stock prices. The prediction process includes many factors and a huge amount of data; hence, we propose big data techniques to predict stock prices and trends [6]. Fig. 1 shows how investors manually predict the movement of stock prices using social media.
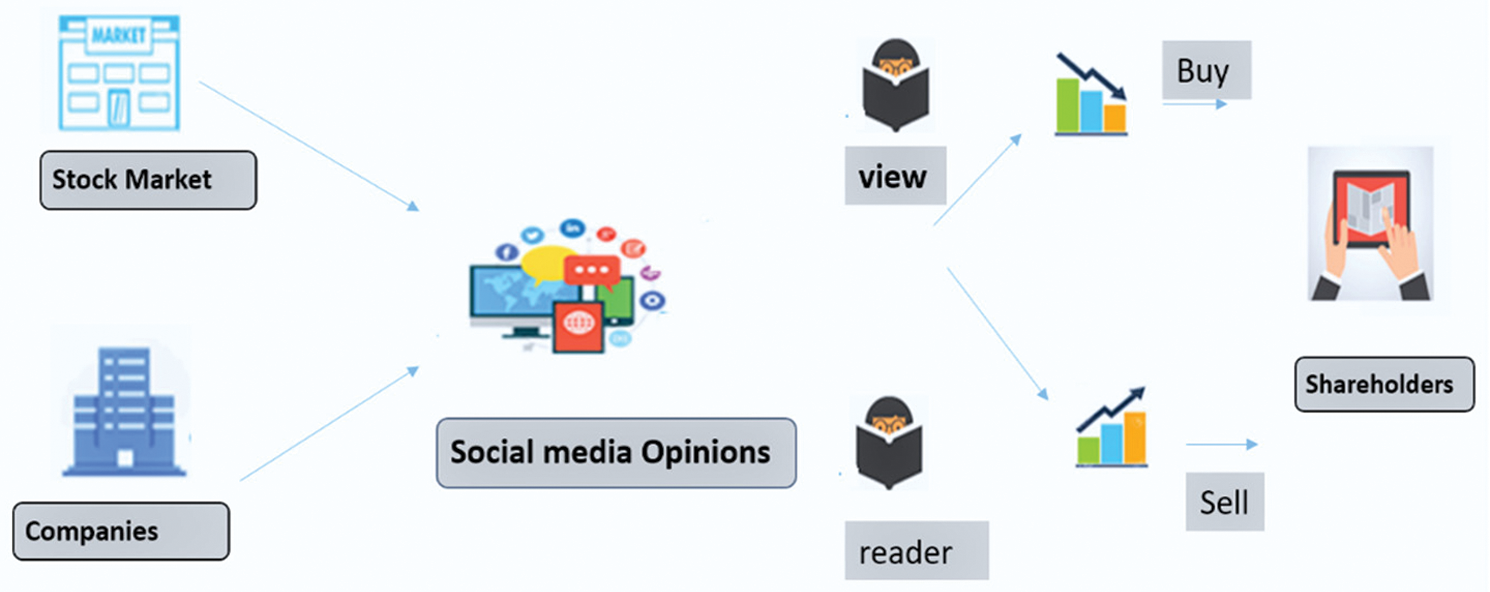
Figure 1: Investor analysis through social media in the stock market
Most investors analyze market and company information before buying stocks. Market-related information is available on social media and from news, blogs, and companies’ customer reviews. Many investors analyze such information to predict the movements of stock prices. The manual analysis of this information is prone to errors [7]. Accuracy is essential in data analysis, but factors such as computation speed are also important. External elements such as financial broadcasts and social media require machine learning to predict market prices [8]. Information sources provide unstructured data, which is not directly used in machine learning; hence, preprocessing is required [9].
We present models to predict market trends. Machine learning algorithms have different approaches. All are applied in the Spark framework using Python. Databricks platforms are also used. We discuss both structured and unstructured datasets.
Machine models such as linear regression, decision tree, random forest, and generalized linear regression are applied to the structure of datasets. The main inputs are closing prices and adjusted closing prices, which are used to predict the behavior of stock prices. Logistical regression and naive Bayes models are applied to unstructured datasets such as messages and reviews of customers and investors.
We compare results to predict the intrinsic values of share prices using the above models. We use existing and new techniques of the machine learning classification model with modern platforms Databricks and PySpark with Python. We use a 10-year history dataset to predict stock price movements. We include daily news and social media (Yahoo! Finance, Twitter) datasets for use in sentiment analysis to predict the intrinsic values of share prices.
The remainder of this paper is organized as follows. Section 1 discusses the background and previous work. Section 2 discusses the proposed model and defines the datasets (structured and unstructured) and Spark machine learning libraries. Section 3 discusses the performance and results of the models and compares their results. Section 4 discusses our conclusions and future work.
Forecasting is a challenge as investors seek to accurately predict market values, and many models have been proposed. Every researcher tries to accurately predict the market. Stock market prediction is based on various techniques related to structured and unstructured data [10]. Florian et al. [11] argued that investors consider customers’ views and historical data to predict future movements of share prices.
Khan [12] described the process of collecting messages and texture from Twitter’s data to predict share price movements, and argued that stop-words and comments affect the results because Twitter data are unstructured. Before applying a new model, stop-words should be removed for better prediction of price movements [13]. Sentiment analysis was applied to stock data to predict stock price movements [14]. Our investigation depends on Twitter data, and findings suggest that naive Bayes is a 50% accurate index to predict stock price movements, which is inadequate. It has many missing values because the stock market is closed during the weekend, which affects the accuracy of the results [15].
Hong mentioned that scientific analysis applies to historical data where mathematical approaches are used to forecast the movements of the stock market [16]. Cakra et al. [17] studied the use of historical information and sentiment analysis to predict share price movements, but did not achieve a good result. Researchers classified the system into two parts: the first including data collected from newspapers and company profiles, and the second applying naive Bayes algorithms to process and tokenize data [18]. Their prediction of stock market price movements showed 86% correct values.
Peng [19] analyzed one million messages from different markets and applied text classification to describe the sentiment score of messages related to companies. Preda et al. [20] defined the problem for the wholesaler by predicting the expected value of the share prices and stock market indices. The proposed model relies on a sub-model that eliminates the errors associated with spam data.
Misra et al. [21] discussed linear classification with support vector machine (SVM) and artificial neural networks to accurately forecast the market’s daily movements. An artificial neural network (ANN) and SVM are commonly applied in handling heterogeneous data and finance data. Rechenthin, Street, and Srinivasan proposed a system to predict the U.S. oil market (USO) stock chatter, which can examine the USO index to predict the true value of the stocks. Yahoo! Finance has information of all opening and closing prices of the USO. Machine learning approaches to Spark, Hadoop, and regression methods have been applied in the literature to predict the movements of stock prices. Spark was used to predict real-time data because Hadoop with MapReduce cannot work correctly in a real-time system [22].
Seif et al. [23] proposed a model to forecast markets using news and other external factors. Machine algorithms and other neural network techniques were applied to collect data to predict accurate values. The naive Bayes technique, SVM, and text mining were used to finalize the dataset to predict the stock market index [23]. This system collects positive and negative views, and historical stocks’ opening and closing price information to increase the forecasting of stock market values. The proposed system predicts heterogeneous data such as news, social media, and historical movements of share prices. The researchers stated that results of the k-nearest neighbors (KNN) algorithm used to examine the relationship between social media news and the movement of the stock prices are significant [24].
In this article, we describe artificial intelligence, natural network, and machine learning algorithms for predicting movements of stock prices. This article divides a method into two parts: prediction and classification. Prediction techniques like ANN, CNN, Naive Bayes, NN, and Digital Signature Standard (DSS) are used to predict a model. The second part describes some classification methods like filtering, fuzzy-based optimization, and KNN methods applied to some datasets to evaluate the value of the stock market. The neural network method of DSS is used in the hybrid model to predict the movements of stock prices. Yang et al. [25] proposed a model to forecast stock price movements with big data, with data obtained from social media.
Yang et al. proposed a model to forecast the market value with big data. The researchers collected data from real-time processing using social media [25]. Before applying the model, they removed stop-words and processed the data to forecast the market index. To predict stock price movements, they employed machine models such as SVM, decision trees (DT), and random forest (RF) to forecast the value of the market. We have employed an integrated Support Vector Machine (SVM) with the latest square to forecast the daily movements of the stock prices were used to forecast a daily value of the stock market index and used article swarm optimization.
In our study, we rely on different sources of data–-both structured and unstructured data–-to predict the future movements of stock prices. We have employed several models that produced better results compared with the models applied in the literature.
We propose a model to help investors decide which shares to buy and sell. The model aims to predict stock price movements.
This model applies to historical data, Twitter, and news related to different companies. The historical news of different companies’ datasets is used to predict the future values of stocks.
We use two types of datasets. First, we collect the historical datasets of companies in the last 15 years. The second dataset is collected from news, blogs, Twitter, Yahoo! Finance, and reviews and messages about different companies, along with sources such as Google Dataset Search and Kaggle.com.
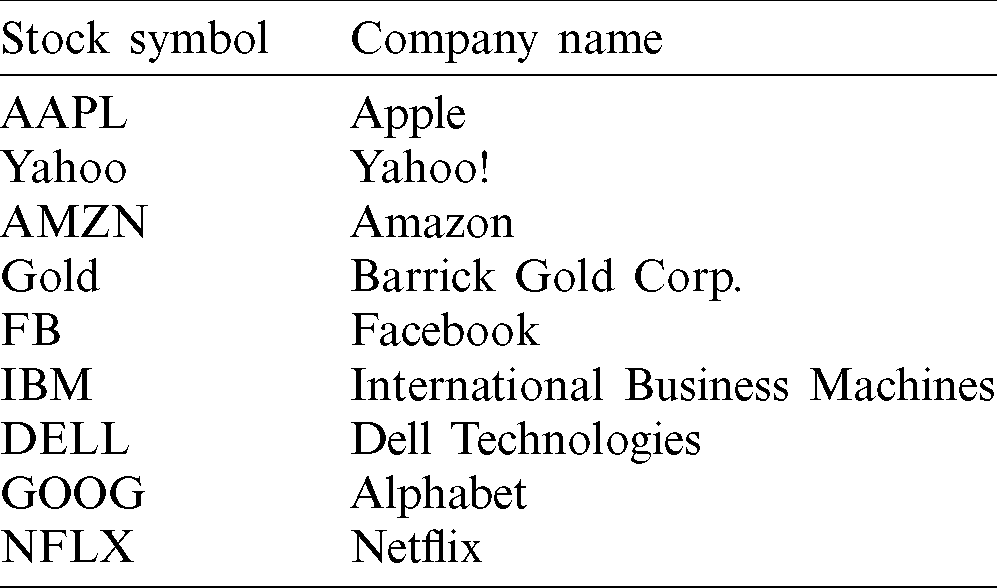
Yahoo! Finance [26] datasets can include close, high, open, and low prices of companies. The opening prices are the prices at which stocks first trade when a stock market opens, while closing prices are the stocks’ prices at the end of a trading day or session when a stock market closes. We can also get a company’s history using Yahoo! application programming interfaces (APIs) and Kaggle.com datasets [27]. We took 10 companies’ historical data to predict their values. Examples of companies and their symbols are shown in Tab. 1.
Table 1: Company names and stock symbols
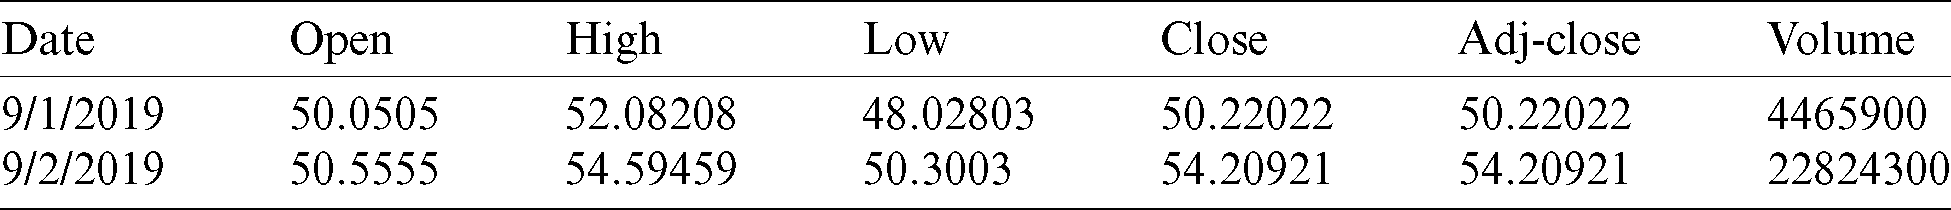
The adjusted closing price (Adj-Close) is the price at the end of the trading day or session adjusted for companies’ actions such as stock dividends or stock splits. Researchers may use the Adj-Close value to examine expected movements of share prices. Many articles use Adj-Close to forecast the market’s exact value. Tab. 2 shows a historical dataset with features of structured data [27].
Table 2: Historical structured dataset samples
3.1.2 News/Blogs/Messages Board
Data for sentiment analysis can be collected from Twitter, Yahoo! Finance messages, Kaggle.com, and other sources. Yahoo! Finance has a trading platform that includes companies’ information to help investors in stock trading.
Investors view companies’ profiles, historical trading data, news, analysts’ opinions, financial statements, and messages to identify which company share values have increased or decreased. Machine learning techniques are applied to these datasets to predict the movements of stock prices. Analysis of messages helps investors to plan their trading. Fig. 2 shows a Yahoo! Finance message panel with different investor analyses of company data. Fig. 2 shows an idea of how investors analyzed market data to predict market movements.

Figure 2: Message of Apple (AAPL) stock in Yahoo! Finance [20]
3.2 Historical Data Preprocessing to Forecast Stock Market
We collect data from Yahoo! Finance and Kaggle.com. We can process these datasets into a form that facilitates the use of machine learning algorithms to analyze future stock market trends. Yahoo! Finance data will have missing values on weekends because the stock market is closed, but Twitter data have no such missing values [23]. We can use some mathematical techniques to reduce and remove missing prices from datasets. For example, suppose we can take the previous and current trading price for a stock,

The X value is a better solution to fill the missing value in the movement of the market. A high-low price percentage is an important formula to forecast the stock market. Eq. (1) is used to compensate for missing values. Eq. (2) helps to find the low- and high-percentage movement of the market:

Both formulae apply the ML-lib model to predict the future values of stock prices. Fig. 3 shows the general flow of our model using machine learning techniques.
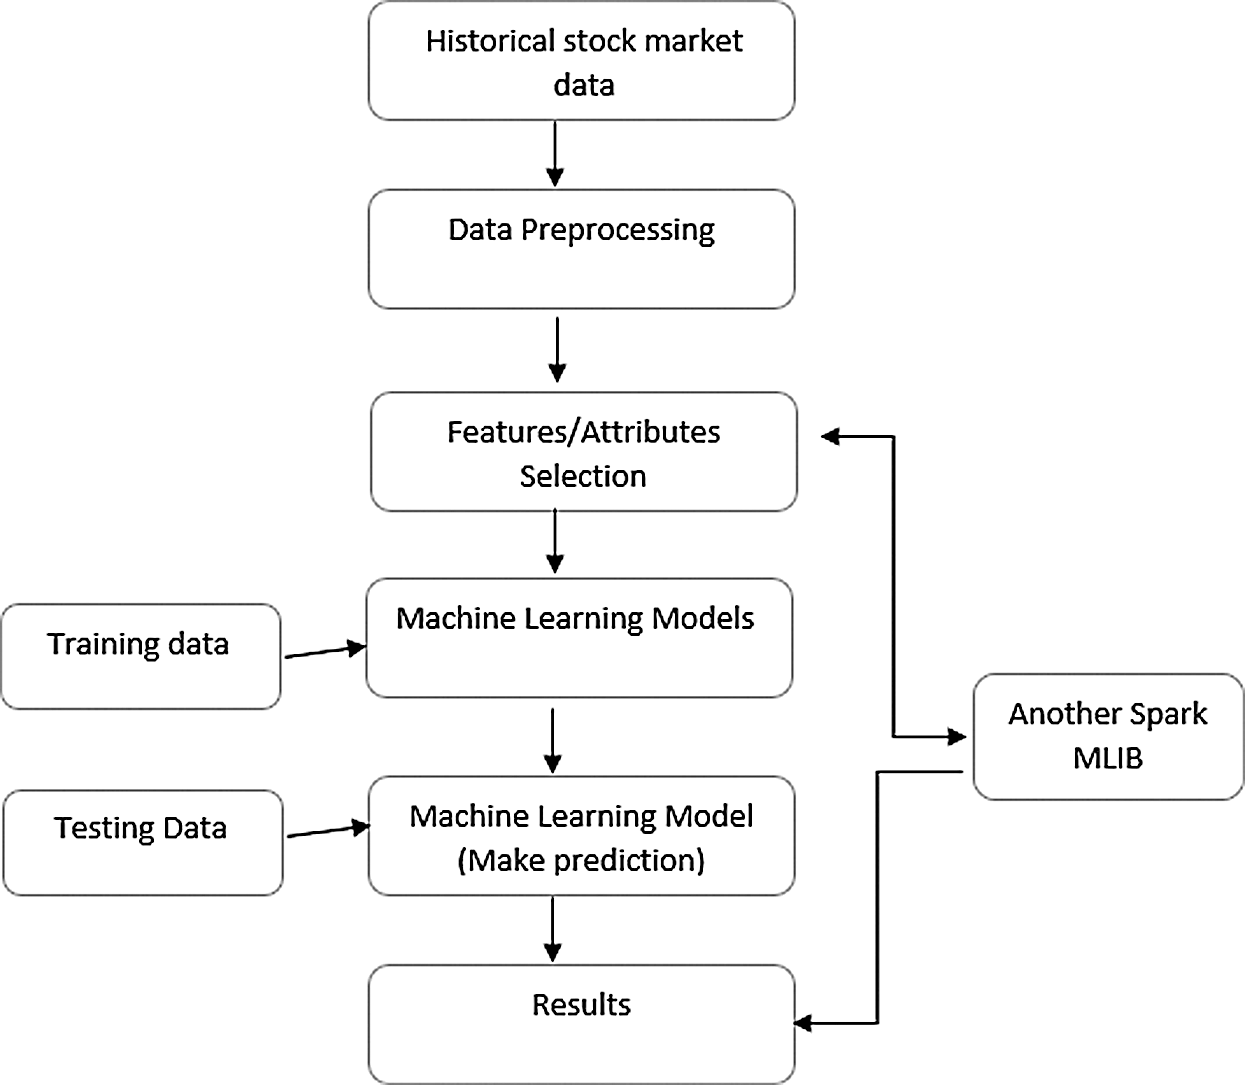
Figure 3: Model of stock market forecasts
We apply some text processing techniques to unstructured datasets such as social media and news. We cannot use unstructured datasets in machine models; hence, techniques such as tokenization and text processing are employed to remove spam. In Databricks, we used Spark with Python to process datasets. A dataset can be read using a Spark context. Datasets are converted to resilient distributed datasets (RDDs), a Spark structure that allows data to be divided into clusters.
3.2.2 Change Non-Numeric Values to Numeric
We remove unwanted columns and change non-numeric values to numeric datasets.
3.2.3 Feature Extraction/Selection
We have employed several feature-selection and feature-extraction techniques to avoid unnecessary complexity in our model. We can select features that increase the accuracy of a model. We convert RDD to a dense vector function, after which data frames have two-column labels and features. These can be divided into training and testing data frames. We apply MLlib in Spark with Python.
3.3 Sentiment Analysis for Unstructured Datasets
Sentiment analysis can be applied to unstructured datasets such as messages, news, and data extracted from social media. Sentiment analysis can be applied to news and messages from the stock market to help investors identify share price movements.
ML algorithms can be used to forecast the next value of the stock market. Linear regression, NB, and DT are used to forecast the movement in stock prices. These models are applied in the Spark framework using Python. Databricks platforms are used when these models can be applied to datasets to find models that give accurate values of the stock index.
Data are analyzed using ML-LibMLlib support models such as naive Bayes and Linear Support Vector Machine. Before using the model, we must process the datasets. Fig. 4 shows some steps to be followed before using machine learning models, particularly for sentimental analysis.
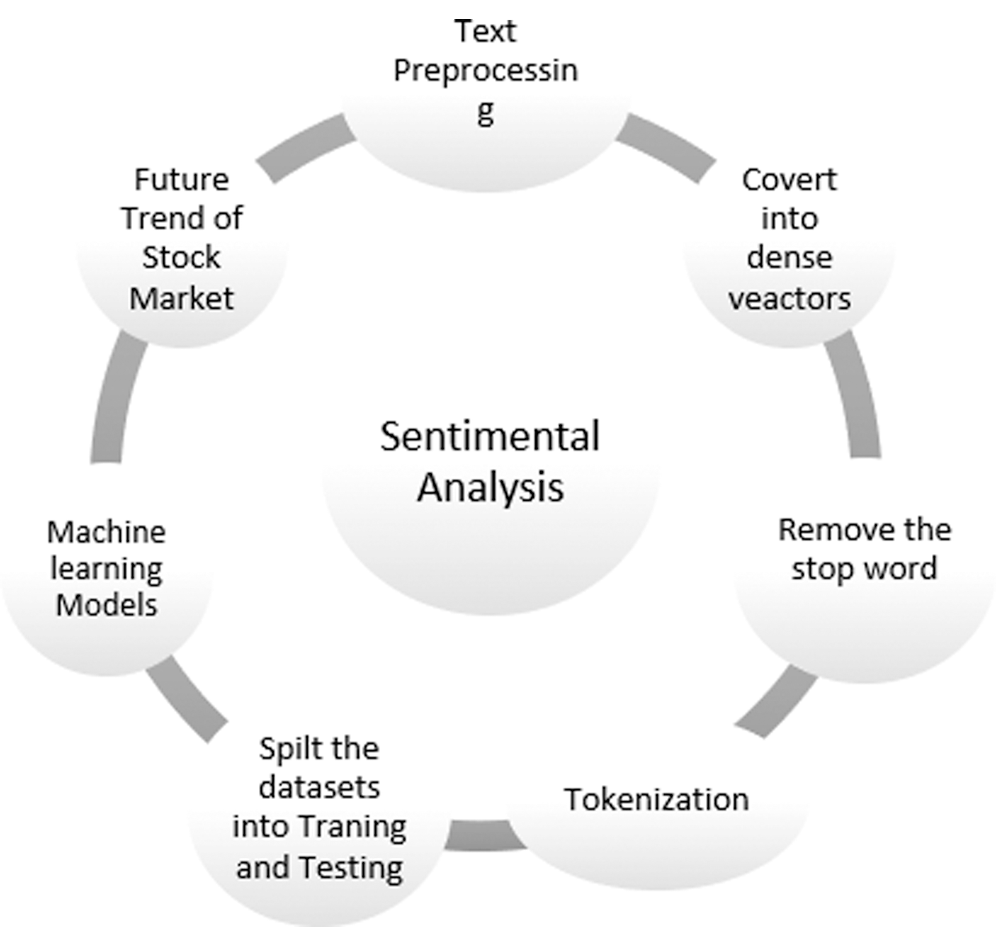
Figure 4: Model of social-media data for forecasting the market
We use Spark with Python to process datasets in Databricks. A dataset can be read in a Spark context. Datasets are converted to resilient distributed datasets (RDDs), a Spark structure by which data can be divided into clusters. We can then convert the RDD to a vector function. We construct data frames consisting of two-column labels and messages. Message columns may be news or social-media text relevant to the stock market.
Tokenization splits text into tokens to which classification models apply. We apply a function to a dataset after removing unnecessary words.
3.3.3 Removing Symbol Colons and Stop-words
We remove unnecessary colons and stop-words that can affect the model results. This can be done using the NLP toolkit, where each word can be compared from the dictionary, and word matches removed.
Term frequency (TF) and inverse document frequency (IDF) tools have been used in the analysis. It is a feature function that identifies the weight of a words and tells the relationship between them. After applying all the functions in the data frame, we can disunite the information frame into training and testing. We apply the machine learning library using Spark MLlib with Python. We next describe the machine model.
3.4 Machine Learning Techniques
3.4.1 Linear Regression Algorithms
LR is used to find the state between the independent and dependent labels, which help to forecast values. LR works on more than one independent label. We have employed multiple linear regression to examine the associations between the independent and dependent labels. Suppose that a and b are independent or dependent labels; the following is the regression equation:

A similar concept can be used in LR to find the exact value for Spark. The LR model depends on the supervised machine. It forecasts the value of the stock price. The model targets values based on self-directed or dependent changeable values. The LR model forecasts prices that depend on independent values. This model can be applied to different companies’ datasets to forecast the future values of stock prices. The result of Apple (AAPL) is presented in Fig. 5.
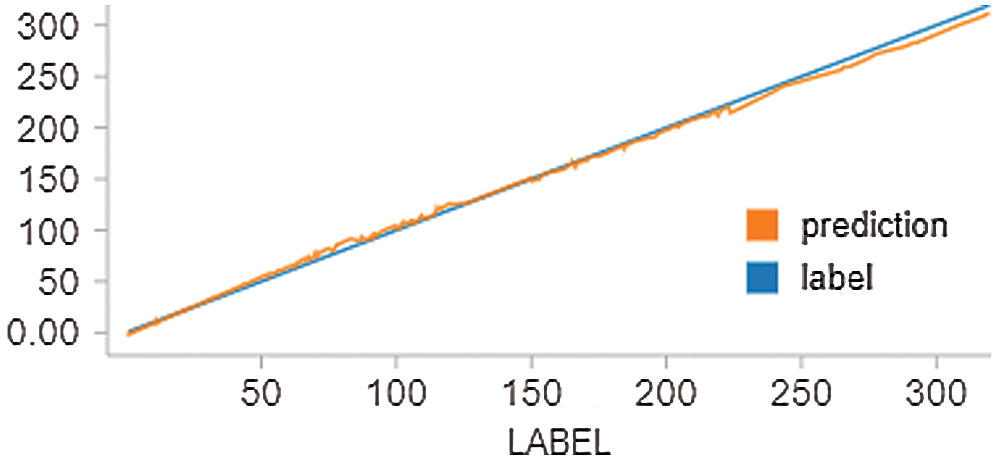
Figure 5: Forecasting results of AAPL stock
3.4.2 Decision Tree Algorithms
We have also used the decision tree (DT) model. This model depends on supervised machine learning algorithms. In this model, we have split the data into multiple classes and features in each dataset. The decision tree model is supervised, and it works on both regression and classification tasks. It cannot outperform the random forest. We use this model with Spark to make the data ready for analysis.
Fig. 6 shows the AAPL predicted results using this model.
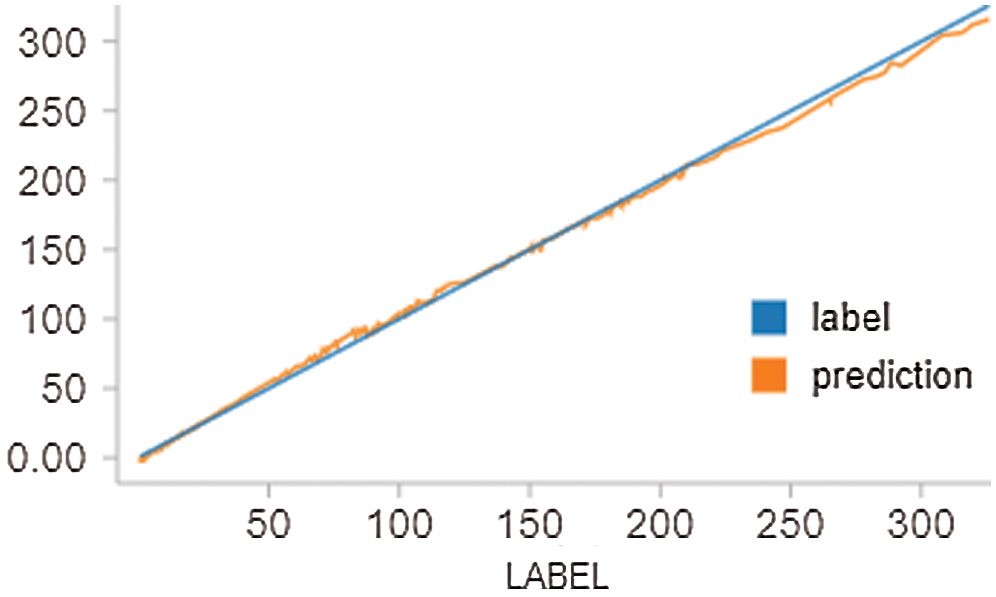
Figure 6: AAPL stock result
3.4.3 Generalized Linear Regression
Generalized linear regression (GLR) is more adaptable than other LR models. Unlike linear regression, this model does not require data to follow a normal distribution, The GLR model with Spark provides more accurate estimation compared to a linear regression model.

Eq. 4 shows the general formulation of the GLR model. In this article, we used this model with Spark to predict the movements of stock prices. We have applied this model to 10 different companies. The results produced by this model are more accurate than the results produced by the leaner regression model. The GLR results are presented in Fig. 7.
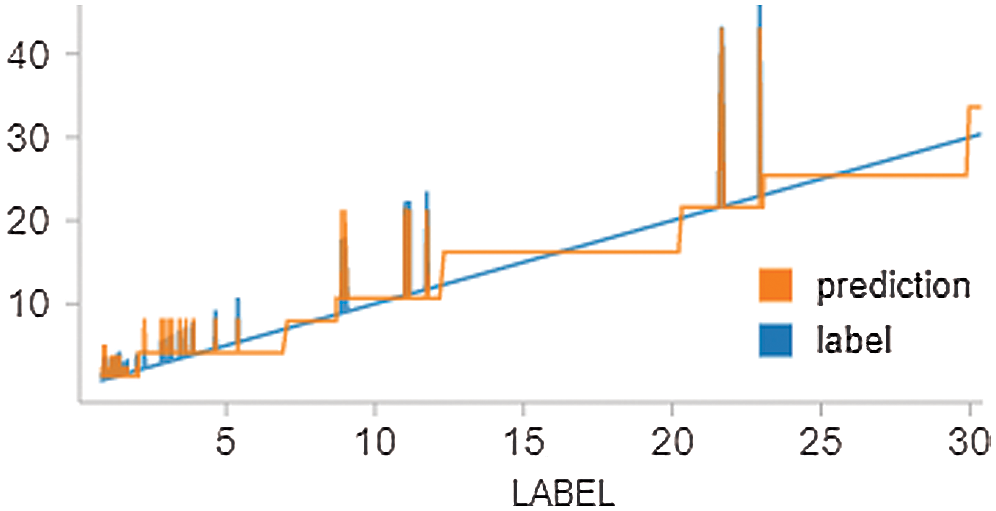
Figure 7: AAPL stock result
Random forest (RF) models consist of supervised machine algorithms. The RF model is similar to the decision tree model (DM). Nevertheless, it can measure multiple trees with the same datasets and calculate the value of the forecast of every single tree. Fig. 8 shows the estimated results of Apple (AAPL) stock using the RF model. The results of this model are more accurate in predicting the movements of the stock price than the results produced by the DT model.
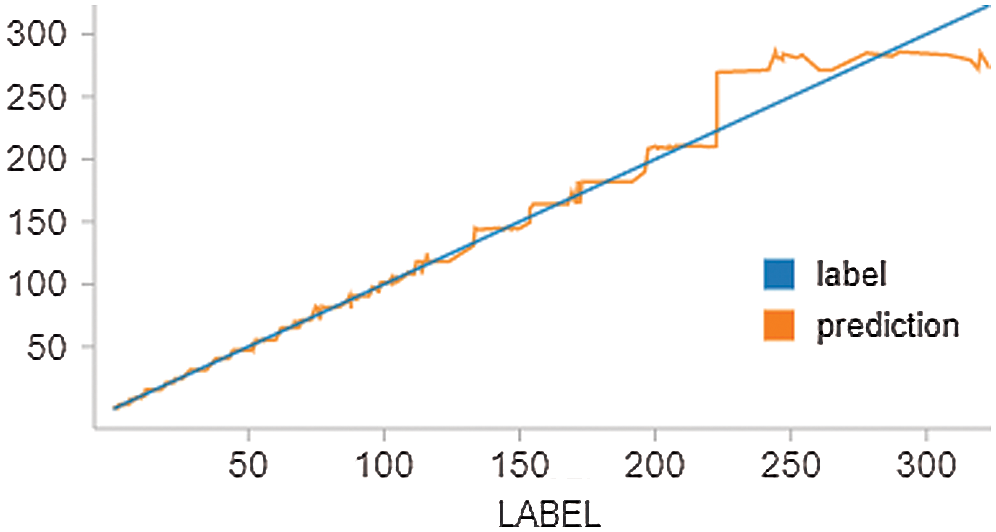
Figure 8: AAPL stock results
The Naive Bayes (NB) morpheme is a classification that uses the naive Bayes model. We apply this model to analyze text data collected from the Yahoo! Finance database to predict the movements of stock prices based on investors’ reviews. The results of the NB model are more accurate than the results of the logistic-R model. Fig. 9 presents the Apple (AAPL) results.
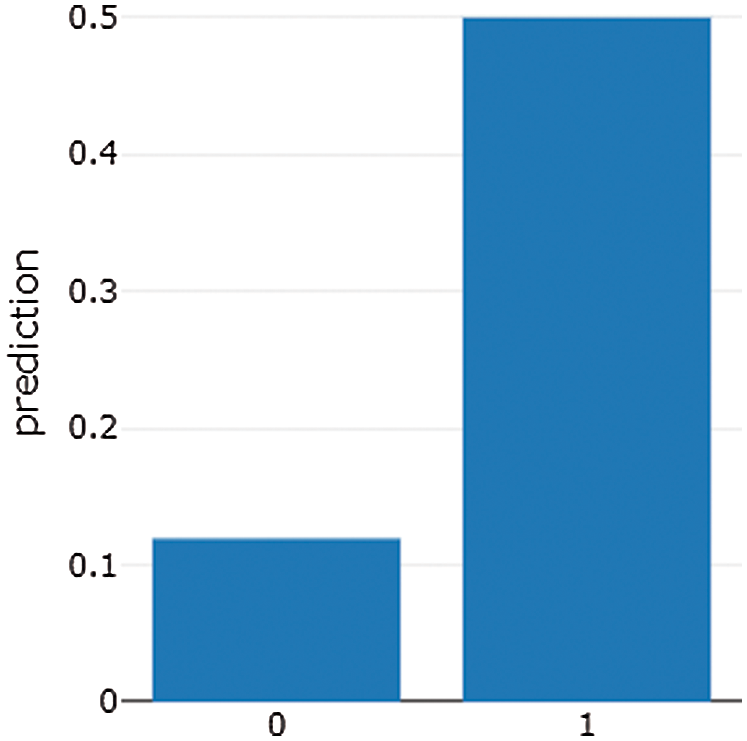
Figure 9: AAPL stock message panel result
Logistic regression is a model that works on a discrete set of values and text. It is a simple model that works with probability, and it is similar to the NB model, which is used for classification. We use this model to predict the stock market prices using Spark MLB. We apply text classification and tokenization before applying this model. The logistic model works better than other models in predicting the movements of stock prices. Fig. 10 presents the results of the logistic regression for Apple (AAPL) stock.
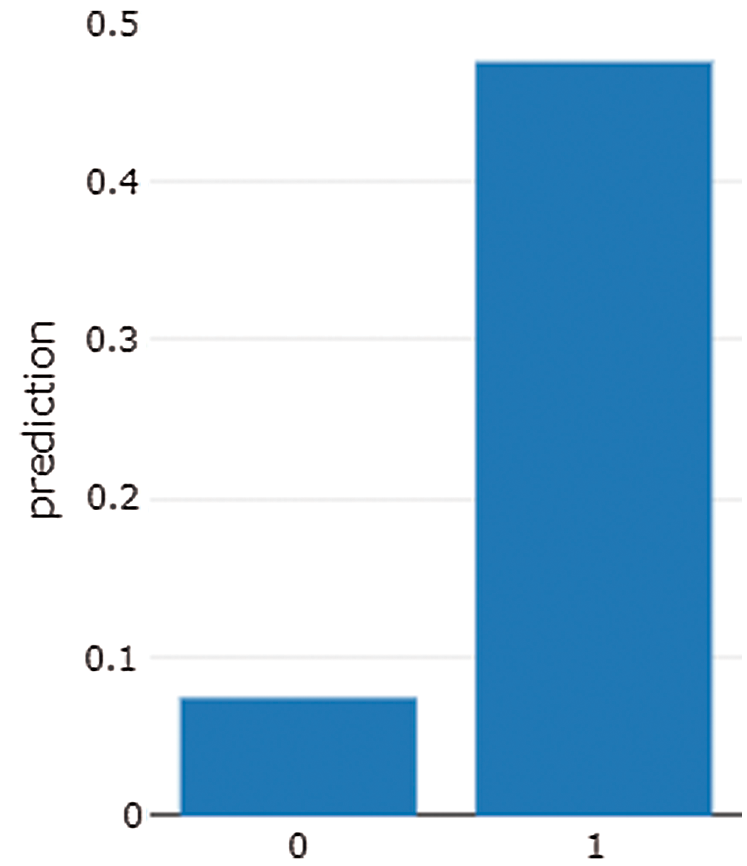
Figure 10: Graph shows the AAPL stock message panel result
4 Performance and Result Evaluation
In this section, we compare the results of all models and highlight the model that produced the most accurate results in predicting the future values of stock prices.
We have employed several models in predicting the future values of stock prices. Fig. 11 presents the results of all models (Linear Regression, Generalized Linear Regression, decision tree, and Random Forest).
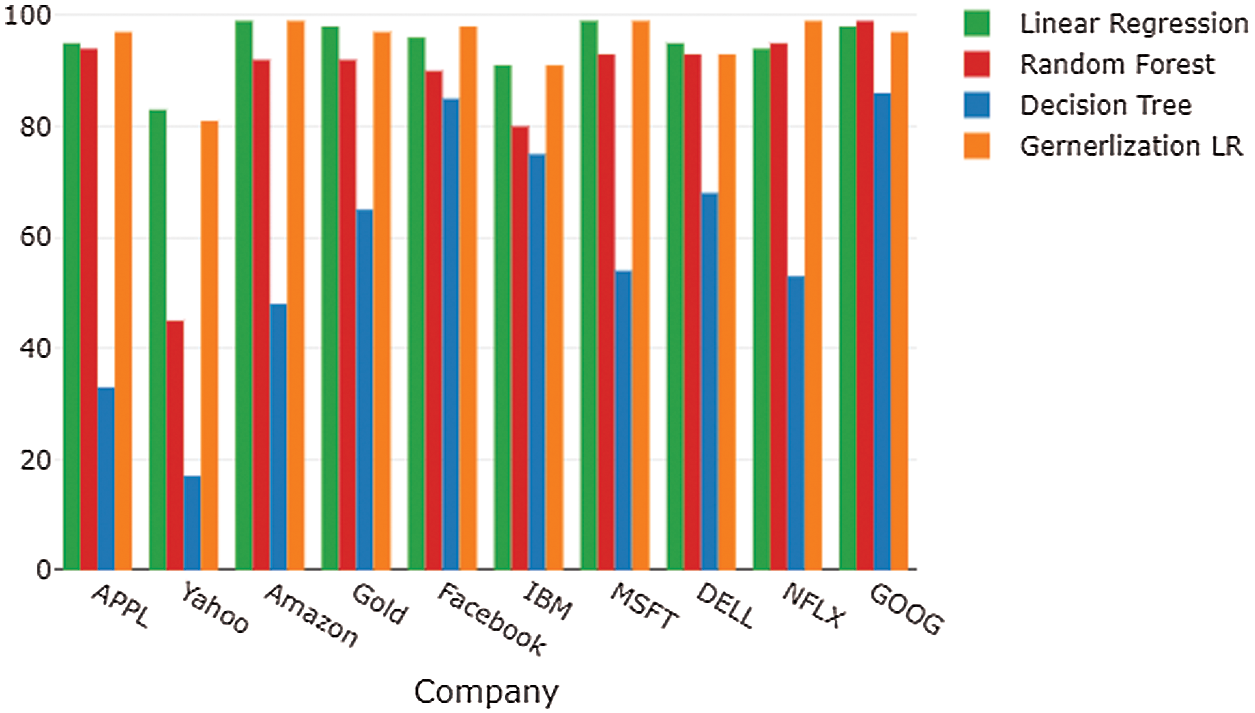
Figure 11: Historical Results of 10 Companies
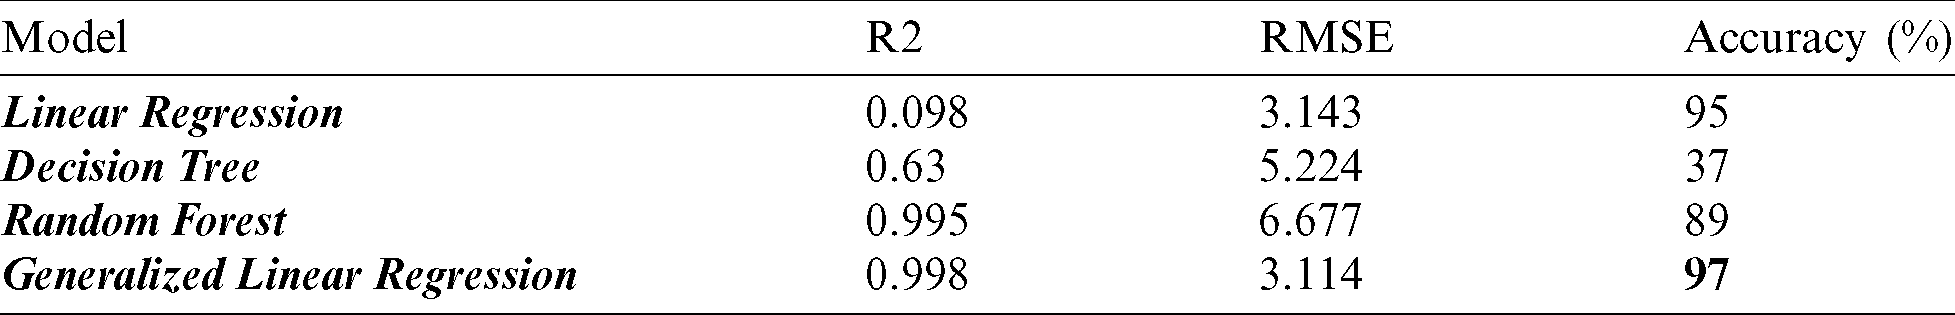
The above result shows which machine models are more accurate in predicting stock price movements. Their accuracy can be measured by R2 and root mean square error (RMSE), which help to identify the best model that predicts the movement of the stock prices. Tab. 3 presents the Apple (APPL) stock price movements using all of the models.
Table 3: Results of APPL stock market measure factors
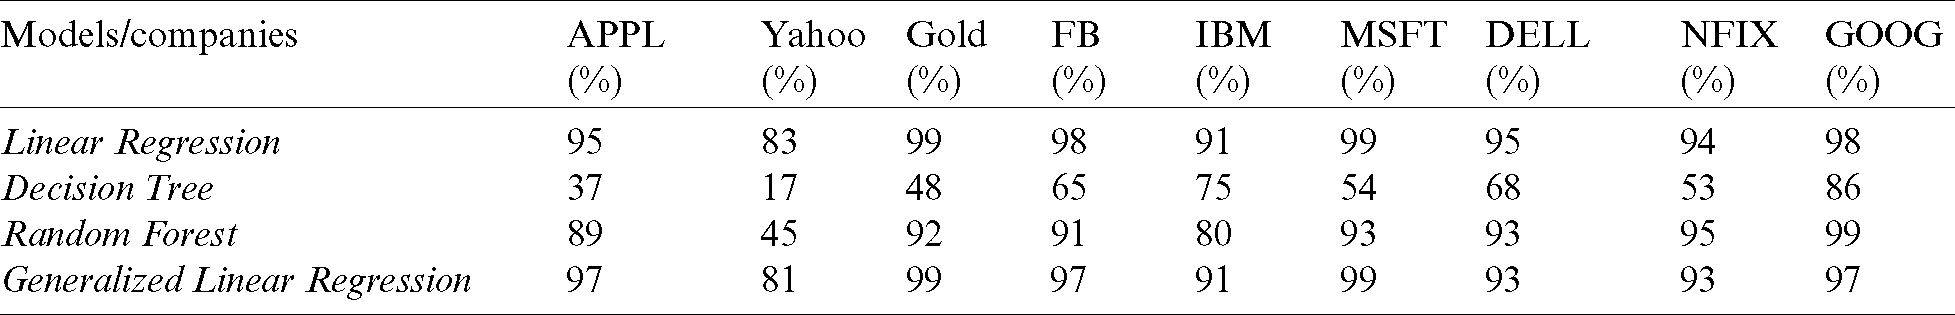
The results show that Spark MLlib models using big data produce more accurate results than the other models, and that LR and GLR are more accurate than other models. We apply these techniques to larger historical datasets, and we obtain better accuracy. Tab. 4 presents the results of all models that produce accurate results.
Table 4: Companies that produce accurate results
We define the results of the message/customer reviews in the APPL stock price. These datasets help investors to identify increases and decreases in stock prices.
We can apply the naive Bayes and logistic regression classifier models to news and messages to predict the movement of stock prices. Naive Bayes gives approximately 60%–70% accuracy, and so both models give close accuracy. Nevertheless, the logistics classifier model is better to predict the value of stock price movements, as it provides 60% to 80% accuracy.
Fig. 12 shows the results of the text classifier model (Naive Bayes and logistic regression), when applied to news and messages about APPL stock. Tab. 5 presents the results for the naïve Bayes and logistic models.
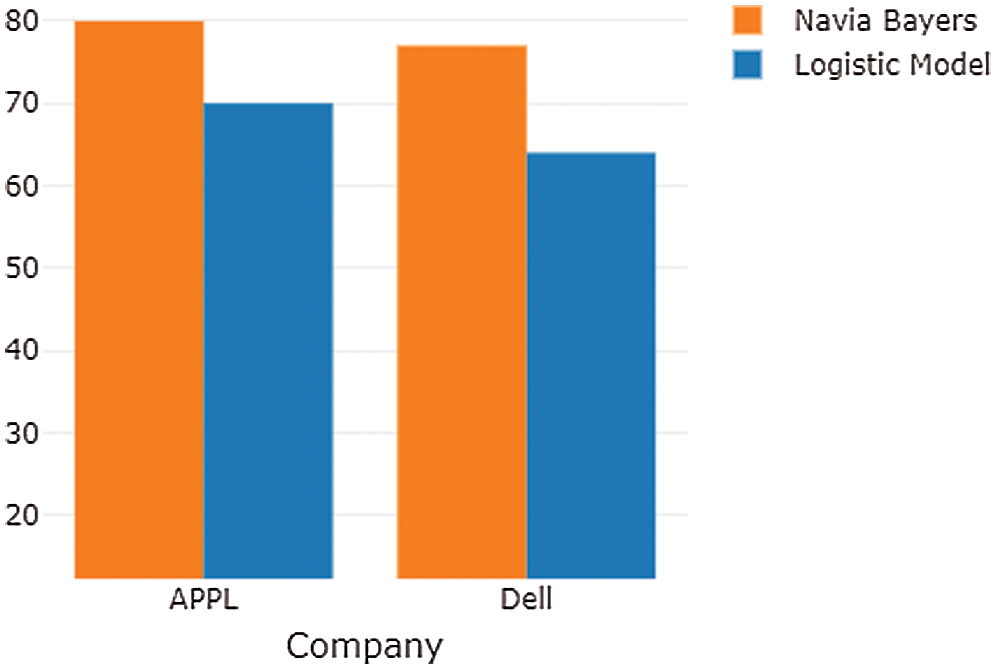
Figure 12: Sentiment analysis results of APPL
Table 5: Sentiment analysis model for Apple and Dell companies
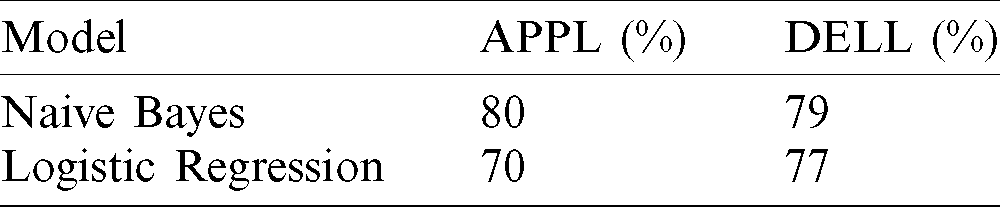
Tab. 4 presents the results of the NB and Logistical LR models when applied to different datasets. The data are collected from the message panel and analyzed using sentiment analysis. The NB model achieves better accuracy than the logistical model with Spark MLlib using the Databricks platform. By applying the above techniques, investors can build accurate predictions of stock price movements. The machine learning model is mostly used to predict stock price movements.
We employed several machine learning models to predict stock price movements through the Spark big data framework. We used Spark MLlib to predict stock price movements We applied Machine learning libraries on historical data for 10 companies The results indicate that linear regression, random forest, and generalized linear regression produced more accurate results than the decision tree model. Naive Bayes and logistics regression applied to the texture of data results show approximately 77% to 80% accuracy ratios. We suggest employing deep learning models through LSTM for future research.
Funding Statement: The researchers did not receive a specific grant from funding agencies in the public, commercial, or not-for-profit sectors.
Conflicts of Interest: The authors declare that they have no conflicts of interest to report regarding the present study.
1. M. M. Hasan, J. Popp and J. Oláh. (2020). “Current landscape and influence of big data on finance,” Journal of Big Data, vol. 7, pp. 1–17. [Google Scholar]
2. X. Liu. (2020). “Analyzing the impact of user-generated content on B2B Firms’ stock performance: Big data analysis with machine learning methods,” Industrial Marketing Management, vol. 86, pp. 30–39. [Google Scholar]
3. R. T. Whitman, B. G. Marsh, M. B. Park and G. E. Hoel. (2019). “Distributed spatial and spatio-temporal join on apache spark,” ACM Transactions on Spatial Algorithms and Systems, vol. 5, no. 1, pp. 1–28. [Google Scholar]
4. S. Coyne, P. Madiraju and J. Coelho. (2017). “Forecasting stock prices using social media analysis,” in 2017 IEEE 15th Int. Conf. on Dependable, Autonomic and Secure Computing, 15th Int. Conf. on Pervasive Intelligence and Computing, 3rd Int. Conf. on Big Data Intelligence and Computing and Cyber Science and Technology Congress (DASC/PiCom/DataCom/CyberSciTechOrlando, pp. 1031–1038. [Google Scholar]
5. J. Peiran, A. Veiga and A. Walther. (2020). “Social media, news media and the stock market,” Journal of Economic Behavior & Organization, vol. 176, pp. 63–90. [Google Scholar]
6. M. C. Angadi and A. P. Kulkarni. (2015). “Time series data analysis for stock market prediction using data mining techniques with R,” International Journal of Advance Research Computer Science, vol. 6, no. 6, pp. 104–108. [Google Scholar]
7. R. Batra and S. M. Daudpota. (2018). “Integrating stocktwits with sentiment analysis for better prediction of stock price movement,” in 2018 Int. Conf. on Computing, Mathematics and Engineering Technologies, Sukkur, Pakistan, pp. 1–5. [Google Scholar]
8. D. T.Selin and O. Tas. (2020). “Social media sentiment in international stock returns and trading activity,” Journal of Behavioral Finance, vol. 1, pp. 1–14. [Google Scholar]
9. S. A. Bogle and W. D. Potter. (2015). “SentAMaL–-a sentiment analysis machine learning stock predictive model,” in Proc. on the Int. Conf. on Artificial Intelligence, pp. 610. [Google Scholar]
10. D. P. Gandhmal and K. Kumar. (2019). “Systematic analysis and review of stock market prediction techniques,” Computer Science Reviews, vol. 34, pp. 100190. [Google Scholar]
11. K. Florian, F Manz and D. Schiereck. (2020). “The conditional stock market response to banks’ distressed asset sales on CDS availability,” Applied Economics, vol. 52, pp. 1–13. [Google Scholar]
12. W. Khan, M. A. Ghazanfar, M. A. Azam, A. Karami and H. K. Alyoubi, et al. (2020). , “Stock market prediction using machine learning classifiers and social media, news,” Journal of Ambient Intelligence and Humanized Computing, vol. 1, pp. 1–24. [Google Scholar]
13. S. Kalra and J. S. Prasad. (2019). “Efficacy of news sentiment for stock market prediction,” in 2019 Int. Conf. on Machine Learning, Big Data, Cloud and Parallel Computing, Faridabad, India, pp. 491–496. [Google Scholar]
14. V. S. Pagolu, K. N. Reddy, G. Panda and B. Majhi. (2016). “Sentiment analysis of Twitter data for predicting stock market movements,” in 2016 Int. Conf. on Signal Processing, Communication, Power and Embedded System, Paralakhemundi, pp. 1345–1350. [Google Scholar]
15. J. Kordonis, S. Symeonidis and A. Arampatzis. (2016). “Stock price forecasting via sentiment analysis on Twitter,” in Proc. of the 20th Pan-Hellenic Conf. on Informatics, Patras, pp. 1–6. [Google Scholar]
16. S. Jeon, B. Hong and V. Chang. (2018). “Pattern graph tracking-based stock price prediction using big data,” Future Generation Computer Systems, vol. 80, pp. 171–187. [Google Scholar]
17. Y. E. Cakra and B. D. Trisedya. (2015). “Stock price prediction using linear regression based on sentiment analysis,” in 2015 Int. Conf. on Advanced Computer Science and Information Systems, Depok, pp. 147–154. [Google Scholar]
18. D. K. Kirange and R. R. Deshmukh. (2016). “Sentiment analysis of news headlines for stock price prediction,” COMPUSOFT: An International Journal of Advanced Computer Technology, vol. 5, no. 3, pp. 2080–2084. [Google Scholar]
19. Z. Peng. (2019). “Stocks analysis and prediction using big data analytics,” in 2019 Int. Conf. on Intelligent Transportation, Big Data & Smart City, Changsha, pp. 309–312. [Google Scholar]
20. S. Preda, S. V. Oprea and A. Bâra. (2018). “PV forecasting using support vector machine learning in a big data analytics context,” Symmetry (Basel), vol. 10, no. 12, pp. 748. [Google Scholar]
21. P. Misra and S. Chaurasia. (2020). “Data-driven trend forecasting in stock market using machine learning techniques,” Journal of Information Technology Research, vol. 13, no. 1, pp. 130–149. [Google Scholar]
22. M. Rechenthin, W. N. Street and P. Srinivasan. (2013). “Stock chatter: Using stock sentiment to predict price direction,” Algorithmic Finance, vol. 2, no. 3–4, pp. 169–196. [Google Scholar]
23. M. M. Seif and E. M. R. Hamed. (2018). “Stock market real time recommender model using apache spark framework,” In Hassanien, A., Tolba, M., Elhoseny, M. and Mostafa, M. (Eds.) The International Conference on Advanced Machine Learning Technologies and Applications (AMLTA2018AMLTA, Advances in Intelligent Systems and Computing, vol. 723. Cham: Springer. [Google Scholar]
24. W. Wang, K. Y. Ho, W. M. R. Liu and K. T. Wang. (2013). “The relation between news and stock price jump: An analysis based on neural network,” in 20th International Congress on Modeling and Simulation, Adelaide, Australia, pp. 2506–2512. [Google Scholar]
25. R. Yang, L. Yu, Y. Zhao, Y. Yu, H. Xu et al. (2020). , “Big data analytics for financial market volatility forecast based on support vector machine,” International Journal of Information Management, vol. 50, pp. 452–462. [Google Scholar]
26. Yahoo. (2020). “No Title.” p. yahoo finance.com. [Online]. Available: http://finance.yahoo.com. [Google Scholar]
27. D. Search. (2020). “No title.” [Online]. Available: https://datasetsearch.research.google.com/. [Google Scholar]
 | This work is licensed under a Creative Commons Attribution 4.0 International License, which permits unrestricted use, distribution, and reproduction in any medium, provided the original work is properly cited. |