DOI:10.32604/cmc.2021.014225
| Computers, Materials & Continua DOI:10.32604/cmc.2021.014225 | |
| Article |
Epidemiologic Evolution Platform Using Integrated Modeling and Geographic Information System
1Faculty of Electronics, Telecommunications and Information Technology, Gheorghe Asachi Technical University from Iasi, Iasi, 700050, Romania
2Faculty of Electrical Engineering and Computer Sciences, Stefan cel Mare University of Suceava, Suceava, 720229, Romania
3School of Computer Science, Guangzhou University, Guangzhou, 510006, China
*Corresponding Author: Oana Geman. Email: oana.geman@usm.ro, geman@eed.usv.ro
Received: 07 September 2020; Accepted: 15 November 2020
Abstract: At the international level, a major effort is being made to optimize the flow of data and information for health systems management. The studies show that medical and economic efficiency is strongly influenced by the level of development and complexity of implementing an integrated system of epidemiological monitoring and modeling. The solution proposed and described in this paper is addressed to all public and private institutions involved in the fight against the COVID-19 pandemic, using recognized methods and standards in this field. The Green-Epidemio is a platform adaptable to the specific features of any public institution for disease management, based on open-source software, allowing the adaptation, customization, and further development of “open-source” applications, according to the specificities of the public institution, the changes in the economic and social environment and its legal framework. The platform has a mathematical model for the spread of COVID-19 infection depending on the location of the outbreaks so that the allocation of resources and the geographical limitation of certain areas can be parameterized according to the number and location of the real-time identified outbreaks. The social impact of the proposed solution is due to the planned applications of information flow management, which is a first step in improving significantly the response time and efficiency of people-operated response services. Moreover, institutional interoperability influences strategic societal factors.
Keywords: Epidemiology evolution; service-oriented architecture; pandemic; geographic information system; epidemiological modeling
COVID-19 Pandemic has a very serious impact on the health, economy by slowing it down. Paradoxically at the same time, it is accelerating conversion processes towards a 4.0 Economy and Industry. Society may not be prepared for a fast transition to a new digital economy, in which the most vulnerable sectors of the population can develop greater negative effects. COVID-19 cases are growing at an accelerated pace, infecting around 8 million people around the World (36,080,205 Coronavirus Cases, 1,055,238 Deaths, and 27,169,768 Recovered, according to the wordometers.info last updated on October 7th, 2020 [1]). With this staggering number of victims, the pandemic is now being compared to a war. We do not yet have an effective vaccine or proven treatment, and the development of a vaccine may take a year or longer. The world is currently left with non-pharmaceutical interventions to slow and mitigate the transmission of the virus, including bans on public events, school and university closures, and even local and national lockdowns.
The pandemic demands a human security approach of comprehensive, across-the-board human protection and empowerment. In responding, a medical solution alone is not enough. Measures should also address knock-on effects in health, economics, politics, society, and culture. The most important immediate priority is to develop a vaccine, diagnostic tools prediction, and epidemiological solution for modeling and treatments for COVID-19. To avoid duplicated efforts, we will need to share best practices and clinical test results to develop an effective medical intervention and epidemiologic model to halt the pandemic. The important immediate priority is also to understand behavioral, social and, economic impacts of the outbreak response.
In the COVID-19 pandemic context (on 07.10.2020, two records were recorded for Romania: 2.958 new infected cases and record cases in tests, according to the graphs.ro [2]) and its multiple consequences (necessity to ensure the health of the population, economic, geostrategic impact, etc.), the design, analysis, and implementation of an integrated platform for epidemiological monitoring to limit the effects of the pandemic is a national priority for the health system and any organizations with which it interacts (Fig. 1).
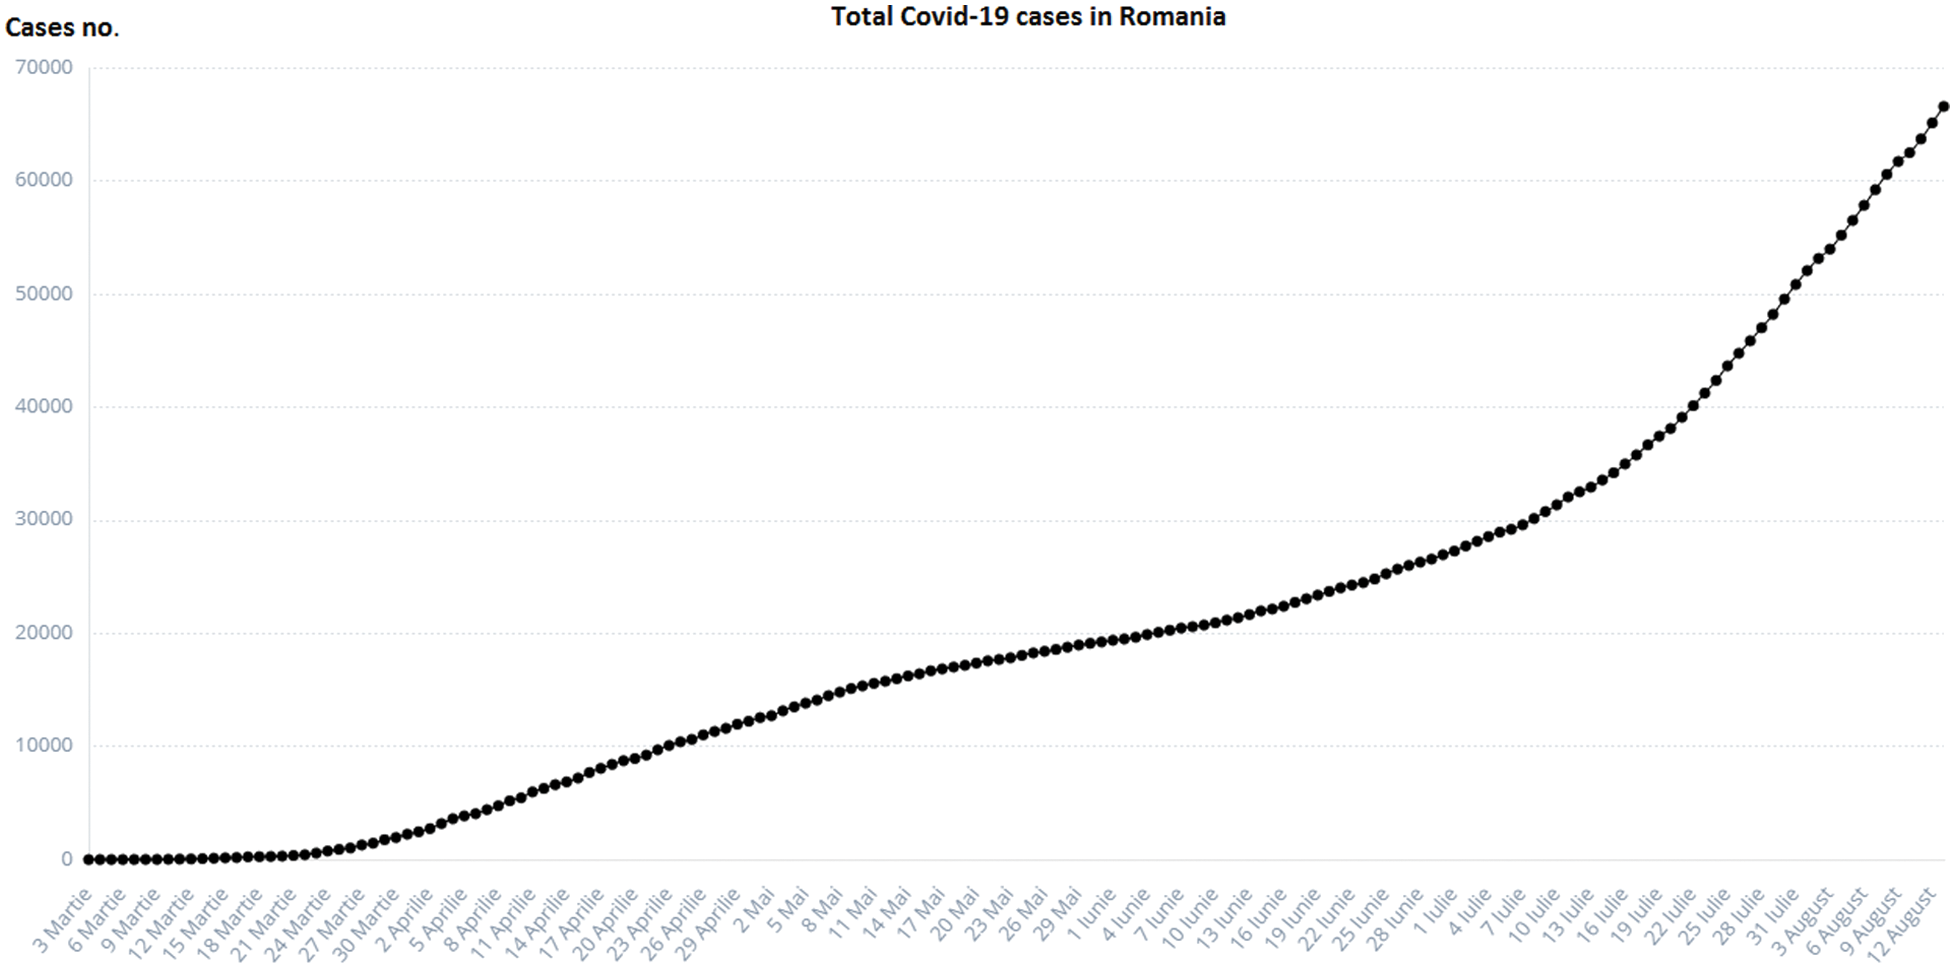
Figure 1: Total COVID-19 cases in Romania [2]
The solution proposed by us is in line with Commission Recommendation EU 2020/518 from April 2020, on a common set of tools for the use of technology and data to combat and emerge from the COVID-19 pandemic, in particular as regards mobile applications and the use of anonymized mobility data.
The social and economic impact of this pandemic (including the health system) will also be considered by imposing stringent measures. These are in the form of 18 proposed items: Oxford COVID-19 Government Response Tracker (https://covidtracker.bsg.ox.ac.uk/) [2,3], to minimize the social-economic impact of this pandemic. The stringency index is a score (from 0 to 100) created from the follow-up of 17 different indicators of government responses to the coronavirus pandemic. This includes 8 social indicators (C1–C8) such as travel restrictions and closing educational establishments; 4 indicators on economic policies (E1–E4) such as state support for citizens or external loans; public health policy indicators such as the COVID-19 test and emergency investment in health (Figs. 2 and 3).
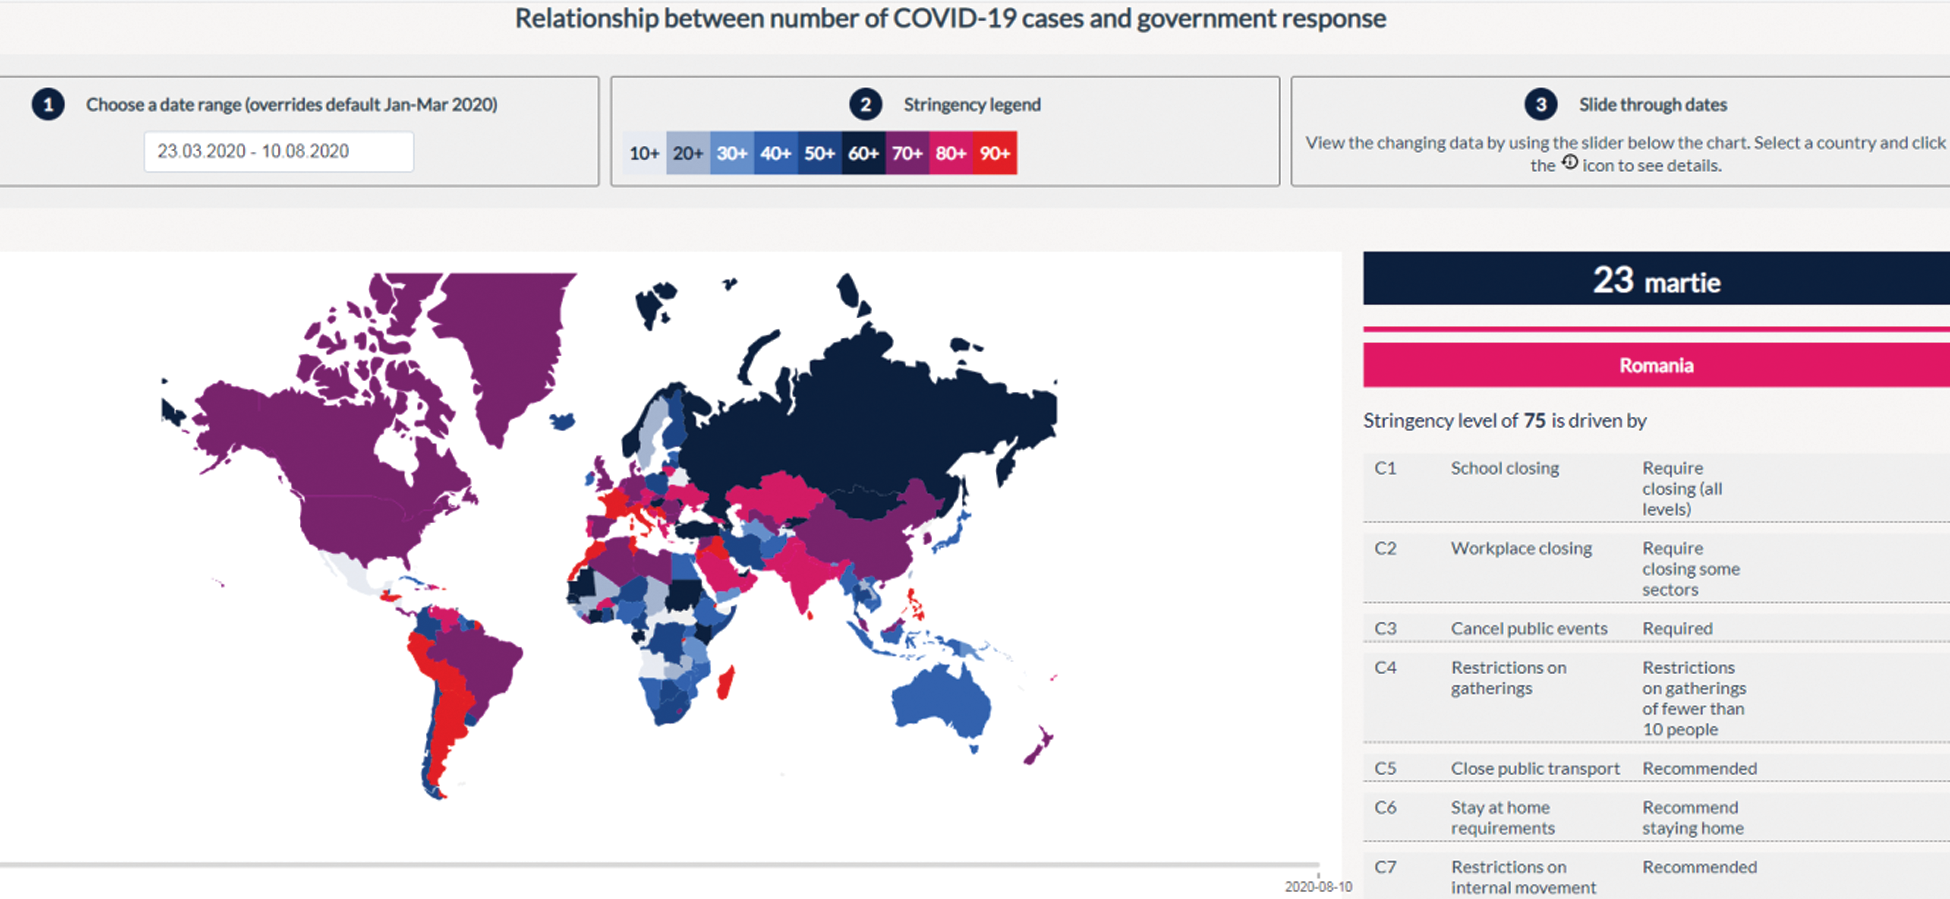
Figure 2: Relationship between the number of COVID-19 cases and government response in Romania [3]
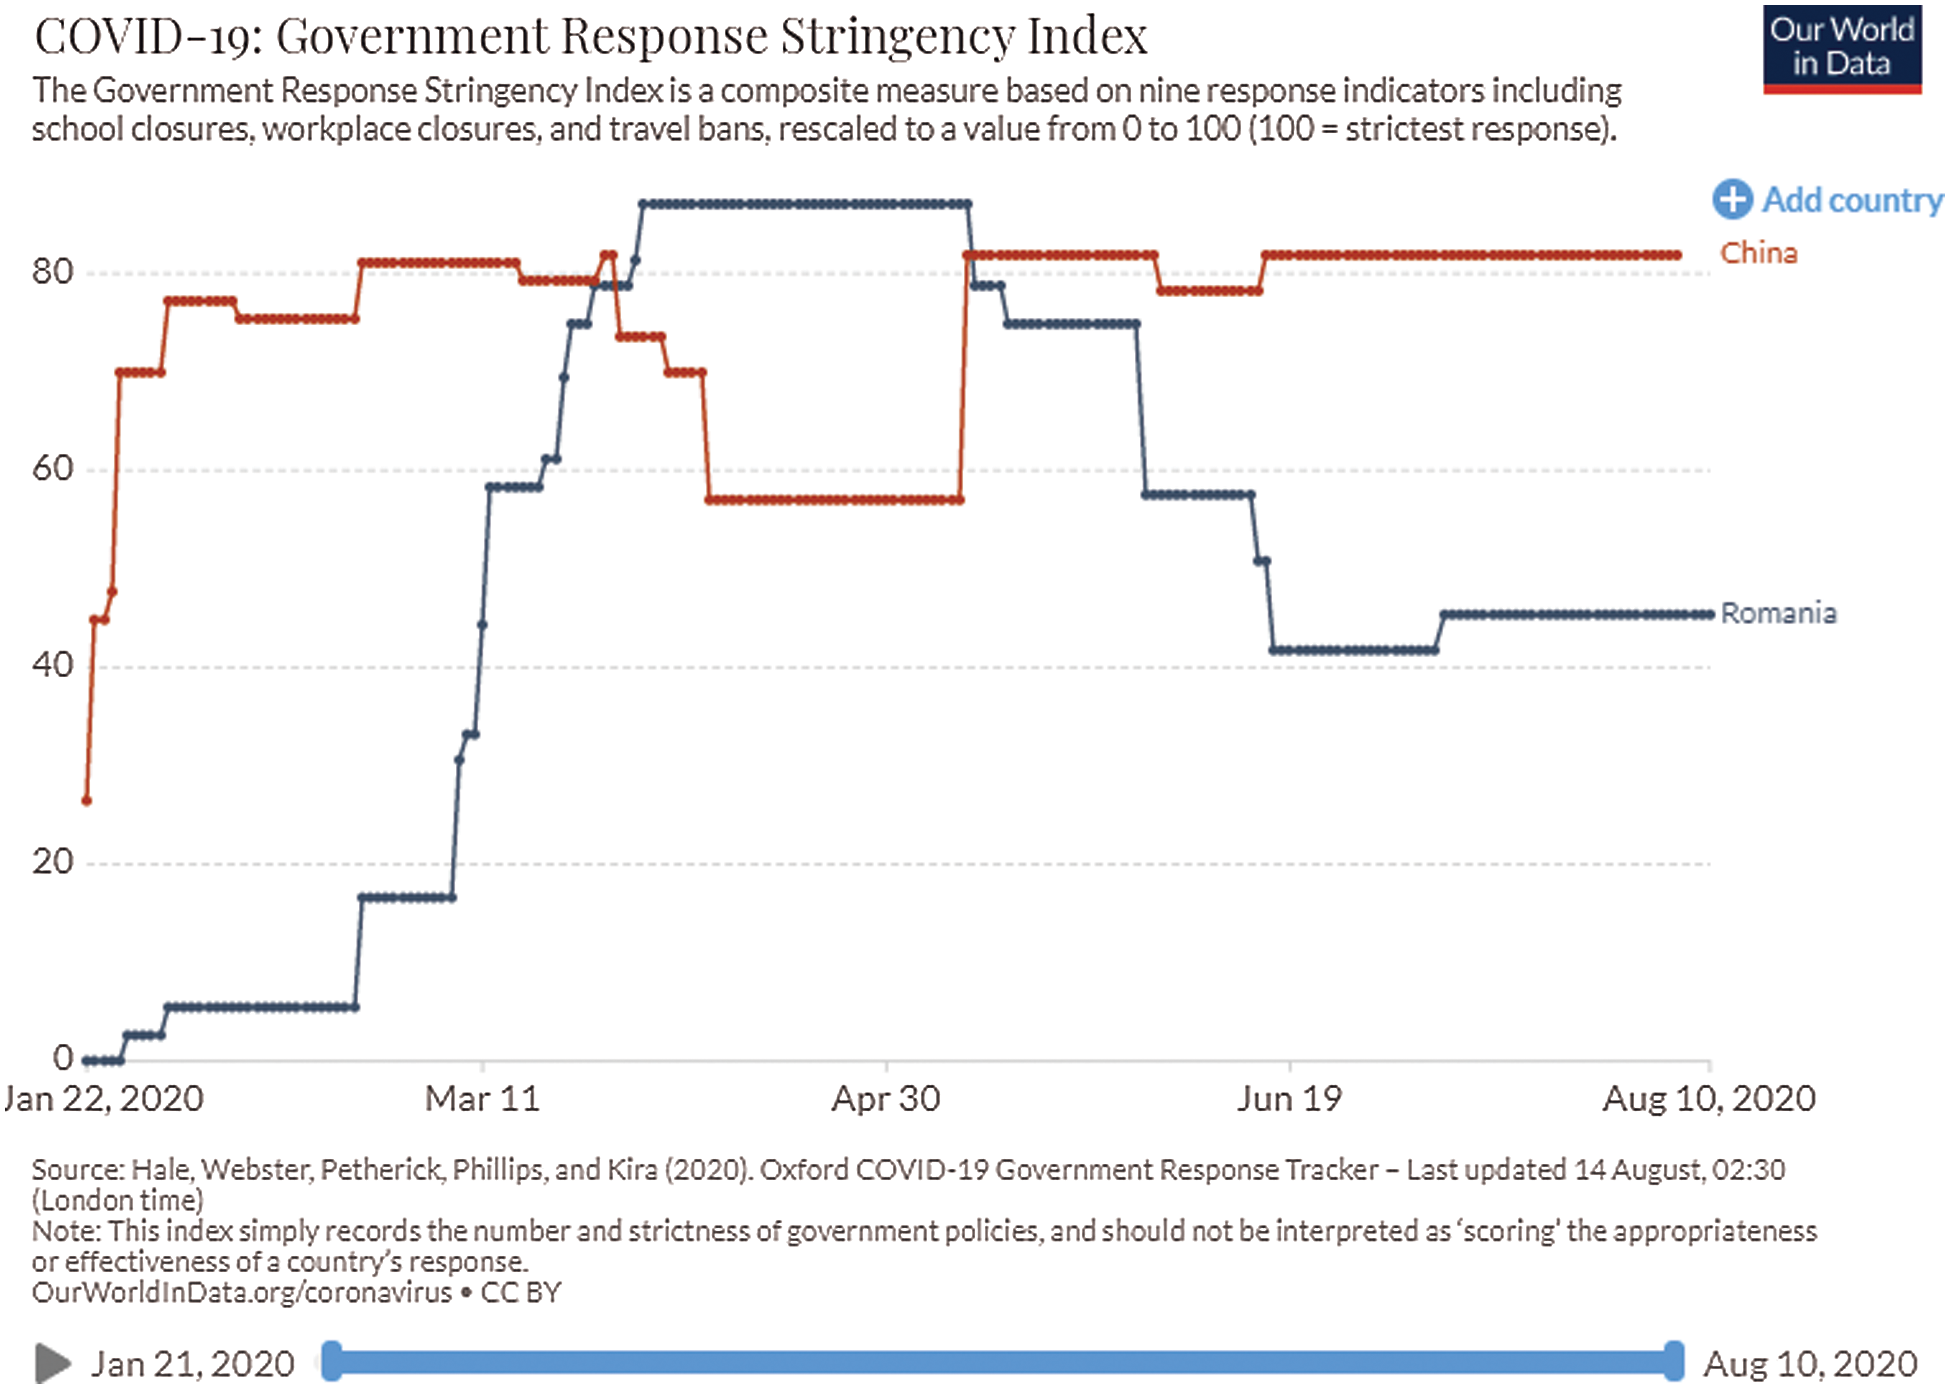
Figure 3: Relationship between the number of COVID-19 cases and government response in China and Romania [3]
The purpose of epidemiology consists of obtaining, interpreting, and processing the information regarding pandemic spreads to promote better health and reduce the impact of the disease. The quantitative study of epidemiology refers to “how much of a health problem is a disease or an occurrence.” The epidemiology distribution refers to the distribution study of health problems in the population depending on location, time, and personal characteristics [4].
The Green-Epidemio platform is based on:
• Rapid reinforcement procedures for collecting information, determining when an event constitutes a risk to the public health and international aid request from WHO (World Health Organization).
• Improving the response time if pathogens are detected in the target area, due to modern methods of acquisition, processing, and transmission of data and information.
• Improving the accuracy of both forecasts on the evolution of infectious diseases, and on the spread times of pathogens.
• Creating a unique collection of directives to help prevent the spread of disease or at least contain it to a smaller area [5–12].
This study is organized as follows: Section 2 contains the methodology, with overview on implementation of the Green-Epidemio platform, in Section 3 is presented the mathematical model for the Green-Epidemio information platform, in Section 4 application and results are detailed, and we concluded with future work and conclusions.
The Green-Epidemio is a platform adaptable to the specific features of any public institution for disease management, based on open-source software, allowing the adaptation, customization, and further development of “open-source” applications, according to the specificities of the public institution, the changes in the economic and social environment and its legal framework. The platform has a mathematical model for the spread of COVID-19 infection depending on the location of the outbreaks so that the allocation of resources and the geographical limitation of certain areas can be parameterized according to the number and location of the real-time identified outbreaks. The social impact of the proposed solution is due to the planned applications of information flow management, which is a first step in improving significantly the response time and efficiency of people-operated response services. Moreover, institutional interoperability influences strategic societal factors. The epidemiological model is defined by the following parameters: The initial outbreak of infection; the number of individuals in the infected population; the rate of contact transport transmission; recovery rate; incubation rate; population mortality and birth rate; immunity rate; countermeasures.
The geographical regions is described by properties such as: area, population number and density, the geographical relationship between regions, transport routes, and existing traffic. The geographic approach allows viewing, query, analysis, and understanding of data. The user will be able to view relationships, models and trends, reports, and graphs. The impact of the efficiency of the healthcare system consists of reducing the time between data acquisition, processing, and medical decision-making in public health care and better communication between the institutions involved, but also between doctors, helping to provide training and professional education in healthcare.
The impact on the reduction of the COVID-19 pandemic in the community consists of:
• Prevention of illness—Analysis of collected patient/health risk data makes a decisive contribution to reducing the incidence of illness;
• The possibility of monitoring isolated patients at home.
• Gathering anonymized information to support rapidly epidemic areas, determining the possibility of an event becoming a potential public health risk, sending warning messages;
• Improving the response time to the emergence of pathogens in a target area through modern means of purchasing, processing, and transmitting anonymized data on mass mobility;
• Improving the veracity of prediction of the evolution of infectious diseases (COVID-19, but not only), the time of the spread of pathogens and creating a centralized collection of data to help prevent the spread of the disease or at least limit the spread to a limited area.
3 Description of the Green-Epidemio Information Platform
The epidemiological modeling software simulates how preconfigured pathogens are spreading. The application allows the definition of new models for the transmission of epidemics to be used in the simulations. The pathogens preconfigured within the application are pathogens of epidemiological significance for cross-border areas and of a high risk of transmissions such as Hepatitis B, and pathogens involved in natural evolution or through bioterrorism in the production of epidemics or agents with pandemic potential such as viruses with pandemic potential (H5N1, H1N1, SARS-CoV-2).
The Green-Epidemio application can be installed within any Java Enterprise application. The web server used is Apache Tomcat 6.0 and the database used is MySQL. Based on an existing epidemiological model or a user-entered model, the Green-Epidemio application simulates its evolution overtime on a mathematical differential model. This model is defined by the following parameters: Initial outbreak of infection; the number of individuals in the infected population; contact transport transmission rates; recovery rate; incubation rate; mortality and birth rate of the population; immunity rate; vaccines and countermeasures.
During the monitoring of the epidemic evolution, these parameters are linked to the population, the geographic region affected by the epidemic, as well as to the existing transport routes and the traffic on them. The user can track the evolution of the epidemic over time and obtain the necessary information describing the current state of the epidemic at any time. Our platform identifies health hazards and the needs of the affected population to plan interventions and to protect and prevent an uncontrolled evolution of infectious diseases.
In Green-Epidemio platform we study the causes, conditions, and mechanisms of pandemic occurrence among the human population and to develop and implement measures to prevent and combat this situation (i); to develop a joint cross-border infrastructure able to monitor, detect and model the epidemiological risks (ii); to identify and monitor the impact of certain risk factors (e.g., travel by air) (iii); to increase the response/intervention response in emergencies (iv); to analyze using automated systems for the identification of the contaminant and thereby improve the intervention time with approx. 70% (v); to reduce the time spent collecting and processing the data thus reducing the time for collecting and processing the data with approx. 80% (vi).
For modeling the spread of pathogens within a population, it should be divided into categories representative of the intended purpose. Categories will be determined according to the characteristics of the pathogen for which it is intended to simulate the spread within the geographical region.
The following aims are pursued in the design process: functional decoupling through SOA architecture, standardization of the interaction between components, standardization of modeling principles, creation of a layer of reusable infrastructure services at the organization level, creation of a single centralized identity service and compliance premises with GDPR requests for personal data processing, expandability of the platform by creating connectors, and secure the system at all levels.
The functional blocks of the platform are structured as follows:
• Block I—Identity and access rights management ensures the uniform administration of user accounts, authorization rules.
• Block II—External portal allows for on-line completion and verification of epidemiological questionnaires.
• Block III—Maps (GIS) allows visualization of geospatial data at the map level, with the ability to select thematic layers and generate geospatial, polygonal boundaries.
• Block IV—Data sources and model configuration allows the definition of the data sources used to model and simulate epidemiological evolution. It will be allowed to schedule reports running periodically and send them to configured recipients via email.
• Block V—Mobile application in which persons who will have to comply with quarantine rules will be able to be monitored from the point of view of their mobile phone location (application developed in ReactNative, compatible with IOS and Android systems).
• Block VI—Urban congestion identification responsible for data acquisition at cell ID and cell ID advanced level, by defined sectors; If there is more than the recommended number of people, a information messages will be sent. The information on persons is provided anonymously and contains details of presence, duration of stay, travel direction.
• Block VII—Platform availability monitoring provides technical status and platform availability assessment functions via a graphical interface, which allows individual tracking of each platform component or at the group component level.
All system modules can run on Linux operating systems. All libraries used to build the platform are available with open-source licenses.
The SIR mathematical model involves dividing the population into three categories, depending on their relationship to the pathological agent. Categories identified for this model are:
• S—Individuals in the population who are susceptible to infection;
• I—Individuals in the population who are infected;
• R—Individuals recovered.
In the epidemic, the number of susceptible individuals decreases rapidly as a large part of them are infected and thus move into the infected or recovered state. Each member of the population changes from the susceptible state to infection and then recuperates. The transition between states shall be made taking into account the parameters of the state concerned. Depending on the rate of contact, individuals move from susceptible to infected state. The contact rate is the probability that a susceptible individual is infected when contacted by an infected individual. The transition from infected to recovered state shall be performed according to the recovery rate, representing the time from when the individual was infected to healing.
Over time, it has been observed that during a pandemic, very few people are infected or suffer from the disease in the first weeks. It will be attempted to create a model for infection prediction so that, at some point, we know the number of infections, the number of deaths, and the number of possible infections. The population can thus be divided into three groups: The number of infected people (I), the number of people recovered (R) and the number of people likely to be infected (S). In Fig. 4 is presented the SIR model, where  is the contact rate,
  is the death rate,
  is the rate of recovery, and
  is the rate of loss of immunity. The SIR model is dynamic in three directions, each variable (S, I, and R) varies over time. Between S and I, the transmission rate is
  I, where
  represents the contact rate, i.e., the possibility of an individual likely to come into contact with an infected individual and become infected. Between I and R we have recovery rate
  . If the duration of infection is D then
  D, i.e., an individual is recovered in D units of time [13].
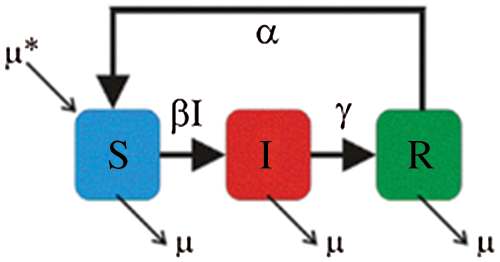
Figure 4: SIR model
The differential equations describing this model were first derived from Kermack et al. [14]. The dynamic SIR model is obtained by making the following assumptions:
• The dynamic system evolves in continuous time and S, I, and R functions are time functions S(t), I(t), R(t) and are distinguishable from any order (infinitely differentiable) over the time interval [0,  );
);
•  is the parameter controlling the transfer between S and I, meaning that it represents the average number of contacts sufficient for infection per unit time;
•  is the transfer rate between I and R, which includes both the healing rate and the death rate, without distinguishing between these two, meaning that 1/
 is the time interval an individual remains infected.
Assuming that the number of individuals remains constant shows that  at any time t. We use the notations for the derivative of a function g both in Leibniz dg/dt form and in Newton form g′. From the model’s prepositions and the definitions of the parameters
  and
and  result the order one system of differential equations:


The normalization of the three functions S, I and R defined as follows is considered as

where N is the total number of individuals, and the relationship between these normalized functions meets the condition  , at any time t.
The equations for the new differential system are:


The SIR differential system is usually set by the initial data  ,
,  ,
,  , which describes the system at the start-up time, in which case we are talking about a problem with initial values (PVI). The three equations are not independent, e.g., the third is obtained from the first two, taking into account that from the condition
 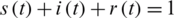 is obtained
  .
.
In [13], an SEIR (Susceptible-Exposed-Infected-Removed) model is presented and this methodology can be applied to other dynamic systems. The model is presented below: S shows susceptible individuals, E is for infected individuals but not infectious, I is for infectious and R for removed individuals (not calculated). We assume that time is measured in days, noted t, and we define the number of fault cases at the time t as dIt. We will use the t index to record time, where time notation should be reserved as the upper limit of an amount. The endpoint of a time series will be noted with T.
For most of our models presented in this paper, we assume that there is an initial number of cases at that time t = 0, noted I0. We will also define the number of cases recently recovered at the time t, dRt, and the total number of cases recovered at the time t, Rt. The population susceptible at the time t is similarly written, St and the total population is Nt = St + It + Rt.
In the SEIR model, we also introduce the number of people infected by asymptomatic persons (“exposed”) as Et The disease is assumed to have a generation-time, noted with w, which is the time between the infection in a primary case and the first infection in a secondary case. If it is assumed to vary at each time point, noted wt and where it is assumed to be a time function is written w(t). In this case, time may be written as an index to allow time differences or time intervals to be calculated, such that, for example, a constant generation time multiplied by a time period between two arbitrary time points may be written as  .
.
For the SEIR models there are several key parameters, defined as follows:
•  , infection force;
• k, the rate at which exposed persons (asymptomatic) become symptomatic;
•  , the rate at which infected persons recover;
•  , the death rate due to illness.
The initial reproduction number is also noted as R0 and can change based on time t, noted Rt, and also as a continuous function, it is written R(t). If used in an arbitrary amount (e.g., when summing the results of the different models at the time i) it is written as Ri.
The SEIR mathematical model (epidemic model with time-dependent coefficients) is presented in detail in [13].


The new infections occur at a rate  , which implies that susceptible individuals make effective contacts with a rate
  (effective contact rate) and only a fraction of these contacts are made with infectious individuals. The average time from E and I is given by k −1 and y −1, respectively. The initial reproduction number, R0, is the number of secondary infections from an initially infected individual in a fully susceptible population. A relative quantity is the actual reproduction number, Rt, that refers to the number of secondary cases derived to an infected individual at time t. The Rt is a context-dependent quantity of interest for decision factors, as it indicates the possibility of an increase in the epidemic (Rt > 1) or decreases (Rt < 1).
The platform architecture, presented in this paper, is structured on three levels (Fig. 5):
• DMZ level provides a direct user interface and is the loading level for a balanced distribution of user requests to viable application servers, infrastructure services, and moving traffic to the viable node in degraded situations. Two software-based loading levels are provided, configured in IP failover mode to which traffic will be forwarded from the firewall, one being used as the primary, the other being the backup. (Innovation elements including NGINX, SSL).
• APPLICATION level hosts application server clusters, i.e., infrastructure services, the server for monitoring platform availability. Clusters are presented in a two-node variant but can be extended depending on the presumed load level (innovation elements including WSO2 Application Server, OpenLDAP, WSO2 Enterprise Integrator).
• DATABASE level will be provided by PostgreSQL/Mongo DB that will run in a cluster environment (elements of innovation including PostgreSQL, HAProxy).
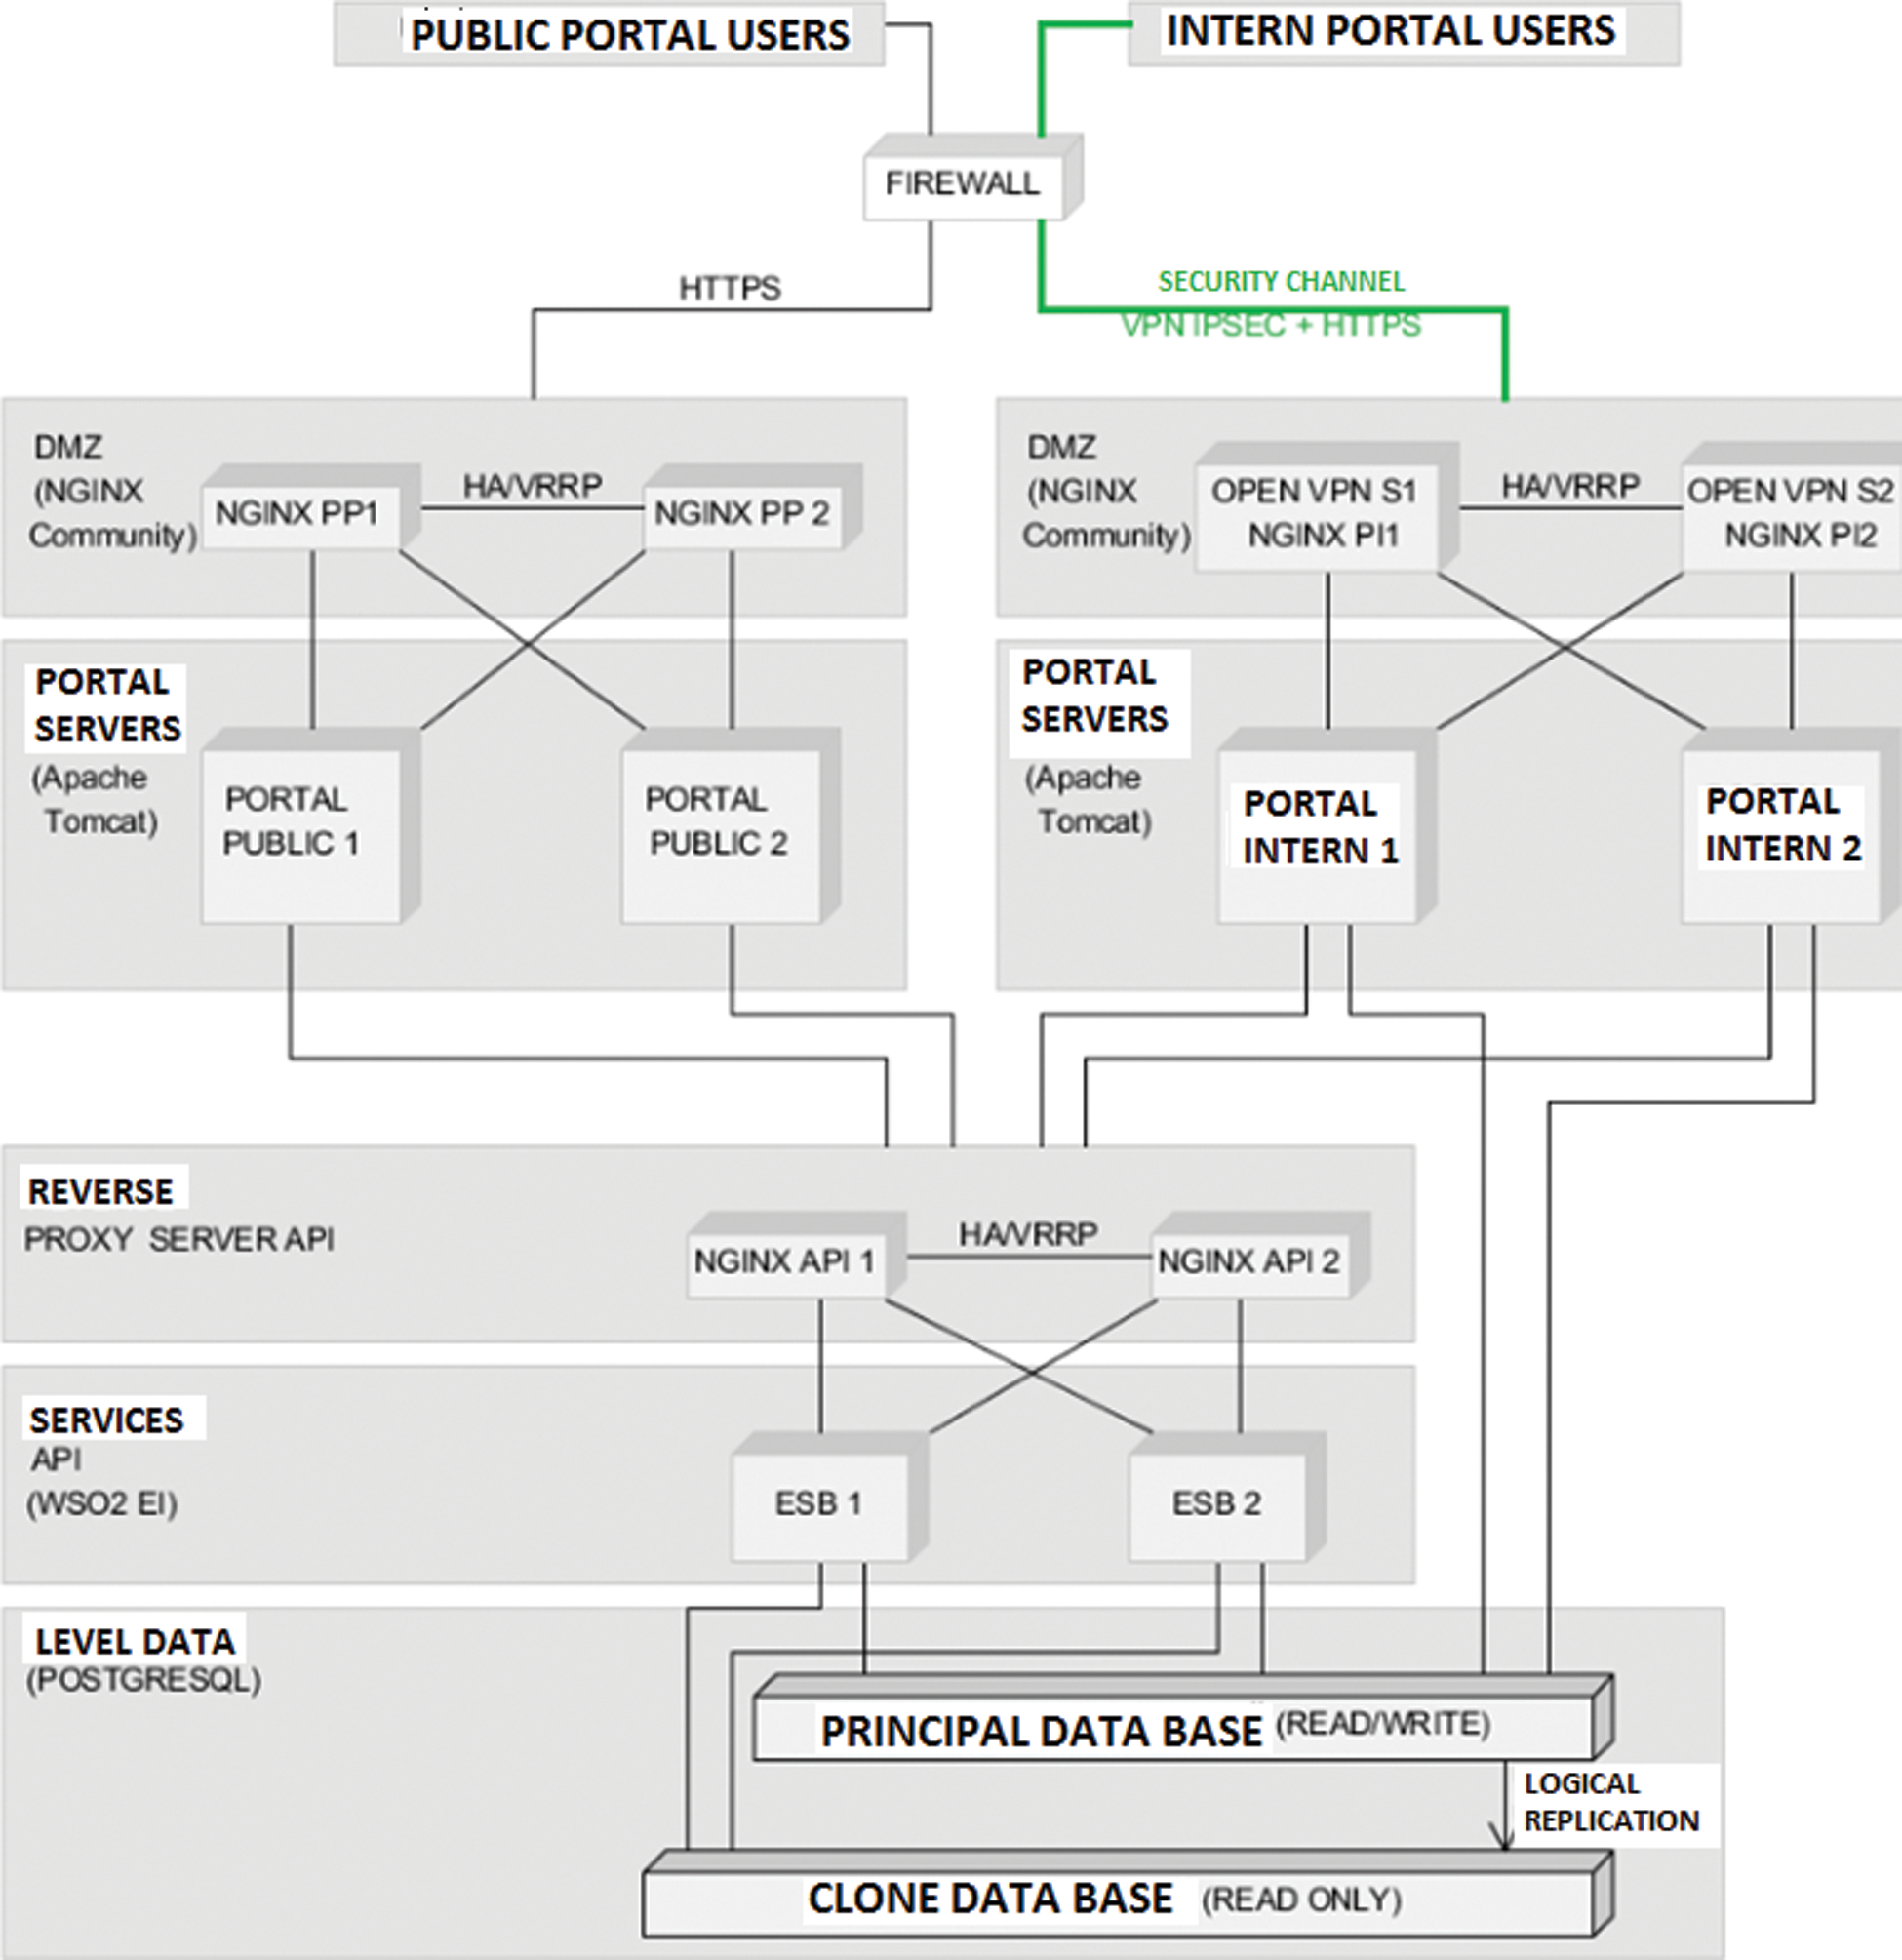
Figure 5: Platform architecture
The software tools used to build the platform include Tomcat apache; WSO2 identity Server with the role of identity management and unified authorization at the platform level; OPEN LDAP used for platform storage; WSO2 Enterprise Integrator; NGINX with the role of loading balancer for application servers and infrastructure services; Postgres, MongoDB for a relational database; HAProxy, cluster connection manager database; Patroni, management database configuration to promote a slave node of the cluster into the master node in case of master failure; ZABBIX, technical monitoring, and availability of the platform.
For some pathogens, there is a time during which individuals have contacted the virus but are not infected. They are considered to be in the “exposed” state. The categories identified for this model are S—individuals who are susceptible to be infected; E—individuals who were exposed but not infected; I—the infected individuals; R—the recovered individuals.
The following mathematical models have been considered in the application for integrated epidemiological models:
• SEIR for modeling hepatitis A, hepatitis B, seasonal flu, H1N1 [13–17];
• SIR for modeling measles and rubella [13–15];
• SIR for modeling SARS-CoV-2 [13].
The geographical regions are described by properties such as area, population number and density, the geographical relationship between regions, transport routes, and existing traffic. The properties of geographic regions are mapped to XML files. Maps within the application are shown in SVG format (Scalable Vector Graphics) and KML (Keyhole Markup Language) format for Google Maps. For the counties in Romania, the SVG and KML maps are separate.
The analysis of recent literature has drawn various approaches and solutions, adopted by public and private institutions in Europe, the United States, China, Russia, Japan, etc., but characterized by heterogeneous approaches: deep learning, virtualization and 3D, Artificial Intelligence techniques and the smartphones, which do not make full use of recognized industry standards and methodologies and which involve the use of diverse, non-homogeneous systems at different points in life cycles. This leads to data redundancy, but also reduced functionality and integration [18–32].
4.1 Configuring Simulation Scenarios
The Green-Epidemio application monitors the evolution of different epidemic patterns. These models can be predefined and also be changed by the user. The user can also create and save new models.
Stage 1—Defining specific pathologies to perform time-space simulations. The predefined epidemiological models in the application are Measles, Rubella, Hepatitis A, Hepatitis B, seasonal Flu, H1N1, SARS-CoV-2 (in testing).
Stage 2—Defining the behavioral pattern of the pathology. The user must choose or edit the epidemiological model by configuring the following parameters: Incubation rate, mortality rate, rate of loss of immunity (rate describing the percentage in which an individual in the population, previously exposed to the pathogen, becomes liable to be infected), transmission rate, contact transmit rate, transmission rate via road network, recovery rate (is the time since the person was infected until it was cured), density (population density for which the transmission rate is valid), the birth rate of the population, population mortality rate.
Stage 3—Locating and describing the initial outbreak (initial location—the geographical area initially exposed to the pathogen) and the number of initial infections (the initial number of infected individuals in the initial location).
Stage 4—Determining the geographical area for which the simulation is performed based on the defined scene, meaning administrative characterization of the geographical area (division by counties, localities, the definition of neighborhoods, communication routes, as well as statistical information on the number of individuals and population density).
Stage 5—Defining the time interval for which the simulation is performed.
Stage 6—Saving the pathology behavioral model packages, focal spot, region, simulation, simulation range in the form of simulation scenarios.
4.2 Running Complex Time-Space Simulations Based on Epidemiological Models
The functionality of the Green-Epidemio application, in the current context, is:
• The simulation-based on pre-configured scenarios. The description of the selected epidemiological model is visible on the right side of the map.
• Running the simulations on predefined models, adapting various descriptive parameters relative to the behavioral pattern. The user can return to the parameter configuration section about the epidemiological model by pressing the “Edit” button or reset to the predefined values via the “Reset” button.
• Possibility of running the simulation step by step. The user has a slider, located below the map, through which he will select the current simulation date. Pressing the “view” button will update the map and illustrate the values of the selected individuals at the selected time.
Other functionalities of the Green-Epidemio application are:
• A graphic view of the evolution of the epidemic up to the currently selected moment via the slider. On the right side of the map are a scale of values and corresponding colors. A region on the map will be colored with the color corresponding to the number of infected individuals at the current time in the simulation;
• The simulation results will be stored in history tables;
• Accessibility and retrospective analysis of simulation results;
• Export implementation simulation results in the following formats: Matrix format that presents the value of the coefficients S, E, I, R for the region and time (X-axis is the list of geographical regions, Y-axis is the time scale); Graphics format; Shapefile; KML; Graphs of the time evolution of the coefficients S, E, I, R for a geographical area.
The initial representation is a view on the map. The user will be able to see the initial epidemic state, as illustrated in Fig. 6. The evolution of the epidemic is presented in Fig. 7. If the user chooses another current moment for which he wants to see the evolution of the epidemic, and can notice that the counties of Bucharest and Prahova reach the maximum of infected individuals and the counties around them are infected.
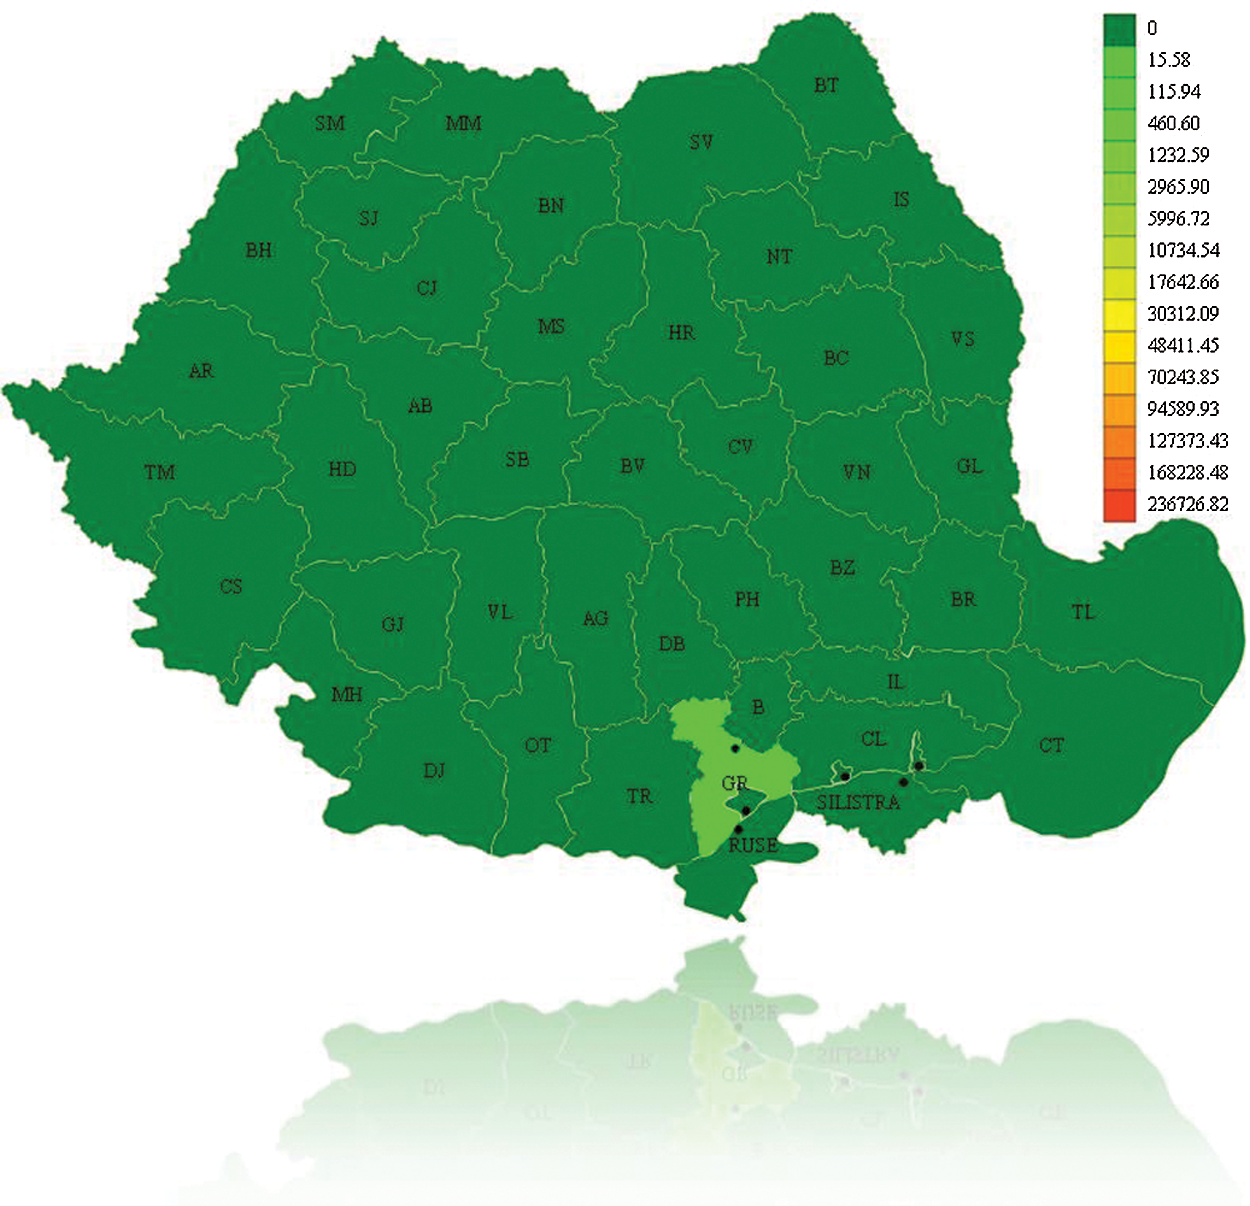
Figure 6: Initial epidemic representation for A/H1N1 Flu on December 16th, 2010, Romania
Figure 7: Epidemic evolution for A/H1N1 Flu on December 16th, 2010, Romania
The recovered individuals graph is presented in Fig. 8. It can be seen that after a time in some regions individuals will begin to recover. For example, the number of infected persons in Calarasi County in the previous step has decreased so it is colored with a closer color toward green. The Google Earth integration in KML format is presented in Fig. 9, for graphical analysis in GIS systems.
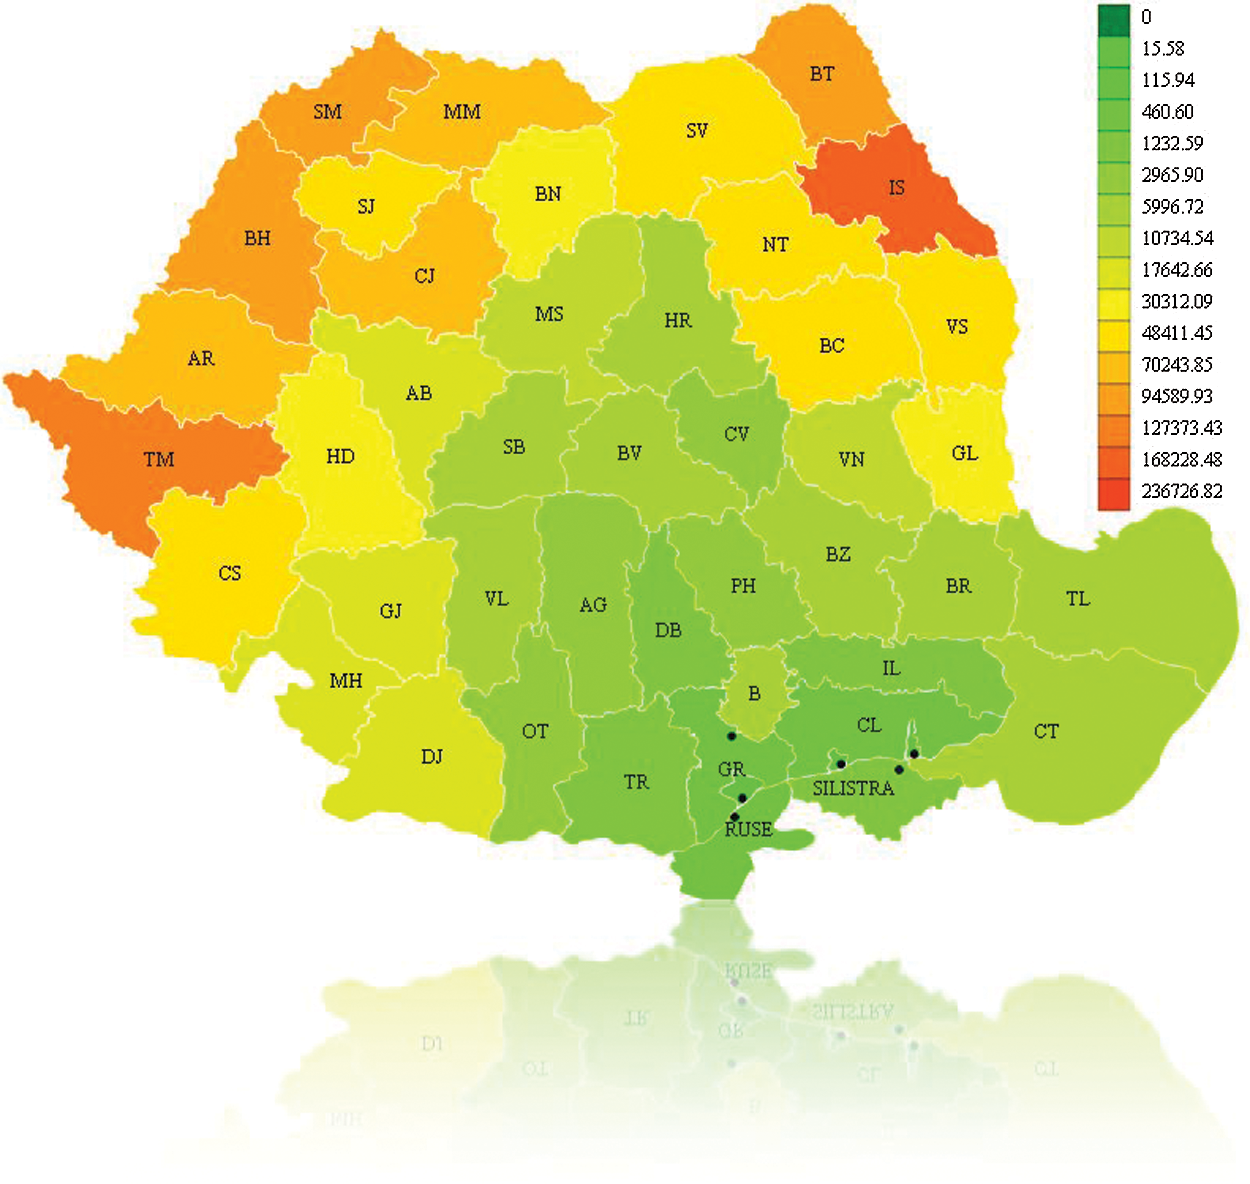
Figure 8: Recovered individuals for A/H1N1 Flu on December 16th, 2010, Romania
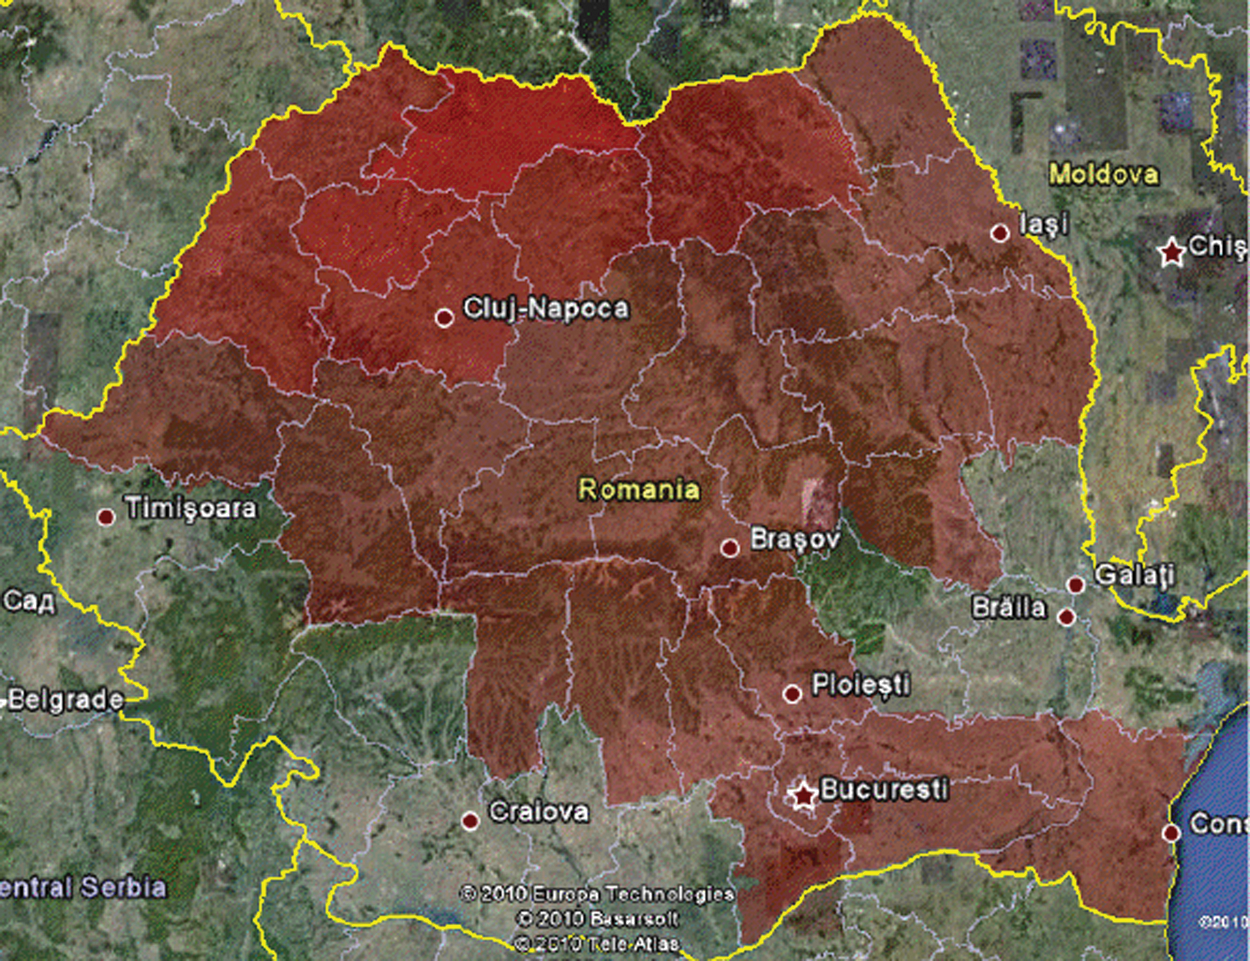
Figure 9: Google earth integration (KML) for A/H1N1 Flu on December 16th, 2010, Romania
The Graph format will cover the evolution of the epidemic until the current time of the simulation (X-axis is the time axis) and illustrates the values for infected individuals (orange color) and recovered individuals (blue color). The region for which the graph will be displayed can be selected (Fig. 10).
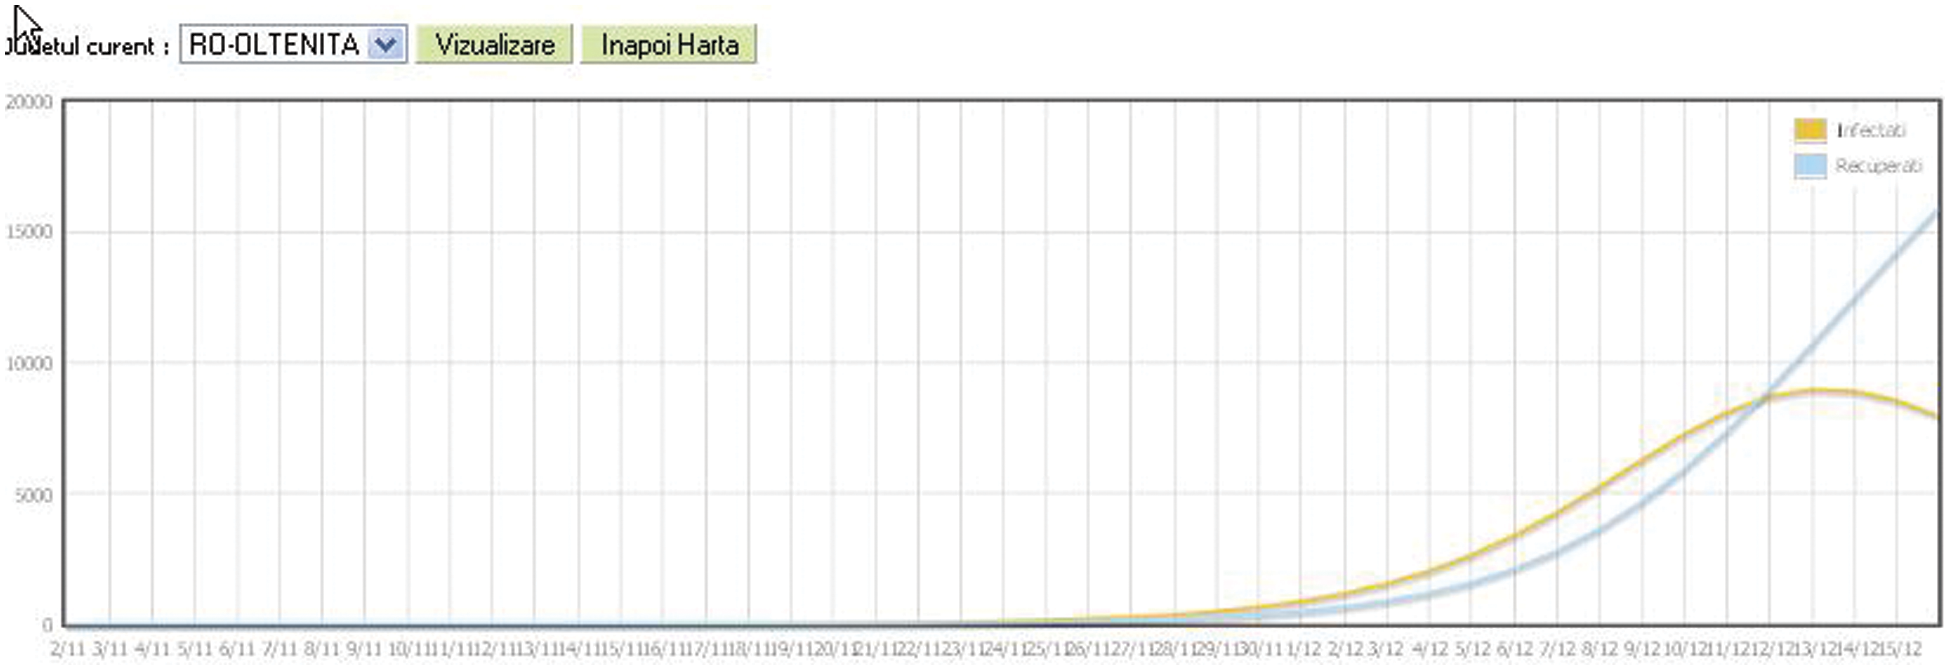
Figure 10: Statistical epidemic evolution in graphic format for A/H1N1 Flu on December 16th, 2020, Romania
The evolution table contains the values for the number of susceptible individuals, exposed, infected, recovered from the epidemiological model for each region up to the current time in the simulation. The dynamic SIR model offers us the opportunity to understand what can happen to the evolution of an epidemic or pandemic, as is the COVID-19 case. The reproduction number shows us if we have an epidemic and, also, using the two parameters,  and
and  , we can work to limit the epidemic. The
  parameter is related to social distance and the measures taken by public institutions while the
  parameter is it is related to medical aspects. In the absence of antiviral medicines and vaccines to stop the pandemic of COVID-19, we must try to reduce the
  parameter in the epidemiological SIR model by the measures currently being taken, but the spread of the virus follows the pattern and the consequences are difficult to assess. Both
  and
and  parameters are not constant but vary over time, but the general aspect of the spread of the virus can be achieved even in this case using the discretion of the SIR model.
The Green-Epidemio platform monitoring parameters, in the case of COVID-19 pandemic, include the following statistic population parameters: Total number of administrative units (i); Population density in a sector (ii); Total population in the administrative units (iii); Access roads in and out of an administrative unit, with estimative traffic on each artery (iv); Possibility of population migration, once the news of the pandemic reaches the general public (v). The following transport routes are being monitored: Railway; roads; naval routes, and the following information regarding an outbreak can be stored: Outbreak position; number of contaminated person and the type of the contaminating agent.
In our platform, we developed an automated approach for COVID-19 prediction using Machine Learning Methods, for example Support Vector Machine (SVM), Radial Function (RF). These methods were evaluated in terms of Precision, Accuracy, Recall, and other statistical tools (PPV—Positive prediction Value, AUC—Area Under the ROC Curve). We extract the features from the test data and predict the values. We obtain the predictions for COVID-19 patients and compare them with the actual values and print the accuracy of our model.
Using different ML methods, to improve accuracy and specificity and to identify the best model for our epidemiologic platform, we used automation feature selection and RF, SVM, DL classifiers. The best method with Accuracy of 98%, Precision of 95%, and Recall is 96% is for the SVM classifier. For the SVM classifier we calculate Mean Accuracy, Standard Deviation, Confusion Matrix, Cohen’s K (for the correlation between prediction and real output data), and ROC Curve and  (see Fig. 11).
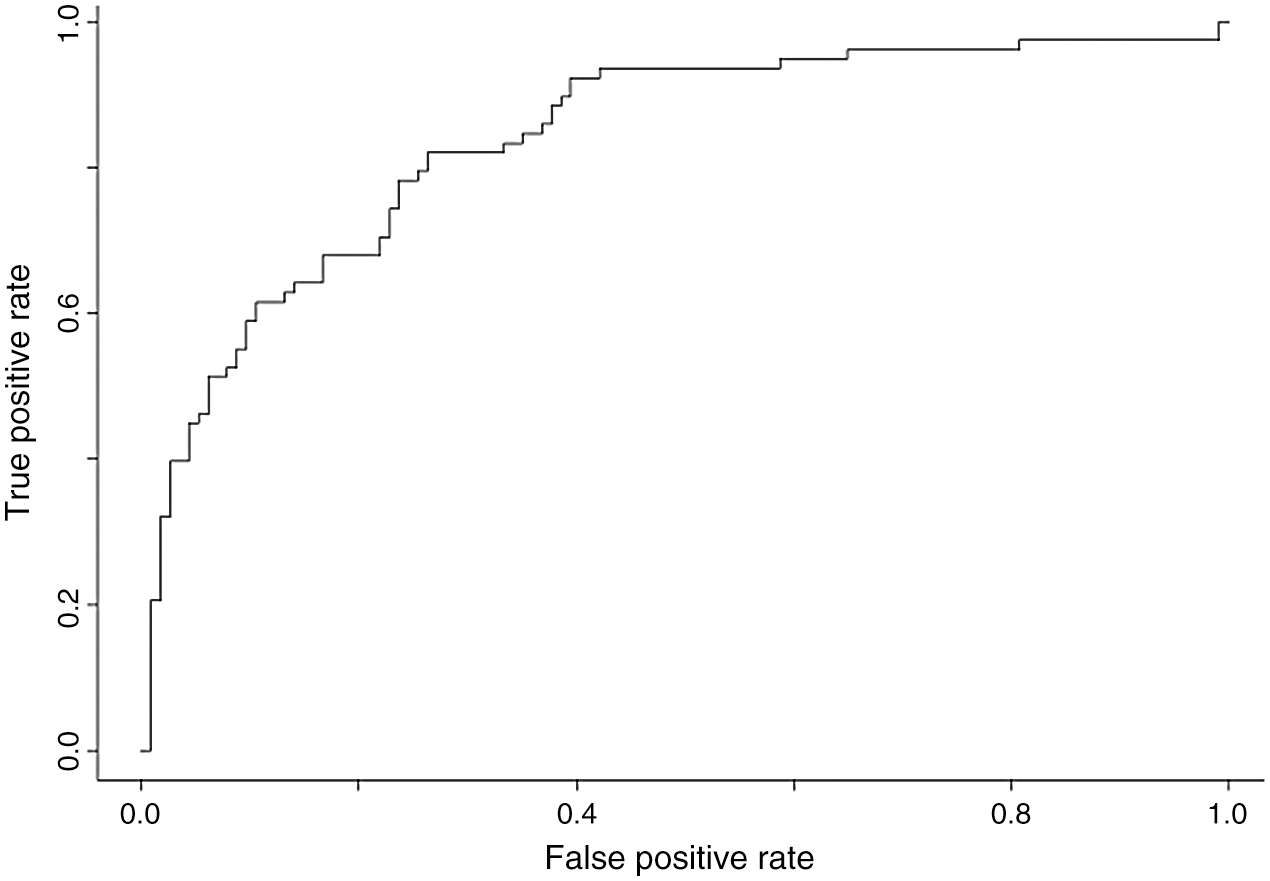
Figure 11: ROC curve and 
Our platform is designed to identify important pathogens, for example pathogens with epidemiological significance for border areas with increased transmission risk—B, C, D Hepatitis viruses, Seasonal flu viruses, Herpes viruses (VVZ), Rotaviruses, E. coli O157H7, Salmonella Typhy, Vibrio Holerae, Corynebacterium Diphteriae, Mycobacterium Tuberculosis, and other Pathogens involved in the natural evolution or through bioterrorism in the occurrence of epidemics or agents with pandemic potential, Flu viruses (H5N1, H1N1, and COVID-19 in tests), viruses with pandemic potential (SARS), other types of pathogens as Cryptosporidium Parvum, Toxoplasma Gondii or Giardia Lamblia etc.
The Green-Epidemio platform implements the automated management of compliance with distance/social isolation restrictions in quarantine areas by geo-localization, anonymously, of groups of persons, by generating alerts to authorities in case of large concentrations or dynamics of the population, with the emphasis on risk areas and dynamic display on GIS maps (geolocation, dynamics, potential evolution, etc.). Through the mobile phone application, people who have to comply with quarantine rules will be able to be monitored from the point of view of their mobile location. At different time intervals (randomly set), the patient will have to transmit the location to the responsible sites. Mobile phone location transmission can be done automatically, using face recognition, finger ID for patient identification, or manually. If a site is transmitted outside the declared quarantine boundary, an alarm message will be sent. Also, the platform allows modeling and simulating epidemiological evolution over time, based on extended differential mathematical models such as the SIR model (susceptibility, infection, recovery) and dynamic comparative analysis, mapping of prediction results on GIS maps and evolution charts. Based on an existing epidemiological model (differential mathematical model) or a user input, the computer system will simulate the epidemiological evolution.
The automated management of the epidemiological trial for persons seeking access to hospitals or other public institutions can be carried out using the proposed platform by digitizing the trial/access form and the request for access approval, estimating a risk score taken by the applicant through hospital access, in particular, the public institution, as well as by managing traceability of areas to be accessed and of persons with whom the applicant has been in proximity, in compliance with the requirements on the protection of personal data. The Platform aims to incorporate functionalities for on-line completion and verification of epidemiological questionnaires to ensure clear traceability of the flow, but also to ensure a separation of the people involved, which is so necessary for current pandemic. The Green-Epidemio is a platform adaptable to the specific features of any public institution for disease management, based on open-source software, allowing the adaptation, customization, and further development of “open-source” applications, according to the specificities of the public institution, the changes in the economic and social environment and its legal framework. The platform has a mathematical model for the spread of COVID-19 infection depending on the location of the outbreaks so that the allocation of resources and the geographical limitation of certain areas can be parameterized according to the number and location of the real-time identified outbreaks. The social impact of the proposed solution is due to the planned applications of information flow management, which is a first step in improving significantly the response time and efficiency of people-operated response services. Moreover, institutional interoperability influences strategic societal factors.
The Green-Epidemio platform represents a long-term solution for emergencies caused by epidemics, pandemics or bioterrorism actions, and can be developed by the cross-border partnership between institutions legally empowered to monitor the occurrence and evolution of infectious diseases. It is possible to develop a monitoring and warning system for emergencies for the occurrence and evolution of infectious diseases in the eastern border region, to create a monitoring and early warning system which will operate in all three emergencies that may arise: epidemics, pandemics, and bioterrorism and to establish the mathematical models that will predict how certain viruses spread in different situations will be developed (e.g., in case of COVID-19 and other pandemics, in the future research).
Acknowledgement: The authors gratefully thank “Stefan cel Mare” University of Suceava for providing material and financial support.
Author Contributions: All authors writing, original draft preparation, conceptualization, designing, analysis, investigations, data analysis, review, and editing the content. All authors have read and agreed to the published version of the manuscript.
Funding Statement: This research received no grant funding and the APC was funded by “Ştefan cel Mare” University of Suceava, Romania.
Conflicts of Interest: The authors declare that they have no conflicts of interest to report regarding the present study.
1. Worldometer Online Platform. [Online]. Available: https://www.worldometers.info/coronavirus. [Google Scholar]
2. D. Vana. (2020). Graphs Online Platform, This work by Graphs.ro is licensed under a Creative Commons Attribution-ShareAlike 4.0 International License, . [Online]. Available: https://www.graphs.ro/index.php. [Google Scholar]
3. T. Hale, S. Webster, A. Petherick, T. Phillips and B. Kira. (2020). “Oxford COVID-19 government response tracker,” Blavatnik School of Government. [Online]. Available: https://www.bsg.ox.ac.uk/research/research-projects/coronavirus-government-response-tracker. [Google Scholar]
4. World Health Organization (WHO). (2020). “Global research on coronavirus disease (COVID-19),” . [Online]. Available: https://www.who.int/emergencies/diseases/novel-coronavirus-2019/global-research-on-novel-coronavirus-2019-ncov. [Google Scholar]
5. W. J. Guan, Z. Y. Ni, Y. Hu, W. H. Liang, C. Q. Ou et al. (2020). , “Clinical characteristics of coronavirus disease 2019 in China,” New England Journal of Medicine, vol. 382, no. 18, pp. 1708–1720. [Google Scholar]
6. S. Nickbakhsh, A. Ho, D. F. P. Marques, J. McMenamin, R. N. Gunson et al. (2020). , “Epidemiology of seasonal coronaviruses: Establishing the context for COVID-19 emergence,” International Journal of Infectious Diseases, vol. 222, no. 1, pp. 17–25. [Google Scholar]
7. D. Normile. (2020). “Suppress and lift: Hong Kong and Singapore say they have a coronavirus strategy that works,” Science Mag, . [Online]. Available: https://www.sciencemag.org/news/2020/04/suppress-and-lift-hong-kong-and-singapore-say-they-have-coronavirus-strategy-works. [Google Scholar]
8. K. K. Cheng, T. H. Lam and C. C. Leung. (2020). “Wearing face masks in the community during the COVID-19 pandemic: Altruism and solidarity,” The Lancet. [Online]. Available: https://www.thelancet.com/journals/lancet/article/PIIS0140-6736(20)30918-1/fulltext. [Google Scholar]
9. B. J. Cowling, S. T. Ali, T. W. Y. Ng, T. K. Tsang, J. C. M. Li et al. (2020). , “Impact assessment of nonpharmaceutical interventions against coronavirus disease 2019 and influenza in Hong Kong: An observational study,” The Lancet. [Online]. Available: https://www.thelancet.com/journals/lanpub/article/PIIS2468-2667(20)30090-6/fulltext. [Google Scholar]
10. K. Macartney, H. E. Quinn and A. J. Pillbury. (2020). “Transmission of SARS-CoV-2 in Australian educational settings: A prospective cohort study,” The Lancet. [Online]. Available: https://www.thelancet.com/journals/lanchi/article/PIIS2352-4642(20)30251-0/fulltext. [Google Scholar]
11. C. Hoffmann and B. S. Kamps. (2020). “COVID reference top 10,” . [Online]. Available: https://www.CovidReference.com. [Google Scholar]
12. Shoumen Datta. (2020). “Digital transformation—IoT is a metaphor,” . [Online]. Available: https://dspace.mit.edu/handle/1721.1/111021. [Google Scholar]
13. L. Chivu. (2020). Mathematical Modeling of Complex Dynamic Systems with Practical Applications in the Context of the COVID-19 Pandemic, Romania: Costin C. Kiritescu National Institute of Economic Research. [Google Scholar]
14. W. O. Kermack and A. G. McKendrick. (1927). “A contribution to the mathematical theory of epidemics,” Proceedings of the Royal Society of London, vol. 115, no. 772, pp. 700–721. [Google Scholar]
15. O. Diekmann and J. A. P. Heesterbeek. (2000). Mathematical Epidemiology of Infectious Diseases: Model Building, Analysis and Interpretation. John Wiley & Sons, pp. 303. [Google Scholar]
16. S. Gandon, T. Day, C. J. E. Metcalf and B. T. Grenfell. (2016). “Forecasting epidemiological and evolutionary dynamics of infectious diseases,” Trends in Ecology & Evolution, vol. 31, no. 10, pp. 776–788. [Google Scholar]
17. E. Volz and L. A. Meyers. (2007). “Susceptible infected recovered epidemics in dynamic contact networks,” Proceedings of the Royal Society B: Biological Sciences, vol. 274, no. 1628, pp. 2925–2934. [Google Scholar]
18. J. Lessler, A. S. Azman, M. K. Grabowski, H. Salje and I. Rodriguez-Barraquer. (2016). “Trends in the mechanistic and dynamic modeling of infectious diseases,” Current Epidemiology Reports, vol. 3, no. 3, pp. 212–222. [Google Scholar]
19. A. Grant. (2020). “Dynamics of COVID-19 epidemics: SEIR models underestimate peak infection rates and overestimate epidemic duration,” medRxiv. [Online]. Available: https://www.medrxiv.org/content/10.1101/2020.04.02.20050674v2. [Google Scholar]
20. M. West and P. J. Harrison. (1989). Bayesian forecasting and dynamic models. New York: Springer-Verlag. [Google Scholar]
21. S. Cauchemez, A. Bhattarai, T. L. Marchbanks, R. P. Fagan, S. Ostroff et al. (2011). , “Role of social networks in shaping disease transmission during a community outbreak of 2009 H1N1 pandemic influenza,” Proceedings of the National Academy of Sciences of the United States of America, vol. 108, no. 7, pp. 2825–2830. [Google Scholar]
22. T. Harko, F. S. N. Lobo and M. K. Mak. (2014). “Exact analytical solutions of the susceptible infected recovered (SIR) epidemic model and of the SIR model with equal death and birth rates,” Applied Mathematics and Computation, vol. 236, pp. 184–194. [Google Scholar]
23. H. W. Hethcote. (2000). “The mathematics of infectious disease,” SIAM Review, vol. 42, no. 4, pp. 599–653. [Google Scholar]
24. C. Fraser. (2007). “Estimating individual and household reproduction numbers in an emerging epidemic,” Plos One, vol. 2, pp. 758. [Google Scholar]
25. P. Van den Driessche and J. Watmough. (2002). “Reproduction numbers and sub-threshold endemic equilibria for compartmental models of disease transmission,” Mathematical Biosciences, vol. 180, pp. 29–48. [Google Scholar]
26. J. Wallinga and M. Lipsitch. (2006). “How generation intervals shape the relationship between growth rates and reproductive numbers,” Proceedings of the Royal Society B: Biological Sciences, vol. 274, pp. 599–604. [Google Scholar]
27. G. Zhou and G. Yan. (2003). “Severe acute respiratory syndrome epidemic in Asia,” Emerging Infectious Diseases, vol. 9, no. 12, pp. 1608–1610. [Google Scholar]
28. J. J. Liao and R. Liu. (2009). “Re-parameterization of five-parameter logistic function,” Journal of Chemometrics, vol. 23, pp. 48–53. [Google Scholar]
29. O. Diekmann, J. A. Heesterbeek and M. G. Roberts. (2010). “The construction of next-generation matrices for compartmental epidemic models,” Journal of the Royal Society, vol. 7, no. 47, pp. 873–885. [Google Scholar]
30. H. Xiong and H. Yan. (2020). “Simulating the infected population and spread trend of 2019-ncov under different policy by SIR model,” medRxiv. [Online]. Available: https://www.medrxiv.org/content/10.1101/2020.02.10.20021519v1. [Google Scholar]
31. X. Li, X. Zhao and Y. Sun. (2020). “The lockdown of Hubei province causing different transmission dynamics of the novel coronavirus (2019-ncov) in Wuhan and Beijing,” medRxiv. [Online]. Available: https://www.medrxiv.org/content/10.1101/2020.02.09.20021477v2. [Google Scholar]
32. C. Castillo-Chavez, C. W. Castillo-Garsow and A. Yakubu. (2003). “Mathematical models of isolation and quarantine,” JAMA, vol. 290, pp. 2876–2877. [Google Scholar]
 | This work is licensed under a Creative Commons Attribution 4.0 International License, which permits unrestricted use, distribution, and reproduction in any medium, provided the original work is properly cited. |