DOI:10.32604/cmc.2021.013565
| Computers, Materials & Continua DOI:10.32604/cmc.2021.013565 | |
| Article |
Observed Impacts of Climate Variability on LULC in the Mesopotamia Region
1Istanbul Technical University, Istanbul, 3400, Turkey
2Bogazici University, Istanbul, 3400, Turkey
*Corresponding Author: Muntaha Alzubade. Email: muntazubade90@gmail.com
Received: 30 August 2020; Accepted: 19 December 2020
Abstract: Remote sensing analysis techniques have been investigated extensively, represented by a critical vision, and are used to advance our understanding of the impacts of climate change and variability on the environment. This study aims to find a means of analysis that relies on remote sensing techniques to demonstrate the effects of observed climate variability on Land Use and Land Cover (LULC) of the Mesopotamia region, defined as a historical region located in the Middle East. This study employed the combined analysis of the Normalized Difference Vegetation Index (NDVI), Land Surface Temperature (LST), and two statistical analysis methods (Pearson Correlation Analysis, r; Coefficient of Determination, R2), which were applied using the Moderate Resolution Imaging Spectroradiometer data and observed surface meteorological data from 2000 to 2018. The resulting NDVI images show five LULC classes with NDVI values varying between −0.3 and 0.9. Furthermore, changes in the classified LULC area were compared statistically to those in NDVI values, where a positive relationship was found. Also, when the LST values and temperature are more extreme, the NDVI values were found to be smaller, suggesting a decrease in the density of vegetation cover. A negative correlation was found through Pearson correlation analysis ( 0.64), indicating a direct effect of increased temperatures on LULC. Indeed, this negative relationship between NDVI and LST was proven using R2 values, where a two-dimensional scatter plot analysis showed that R2 ranges from 0.54 to 0.9. Ultimately, the results obtained from this study reveal changes that may have many prominent effects in the field of LULC classification, accelerating the implications of climate change and variability factors.
Keywords: NDVI; LST; MODIS data; meteorological data; Mesopotamia
Any substantial changes in climate variables, such as temperature, precipitation, or wind, will lead to changes in climate [1]. Climate variability has been described as the mean statistical data of previous variations in weather on all scales (temporal and spatial), beyond the scale of individual weather events. The region of Mesopotamia is one of many regions that have been affected by climate variability during the last decade due to many factors, such as anomalous changes in weather variables like precipitation and temperature [2–4]. Human activities, including successive wars and a lack of optimal political solutions, have aggravated climate change in many areas such as the Mediterranean Sea, the Mesopotamian valley, and China’s Loess plateau while natural factors are represented by the level of global warming that has occurred [5]. Changes in Land Use and Land Cover (LULC) have a direct impact on many aspects of human life. Climate change, the hydrological cycle, biological diversity, and others are the most complex issues causing changes in LULC [6,7]. Therefore, changes in LULC have been considered significant factors related to environmental change at local and global scales. Also, factors related to LULC may change over time. Consequently, LULC should be monitored with caution from the local, regional, and global scales, especially when plans are considered for future evaluation [8,9]. The linkage between different issues such as climate, vegetation cover, environment, and so on can be studied using the long-term analysis of LULC change as a necessary procedure to identify and map large-scale areas [10]. This process has many applications related to the fields of urbanization, the environment, and economics, such as coastal change and urban sprawl [11], urban landscape pattern change [12], water resource management [13], vegetation cover change [14], economic resource change [15], and quarrying activities [16]. Satellite remote sensing data is the most common data source for analyzing and mapping LULC class patterns and accrued changes because of its unique characteristics related to many factors such as acquisition, digital format, resolution, accurate geo-referencing, and so on [17]. Imaging systems, the methods used, and the understanding of LULC features are the most factors that affect the use of effective remote sensing techniques used for analyzing LULC changes [18,19].
Many studies have attempted to use remote sensing data to address changes in LULC, some of which have focused on semi-arid and arid regions. Post-Classification Comparison (PCC), image differencing, principal components analysis, and vegetation indices are the most common techniques that have been adopted to monitor LULC changes using remotely sensed data [20]. Othman et al. [21] were able to classify LULC changes using data from the Moderate Resolution Imaging Spectroradiometer (MODIS) where it has been shown that the use of MODIS-Normalized Difference Vegetation Index (NDVI) produced good results when revealing LULC classes [21]. To minimize problems associated with multi-temporal images recorded under different atmospheric and environmental conditions, the PCC method [22] has been used to classify and detect other LULC classes using multi-temporal remote sensing data [23]. Land Surface Temperature (LST) is an essential parameter that is often used to describe physical processes ongoing in land surface classes on regional and global scales. It combines the results of all interactive operations between the land surface and atmosphere, such as the exchange of energy fluxes between water bodies and the atmosphere [24]. Land cover change analysis data based on LST retrieved from remote sensing products have been used in many studies related to drought monitoring and soil salinization. Many researchers have been using LST products in their studies. For instance, LST data have been used to estimate the effects of long-term climate change, especially when integrated with NDVI data used to monitor vegetation coverage. All these studies have proven that LST can be a good indicator of many climate-related changes [25–27]. In addition, MODIS-NDVI data were used to explore whether differences existed in Spain and the Balearic Islands through a temporal statistical trend analysis of vegetation cover. The analysis showed that the NDVI trends were negative or positive at different times [28]. As an extremely beneficial technique, a geographical information system plays a significant role in detecting changes in LULC fields. Its high-power capability can provide quantitative estimation, statistical analysis, and spatial distribution solutions for a variety of case studies related to LULC [29,30]. Distribution analysis applications have been used to produce sensitive models that can be used to analyze the location of LULC classes on the ground.
Remarkably, the present study used a particular combination of remote sensing data to find an optimal analysis procedure that could be used to allocate climate change effects on the LULC in the study area. In addition, this study aims to address the factors that cause these changes and to find possible land management solutions or proposals to limit these changes from an environmental perspective. Furthermore, the following goals are addressed to achieve the study objectives: (i) to provide recent and historical LULC maps for the Mesopotamia region and to reveal the changes in LULC cover classes; ii) to identify the effects of observed long-term climatic variability on LULC using a developmental procedure that depended on LST and statistical analyses.
The historical land of the Middle East, situated between the Tigris and Euphrates river basins, is called Mesopotamia. Agriculture first emerged in Mesopotamia and then spread to neighboring lands, such as Ancient Egypt. Early agricultural operations enabled the residents of Mesopotamia to settle in the area and abandon their previously nomadic lives [31,32]. It is located from  –
– N to
N to  00′–
00′– 54′E covering an area of about 496,290 km2, including much of Iraq and the eastern parts of Syria as well as small portions of western Turkey and Iran (Fig. 1). Sand and dust storm (SDS) events create challenging environmental phenomenon for humans in the Mesopotamia region, where there has been an increase in SDSs with varying levels of intensity and frequency, especially in the past decade [2,33]. In addition, LULC changes have been occurring in this region primarily because of SDSs. These environmental catastrophes have been described in many international forums dealing with climate change phenomena and are categorized as uncontrollable transboundary environmental phenomena that cause a great deal of damage to human property and lives [34,35]. Al-Hayani et al. [36] concluded that SDSs contains various microorganisms, including Mycobacterium, Brucella, Bacillus, and many others. Furthermore, SDSs have a major economic effects. For example, a recent study by Al-Hayani et al. [37] showed that dust events in Kuwait City in 2001–2014 have caused $28,180 worth in damage per day to the oil export sector.
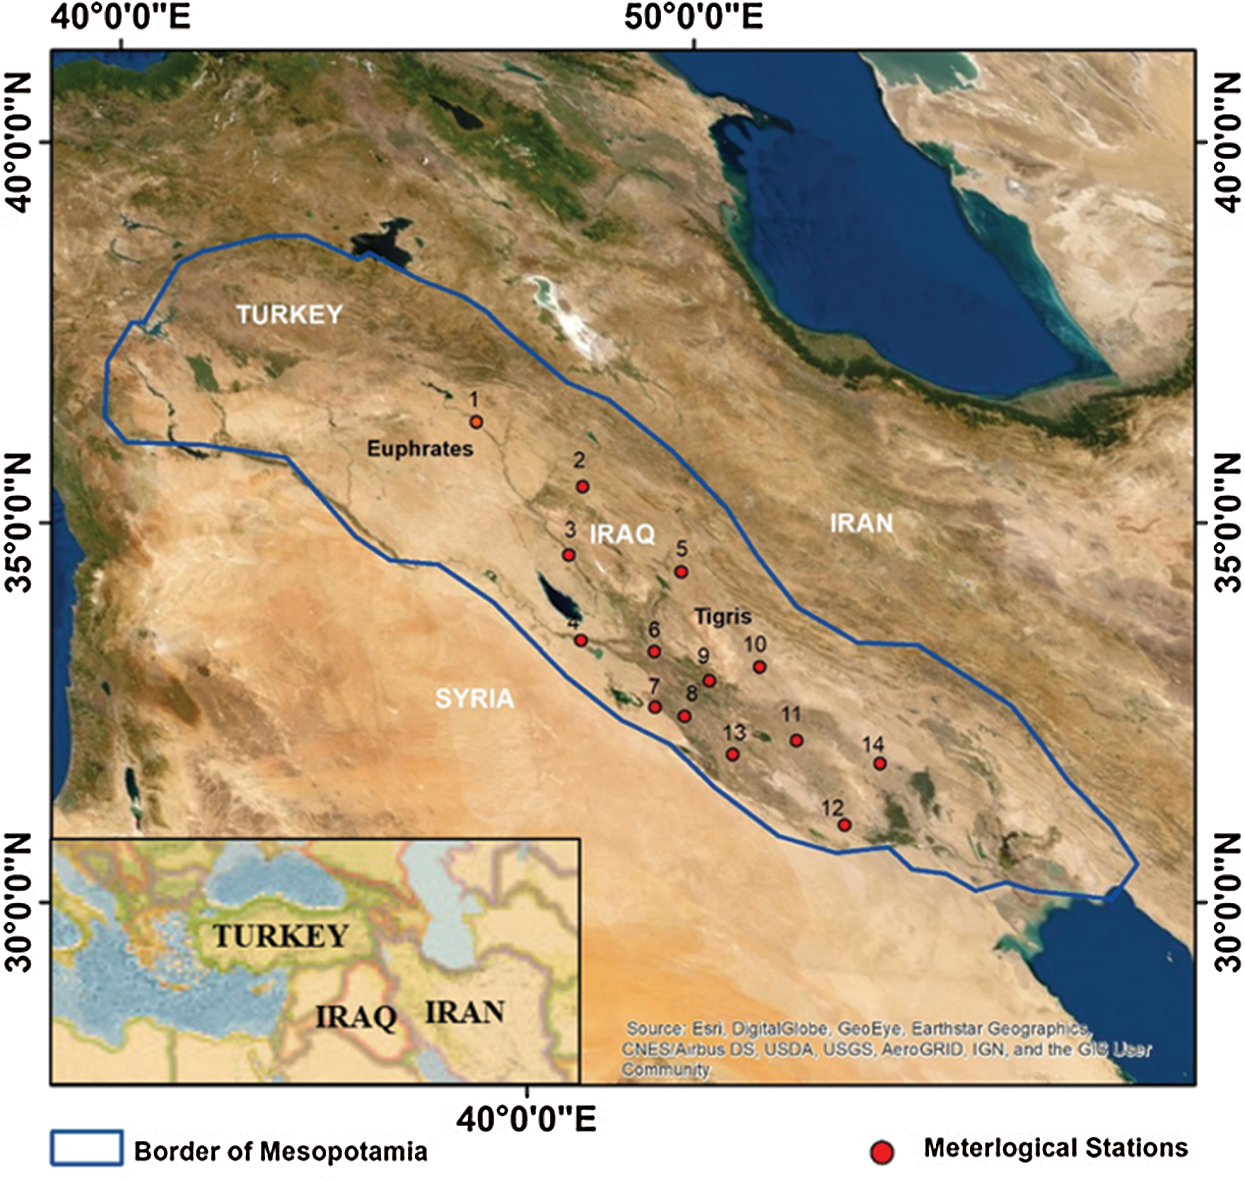
Figure 1: General view of the study area
In recent years, remote sensing has become an impressive technique based on its robust methods and reliable products. The MODIS on board Terra, an Aqua platform available for large-scale terrestrial applications, has 36 spectral bands ranging in wavelength from 0.4 to 14.4  m with varying spatial resolutions having two bands at 250 m, five bands at 500 m, and 29 bands at 1 km. The MODIS product data are distributed in the Hierarchical Data Format (HDF), and each file contains multiple layers of data. Out of seven bands used for land-surface applications (bands 1 to 7) from a total of 36 bands, only bands 1 and 2 (representing the red and near-infrared parts of the spectrum) were used in this NDVI analysis and study; cloud-free images were selected. Furthermore, of the 36 bands, only six bands deal with land surface temperature/emissivity (Bands 20 to 23 and Bands 31 to 32). In this study, bands 31 and 32 were used for the analysis of LST [38].
Because the study area covers an extensive region, 76 satellite images with two types of MODIS data acquired in July were retrieved from the United State Geological Survey (USGS) website representing from 2000 to 2018 [39]. The downloaded images included 36 images of NDVI type MOD13Q1 and 38 images of LST type MOD11A1 Version 6, where every two images cover the entire study area. A subset and mosaic process was applied to produce 19 scenes of each image type in the study area. These images have specific information, as described below:
1. MOD13Q1 data provides two essential vegetation layers generated every 16 days as a Level 3 product at a 250 m spatial resolution. The band’s width fluctuated between 620 and 876  m with spectral radiance at 21.8 and 24.7 W/m2-
 m-sr for bands 1 and 2, respectively.
2. Authorized validation of MOD11A1 Version 6 was obtained by the Terra satellites by various in situ measurements [40]. These data can be described as having a daily temporal resolution generalized by a split-window algorithm under clear-sky conditions at about 1 km (actually 0.928 km) spatial resolution with nominal data array dimensions equal to 1200 rows by 1200 columns gridded in a sinusoidal map projection. The band’s width fluctuated between 10.78 and 12.27  m with spectral radiance at 9.55 and 8.94 W/m2-
 m-sr) for bands 31 and 32, respectively.
3. In the temporal evaluation of MODIS-NDVI results, Landsat 5 Thematic Mapper, Landsat 7 Enhanced Thematic Mapper+, and Landsat 8 Operational Land Imager were taken simultaneously. Landsat satellite images have 30 m spatial resolution with a 16–18 days temporal resolution, and associated spectral bands had wavelength differences between 0.433 and 2.35 nm. Landsat images feature a higher spatial and temporal resolution than MODIS images and provide high-quality multispectral data for land surfaces since 1972.
Meteorological data reports, covering data from 1990 to 2018, were gathered from 14 meteorological observation stations distributed in Mesopotamia; these reports were used to complete the study objectives. This dataset was obtained from the Iraqi Ministry of Transportation [41,42], which shows the meteorological stations of (1) Mosul, (2) Kirkuk, (3) Tikrit, (4) Ramadi, (5) Khanqin, (6) Baghdad, (7) Karbala, (8) Hila, (9) Aziyzia, (10) Badra, (11) Alhai, (12) Nasiriya, (13) Dewaniya, and (14) Alemarah (Fig. 1).
3.1 Normalized Difference Vegetation Index (NDVI)
The NDVI is the most extensively used remotely sensed vegetation index and is used for detecting and investigating LULC and climatic phenomena, such as drought and desertification. For LULC studies, NDVI supplies a measure of the vegetation cover, associated with standing biomass volume. The main challenge related to using NDVI is that, even though biomass and productiveness are intimately related in some systems, the consequences of NDVI conditions can be generally based on changes of vegetation cover across LULC and ecosystem types [43]. The NDVI is a quantified vegetation remote sensing index that measures the differences between the red and near-infrared spectra reflected or observed from the vegetation cover. It is mostly used to discriminate between vegetated and unvegetated areas; it can also be used to evaluate the health status of vegetation [44]. The NDVI is represented mathematically using Eq. (1) as follows:

where NIR and RED reflect the near-infrared and red range of the spectrum, respectively. This formula generates a value between −1 and +1. The values from −1 to 0 represent unvegetated areas such as naturally bare, abandoned, or urbanized land, and values greater than 0 to +1 represent existing vegetation in the area under study [45]. In other words, a high NDVI value is observed when low reflectance is observed in the red channel and high reflectance is observed in the NIR channel, and vice versa. Based on the example provided by [46] and using MODIS13Q1 products, in the present study the NDVI was extracted from each image through multi-layer MODIS data for each frame, and the mosaic process of two frames was applied for each year (Fig. 2). From NDVI results validated via Landsat satellite imagery, the final NDVI images and LULC were classified into five classes, where the NDVI range of values for each class was estimated and was used in the statistical analysis of this study.
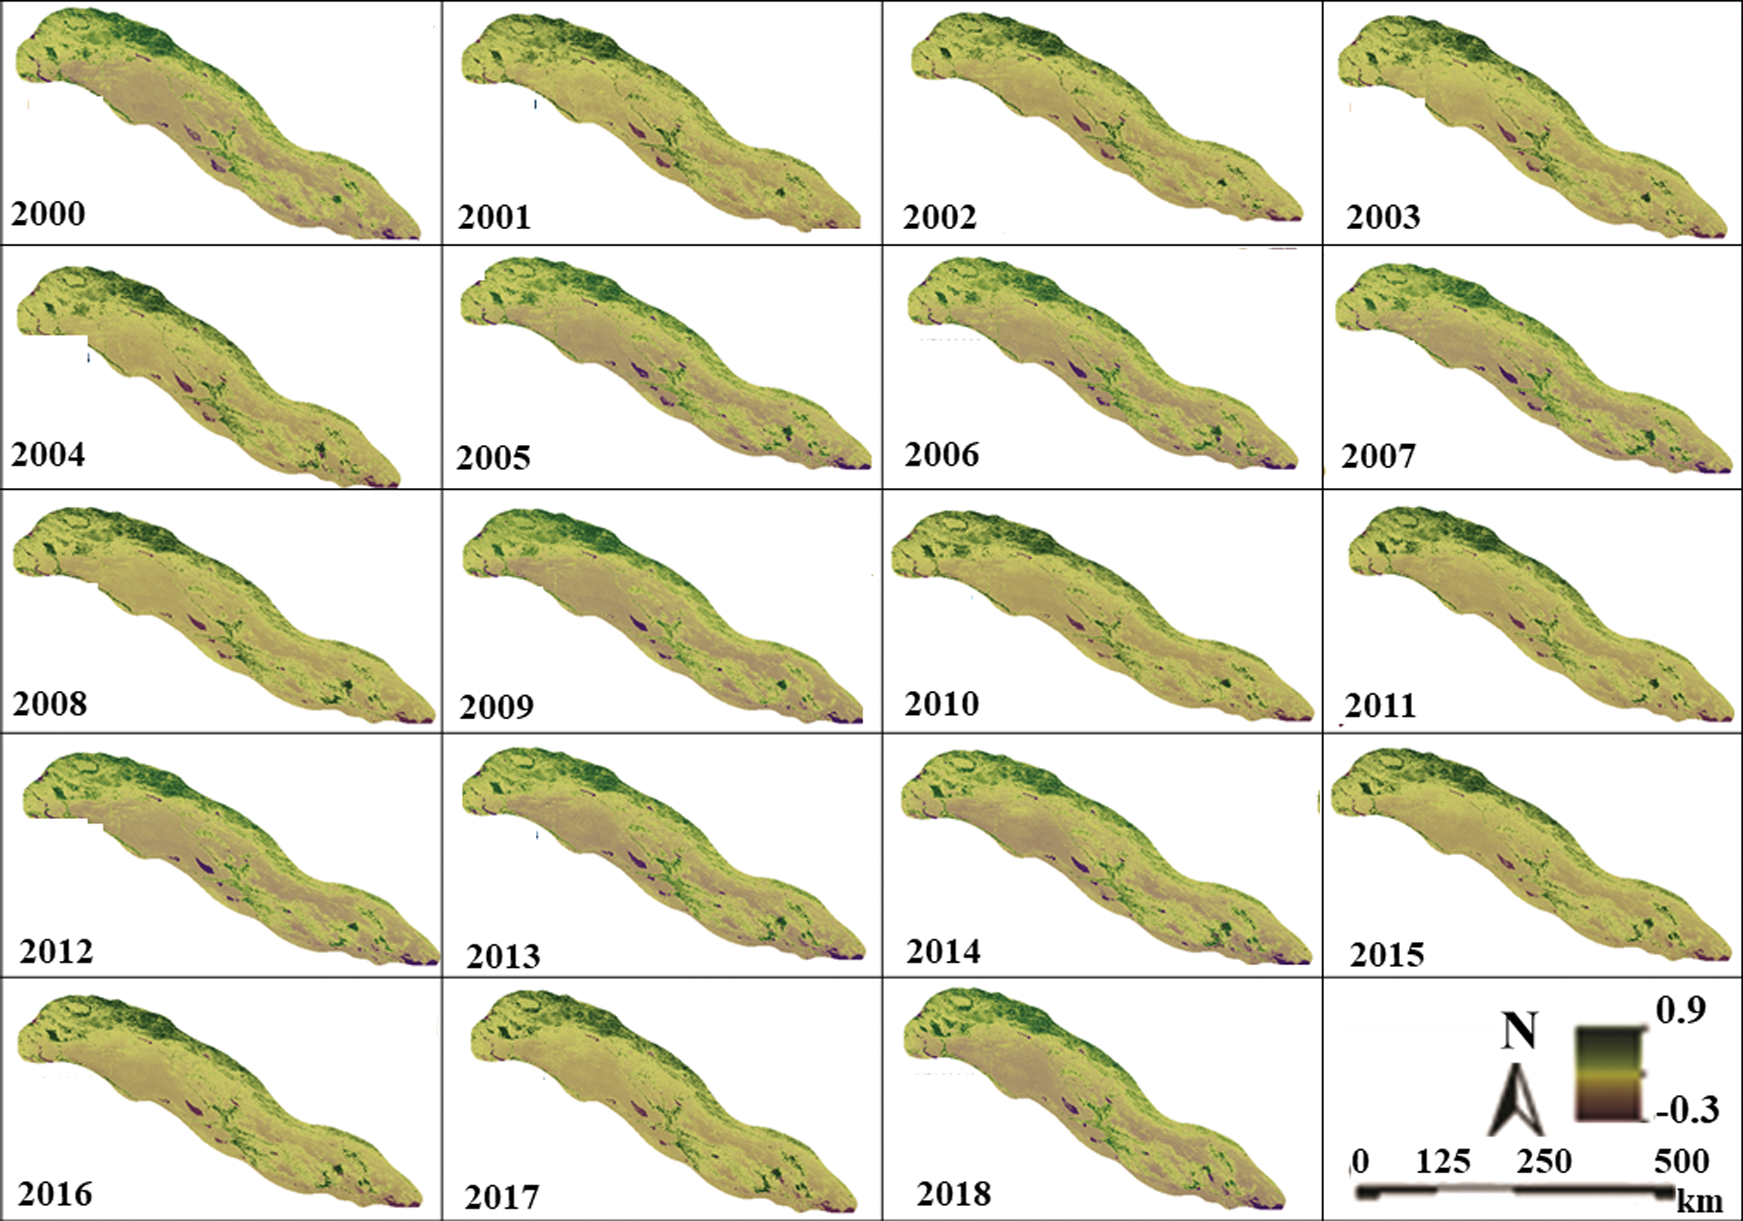
Figure 2: MODIS-NDVI from 2000 to 2018 for the Mesopotamia. MODIS, moderate resolution imaging spectroradiometer; NDVI, normalized difference vegetation index
3.2 Retrieving LST from the MODIS Data
The incident solar radiation received on earth is the ultimate energy source for plant life and largely determines the climatic conditions of earth’s habitats. The amount of solar energy reaching the earth’s surface is a significant observation related to the surface energy balance and governs many diverse surface processes. The LST provides a good indicator of long-wave and incoming solar irradiation that affects all the LULC classes. When soil, vegetation, water, or urban area, and so on have a different response for incoming solar radiation, any changes in the local surface temperature can be detected [47]. Several methods can be used to retrieve LST-based remote sensing data such as the split-window, temperature/emissivity separation, or single-channel methods [48,49]. In the present study, LST was retrieved automatically, where several steps had to be completed based on the single-channel method, as presented by [47]. Here, LST type (MOD11A1 Version 6) data from 2000 to 2018 (July) that covered the entire study area with a mosaic subset was adopted to obtain the final scene in the study area. The LST data were extracted in degrees Kelvin; the LST units obtained were converted to degrees Celsius using Eq. (2):

where DN represents the digital numbers of LST data (Fig. 3) [50].
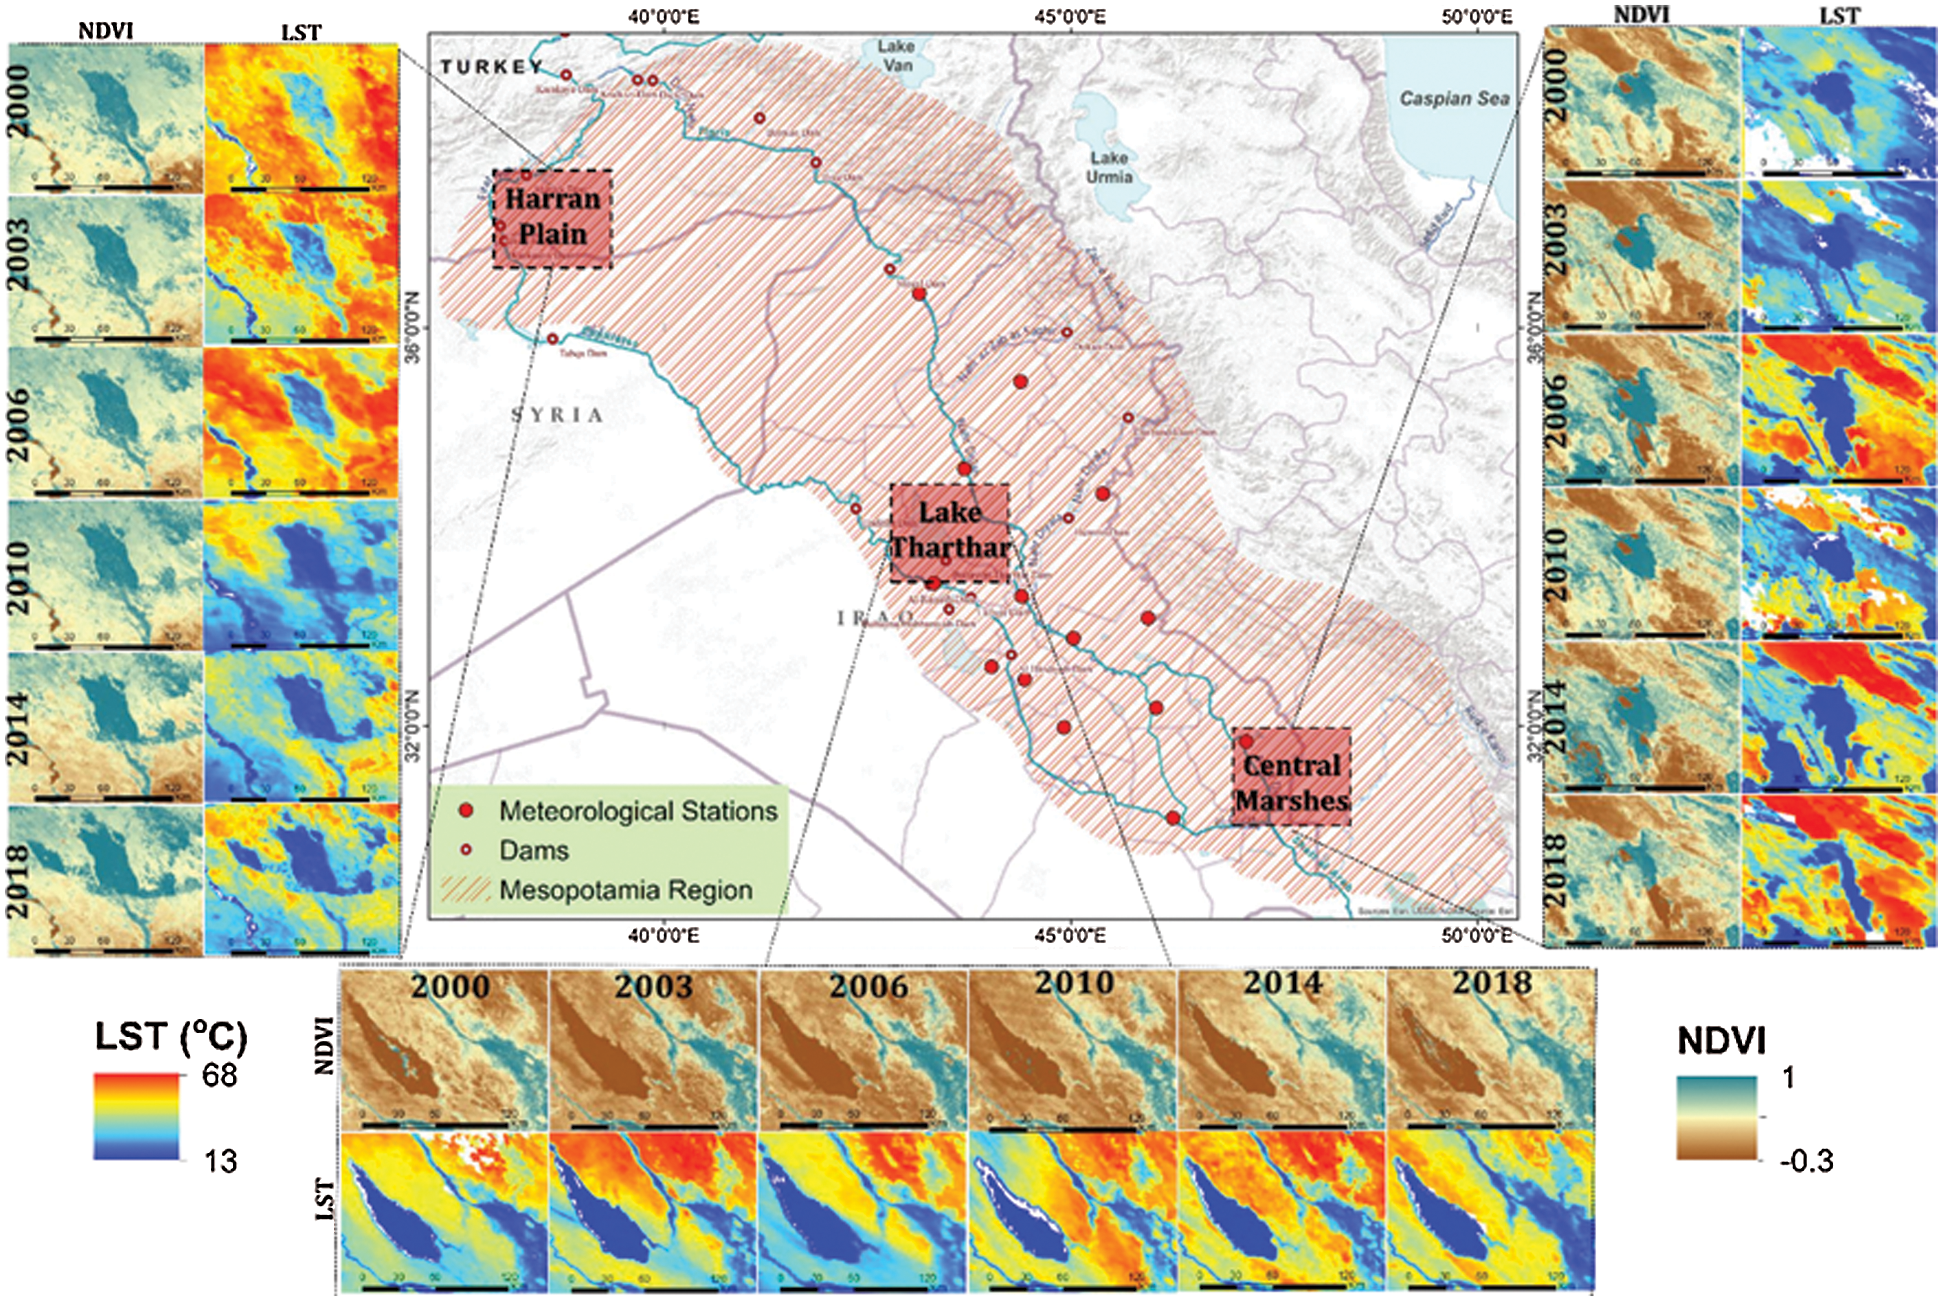
Figure 3: MODIS NDVI and LST results from 2000 to 2018 for the study area. LST, land surface temperature; MODIS, moderate resolution imaging spectroradiometer; NDVI, normalized difference vegetation index
The histograms of all NDVI and LST images were divided into 10 break values (Fig. 4). Two-dimensional scatter plot analysis was prepared to establish the relationship among the three variables: NDVI, LST, and the temperature distribution. Standardized statistical analyses were carried out to show the relationship between these variables with LULC changes in the study area during the studied period [51]. Two-dimensional scatter plot analysis and Pearson Correlation Coefficient (r) analysis was applied to find the statistical relationship between NDVI and LST for each LULC class.
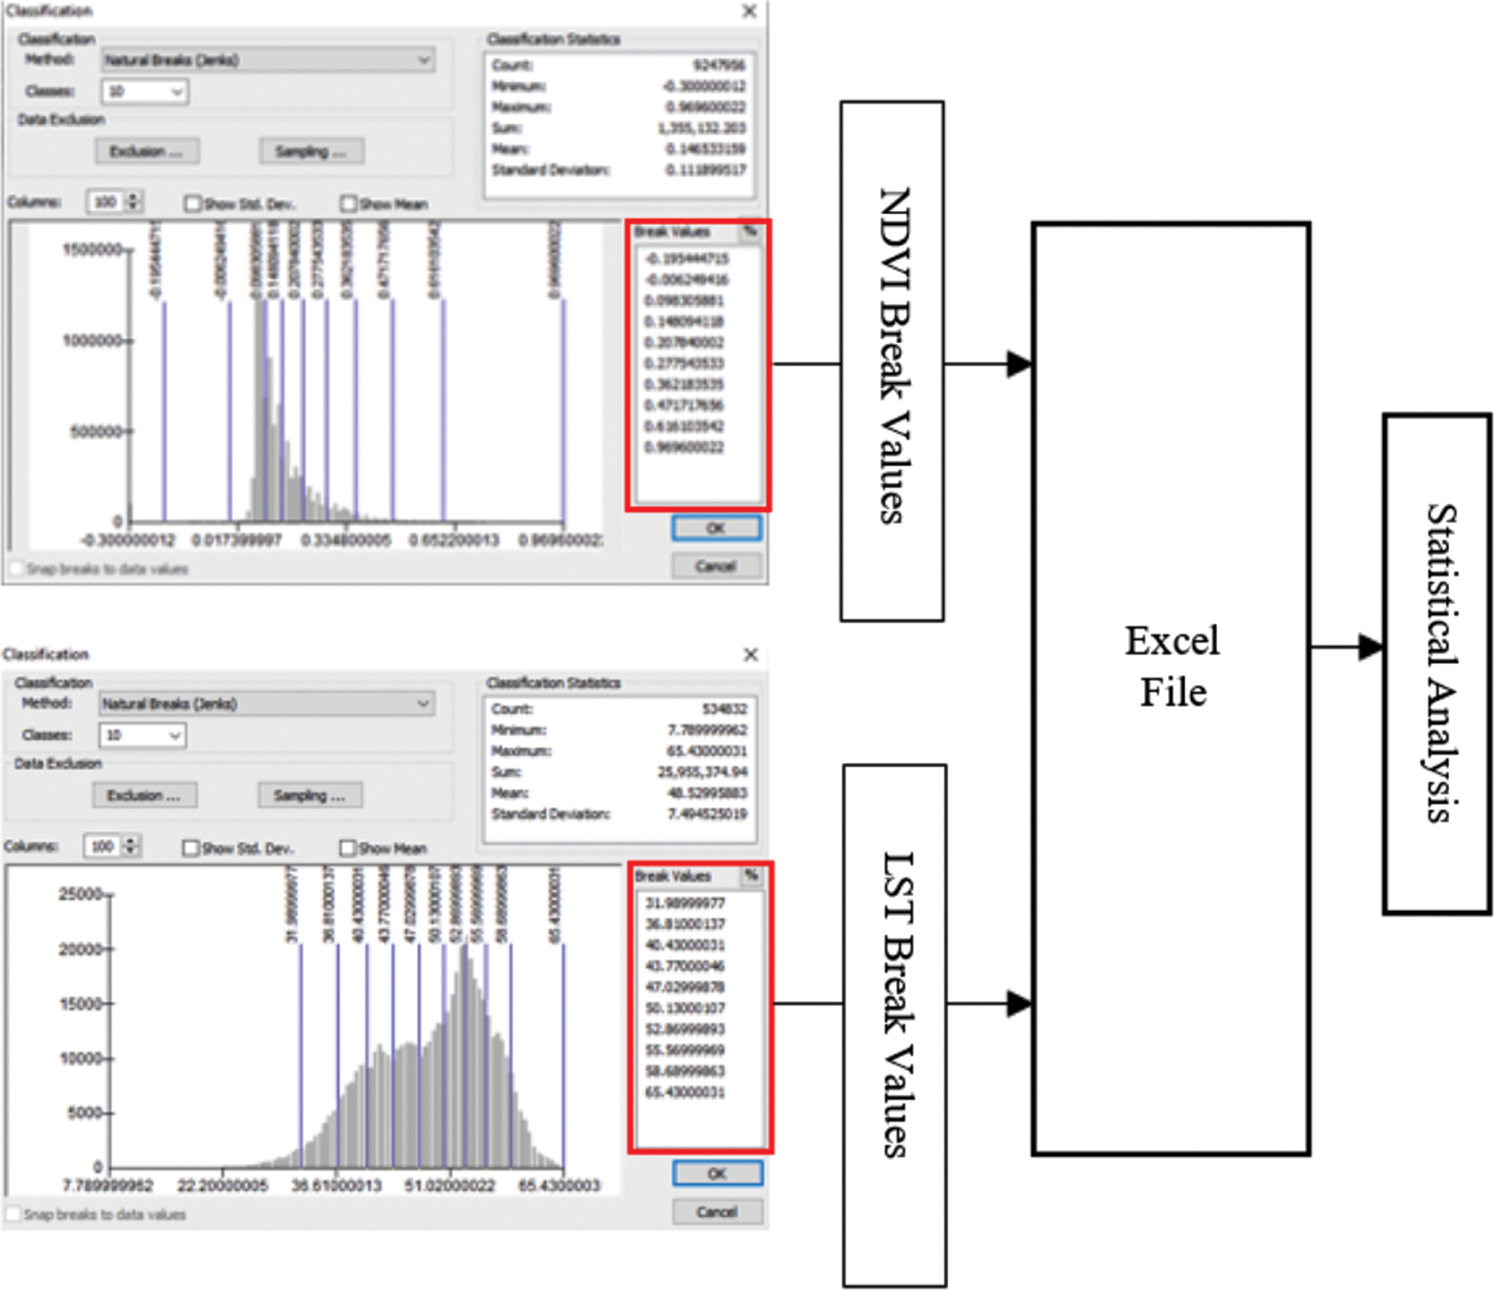
Figure 4: Preparing the normalized difference vegetation index (NDVI) and land surface temperature (LST) data for statistical analysis
According to [50], the region of Mesopotamia has suffered from two major problems, increasing salinization and dune movements, which play a leading role in decreasing quality and availability of agricultural lands. These problems are the main results of climate change in the study area based on extensive evidence that the findings of this study have confirmed. The NDVI images at a 16-day composite were produced by MODIS13Q1 products covering the study area from 2000 to 2018. The NDVI levels were estimated using the NDVI rescale method to improve visual interpretation. As a result, it was found that the NDVI values ranged from −0.3 to 0.9. The highest value (0.9) represents vegetation, whereas the lowest value (−0.3) represents water; the NDVI of barren lands fall in between (Fig. 2). The NDVI was used to analyze the four main LULC classes, including vegetation, agricultural lands, barren lands, and water. The areas of each class and the NDVI value for each year are summarized. According to Tab. 1, the region is generally covered by barren land ( 80%), open water (2%), and agricultural areas (
 7%). Although no significant changes were observed in the overall assessment of the area during the study period, changes were especially observed in open water areas when these areas are examined in detail (Fig. 5). In addition, the most noticeable differences can be seen in the vegetation where vegetation cover varied between 4% and 11%. To visualize the relationship between LULC and NDVI in the study area, the changes in each class area were estimated as a percentage for each studied year (Fig. 6). Therefore, changes in LULC classes can be defined. These changes in the region can be compared, evaluated, and attributed to several factors, such as the effects of climate change as a connection to the retreat of the classes of water bodies. The increase in the barren land class that has been caused by human activity is an example of an increase in the class of the agricultural land area.
Table 1: Temporal land use and land cover (LULC) classes with their areas
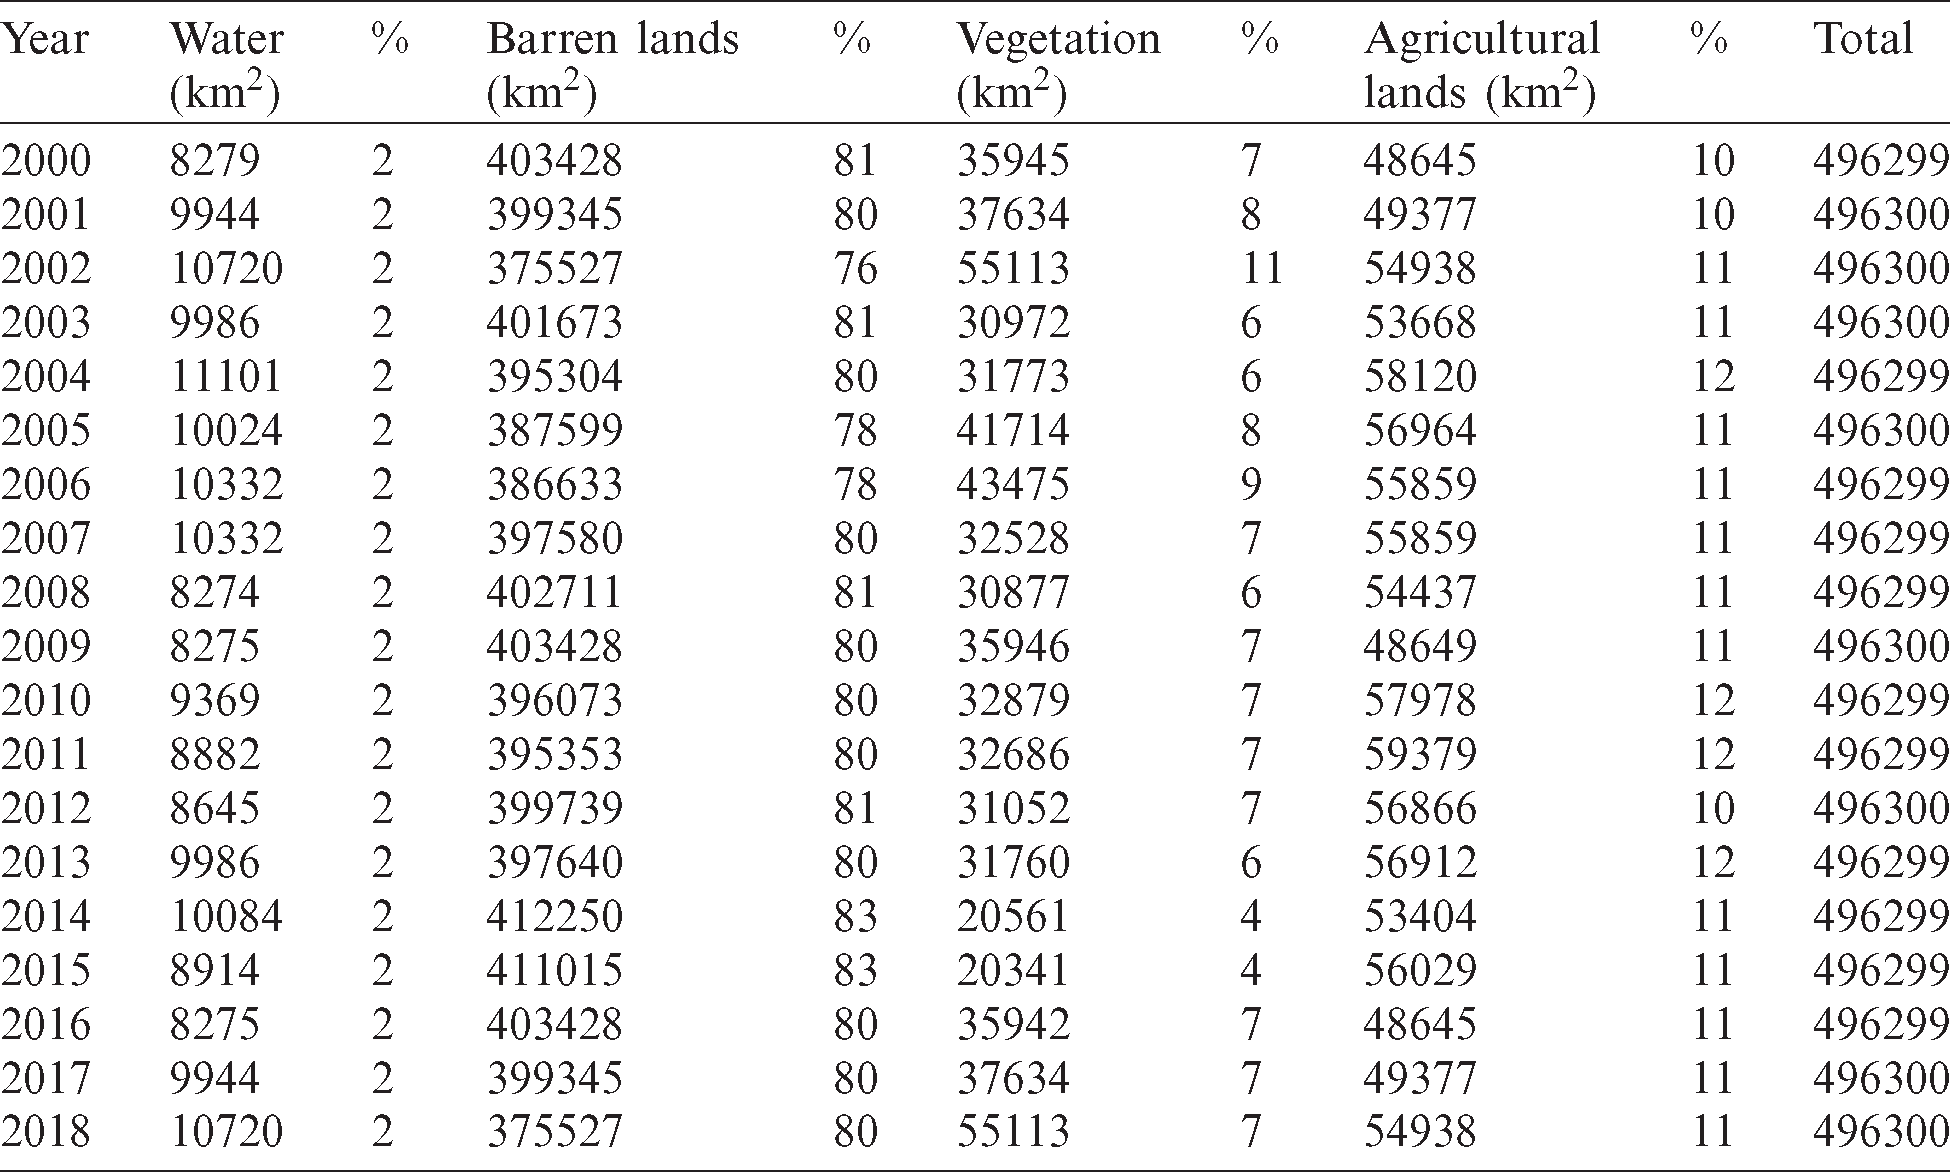
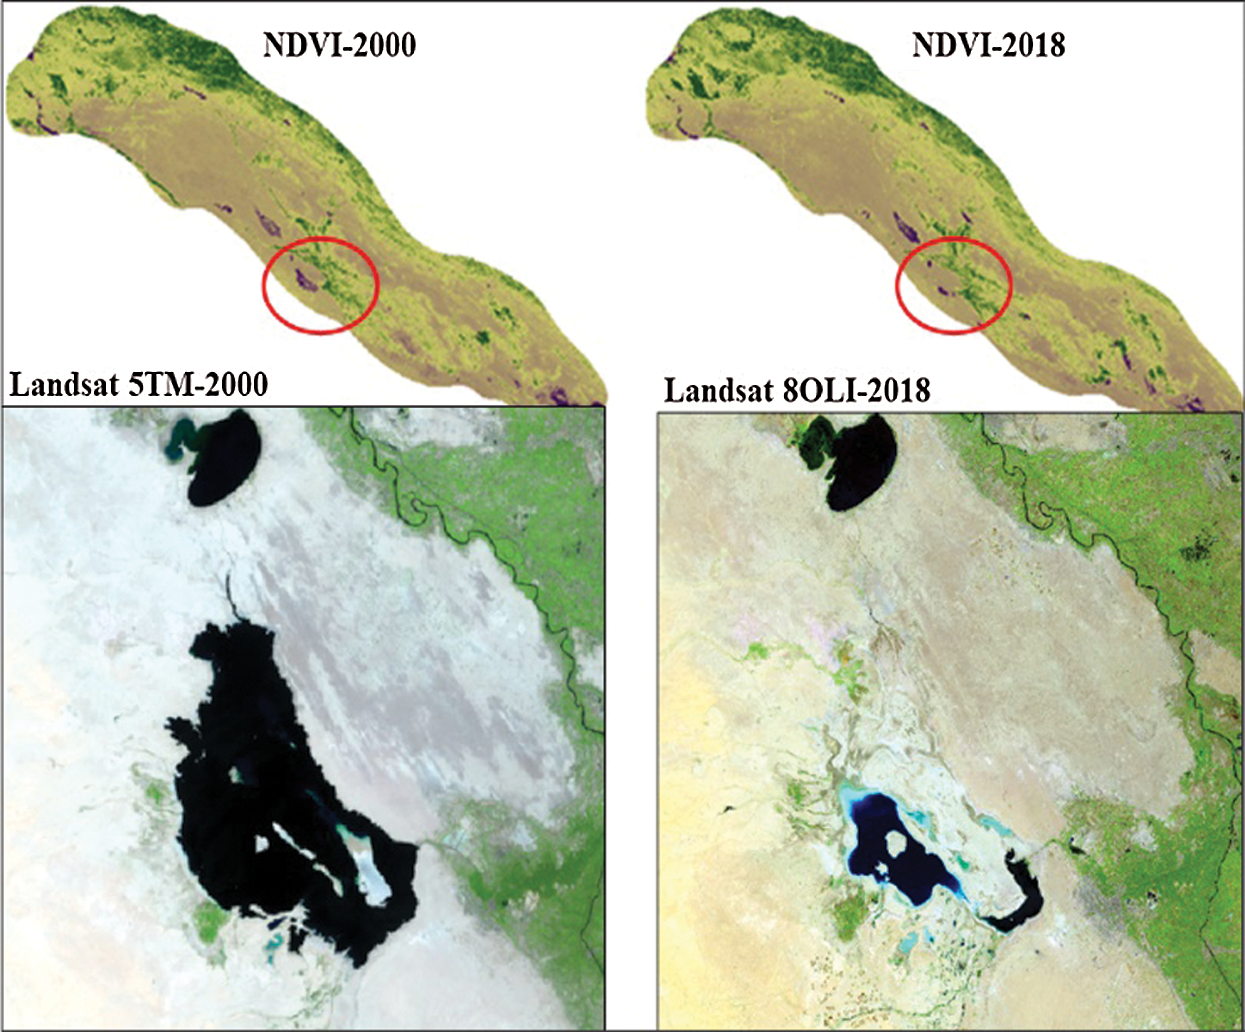
Figure 5: Land use and land cover (LULC) changes between water and vegetation as an example
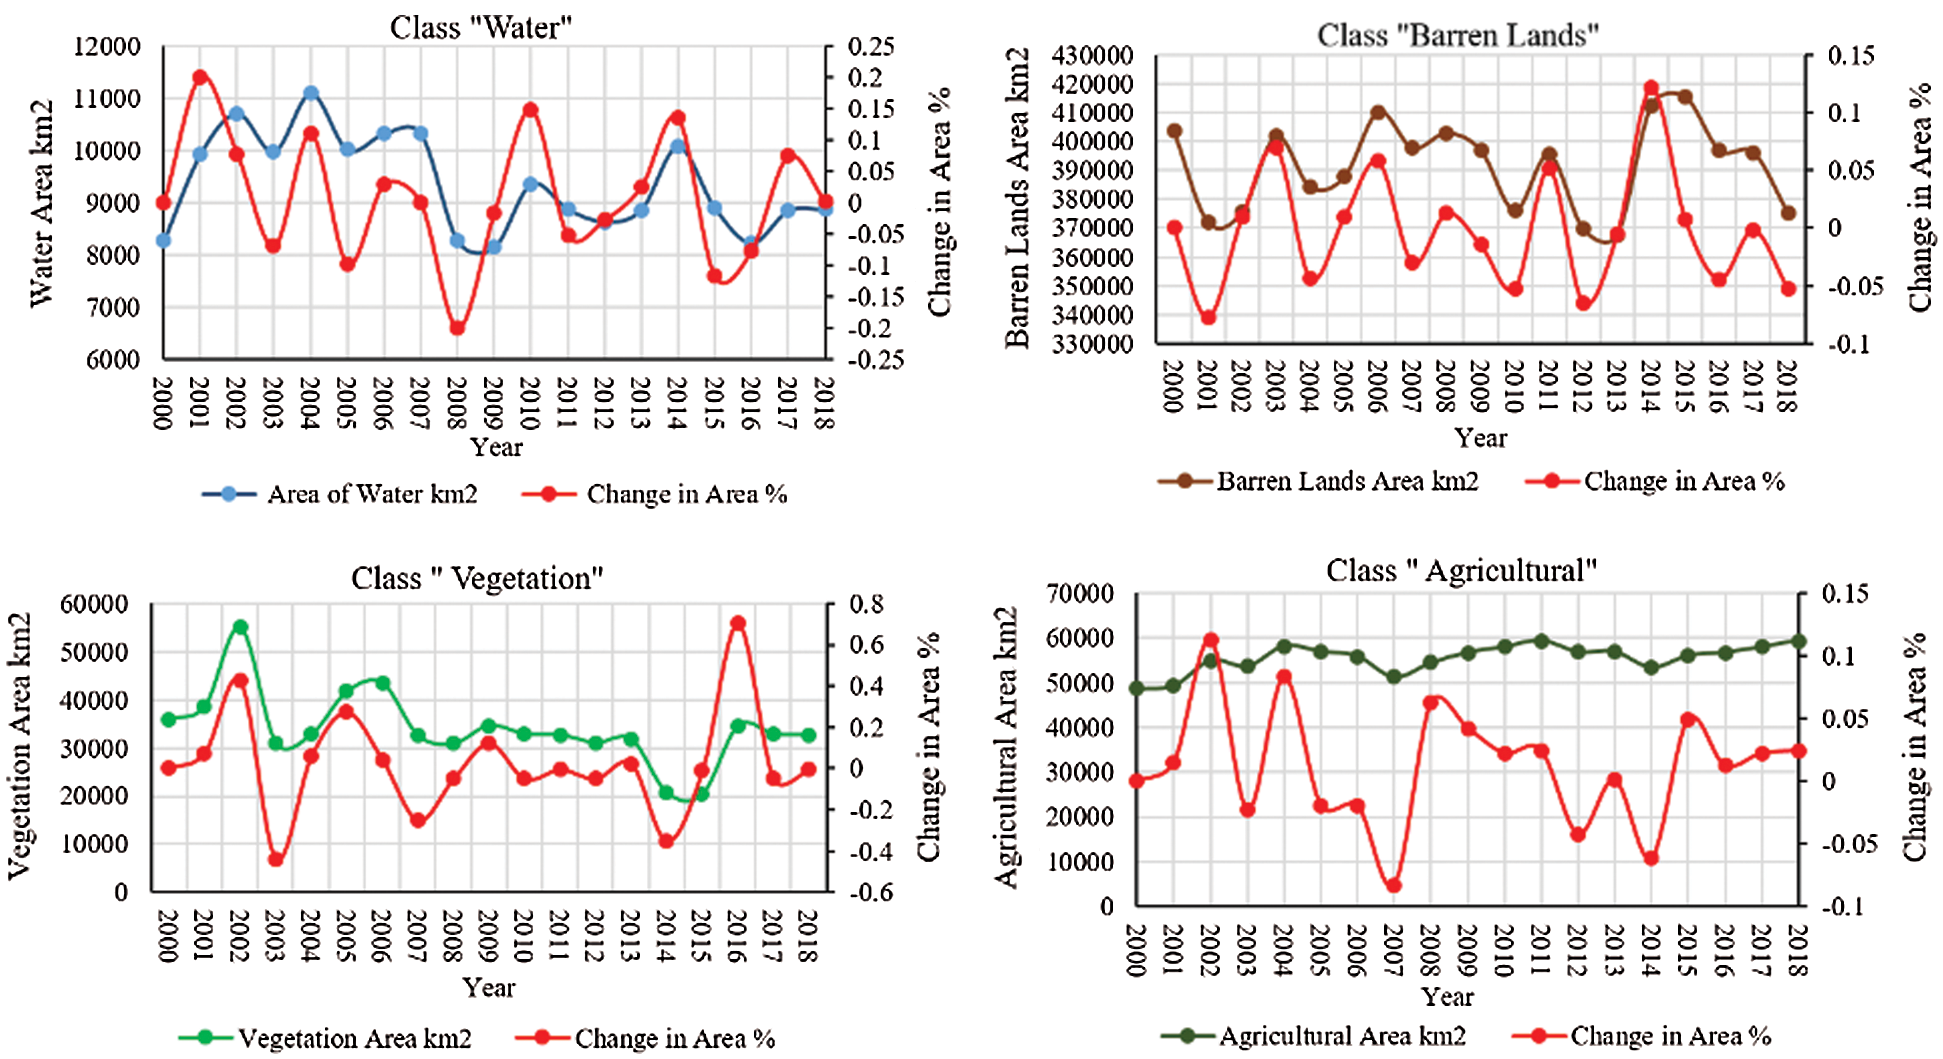
Figure 6: The relationship between Land use and land cover (LULC) and normalized difference vegetation index (NDVI) in the study area
Standardized analysis between the NDVI, LST, and average ground temperature values, from 2000 to 2018, is illustrated in Fig. 7. Note that all parameters are in a relationship that binds them to a specific format. When the LST and temperature are high, the NDVI values are low, indicating a decrease has occurred in the density of the vegetation cover as was observed in the period from 2003 to 2012. However, this also occurred in 2014, where this decrease in the density of the vegetation cover proves that climate change has been exacerbated and as a result caused desertification in the study area. Conversely, an increase in NDVI values can be observed when the LST and temperature decrease as seen during the period 2000 to 2003 and for 2012, 2016, and 2018, suggesting that the density of vegetation cover had increased. This may have been caused by the high rates of rainfall in those years or by the increase in the agricultural area used by humans. This analysis method can be considered a suitable and straightforward solution for the assessment of the effects of various drought factors in the region.
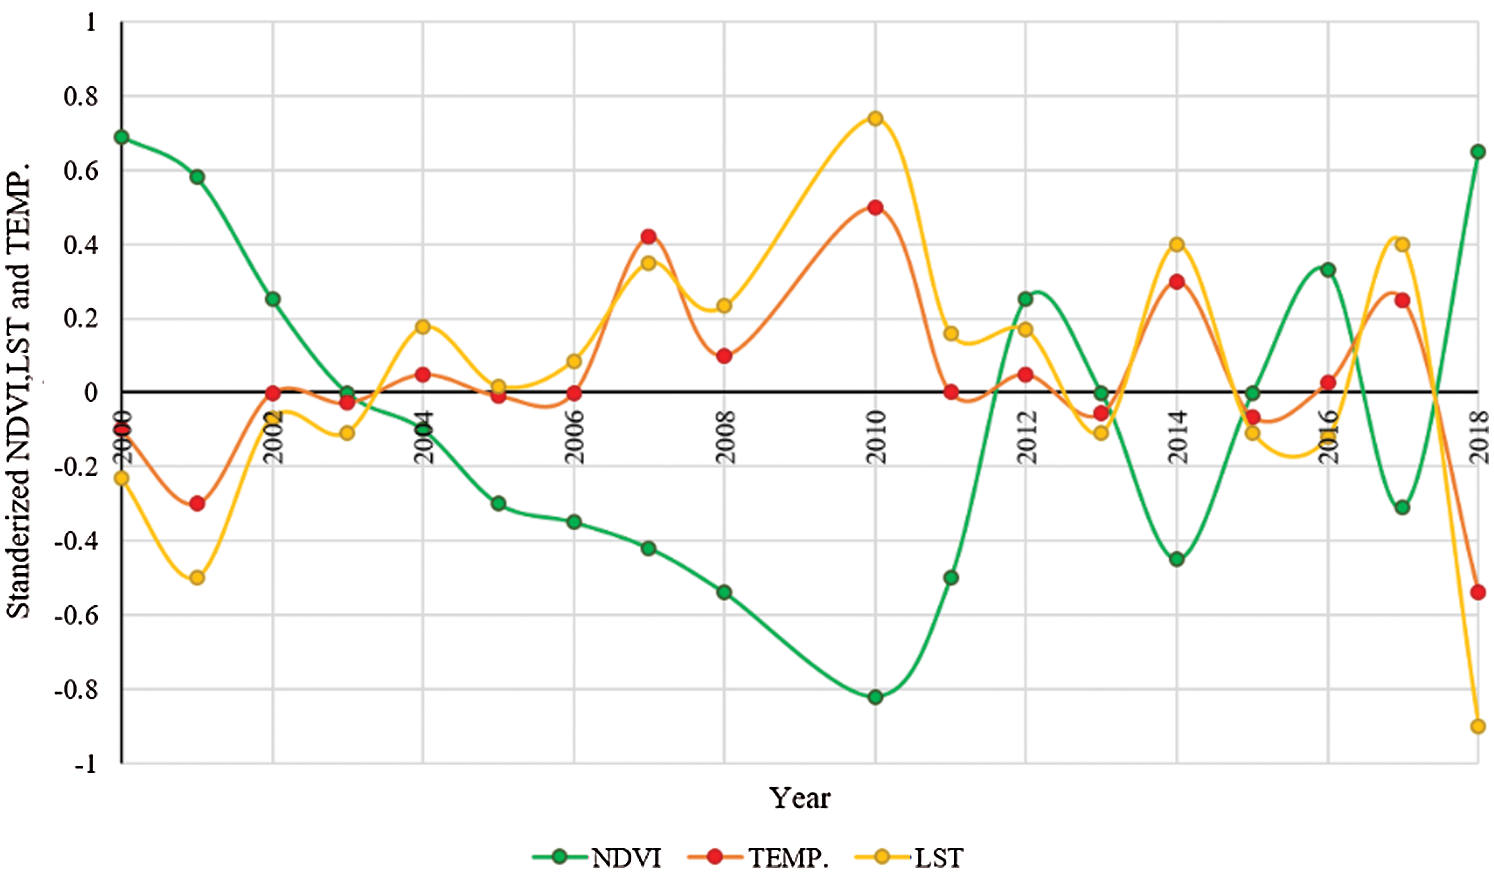
Figure 7: Standardised analysis results for the Normalized difference vegetation index (NDVI), land surface temperature (LST), and average ground temperature
As mentioned in many articles, water bodies and vegetation cover are often influenced by surface temperatures where this relationship can be simulated as a linear relationship [3,6,7,28,51]. In the present study, the total number of the metadata matrices of the NDVI and LST images were used to study the relationship between NDVI and LST to find the correlation between these two for the LULC classes (Fig. 8). This analysis shows a negative correlation existed between NDVI and LST for all LULC classes in the study area. In other words, the increase in surface temperature adversely affects the other LULC classes. The strength of the obtained negative correlation between the NDVI and the LST was analyzed using analyzing the Pearson correlation coefficient (r). This correlation varies between −1 (representing a perfect negative correlation), zero (represents no linear correlation), and +1 (representing a perfect positive correlation) [52], where the average between the NDVI and the LST Pearson Correlation Coefficient (r) was −0.64, and this proved a negative correlation existed between them. The Coefficient of Determination (R2) showed an excellent fitting negative relationship between the LST and the NDVI for all classes ranging from 0.54 to 0.9. Fluctuation in LST values indicates that these values directly affect the decrease or increase in LULC classes.
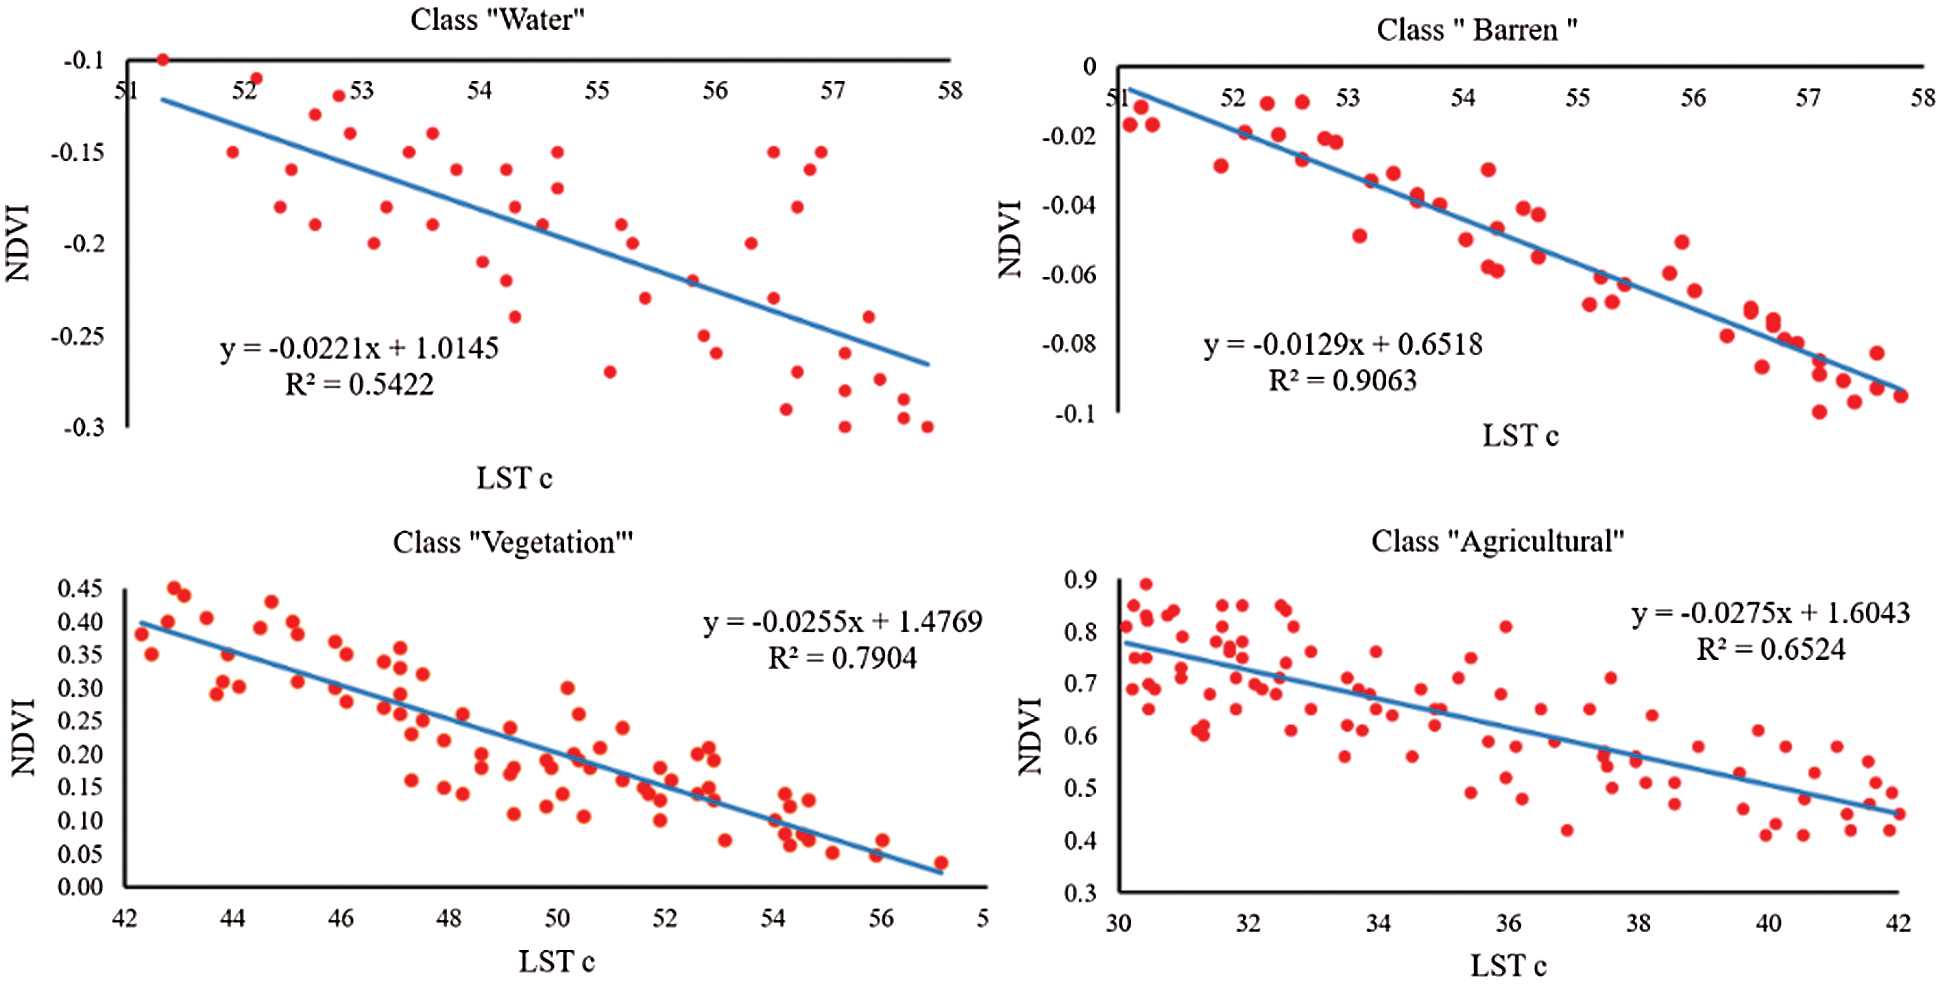
Figure 8: The relationship between Normalized difference vegetation index (NDVI) and land surface temperature (LST) as two-dimensional scatter plot analysis
Previous studies have analyzed the effects of climate change on LULC in some parts of Mesopotamia, as mentioned by [53] where some changes in the Mesopotamian marshland occurred during the period 1988–2017; the authors found that dramatic changes in vegetation cover occurred. As a large part of the region of Mesopotamia, all parts of Iraq suffer from major effects of climate change. The spatial extent of the desert area in the western part of Iraq increased to 2,287,000 km2 between 1990 and 2017 (studied period), as mentioned by [54]. Furthermore, Yahya et al. [5] found a reduction in annual runoff values in the studied period from 1992 to 2017, where the drought satiation fluctuated between moderate to extreme drought and increased in the desertified area of northwestern Iraq. According to the above, only some parts of the study area and corresponding study subject were analyzed. Our research provides a new vision of how climate change affects the entire study area through the interplay of several remote sensing and statistical analysis methods, which have been efficient in finding potential relationships between the variables under study and in achieving the primary goal of the study.
The complicated situation regarding climate variability in the region of Mesopotamia must be studied with caution. The variable changes in temperature, precipitation, and increase in SDS events should not be underestimated; this change in climate behavior would largely eliminate some species or change the composition of a combination of other species present in the study area. In the present study, MODIS products that have been shown to be efficient to many environmental applications, such as the detection of vegetation change, were used to assess the relationship between the LULC classes and the possibility of climate change occurring over time. Statistical analyses were done on the LST and NDVI to find any possible connection between increasing surface temperature and decreasing vegetation cover, reflecting the likelihood of increasing drought factors affecting the study area over time. Based on the present study’s results, the LULC categories should be monitored with caution, especially concerning the increase and decrease in the area of these classes over time. The use of higher resolution images would allow a more detailed analysis of the changes. Periodic monitoring of these classes will help land managers to develop the study area in several ways and reduce the opportunity for the occurrence of direct negative effects of erosion-related factors by increasing the spatial extent of vegetation cover at the expense of the barren land class, and thus, reduce the effects of potential desertification factors in the study area. Immediate solutions must be developed in the region of Mesopotamia in the hope of reducing this phenomenon, because the cultivation of windbreaks requires planting lines of unique carefully selected species of fast-growing trees in areas corresponding to prevailing surface winds. It is hoped that these windbreaks would stop the movement of dunes and reduce the risk of sand and dust storms events, especially in the western and southwestern parts of Mesopotamia.
Acknowledgement: Foremost, the authors express their sincere gratitude to the Iraqi Ministry of Higher Education and Scientific Research and Baghdad University of Technology for providing financial support. Furthermore, the authors are incredibly grateful to the Iraqi Ministry of Transportation for providing the necessary data.
Funding Statement: The author(s) received no specific funding for this study.
Conflicts of Interest: The authors declare that they have no conflicts of interest to report regarding the present study.
1. D. J. N. Young, J. T. Stevens, J. M. Earles, J. Moore, A. Ellis et al. (2017). , “Long-term climate and competition explain forest mortality patterns under extreme drought,” Ecology Letters, vol. 20, no. 1, pp. 78–86. [Google Scholar]
2. T. Ozturk, Z. P. Ceber, M. Türkeş and M. L. Kurnaz. (2015). “Projections of climate change in the Mediterranean basin by using downscaled global climate model outputs,” International Journal of Climatology, vol. 35, no. 14, pp. 4276–4292. [Google Scholar]
3. M. Türkeş and E. Erlat. (2018). “Variability and trends in record air temperature events of turkey and their associations with atmospheric oscillations and anomalous circulation patterns,” International Journal of Climatology, vol. 38, no. 14, pp. 5182–5204. [Google Scholar]
4. M. Türkeş and E. Erlat. (2009). “Winter mean temperature variability in Turkey associated with the North Atlantic oscillation,” Meteorology and Atmospheric Physics, vol. 105, no. 3–4, pp. 211–225. [Google Scholar]
5. B. M. Yahya and D. Z. Seker. (2019). “The impact of dust and sandstorms in increasing drought areas in Nineveh province, north-western Iraq,” Journal of Asian and African Studies, vol. 54, no. 3, pp. 346–359. [Google Scholar]
6. A. M. Dewan and Y. Yamaguchi. (2009). “Land use and land cover change in Greater Dhaka, Bangladesh: Using remote sensing to promote sustainable urbanization,” Applied Geography, vol. 29, no. 3, pp. 390–401. [Google Scholar]
7. C. R. Fichera, G. Modica and M. Pollino. (2017). “Land cover classification and change-detection analysis using multi-temporal remote sensed imagery and landscape metrics,” European Journal of Remote Sensing, vol. 45, no. 1, pp. 1–18. [Google Scholar]
8. M. Mohan and A. Kandya. (2015). “Impact of urbanization and land-use/land-cover change on diurnal temperature range: A case study of tropical urban airshed of India using remote sensing data,” Science of the Total Environment, vol. 506–507, pp. 453–465. [Google Scholar]
9. R. M. Ramachandran, P. S. Roy, V. Chakravarthi, J. Sanjay and P. K. Joshi. (2018). “Long-term land use and land cover changes (1920–2015) in eastern Ghats, India: Pattern of dynamics and challenges in plant species conservation,” Ecological Indicators, vol. 85, pp. 21–36. [Google Scholar]
10. S. Hepca, C. C. Hepcan, C. Kilicaslan, M. B. Ozkan and N. Kocan. (2012). “Analyzing landscape change and urban sprawl in a Mediterranean coastal landscape: A case study from Izmir,” Turkey Journal of Coastal Research, vol. 29, no. 2, pp. 301. [Google Scholar]
11. M. Luck and J. Wu. (2002). “A gradient analysis of urban landscape pattern: A case study from the Phoenix metropolitan region, Arizona, USA,” Landscape Ecology, vol. 17, no. 4, pp. 327–339. [Google Scholar]
12. J. Tang, L. Wang and Z. Yao. (2007). “Spatio-temporal urban landscape change analysis using the Markov chain model and a modified genetic algorithm,” International Journal of Remote Sensing, vol. 28, no. 15, pp. 3255–3271. [Google Scholar]
13. D. R. Archer, N. Forsythe, H. J. Fowler and S. M. Shah. (2010). “Sustainability of water resources management in the Indus Basin under changing climatic and socio-economic conditions,” Hydrology and Earth System Sciences, vol. 14, no. 8, pp. 1669–1680. [Google Scholar]
14. Z. Xin, J. Xu and W. Zheng. (2008). “Spatiotemporal variations of vegetation cover on the Chinese Loess Plateau (1981–2006Impacts of climate changes and human activities,” Science in China Series D: Earth Sciences, vol. 51, no. 1, pp. 67–78. [Google Scholar]
15. T. D. Prowse, C. Furgal, F. J. Wrona and J. D. Reist. (2009). “Implications of climate change for northern Canada: Freshwater, marine, and terrestrial ecosystems,” AMBIO: A Journal of the Human Environment, vol. 38, no. 5, pp. 282–289. [Google Scholar]
16. S. Kittipongvises. (2017). “Assessment of environmental impacts of limestone quarrying operations in Thailand,” Environmental and Climate Technologies, vol. 20, no. 1, pp. 67–83. [Google Scholar]
17. J. Yang, P. Gong, R. Fu, M. Zhang, J. Chen et al. (2013). , “The role of satellite remote sensing in climate change studies,” Nature Climate Change, vol. 3, no. 10, pp. 875–883. [Google Scholar]
18. J. Rogan and D. Chen. (2004). “Remote sensing technology for mapping and monitoring land-cover and land-use change,” Progress in Planning, vol. 61, no. 4, pp. 301–325. [Google Scholar]
19. S. Shen, P. Yue and C. Fan. (2019). “Quantitative assessment of land use dynamic variation using remote sensing data and landscape pattern in the Yangtze River Delta,” China Sustainable Computing: Informatics and Systems, vol. 23, pp. 111–119. [Google Scholar]
20. H. Alphan, H. Doygun and Y. I. Unlukaplan. (2009). “Post-classification comparison of land cover using multitemporal Landsat and ASTER imagery: The case of Kahramanmaraş,” Turkey Environmental Monitoring and Assessment, vol. 151, no. 1–4, pp. 327–336. [Google Scholar]
21. A. A. Othman, A. T. Shihab, A. F. Al-Maamar and Y. I. Al-Saady. (2019). “Monitoring of the land cover changes in Iraq,” in Environmental Remote Sensing and GIS in Iraq, vol. 11. Cham, Germany: Springer, pp.181–203. [Google Scholar]
22. D. L. Civco, J. D. Hurd, E. H. Wilson, M. Song and Z. Zhang. (2002). “A comparison of land use and land cover change detection methods,” ASPRS-ACSM Annual Conference, vol. 21, pp. 18–33. [Google Scholar]
23. O. Rozenstein and A. Karnieli. (2011). “Comparison of methods for land-use classification incorporating remote sensing and GIS inputs,” Applied Geography, vol. 31, no. 2, pp. 533–544. [Google Scholar]
24. L. Du, Q. Tian, T. Yu, Q. Meng, T. Jancso et al. (2013). , “A comprehensive drought monitoring method integrating MODIS and TRMM data,” International Journal of Applied Earth Observation and Geoinformation, vol. 23, pp. 245–253. [Google Scholar]
25. Y. Yao, N. Yang, Q. Qin and L. Zhu. (2008). “Relating surface albedo and vegetation index with surface dryness using Landsat ETM+ imagery,” in 2008 IEEE Int. Geoscience and Remote Sensing Symposium, Boston, MA, USA. IEEE, vol. 1, pp. 288–312. [Google Scholar]
26. R. Bajgain, X. Xiao, P. Wagle, J. Basara and Y. Zhou. (2015). “Sensitivity analysis of vegetation indices to drought over two tallgrass prairie sites,” ISPRS Journal of Photogrammetry and Remote Sensing, vol. 108, pp. 151–160. [Google Scholar]
27. A. Ghulam, Q. M. Qin, L. Wang, Z. M. Zhan and D. D. Wang. (2004). “Development of broadband albedo based ecological safety monitoring index,” in 2004 IEEE Int. Geoscience and Remote Sensing Symposium, Anchorage, AK, vol. 6, pp. 4115–4118. [Google Scholar]
28. G. Dall’Olmo and A. Karnieli. (2010). “Monitoring phenological cycles of desert ecosystems using NDVI and LST data derived from NOAA-AVHRR imagery,” International Journal of Remote Sensing, vol. 23, no. 19, pp. 4055–4071. [Google Scholar]
29. A. T. Tolosa. (2019). “Modeling the implication of land use land cover change on soil erosion by using remote sensing data and GIS based MCE techniques in the highlands of Ethiopia,” International Journal of Environmental Monitoring and Analysis, vol. 6, no. 6, pp. 152–166. [Google Scholar]
30. R. Shukla and D. Khare. (2019). “Land use/land cover change detection of Indira Sagar canal command area using integrated remote sensing and GIS tools,” Journal of Space Science and Technology, vol. 2, no. 2, pp. 27–35. [Google Scholar]
31. M. Ramazzotti, P. M. Buscema and G. Massini. (2018). “Landscape archaeology and artificial intelligence: The neural hypersurface of the mesopotamian urban revolution,” in Cyber Research on the Ancient Near East and Neighboring Regions, pp. 60–83, . Available: https://brill.com/view/book/edcoll/9789004375086/B9789004375086_004.xml?body=pdf-38294. [Google Scholar]
32. N. Richard. (2020). “History of Mesopotamia,” . Available: https://www.britannica.com/place/Mesopotamia-historical-region-Asia. [Google Scholar]
33. UNISDR. (2009). Drought Risk Reduction Framework and Practices: Contributing to the Implementation of the Hydro Framework for Action. Geneva, Switzerland: United Nations secretariat of the International Strategy for Disaster Reduction. [Google Scholar]
34. M. Kobler. (2013). “Dust storms of Iraq, UN secretary general for Iraq,” in A Ministerial Meeting, Nairobi, Kenya, . Available: http://www.term123.com/dust-storms-of-iraq/#mh32BcOB4S6cRkIG.99. [Google Scholar]
35. M. Türkeş. (2017). “Recent spatiotemporal variations of synoptic meteorological sand and dust storm events observed over the middle east and surrounding regions,” in 5th Int. Workshop on SDS, Istanbul, Turkey, pp. 23–25. [Google Scholar]
36. J. E. Gross, W. G. Carlos, C. S. Dela Cruz, P. Harber and S. Jamil. (2018). “Sand and dust storms: Acute exposure and threats to respiratory health,” American Journal of Respiratory and Critical Care Medicine, vol. 198, no. 7, pp. 13–14. [Google Scholar]
37. A. Al-Hemoud, A. Al-Dousari, A. Al-Shatti, A. Al-Khayat, W. Behbehani et al. (2018). , “Health impact assessment associated with exposure to PM10 and dust storms in Kuwait,” Atmosphere, vol. 9, no. 1, pp. 6. [Google Scholar]
38. Z. Li and J. M. Fox. (2012). “Mapping rubber tree growth in mainland southeast Asia using time-series MODIS 250 m NDVI and statistical data,” Applied Geography, vol. 32, no. 2, pp. 420–432. [Google Scholar]
39. Url-2. Available: https://lpdaac.usgs.gov. [Google Scholar]
40. Z. Wan. (2008). “New refinements and validation of the MODIS land-surface temperature/emissivity products,” Remote Sensing of Environment, vol. 112, no. 1, pp. 59–74. [Google Scholar]
41. Iraqi meteorological network data, documentation. Available: http://www.agromet.gov.iq. [Google Scholar]
42. B. M. Yahya and D. Z. Seker. (2018). “Designing weather forecasting model using computational intelligence tools,” Applied Artificial Intelligence, vol. 33, no. 2, pp. 137–151. [Google Scholar]
43. J. Gu, X. Li, C. Huang and G. S. Okin. (2009). “A simplified data assimilation method for reconstructing time-series MODIS NDVI data,” Advances in Space Research, vol. 44, no. 4, pp. 501–509. [Google Scholar]
44. J. Rouse, J. W. R. H. Haas, J. A. Schell and D. W. Deering. (1973). “Monitoring the vernal advancement and retro gradation (green wave effect) of natural vegetation,” American Journal of Respiratory and Critical Care Medicine,vol. 198, no. 7, pp. 13–14. [Google Scholar]
45. J. Khan, P. Wang, Y. Xie, L. Wang and L. Li. (2018). “Mapping MODIS LST NDVI imagery for drought monitoring in Punjab Pakistan,” IEEE Access, vol. 6, pp. 19898–19911. [Google Scholar]
46. C. Huang, X. Li and L. Lu. (2008). “Retrieving soil temperature profile by assimilating MODIS LST products with ensemble Kalman filter,” Remote Sensing of Environment, vol. 112, no. 4, pp. 1320-1336. [Google Scholar]
47. Q. Sun, J. Tan and Y. Xu. (2009). “An ERDAS image processing method for retrieving LST and describing urban heat evolution: A case study in the Pearl River Delta Region in South China,” Environmental Earth Sciences, vol. 59, no. 5, pp. 1047–1055. [Google Scholar]
48. F. Sattari and M. Hashim. (2014). “A brief review of land surface temperature retrieval methods from thermal satellite sensors,” Middle-East Journal of Scientific Research, vol. 22, no. 5, pp. 757–768. [Google Scholar]
49. S. Sruthi and M. A. M. Aslam. (2015). “Agricultural drought analysis using the NDVI and land surface temperature data: A case study of Raichur district,” Aquatic Procedia, vol. 4, pp. 1258–1264. [Google Scholar]
50. C. B. Karakus. (2019). “The impact of land use/land cover (LULC) changes on land surface temperature in Sivas city center and its surroundings and assessment of urban heat island,” Asia-Pacific Journal of Atmospheric Sciences, vol. 55, no. 4, pp. 669–684. [Google Scholar]
51. M. Raynolds, J. Comiso, D. Walker and D. Verbyla. (2008). “Relationship between satellite-derived land surface temperatures, arctic vegetation types, and NDVI,” Remote Sensing of Environment, vol. 112, no. 4, pp. 1884–1894. [Google Scholar]
52. V. K. Sissakian, N. Al-Ansari, N. Adamo, M. Abdullah and J. Laue. (2020). “Desertification and salinisation of the Mesopotamian plain: A critical review,” Journal of Earth Sciences and Geotechnical Engineering, vol. 10, no. 4, pp. 125–142. [Google Scholar]
53. S. M. Jaber. (2019). “On the relationship between normalized difference vegetation index and land surface temperature: MODIS-based analysis in a semi-arid to arid environment,” Geocarto International, pp. 1–19. [Google Scholar]
54. H. M. Kim, B. K. Kim and K. S. You. (2005). “A statistic correlation analysis algorithm between land surface temperature and vegetation index,” Journal of Information Processing Systems, vol. 1, no. 1, pp. 102–106. [Google Scholar]
 | This work is licensed under a Creative Commons Attribution 4.0 International License, which permits unrestricted use, distribution, and reproduction in any medium, provided the original work is properly cited. |