DOI:10.32604/cmc.2021.013014
| Computers, Materials & Continua DOI:10.32604/cmc.2021.013014 | |
| Article |
Test Case Generation from UML-Diagrams Using Genetic Algorithm
1Department of Computer Science & Engineering, Ajay Binay Institute of Technology, Cuttack, 753014, India
2Department of Information Technology, Faculty of Computing and IT, King Abdulaziz University, Jeddah, 21589, Saudi Arabia
3Department of Industrial Engineering, University of Ha’il, College of Engineering, Hail, 2440, Saudi Arabia
4Faculty of Information Technology, Industrial University of Ho chi Minh City, 700000, Vietnam
5Department of Computer Science and Engineering, FST, IFHE, Hyderabad, 501203, India
6Department of Computer Science and Engineering, ITER, SOA Deemed to be University, Bhubaneswar, 751030, India
*Corresponding Author: Morched Derbali. Email: mderbali@kau.edu.sa
Received: 30 August 2020; Accepted: 20 December 2020
Abstract: Software testing has been attracting a lot of attention for effective software development. In model driven approach, Unified Modelling Language (UML) is a conceptual modelling approach for obligations and other features of the system in a model-driven methodology. Specialized tools interpret these models into other software artifacts such as code, test data and documentation. The generation of test cases permits the appropriate test data to be determined that have the aptitude to ascertain the requirements. This paper focuses on optimizing the test data obtained from UML activity and state chart diagrams by using Basic Genetic Algorithm (BGA). For generating the test cases, both diagrams were converted into their corresponding intermediate graphical forms namely, Activity Diagram Graph (ADG) and State Chart Diagram Graph (SCDG). Then both graphs will be combined to form a single graph called, Activity State Chart Diagram Graph (ASCDG). Both graphs were then joined to create a single graph known as the Activity State Chart Diagram Graph (ASCDG). Next, the ASCDG will be optimized using BGA to generate the test data. A case study involving a withdrawal from the automated teller machine (ATM) of a bank was employed to demonstrate the approach. The approach successfully identified defects in various ATM functions such as messaging and operation.
Keywords: Genetic algorithm; generation of test data and optimization; state-chart diagram; activity diagram; model-driven approach
Software testing is a vital yet resource-intensive portion of the software development life cycle that uses up a considerable share of the budget as well as time. Testing automation is a routine and essential part of the software development path in our efforts to address these concerns. A test case can be mined automatically from different Unified Modelling Language (UML) models. When software testing is carried out on such test cases with adequate test data, it enhances trust in the software produced. In addition, test data can be mined from the test cases that use the test specifications [1]. Making test cases often focuses exclusively on specifying requirements and may neglect factors of system implementation leading to low test coverage. A mechanized generation of test cases derives data from the provided models (for example, UML diagrams) and converts them into specification-centred test data. UML modelling generates a graphical depiction of the framework. It is a semi-formal language of visualization that is used to design and improve intricate systems as well as to generate test cases [2–4]. Automated testing is employed to improve the dependability of the solution and to save costs and reduce time.
Model-driven testing is used to mechanically devise test cases by means of models with system features and software stipulations. It also provides details about the software specifications that can be executed. This type of testing describes the behavioural, systemic dimensions for employing the software [5,6]. Model-driven testing is therefore a technique through which the test cases are created automatically from the stated model. In this approach, test cases are defined via system under test (SUT) elements. The model reflects the abstract actions of the system. Test cases guided by the model should not be performed against the behavioural model of the system. Various techniques automatically produce and optimize the apt test cases against the anticipated output that is generated by utilizing the test stipulations of the system.
In the case of a genetic algorithm (GA), every person is chosen on the basis of the populace-based candidate solution for the problem. The relevant GA facets are crossover, selection, and mutation. The key steps of the GA are as follows: First is the initialization of individuals. Next comes choosing the best person utilising the Roulette Wheel approach. Crossover is then employed for generating the most appropriate solution and generating the finest strings by mutation. The GA seeks the best possible solution from several likely solutions within a search field. The GA depends on an approach that is purely a globally random search. A GA is an optimization algorithm that is obtained from consideration of natural selection and evolution and is commonly utilized to address intricate issues. The GA produces a preliminary number of different populaces. It then creates the succeeding generation through crossover and mutation, which produces a fresh batch of individuals [7,8]. This study tackles the problem of redundancy and optimisation of the test case. Furthermore, it employs the GA for the optimization of the random test cases. The findings of the GA are discussed in the following section of this paper.
In this study, we consider the Automatic Teller machine (ATM) as an example for our approach. The ATM is a machine that mainly dispenses cash money and performs several automatic banking services. This machine is convenient. It allows customers to perform quick self-service transactions such as cash withdrawals, deposits, mutual account transactions, and bill payments. However, conventional ATM services are inefficient and time-consuming. The optimization of withdrawal operations at ATMs helps decrease financial inefficiencies due to unused stocked cash. Predicting cash demand is very challenging because of the unpredictability of withdrawal operations. Moreover, these specific processes are characterized by huge inherent redundancy dynamics and large sets of randomized test cases [9–11]. Subsequently, the key motivation of our research is to develop an advanced strategy for optimization that enhances the performance of specific unpredicted behavioral dynamics in processes in cases with random redundant states. This work will be developed using a Basic Genetic Algorithm (BGA).
This paper is organized as follows. Section 2 presents a synopsis of the literature for this research field. Section 3 presents the recommended system and also elucidates the Activity State Chart Diagram Graph (ASCDG). Section 4 defines the approach and presents the discussion and simulation outcomes. Lastly, Section 5 describes the conclusion and makes recommendations for future work.
Test cases are produced and optimized by requirement stipulations and, in particular, by the program code that can be tough to imbrute [12].
Researchers have focused on a technique that looks at how test cases are produced but are not optimized using the Hybrid Particle Swarm Optimization (HPSO) algorithm [13]. In this scenario, this algorithm functions competently in regression testing.
The Ant Colony Optimization (ACO) algorithm, a state-based system, has also been used in software testing [14]. Furthermore, the researchers formulated a tool that generates a directed graph where the test cases are produced to accomplish the test coverage norms for all states. However, in this scenario, the test cases were not enhanced.
In a comparative study, Abdul et al. [15] elucidated how test cases are devised through different methodologies utilising Particle Swarm Optimization (PSO). They also described how the test cases are produced and optimized with the aid of UML models. Test case settings could be mined from an activity diagram [16]. Such diagrams are then transformed into a Control Flow Graph (CFG). However, this approach is time consuming and might be computationally costly.
Another study described a technique that is utilized to produce the test cases from combinational UML diagrams such as sequence and activity diagrams [17]. The corresponding system diagram graph is then produced and navigated through Depth First Search (DFS). This technique is employed for ATM card authentication. However, the test cases are not enhanced.
Researchers have elucidated how the test cases are spawned from a combinational diagram such as a sequence and use case diagram [18]. The combinational system graph is subsequently produced. However, the test cases are not augmented. Dalai et al. [19] utilized a technique that produced the test cases from combinational diagrams such as activity and sequence diagrams. The corresponding system graph is then produced and traversed. However, the researchers did not look at the optimization of the test case.
Suresh et al. [1] presented a methodology that elucidates the attributes of genetic algorithms along with the test data. This approach uses basis path testing such that optimization is attained in the creation of test data. The testing effort and the time taken for the analysis are therefore decreased.
The creation and optimization of test cases has been carried out by means of various soft computing methods centered on test coverage norms within a Java setting [20]. This includes a case study and a triangle classifier problem. Sahoo et al. [21] provided a method where the test cases are produced and optimised by means of an activity diagram and the cuckoo search algorithm. They also created test paths from activity diagram graphs by considering a case study such as the bank ATM.
The authors of another study stated that the best possible optimisation methods should be utilised in finding solutions for multi-objective functions [22]. The recommendation of optimization techniques is performed with proficient software-testing criteria. Sequence and state chart diagrams were utilized by Khurana et al. [23] for generating test cases. Next, test cases were optimized using the GA. However, this is not an automated method for test scenario generation.
Explanations about test case generation and optimization from UML models instead of combinational models [24] have been presented. However, the researchers did not utilize an automated approach. Moreover, not all faults were covered by this method.
The following constraints have been noted and require further work.
1. Most studies explain the generation and optimization of test data but fail to take execution time into consideration.
2. Most studies have not focused on test scenarios.
3. Most research has not focused on model-driven testing techniques.
This study describes and evaluates a method that uses GA to generate test cases from UML diagrams.
3.1 Basic Genetic Optimization Algorithm
Problems of prediction for heuristic data are challenging due to the random and redundant features of such time series and the conventional global-learning models used for computational intelligence [25]. These processes are characterized mainly by their generalized learning comportments but fail to fully account for the dynamic complexity of such real-life time data sets in a proficient way. This research proposes to implement a GA-optimizing technique to develop an automated strategy that can generate the dependence table and control flow graph accurately and quickly. The GA, which serves as a digital model of human reasoning, can incorporate local training to represent the unpredicted dynamics of a heuristic time series in an efficient way [26]. Equally important, the GA approach is selected here due to its quick convergence and ability to avoid being trapped in a local optimum similar to conventional methods that start from a single point. The GA technique is also able to operate when the objective function is not smooth, and there are many parameters. It is highly efficient in case of a noisy or stochastic objective function. Finally, the use of GAs in this work is amply justified by the need to use probabilistic selection rules and not deterministic ones [27].
The GA implements the rules of transformation of individuals and provides a solution to these constraints. It identifies all suitable individuals by observing their values for functional fitness before combining these individuals and their values to create new potential candidate solutions.
The most crucial steps are
• Generation or initialization of individuals.
• Choosing the best individuals using roulette wheel selection.
• Crossover to create enhanced solutions from the best solution.
• Mutation to generate best strings.
The GA flowchart is shown in Fig. 1.
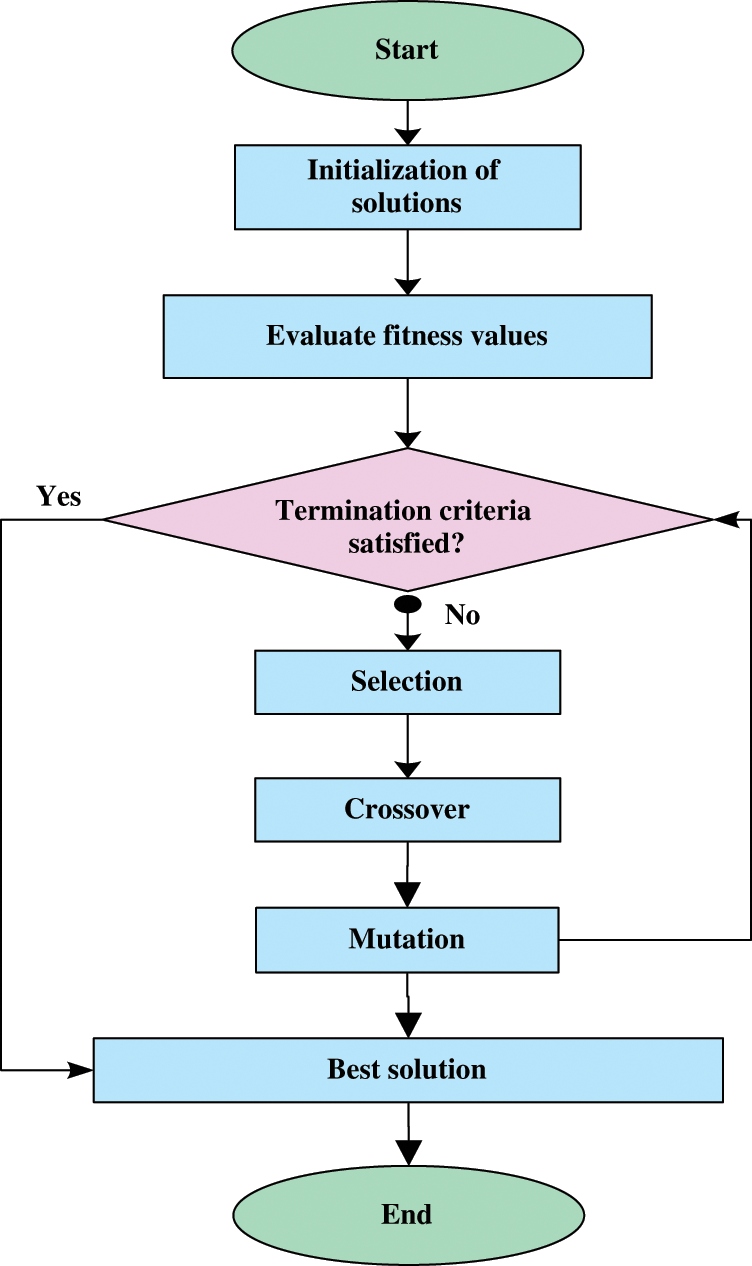
Figure 1: Flowchart of the BGA process
3.2 Transformation of Activity Diagram into Activity Diagram Graph
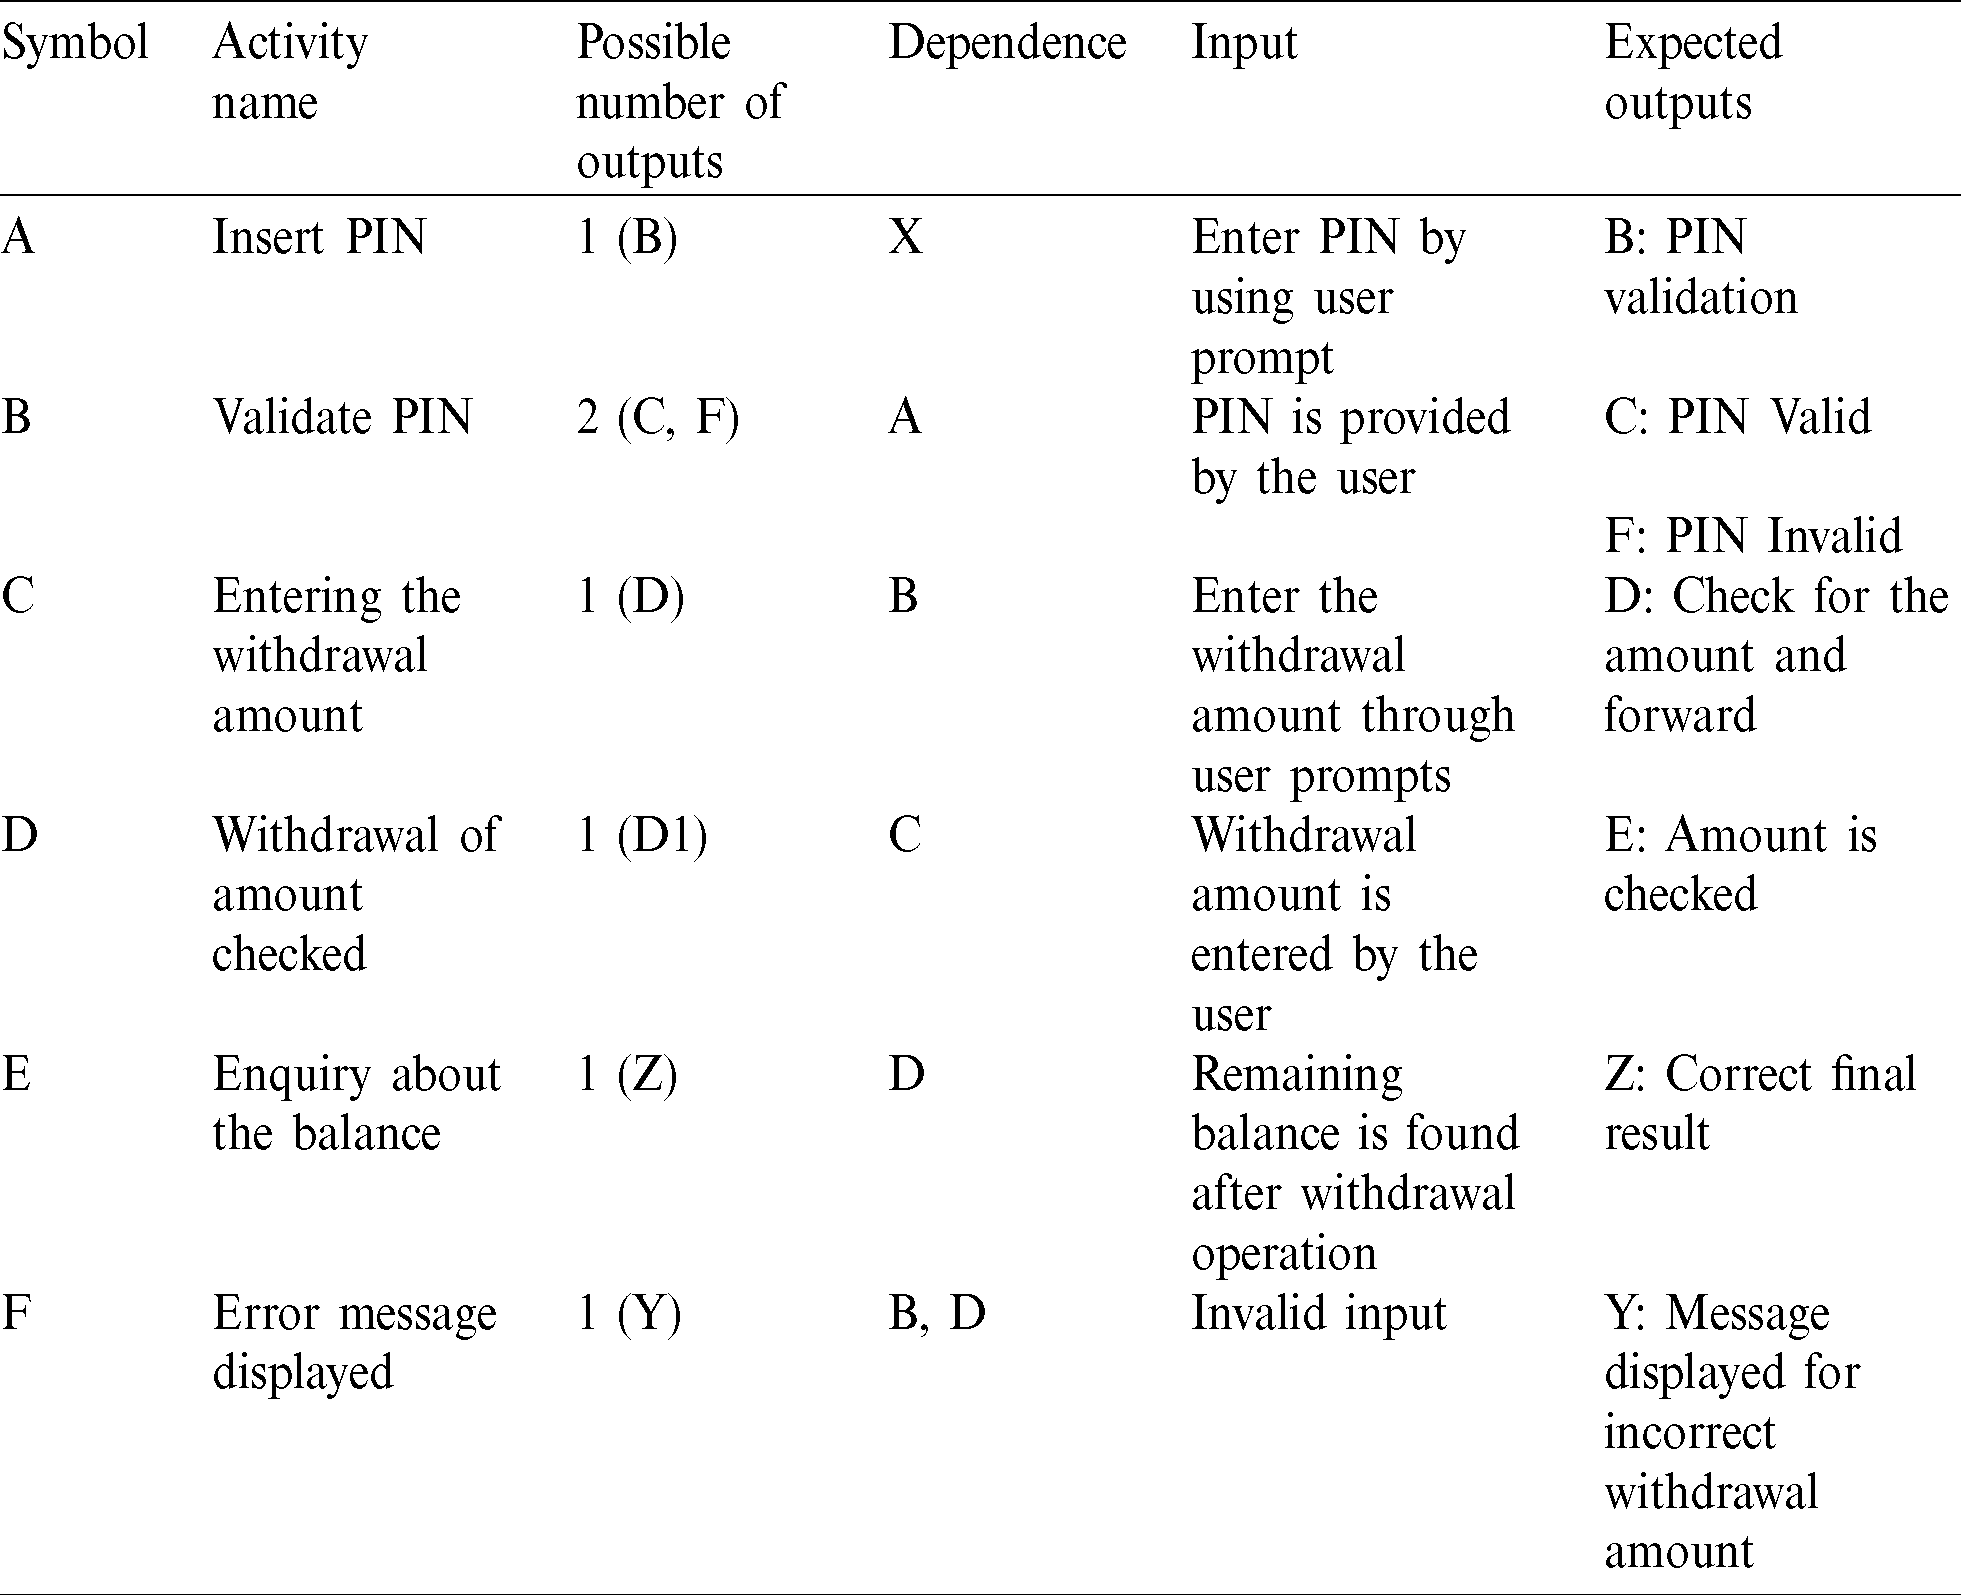
The activity diagram offers a way to symbolize the step-by-step business workflow and relates to operational components. The activity diagram and the corresponding graph (ADG) that describe the general operation of a bank ATM as presented earlier [28–30] are shown in Figs. 2a and 2b. The dependence table of ADG is shown in Tab. 1.
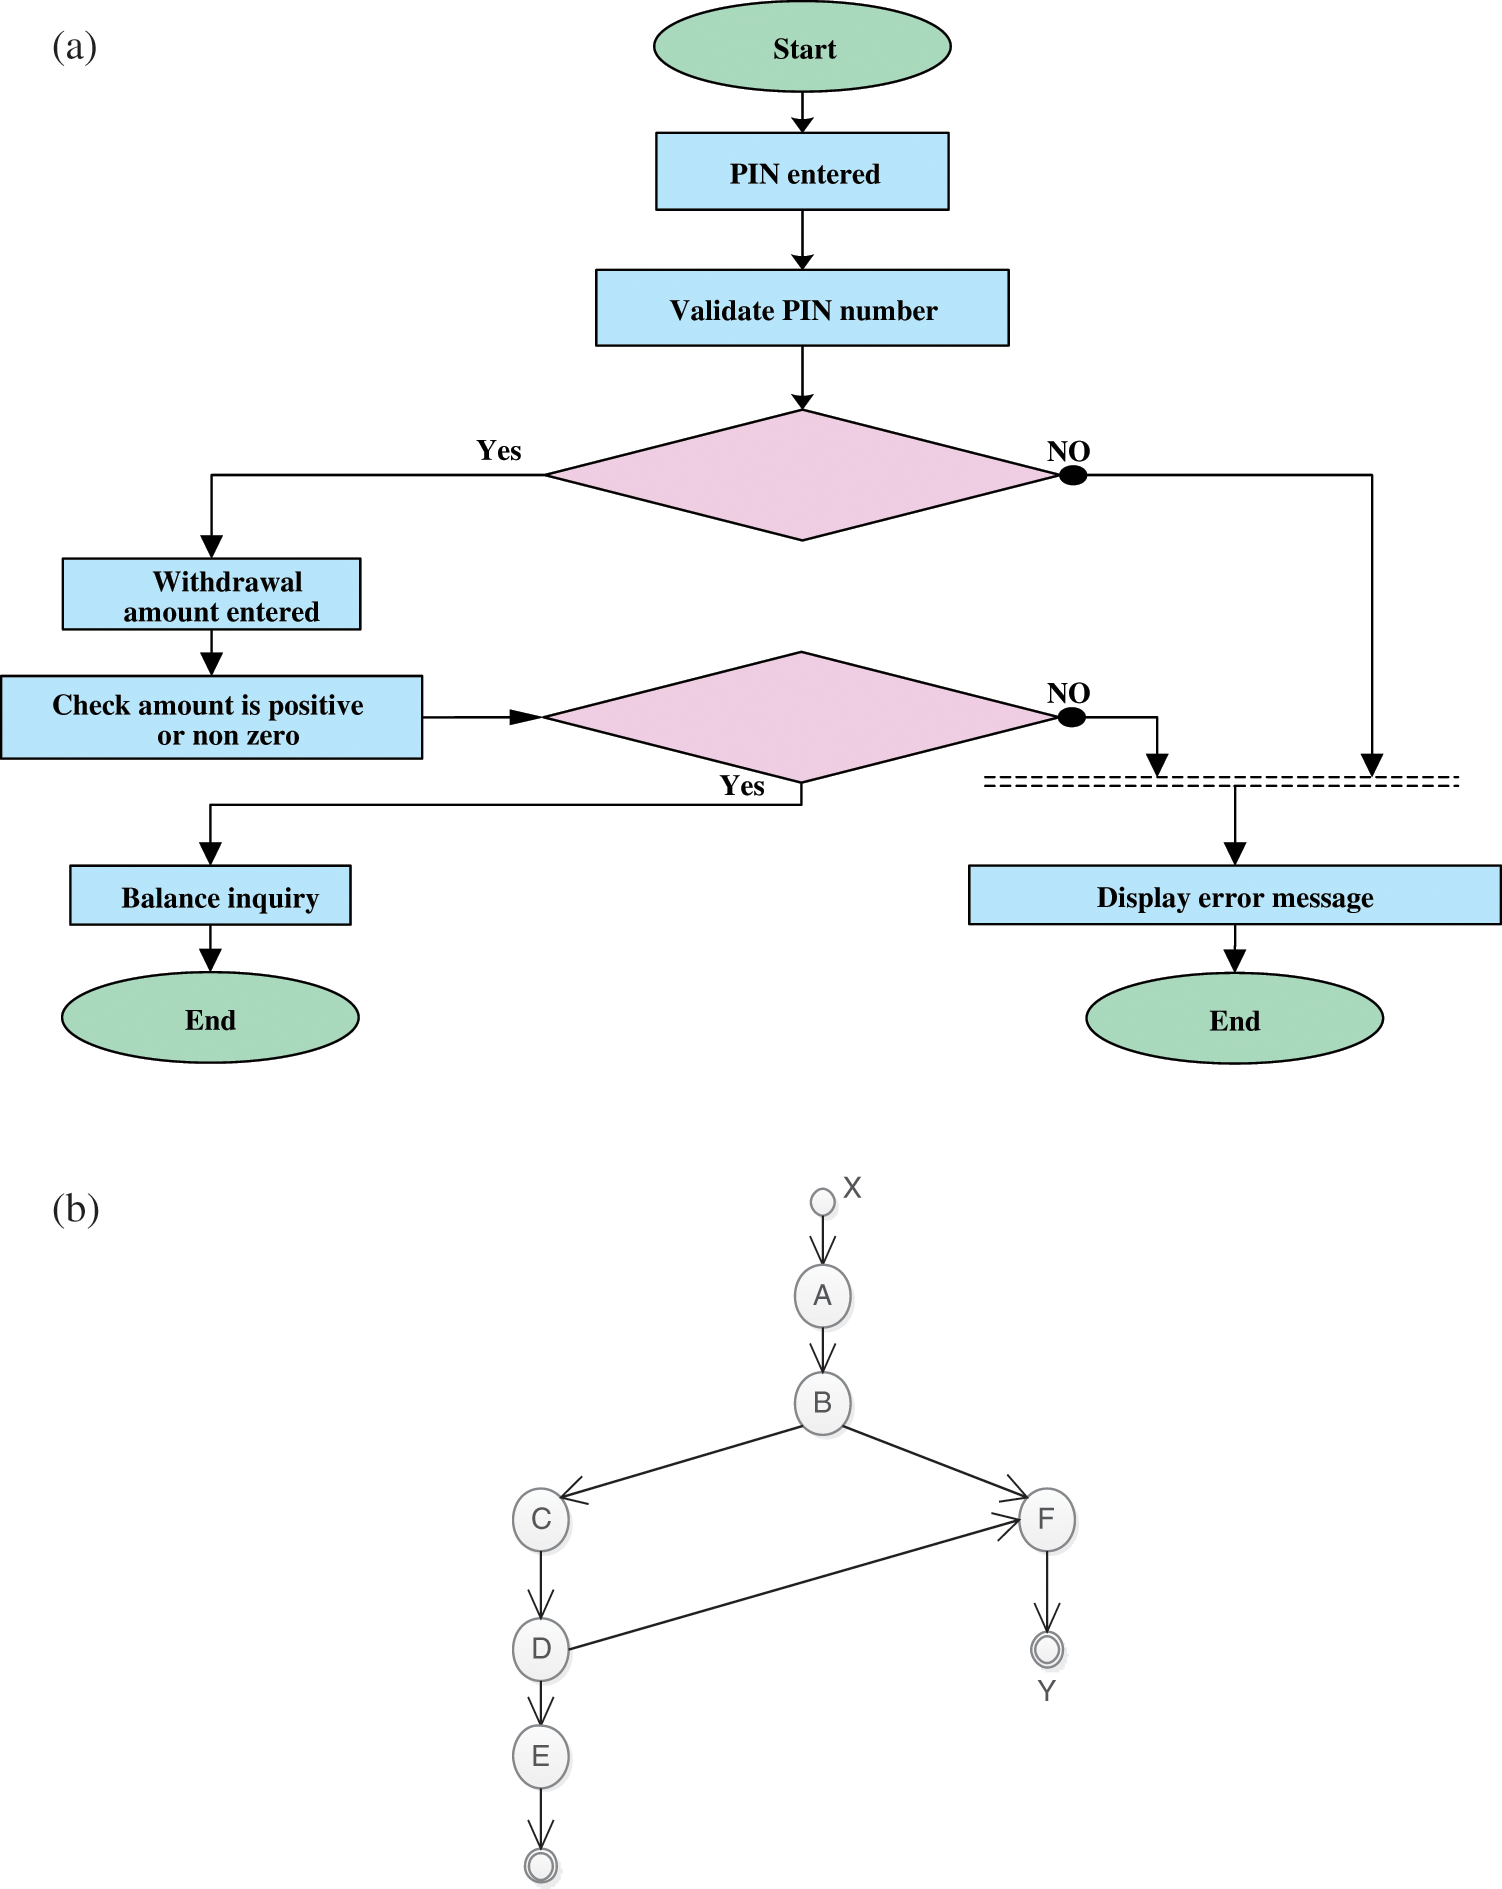
Figure 2: (a) Activity diagram of overall operations of a bank ATM. (b) ADG of a bank ATM
Table 1: Dependence table for overview of ATM operation
3.3 State Chart to State Chart Graph Transformation
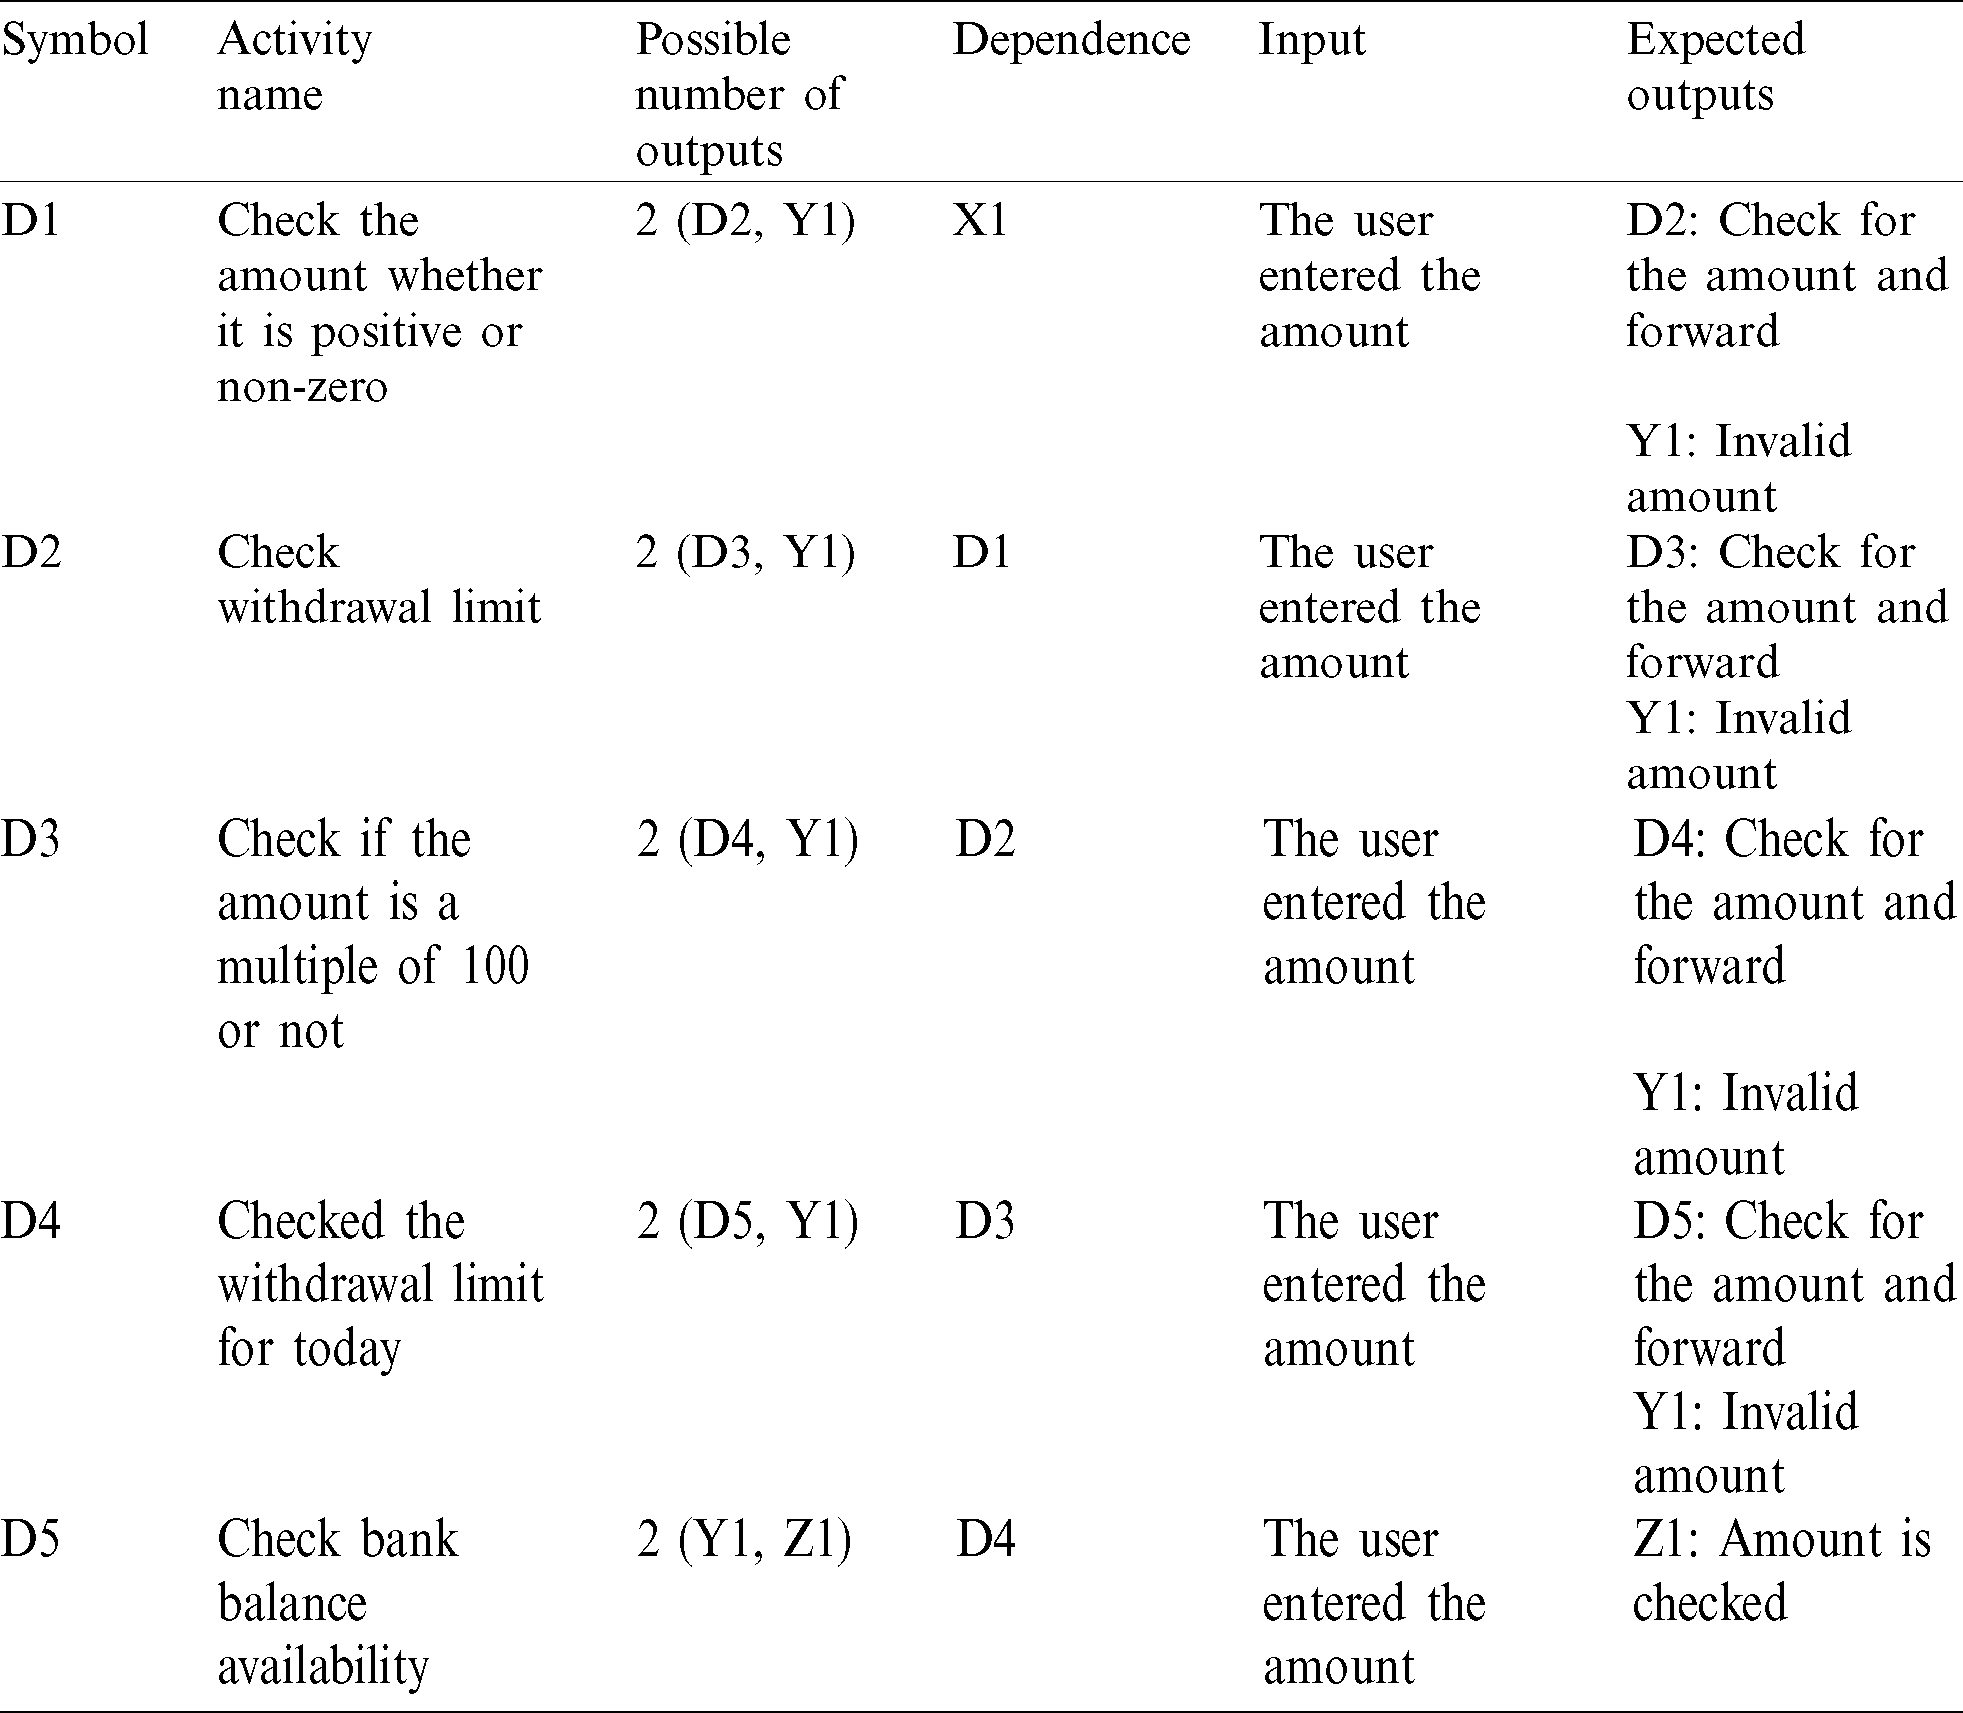
The state chart mostly offers descriptions of state transitions. It also focuses on the events that influence state changes. The state chart diagram (SCD) and its corresponding diagram (SCDG) are shown in Figs. 3a and 3b along with the withdrawal operations of the ATM bank. Moreover, the dependence table of SCDG is shown in Tab. 2.
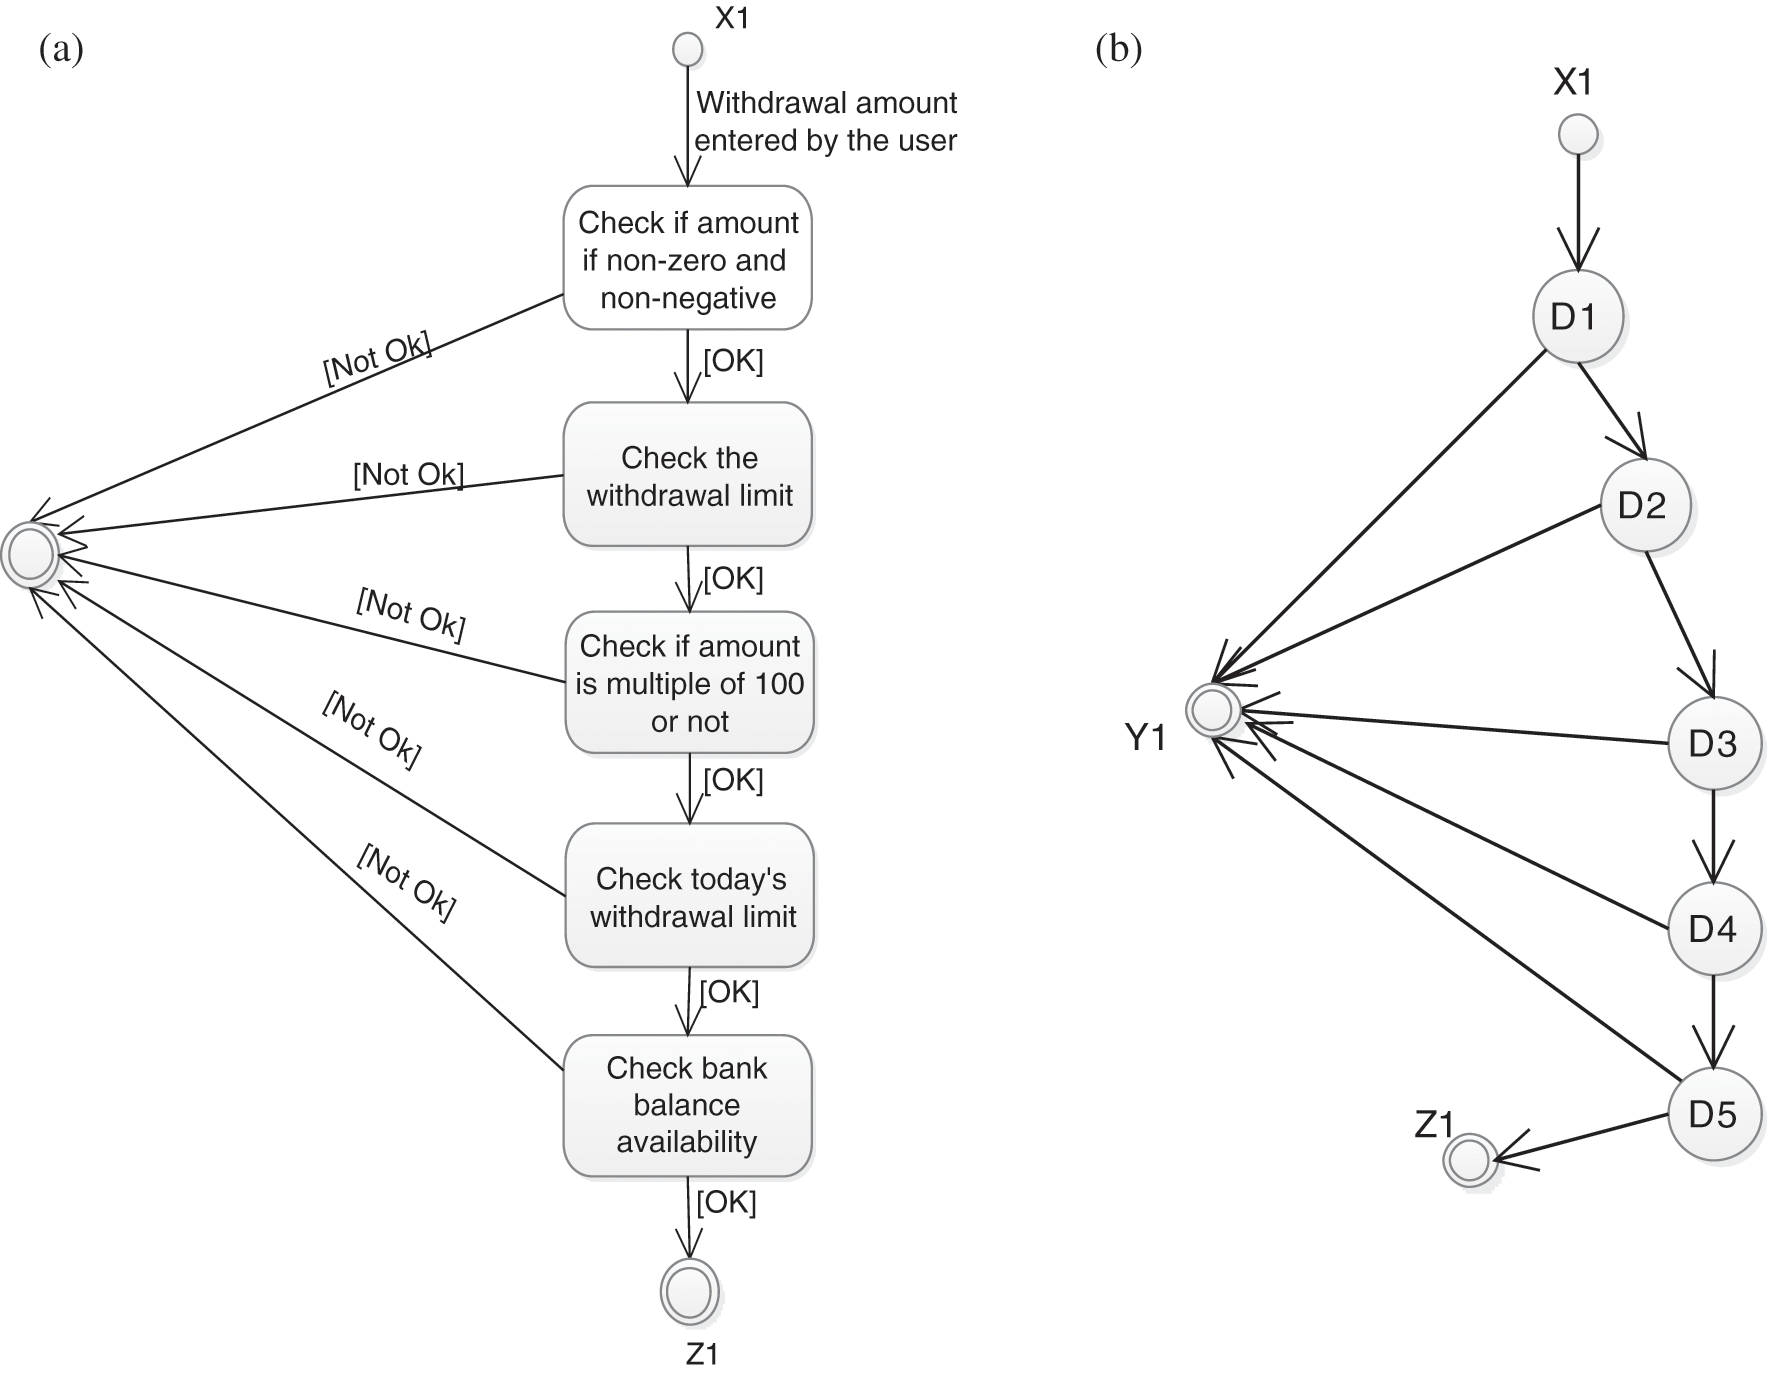
Figure 3: (a) SCD and (b) SCDG of a bank ATM operation
Table 2: Dependence table for an ATM cash withdrawal
3.4 Assimilation of ADG and SCDG into ASCDG
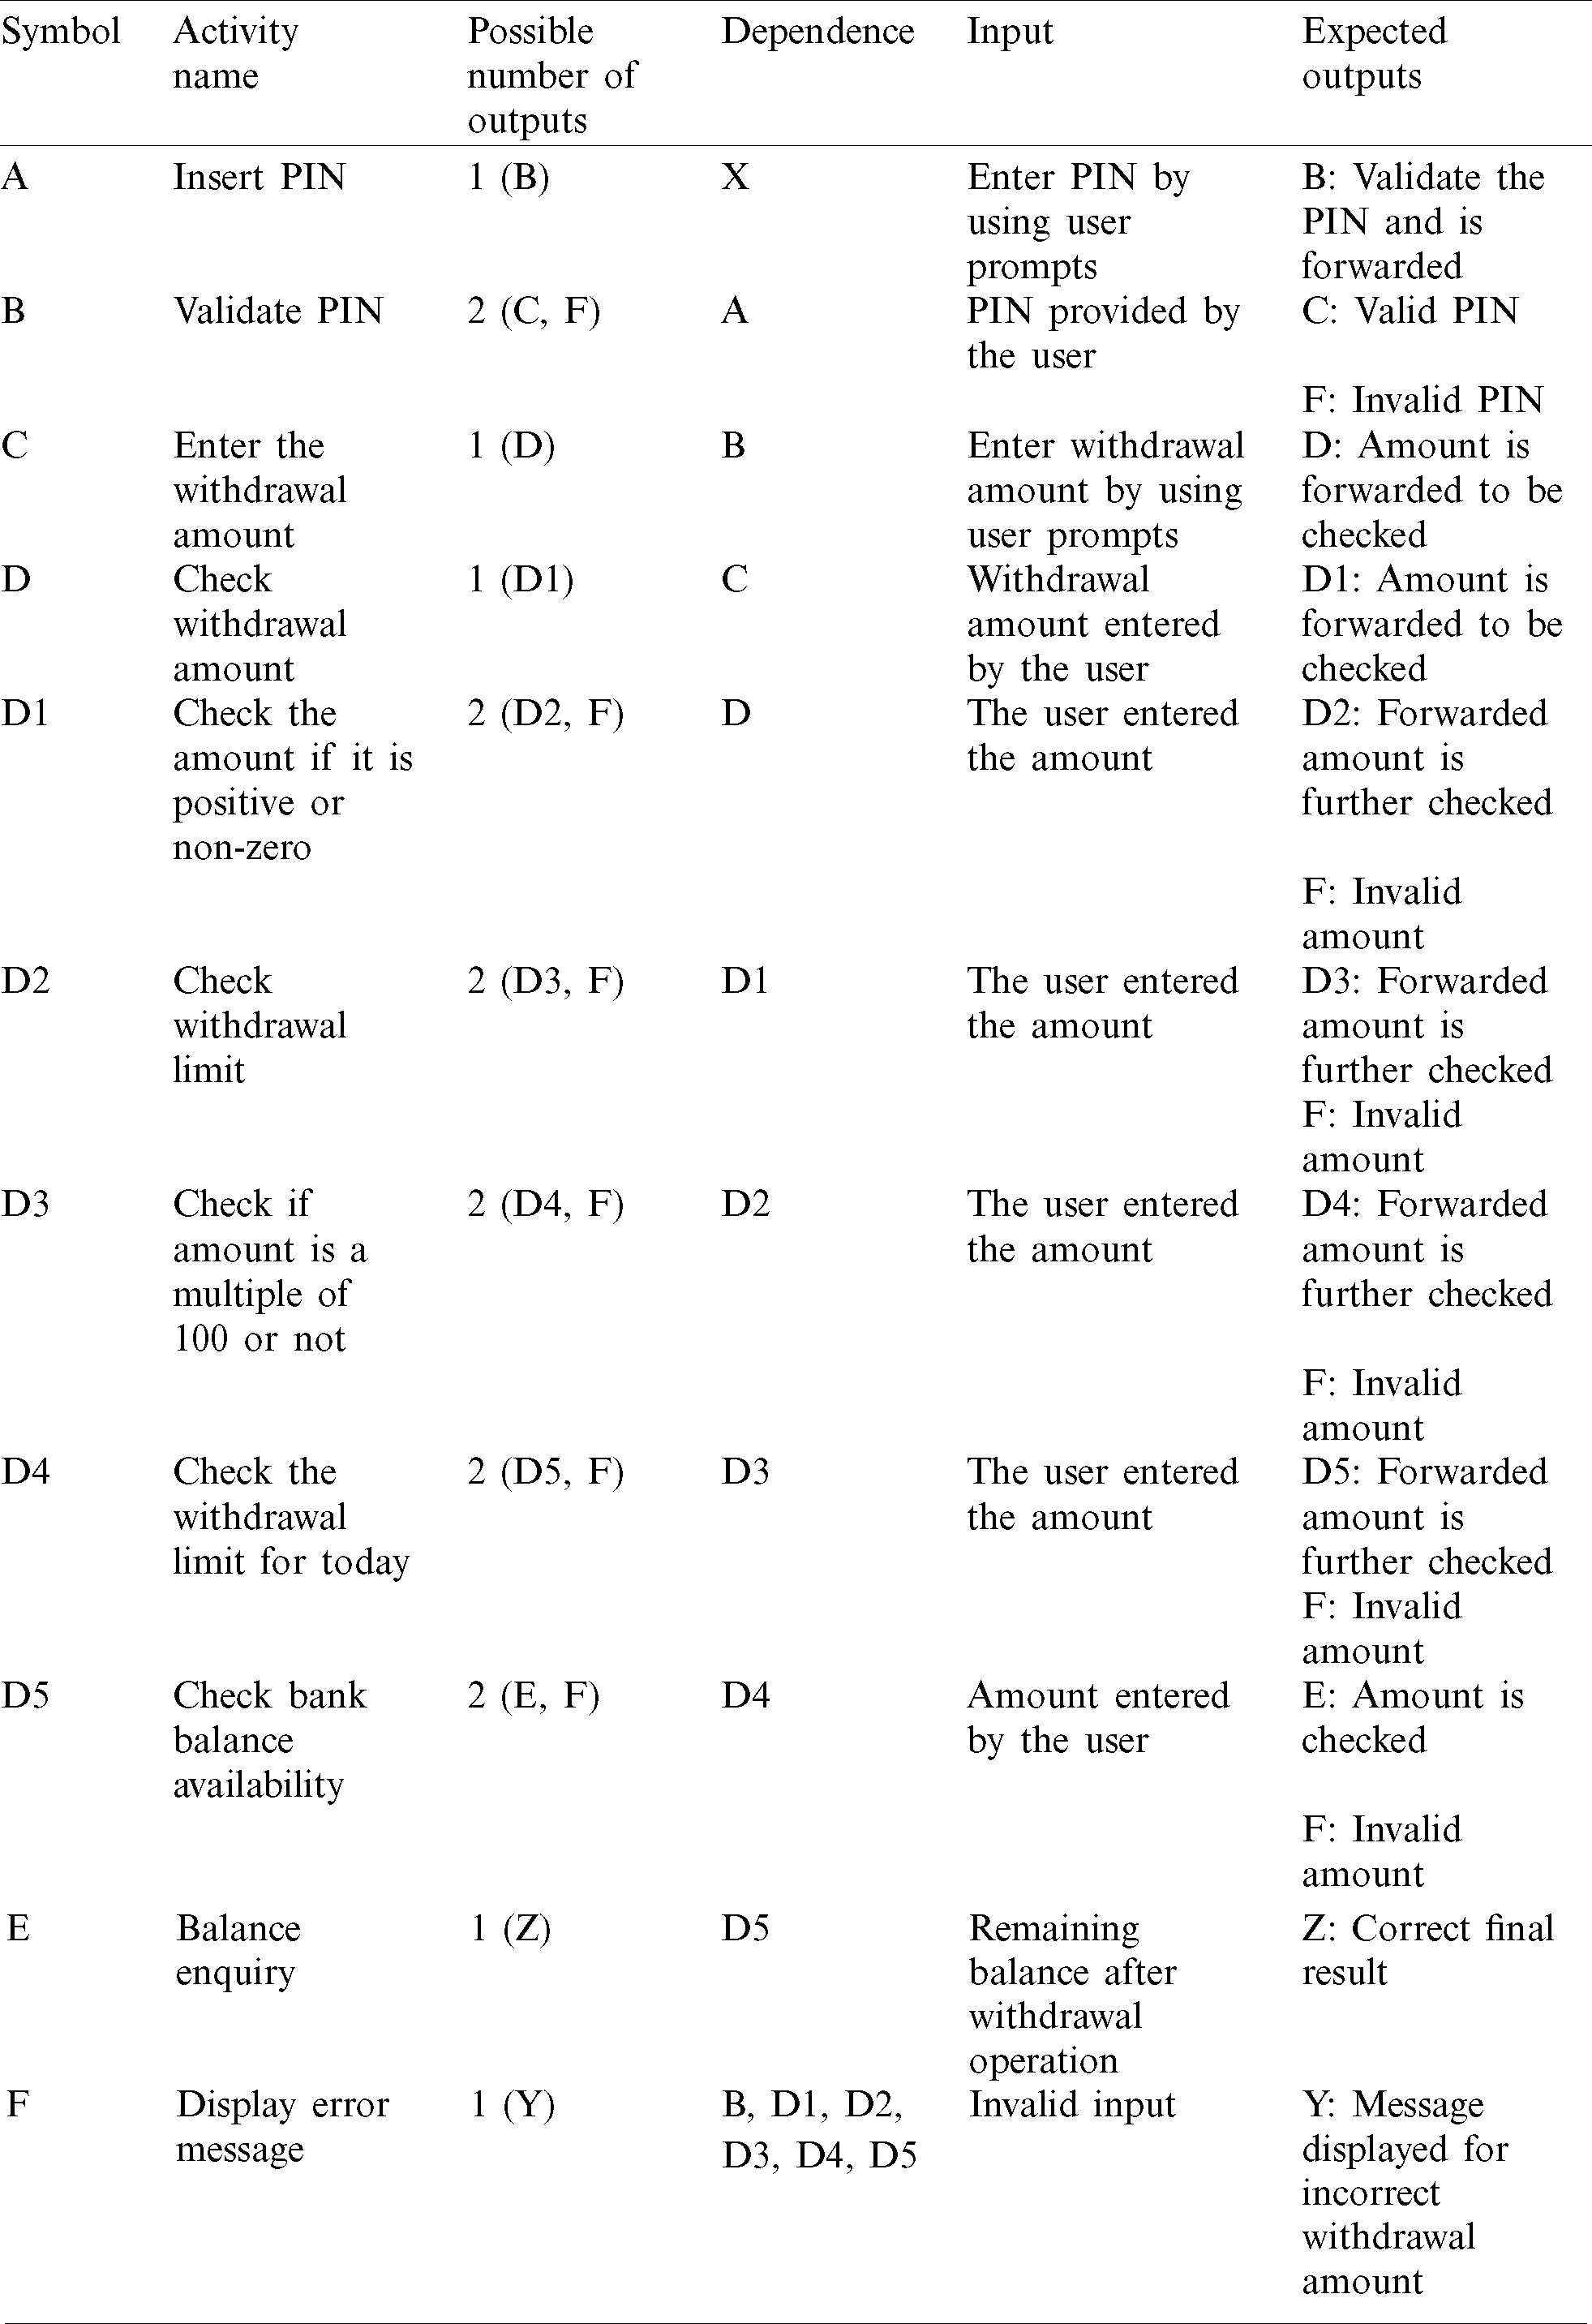
In this case, a combination of nodes, edges, and branches is used to serve as the coverage criteria in ASCDG. The ASCDG corresponding to a cash withdrawal operation from a cash point is shown in Fig. 4. A representation of the dependence table for withdrawal transactions is given in Tab. 3.

Figure 4: Activity state chart diagram graph (ASCDG) of an ATM
Table 3: Dependence table for the complete ATM operation
An initial population of individuals is generated in this method. The corresponding fitness function values for individuals are also assessed. Next, the current best solution is evaluated. The best solution is chosen using the roulette wheel selection method. The best solution selected is put in the mating pool. An improved best solution is produced by performing a single point crossover using two solutions from the mating pool. The genetic mutation was conducted on the improved solutions before the best solution is computed. This process is performed until the termination condition is achieved. Random generation of the initial population is performed using their fitness functional value. Next, the best initial optimum solution is stored. If there is a high fitness functional value, then the solution tends to lean towards the optimum value. The GA is divided into three primary phases: selection, crossover, and mutation. In the selection process, the relative fitness and total fitness functional values for every solution are assessed using the roulette wheel selection technique. In the crossover phase, the selection of the best solutions for the mating pool is performed, and the rest are discarded. This phase generates new solutions. In the mutation phase, candidate solutions are enhanced by changing the values in small increments. If a better solution is identified, the old solution is replaced, and the replacement serves as the new solution.
Net-amt indicates the total balance amount in the account of the customer as defined in the program code. Min-bal indicates the lowest balance that needs to be maintained by the customer. Wd-amt represents the amount to be withdrawn by the customer. The successful transactions are represented by Test-data. Fail-bal and Suc-bal indicate the transactions that failed or were successful, respectively. The test cases in this scenario are created and optimised through ASCDG by the application of BGA.
4.1 Algorithm: Optimization of Test Cases
The generation of test cases by the application of BGA was carried out as follows:
• Ensure the application of GA to the ASCDG.
• Find the fitness functional value of every component of ASCDG.
The functional fitness value was determined as follows:

where  varies from 0.1 to 0.9.
Hint: The fitness functional expression described in Eq. (1) is largely justified in the related literature for generating test cases with evolutionary optimization algorithms.
• Find the initial best solution and subsequently group the fitness functional values according to the population.
• while generation < 500 do:
//Selection//
• Assess the relative fitness and total fitness of each solution using the roulette wheel selection method, where every chromosome is dependent on the fitness functional value.
• Determine the actual count and the exact count.
• Place the best solutions in the mating pool and remove the remaining solutions.
//Crossover
• Execute single point crossover on each individual to form the new population.
//Mutation
• By modifying the values by a slight amount, determine the mutation value of each individual.
• Test the boundary conditions.
//New fitness function is evaluated
• Update the best solution
// (incremented by 1)
The best or the most optimal solution is ascertained based on the fitness functional value.
The relative fitness, during the selection process of the genetic algorithm, can be computed using the following relationship:

where  denotes the total relative fitness value,
  denotes the fitness function value of the candidate solution, and tfx denotes the sum total of all fitness values of the solutions.
The actual count and exact count can be computed as follows:


where ec designates the exact count, ac is the actual count, popsize designates the population size, and  is the function to determine the round-off value of a number.
Let us take into consideration the mathematical function 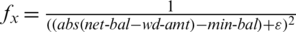 to generate the initial population of individuals. Thereafter, let us assess their corresponding fitness functional values. Next, we estimate the current best solution.
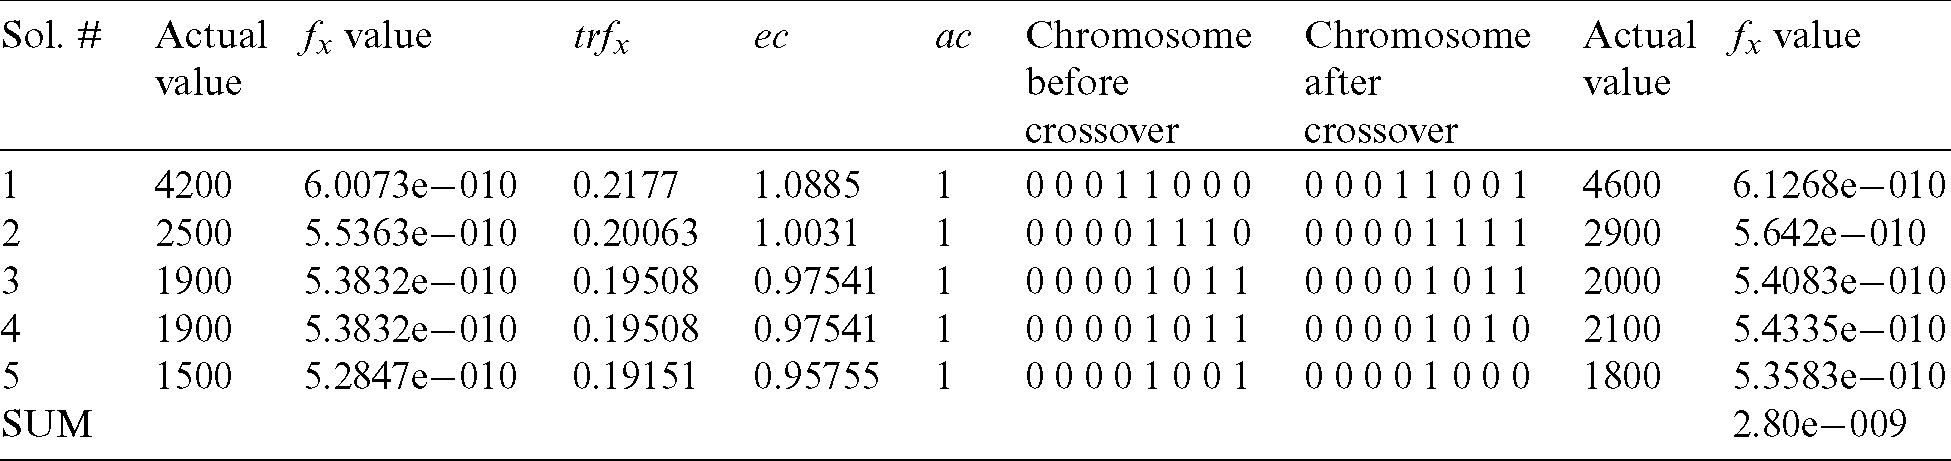
The best solution is selected and placed in the mating pool using the roulette wheel selection method. Single point crossover is performed to generate an enhanced best solution that uses two solutions from the mating pool. Next, the genetic mutation is performed on the amended solutions to further compute the best solution. The process continues until the termination criterion is met. The optimum solution is established after BGA is applied and the function is maximized through MATLAB-7.0. The various iterations are represented in Tabs. 4–6. The optimal solution was achieved after 160 iterations with minimum central processing unit (CPU) execution time according to the findings.
Table 4: Results after the first iteration
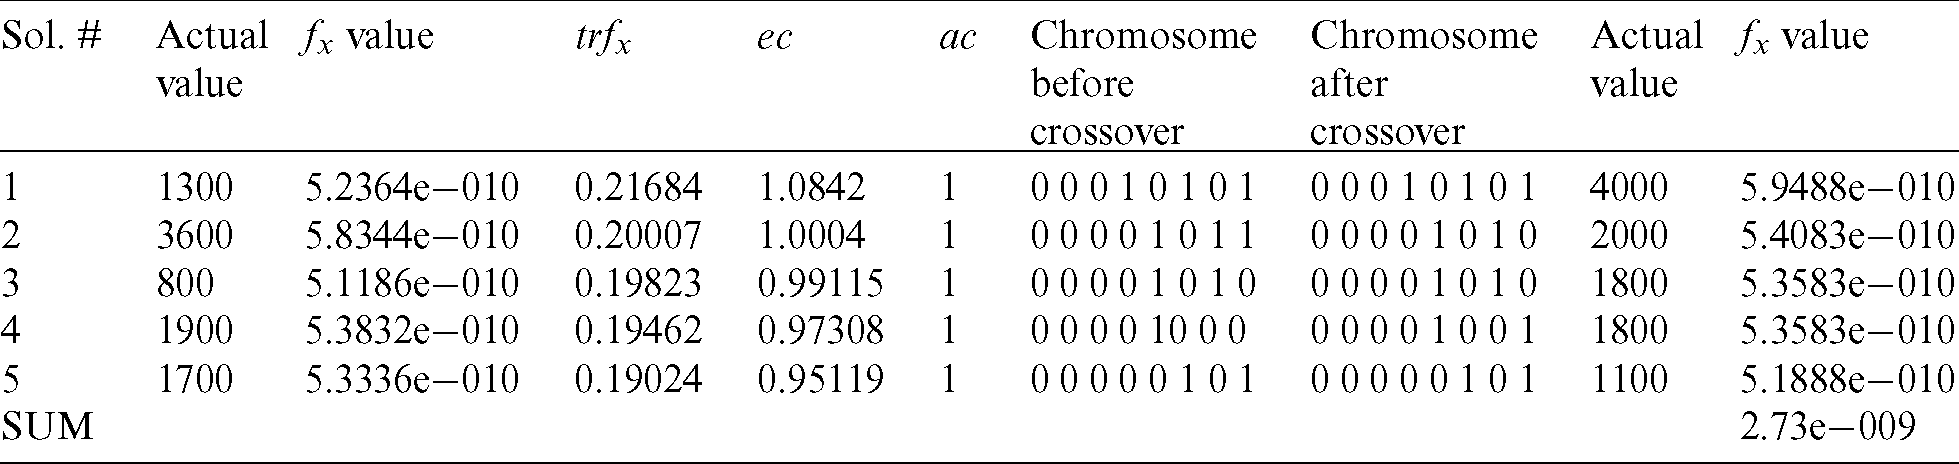
Table 5: Results after the second iteration
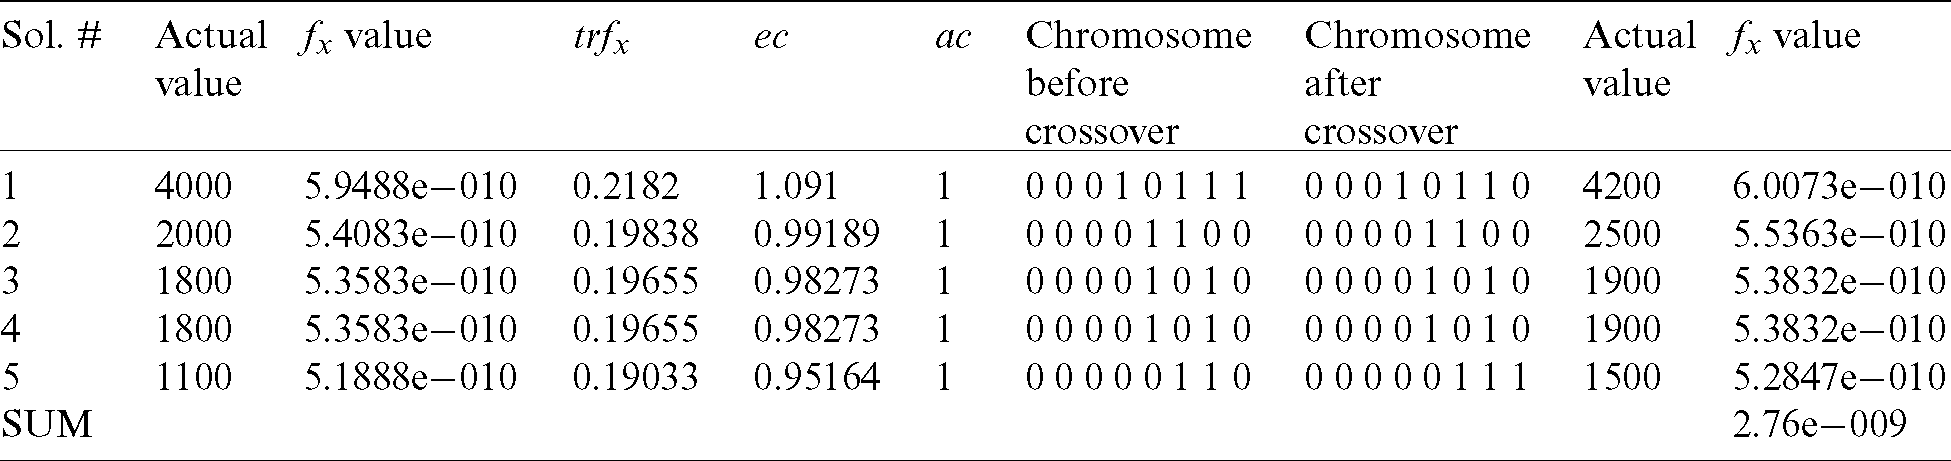
Table 6: Results after the third iteration
The simulation results taking into consideration 20 test cases, which have been optimised through the use of BGA, are presented in Fig. 5. The representation of the simulation results is done through the use of test data and the number of iterations through BGA implementation.

Figure 5: Simulation result of the test data optimisation by using BGA
A comparative study with the work of Suresh [1] was performed to justify the novelty of the technique described in our paper. The approach used in the work of Suresh has been implemented in three heuristic algorithms: Bee Colony Algorithm (BCA), Particle Swarm Algorithm (PSA), and Genetic Algorithm (GA). The results of the comparative study for the different techniques in terms of required iteration number for each technique are shown in Tab. 7.
Table 7: Comparative study showing the iteration number of different approaches
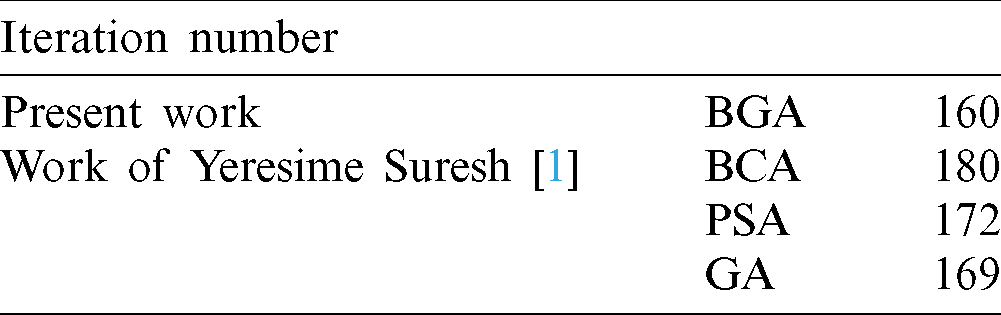
The results obtained from the BGA strategy (Tab. 7) are better than those obtained from the work of Suresh [1]. Test data are optimized after 169 iterations in the work of Suresh [1], whereas optimized results were obtained after 160 iterations in the BGA approach. This performance is significant since it proves that the approach is more efficient and less time-consuming. Therefore, the approach designed in this paper is more efficient and superior when compared with several heuristic techniques.
The main advantage of the designed approach is that the BGA needs less CPU time to achieve a global optimum than other testing methods. In addition, the density of global solutions is reduced when compared to the whole input search area. Equally important, our study demonstrates that BGA-generated test data are efficiently enhanced compared with data generated randomly. Nevertheless, it should be noted that one of the disadvantages of the GA is the random selection of the test case in each testing progression. Consequently, the selected test may not cover the maximum, and it can generate large fault rates of detection.
The most elementary steps for an automated testing process comprise developing the dependence table, designing the dependence graph, and creating the possible paths. The strategy recommended here has the capability to develop the dependence table and regulate the flow graph with less CPU execution time and more accuracy. The issue of automated generation was analysed in this study. Optimization of test cases was achieved by adopting BGA through UML combinational diagrams (ASCDG). The suggested scheme helps to create a more efficient process that enables improvement of software quality performance. Additionally, it offers inspiration to researchers to attain further enhancement of software features. Future software will be used with BGA in the future to improve software performance and reduce costs. The processes that will be developed in this way are likely to be used through various UML models using combinational graphs.
Future directions for this research include improving the generation of automated test data for large-scale and complex platforms. The current techniques create test data based on small programs and simple structures. Moreover, areas of future research should establish test data that exploit a multiple path fitness function for the flow graph control. Exploiting BGA can be enhanced by investigation of code coverage and merging with other meta-heuristic techniques such as chaotic particle swarm algorithms.
Funding Statement: The authors acknowledge the financial support from the Deanship of Scientific Research, University of Hail, Saudi Arabia through the project Ref. (RG-191315).
Conflicts of Interest: The authors declare that they have no conflicts of interest to report about the present study.
1. Y. Suresh and S. Rath. (2013). “A genetic algorithm-based approach for test data generation in basis path testing,” International Journal of Soft Computing and Software Engineering, vol. 3, no. 3, pp. 326–332. [Google Scholar]
2. B. Beizer. (1990). Software testing techniques. 2nd ed., New York: Van Nostrand Reinhold. [Google Scholar]
3. A. Abdurazik and J. Offutt. (2000). “Using UML collaboration diagrams for static checking and test generation,” in Proc. International Conference on Unified Modeling Language, Berlin, Heidelberg, pp. 383–395. [Google Scholar]
4. M. Sharma, D. Kundu and R. Mall. (2007). “Automatic test case generation from UML sequence diagrams,” Proceedings of IEEE Conference on Software Maintenance, vol. 1, pp. 60–67. [Google Scholar]
5. G. Booch, J. Rumbaugh and I. Jacobson. (2001). The Unified Modeling Language User Guide. USA: Addison-Wesley. [Google Scholar]
6. J. Hartmann, M. Vieira, H. Foster and A. Ruder. (2005). “A UML-based approach to system testing,” Journal of Innovations System Software Engineering, vol. 1, no. 1, pp. 12–24. [Google Scholar]
7. J. Holland. (1975). Adaptation in Natural and Artificial Systems. Ann Arbor: University of Michigan press. [Google Scholar]
8. S. S. Basa, S. K. Swain and D. P. Mohapatra. (2018). “Genetic algorithm based optimized test case design using UML,” Journal of Computer and Mathematical Sciences, vol. 9, no. 9, pp. 1223–1238. [Google Scholar]
9. G. Tsaramirsis and M. Yamin. (2014). “Generation of UML2 use cases from MEASUR’s ontology charts: A MDA approach,” in Model-Driven Business Process Engineering, Chapter 4. UAE: Bentham Science Publishers, pp. 67–76. [Google Scholar]
10. M. Yamin, G. Tsaramirsis, M. Nistazakis and N. Zhang. (2010). “Transformation of semantic analysis to com+ business requirements using MDA approach,” Journal of Service Science and Management, vol. 3, no. 1, pp. 67–71. [Google Scholar]
11. K. Marikina, C. Apostolopoulos and G. Tsaramirsis. (2017). “Extending model driven engineering aspects to business engineering domain: A model driven business engineering approach,” International Journal of Information Technology, vol. 9, no. 1, pp. 49–57. [Google Scholar]
12. M. Prasanna and K. R. Chandran. (2009). “Automatic test case generation for UML object diagrams using genetic algorithm,” International Journal of Advances in Soft Computing and its Applications, vol. 1, no. 1, pp. 19–32. [Google Scholar]
13. K. Arvinder and B. Divya. (2011). “Hybrid particle swarm optimization for regression testing,” International Journal on Computer Science and Engineering, vol. 3, no. 5, pp. 1815–1824. [Google Scholar]
14. L. Huaizhong and C. P. Lam. (2005). “An ant colony optimization approach to test sequence generation for state-based software testing,” in Proc. of the Fifth Int. Conf. on Quality Software (QSIC’05Melbourne, Victoria, Australia, pp. 255–262. [Google Scholar]
15. R. Abdul, S. Anwar, M. A. Jaffer and A. Ali Shahid. (2010). “Automated GUI test coverage analysis using GA,” in Proc. 7th IEEE Int. Conf. on Information Technology, Las Vegas, Nevada, USA, pp. 1057–1063. [Google Scholar]
16. B. N. Biswal, P. Nanda and D. P. Mohapatra. (2008). “A novel approach for scenario-based test case generation,” in Proc. IEEE Int. Conf. on Information Technology, Sydney, NSW, Australia. [Google Scholar]
17. A. Tripathy and A. Mitra. (2013). “Test case generation using activity diagram and sequence diagram,” in Proc. ICAdc, AISC 174, India: Springer, pp. 121–129. [Google Scholar]
18. N. Ashalatha and S. Debasis. (2010). “Automatic test data synthesis using UML sequence diagrams,” Journal of Object Technology, vol. 9, no. 2, pp. 75–104. [Google Scholar]
19. S. Dalai, A. Acharya and D. P. Mohaptra. (2012). “Test case generation for concurrent object-oriented systems using combinational UML models,” International Journal of Advanced Computer Science and Applications, vol. 3, no. 5, pp. 97–102. [Google Scholar]
20. B. Swathi and H. Tiwari. (2019). “Test case generation process using soft computing technique,” International Journal of Innovative Technology and Exploring Engineering, vol. 9, no. 1, pp. 4824–4831. [Google Scholar]
21. R. Sahoo, D. P. Mohapatra and M. R. Patra. (2017). “Model driven approach for test data optimization using activity diagram based on cuckoo search algorithm,” International Journal of Information Technology and Computer Science, vol. 9, no. 10, pp. 77–84. [Google Scholar]
22. N. Gupta, A. K. Sharma and M. K. Pachariya. (2019). “An insight into test case optimization: Ideas and trends with future perspectives,” IEEE Access, vol. 7, pp. 22310–22327. [Google Scholar]
23. N. Khurana and R. S. Chillar. (2015). “Test case generation and optimization using UML models and genetic algorithm,” in Proc. 3rd Int. Conf. on Recent Trends In Computing, Delhi, India, pp. 996–1004. [Google Scholar]
24. L. Haldurai, T. Madhubala and R. Rajalakshmi. (2016). “A study of genetic algorithm and its applications,” International Journal of Computer Science and Engineering, vol. 4, no. 10, pp. 139–143. [Google Scholar]
25. W. J. Jemai, H. Jerbi and M. N. Abdelkrim. (2010). “Synthesis of an approximate feedback nonlinear control based on optimization methods,” WSEAS Transactions on Systems and Control, vol. 5, no. 8, pp. 646–655. [Google Scholar]
26. M. Jabri, A. Belgacem and H. Jerbi. (2009). “Moving horizon parameter estimation of series DC motor using genetic algorithm,” in Proc. 2009 World Congress on Nature & Biologically Inspired Computing, Coimbatore, India, pp. 1528–1531. [Google Scholar]
27. M. Jabri and H. Jerbi. (2009). “Comparative study between Levenberg-Marquardt and genetic algorithm for parameter optimization of an electrical system,” IFAC Proceedings Volumes, vol. 42, no. 16, pp. 77–82. [Google Scholar]
28. Y. Huang, X. Chen, K. Yuan, J. Zhang and B. Liu. (2020). “Directional modulation based on a quantum genetic algorithm for a multiple-reflection model,” Computers, Materials & Continua, vol. 64, no. 3, pp. 1771–1783. [Google Scholar]
29. R. K. Sahoo, S. K. Nanda, D. P. Mohapatra and M. R. Patra. (2017). “Model driven test case optimization of UML combinational diagrams using hybrid bee colony algorithm,” International Journal of Intelligent Systems and Applications, vol. 6, pp. 44–53. [Google Scholar]
30. A. Y. Hamed, M. H. Alkinani and M. R. Hassan. (2020). “A genetic algorithm to solve capacity assignment problem in a flow network,” Computers, Materials & Continua, vol. 64, no. 3, pp. 1579–1586. [Google Scholar]
 | This work is licensed under a Creative Commons Attribution 4.0 International License, which permits unrestricted use, distribution, and reproduction in any medium, provided the original work is properly cited. |