DOI:10.32604/cmc.2021.014942
| Computers, Materials & Continua DOI:10.32604/cmc.2021.014942 | |
| Article |
Methodology for Detecting Strabismus through Video Analysis and Intelligent Mining Techniques
1Department of Information Systems, College of Computer and Information Sciences, Princess Nourah bint Abdulrahman University, Riyadh, 11671, Saudi Arabia
2Department of Computer and Systems Engineering, Faculty of Engineering, University of Alexandria, Alexandria, Egypt
*Corresponding Author: Hanan Abdullah Mengash. Email: hamengash@pnu.edu.sa
Received: 28 October 2020; Accepted: 20 November 2020
Abstract: Strabismus is a medical condition that is defined as the lack of coordination between the eyes. When Strabismus is detected at an early age, the chances of curing it are higher. The methods used to detect strabismus and measure its degree of deviation are complex and time-consuming, and they always require the presence of a physician. In this paper, we present a method of detecting strabismus and measuring its degree of deviation using videos of the patient’s eye region under a cover test. Our method involves extracting features from a set of training videos (training corpora) and using them to build a classifier. A decision tree (ID3) is built using labeled cases from actual strabismus diagnosis. Patterns are extracted from the corresponding videos of patients, and an association between the extracted features and actual diagnoses is established. Matching Rules from the correlation plot are used to predict diagnoses for future patients. The classifier was tested using a set of testing videos (testing corpora). The results showed 95.9% accuracy, 4.1% were light cases and could not be detected correctly from the videos, half of them were false positive and the other half was false negative.
Keywords: Data mining; strabismus; video analysis; angle of deviation; decision tree
The condition of lack of coordination between the eyes is referred to as strabismus. Strabismus causes the eyes to fail to align properly, so that they cannot focus on a single point. Unilateral strabismus is a condition in which the misalignment affects only one eye. If it affects both, it is defined as alternating strabismus [1–3].
Early identification of strabismus is crucial. In children, strabismus can be treated if diagnosed at an early stage. Angles of deviation in patients are important for judging the severity of the case and planning surgical intervention [4].
The main medical manual tests for diagnosing strabismus are as follows:
• The corneal light reflex test, which assesses a light reflection from the center of the pupil and estimates its displacement.
• The Maddox rod technique, which estimates eye movement by using filters and distorting lenses [2].
• The cover test, which is usually performed manually. A doctor covers each eye in turn, observes the eye movement, and then estimates the angle of deviation. This test depends heavily on the doctor’s skill [4,5].
Computerized strabismus tests are now available, however. Existing computer methods are either image based or video-based, both categories use eye-tracking, which can be obtained from sequential images or video frames of the patient’s eyes [6,7].
Computerized image analysis is used to simulate a cover test. Many systems use an infrared camera to simulate cover tests. For the computerized image analysis, the Hirschberg test has also been performed, but it gives less precision. Eye-tracking techniques are also used for strabismus diagnosis through the analysis of gaze deviations [8–11].
In this paper, we propose a computerized strabismus diagnosis technique for the cover test using video analysis. In the proposed system, (assume actual implementation of the system in a nurse or school room) the subject should be placed with his chin toward the camera, and a video of the cover test is taken: one eye is covered for a few seconds and then uncovered. This can be done by a nurse or schoolteacher (as done by the researchers in [12]).
The system is trained using a training corpus that includes videos of patients and their actual doctors’ diagnoses. We build a feature-extraction mechanism from the videos and associate it with the actual diagnosis to generate rules. For diagnosis of new patients, videos of patients go through the feature extraction, and then classified according to the generated rules. The algorithms are applied to video recordings taken with an ordinary camera.
Traditional diagnosis methods, which require medical professionals and manual labor, are usually expensive [4]. Most patients diagnosed with strabismus also come from poor neighborhoods and do not usually have the privilege of expensive medical facilities. A solution that does not require trained physicians is needed.
The rest of the paper is organized as follows: related work is surveyed in Section 2, methodology of the proposed system is presented in Section 3, along with the proposed algorithm and feature-extraction technique. The proposed system design is presented in Section 4, along with the decision tree. Experimental results are discussed in Section 5, and conclusions are drawn in Section 6.
Strabismus detection in children is complicated by the fact that they are often uncooperative. Thus, researchers have worked to develop ways to detect strabismus and measure its degree of deviation easily. These methods take a variety of approaches, from simulating different ophthalmic charts to using photography and image processing.
In [3], the authors performed accurate gaze-direction measurements with free head movement to estimate strabismus angles. The authors tested three positions: gaze ahead, gaze ahead with head movement, and fixed head with different eye movements. Their system can be applied to the measurement of angles of deviation that do not depend on head pose. In [6], the authors adopted eye-position metrics using video-based clinical techniques. The system proposed by [7] uses a virtual instrument to experimentally detect extraocular motility using Hess test; a group of features are proposed to characterize the extraocular data to detect paralytic strabismus. The system proposed by [8] detects strabismus using convolutional neural networks; an eye tracker detects eye motion and feeds an image to the neural network. The authors in [9] proposed automatic ocular alignment for strabismus detection using U-NET networks. They devised an algorithm for computing the distance between the center of the iris center and corner of the eye with an accuracy of approximately 96%. In [10], the authors introduced an eye-tracking-aided digital system for strabismus diagnosis: The gaze is observed while the patient looks at a specific target. Feature extraction was performed from the gaze data, and new patients are diagnosed using these features.
In [11], the authors proposed studying an intelligent evaluation system for strabismus using digital videos. The study computerized the cover test. They captured videos with an infrared camera and measured the angle of deviation from the pupil center to the corneal reflex point. In [3], they presented accurate gaze direction metrics for strabismus angle estimation. Direct measurement and stepwise interpolation are used to efficiently assess the deviation angle.
A computer-based system was presented by [13] for strabismus and amblyopia therapy. It allows for quick measurement of visual impairments in children and youths. Strabismus was diagnosed by features using photo-screening, in which a digital camera is placed 4m from the child, the child’s attention is attracted by a toy placed above the lens, and when the child is in the correct position, the shutter is depressed. After taking on picture in horizontal alignment, the camera is turned vertically for the second. The two sets of pictures are displayed on the screen, and Adobe Photoshop is used to process the images, or the photos are retaken if the quality is too low. The test results showed 92.6% agreement between the proposed system and the results given by an examiner. The sensitivity and specificity were 94.6% and 90.1%, respectively.
In [14], the authors investigated graph comprehension in students with dyslexia. A more complex study presented the emulation of physicians’ tasks in eye-tracked virtual reality for remote diagnosis of neurodegenerative disease [15]. The authors used a VR display and an infrared camera, integrated both into the lens, and created a 3D virtual paradigm. Then they simulated tasks such as saccades that are required for diagnosis of neurodegenerative diseases. This methodology can be extended to the cover test.
An automated diagnosis of strabismus, measuring the deviation of the eye from the difference of the pupil center and its deviation are captured by [16]. The authors introduced a computerized system using eye tracking and full-occlusion lenses. The system provides a speedy measurement with high accuracy in children and on the angle of deviation.
In [17], the authors discussed treatment of amblyopia in adults with dichoptic training using the Oculus Rift head-mounted virtual reality display. In [18], the authors used randomized controlled trials to test video clips and interactive games for improving vision in children with amblyopia. In [19], the authors used intelligent evaluation of strabismus in videos based on an automated cover test.
In [20], the authors proposed a virtual reality game designed to help amblyopics. In [21], the authors assessed collaborative processes using physiological and eye-movement couplings. Robust and accurate eye-contour extractions are discussed by [22]. In [23], the authors investigated the automatic diagnosis of strabismus using digital videos and a cover test. In [24], the authors improved a computerized stimulus-tracking method for strabismus using a cover test. An automated strabismus detection system based on deep neural networks is introduced for telemedicine applications by [25]. In [26], the authors described a video vision development assessment system, an analog video-based scheme that combined Brückner pupil red reflex imaging technique and eccentric photo refraction. They used the system to screen children for amblyogenic factors.
In this paper, we propose a novel system that fully automates cover test using video processing of video data sets of the region of the patients eye. The system performs strabismus detection and angle of deviation classification using decision tree. Since number of different cases are limited and the boundaries between cases are well defined, we found that decision tree classifier is appropriate. The system uses personal computer and a video camera; it does not need any specific equipment or special lighting or setting.
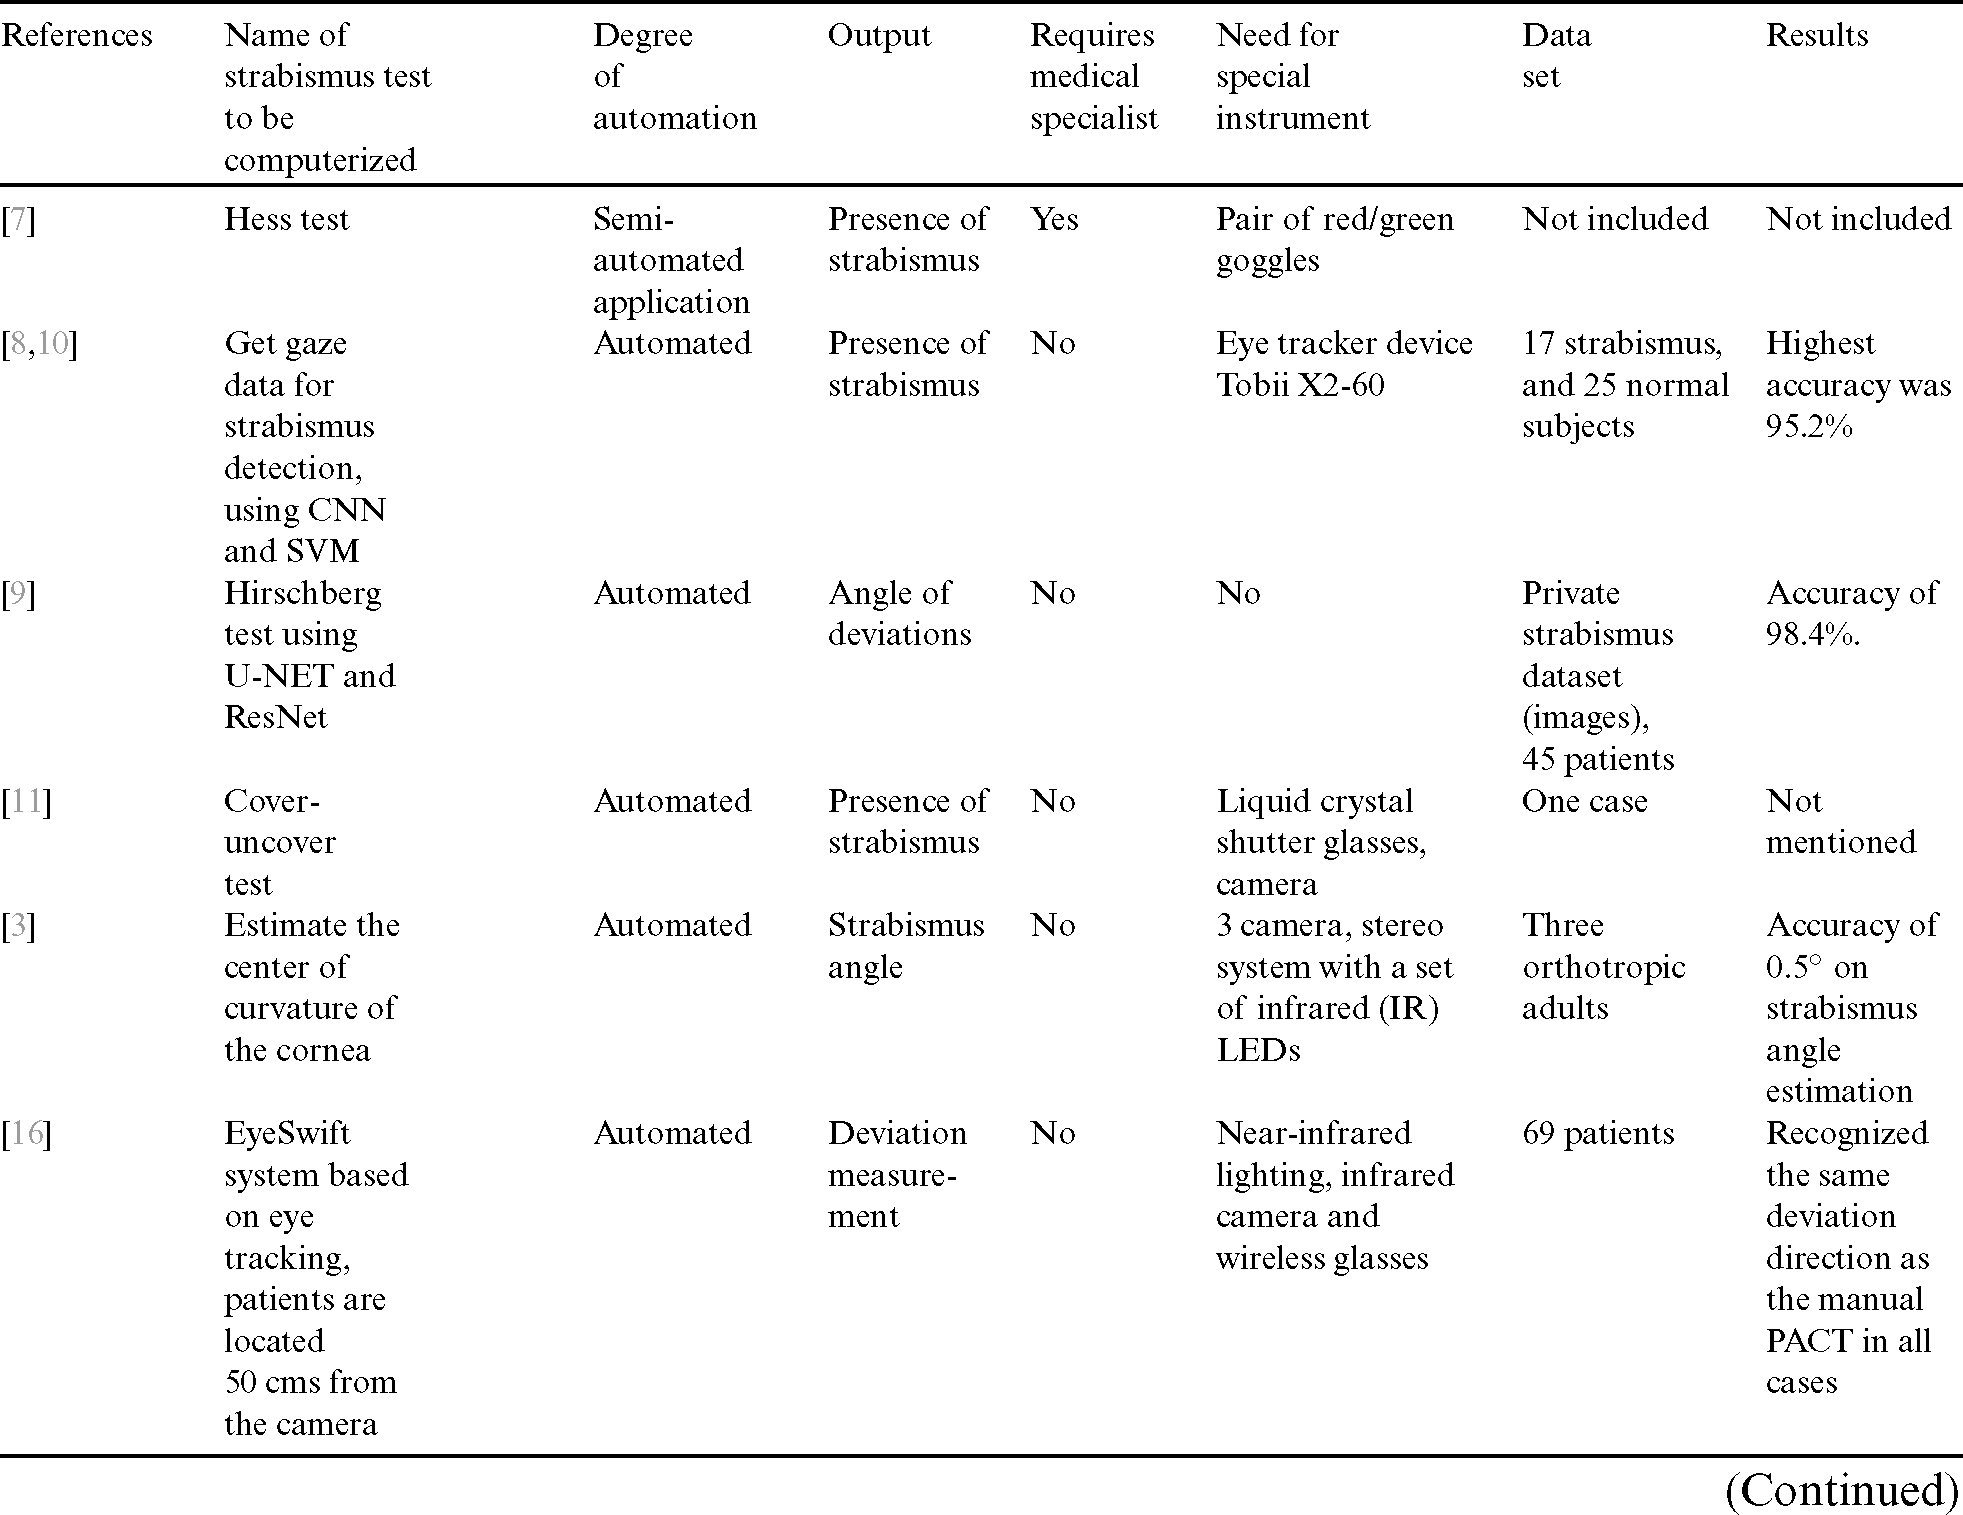
In Tab. 1 we introduced a comparison of automated strabismus systems in literature. The table summarizes the test to be computerized, degree of automation, and the output of the computerized system. It also presents the used data set and the results in terms of accuracy.
Table 1: Comparison of automated strabismus systems in literature
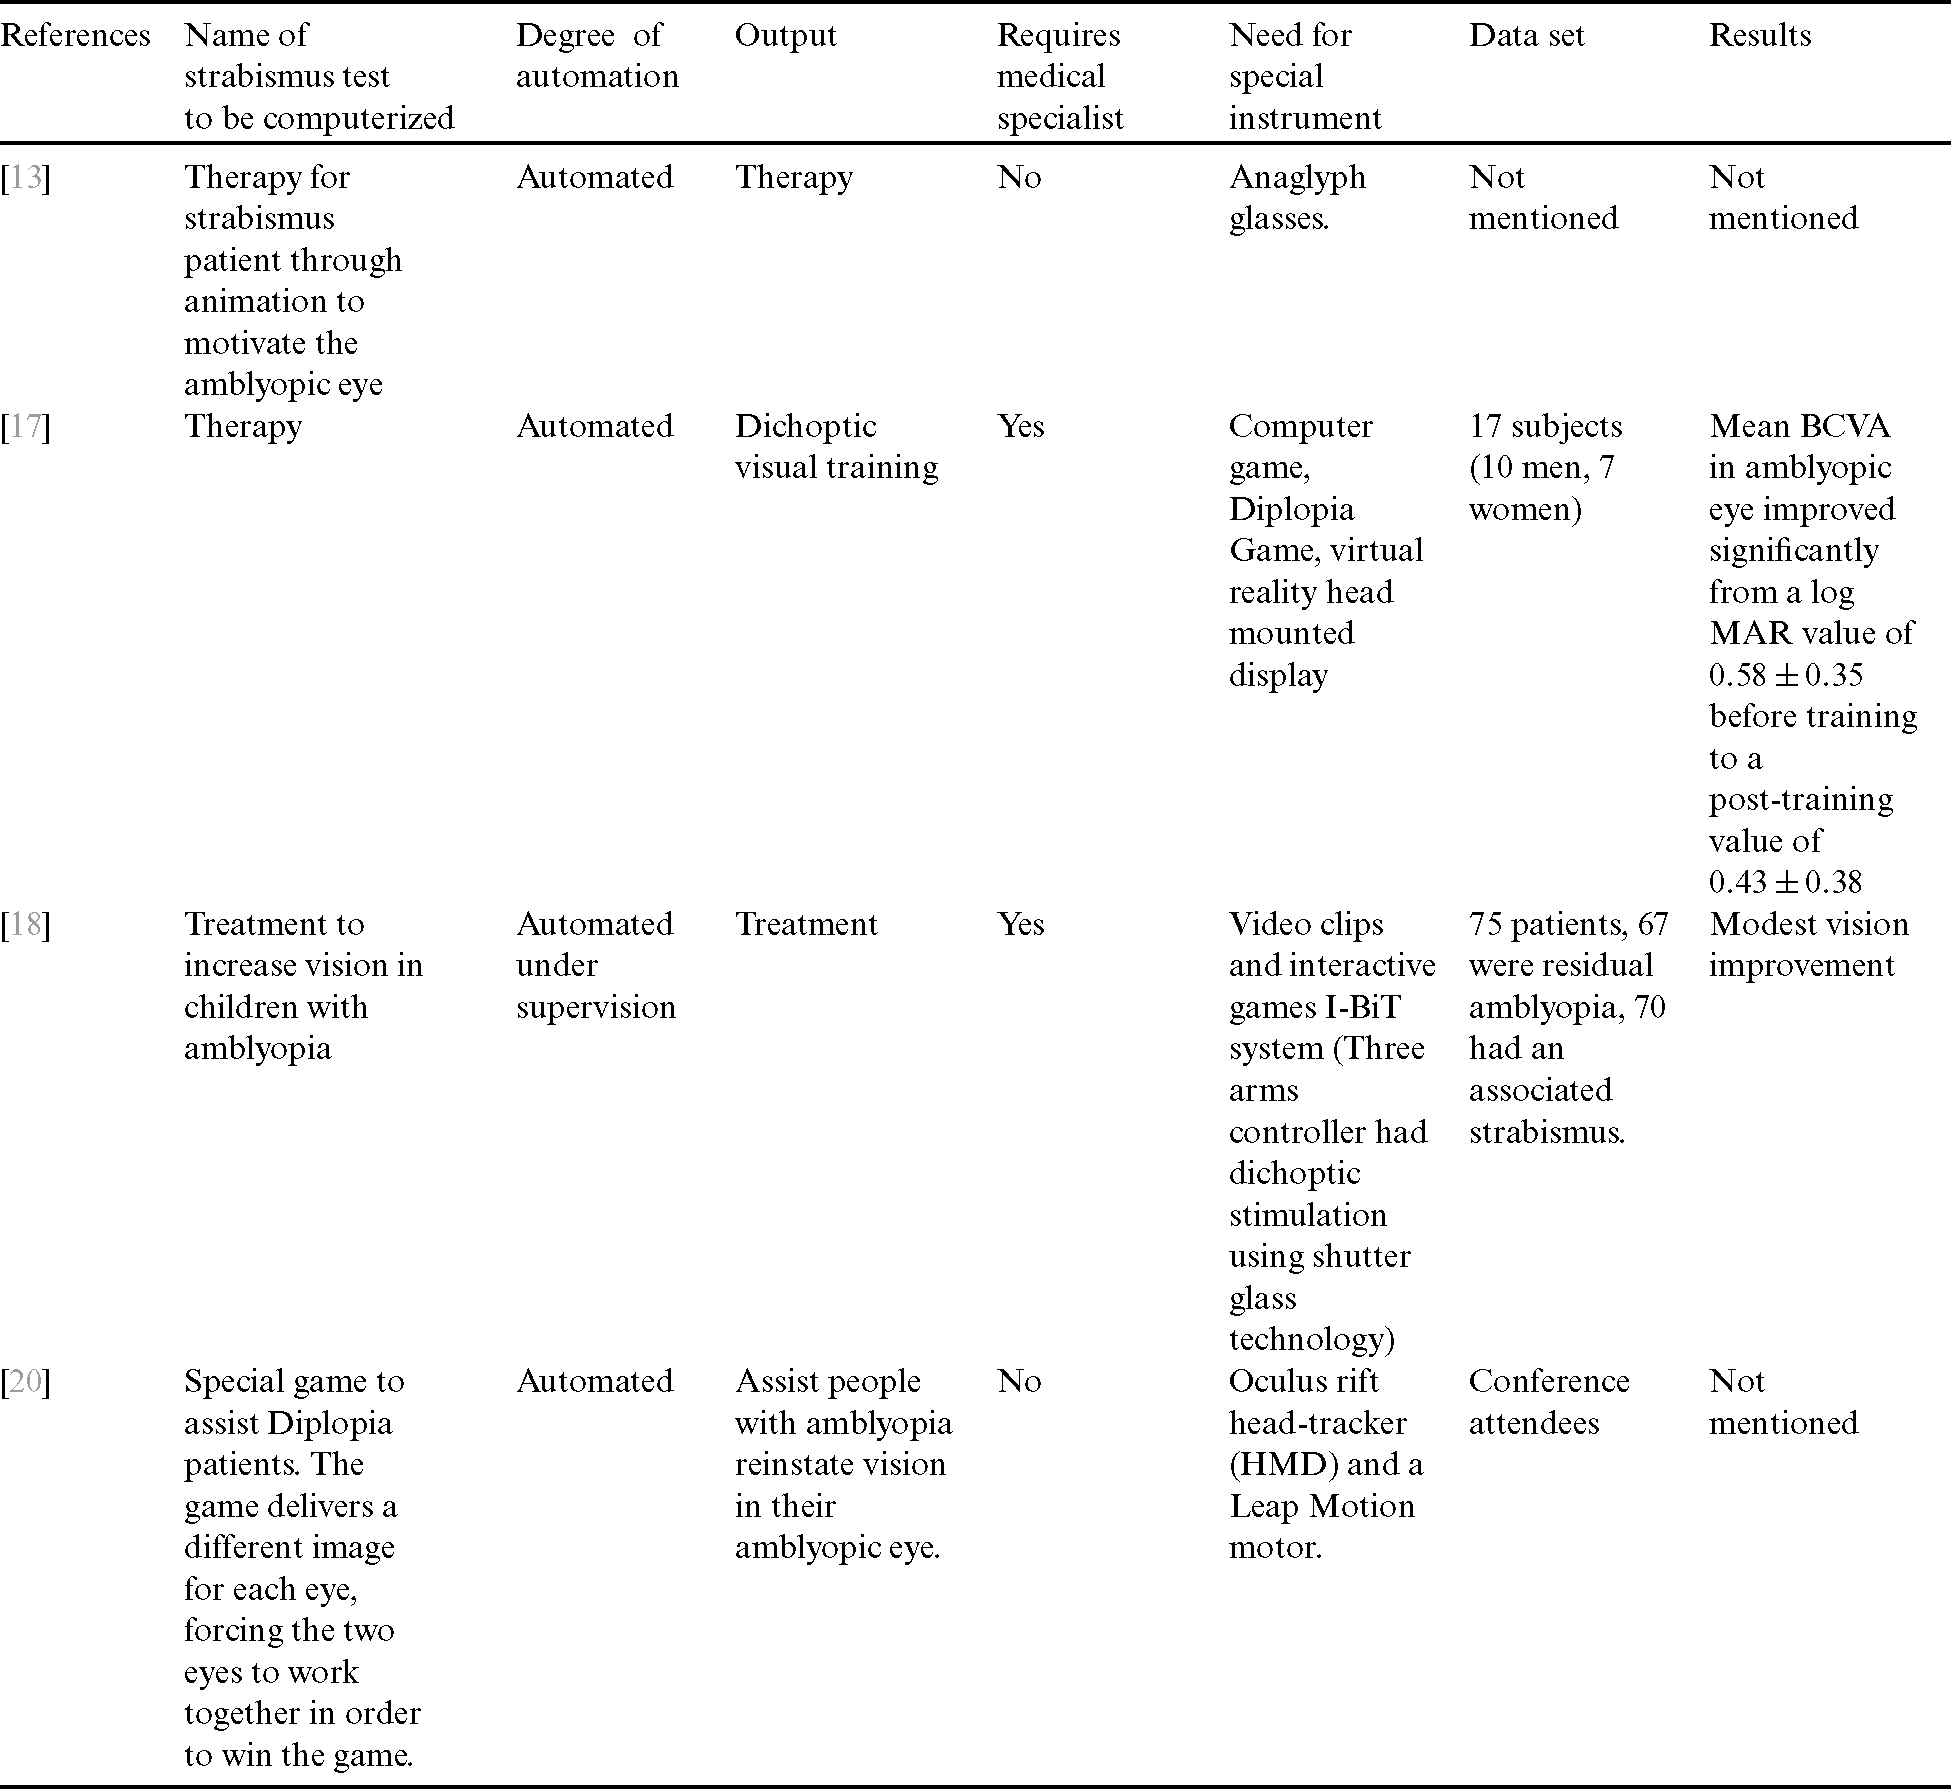
In Tab. 2 we summarized other automated systems that help in treatment or training for strabismus patients using the same criteria used in Tab. 1.
Table 2: Summary of automated therapy systems that help in treatment or training for strabismus patients
In this paper, we are introducing a novel technique utilizes intelligent classification methodology for videos. For each patient with a known diagnosis, the video of the eye region goes through the feature extraction algorithm and attaches the features to the case’s actual diagnosis and degree of deviation, as determined by a physician. Videos of the patients’ eyes and the classes of strabismus attached to them is extracted from the data set in [12]. The collection of videos is divided into two corpuses: the training corpus and testing corpus. Data description and system description are depicted in the following subsections.
We used Video Dataset for Strabismus Cover Tests from the data set in [12]. The data set includes videos for eye region before and after cover test for the left eye and the right eye. This video dataset (VD-ACTSE dataset) was developed for strabismus detection. The video is acquired when the subject performs the automated cover tests. The patient was placed 60 cm apart from the camera [12]. The video has a frame rate of 60 fps at a length of about 50 s. Each video has strabismus cover test for 8 patients for each eye, for a total of 192 videos for different patients. Only the eye region was recorded in the video. We divided each video manually into 8 videos with labeled diagnosis for each division. The label was the diagnosis from the physician and includes the existence of strabismus and angles of deviation. We labeled each video division as for left or right eye.
3.2 Feature Extraction of the Proposed System
The system consists of five phases: 1) preprocessing; 2) populating the database with actual patients’ diagnosis from labeled videos from physicians [12]; 3) extracting features from the patients’ videos using G-Transform and saving them in a database; 4) training; and 5) testing.
The first step is the preprocessing phase, and it is applied to the set of videos of patients in the training corpus. Each video in this set is labeled by a physician including diagnosis, and angles of deviation. The diagnosis can be “no strabismus” in any eye with angle of deviation ¡5. Otherwise the diagnosis is strabismus with the denoted angle of deviation. We have four different diagnosis as such: No Strabismus, Unilateral Strabismus with angles of deviation equal to  , Unilateral Strabismus with angles of deviation equal to
  , or Alternating Strabismus with angles of deviation equal to
  and
and  .
.
The preprocessing of each labeled patient’s video is comprised of discarding frames with blinking. We have to note that the eyes region in each frame of the video which is already extracted in the patients’ videos in [12] and is included in the metadata for each case.
We used the algorithm proposed by [27,28] to discard frames that include blinking. Eyelids are extracted using algorithm proposed by [27], they utilize Fourier feature for uniquely detection of the eyelids. The eye blinking value is determined for each eye and stored in the Eye blinking signal as depicted in Eq. (1).

where d is the vertical distance between the upper lid and lower lid, dr is the diameter of the iris which is usually constant among people.
Eye blinking takes only few milliseconds. With videos of 60 frames per second, the eye blinking usually takes two frames.
3.2.2 Saving Actual Physician Diagnosis for Each Patient
The second step is to populate the database with the labeled diagnosis of the patient. The labeled diagnosis of patient P includes the diagnosis and the angle of deviation of both left eye and right eye.
Then, the features of each patient from actual physician diagnosis, FEATURESP, will be saved in the database along with their labels. FEATURESP is a tuple for patient Pm that includes:
> Patient-Idm, diagnosesm,  left(m),
  right(m) <
3.2.3 Extracting Features Using G-Transform
In this step, the system extracts a set of features from patients’ videos using the movement of the Iris during the cover test using G-Transform. The extraction of the features is described as follows:
a) Extract the features from each patient’s video in the training corpus, FEATURESV, using G-Transform.
b) FEATURESV is a tuple for Video Vm that includes features extracted from two measurements: d1, d2 for each eye (j = 1 for left eye and j = 2 for right eye)
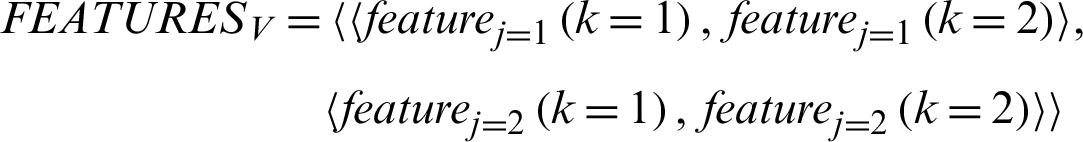
where k represents horizontal direction (k = 1 means movement to the right, and k = 2 means movement to the left).
Note that d1 and d2 are the distances between the center of iris and the right, and left boundaries respectively, as shown in Fig. 1.
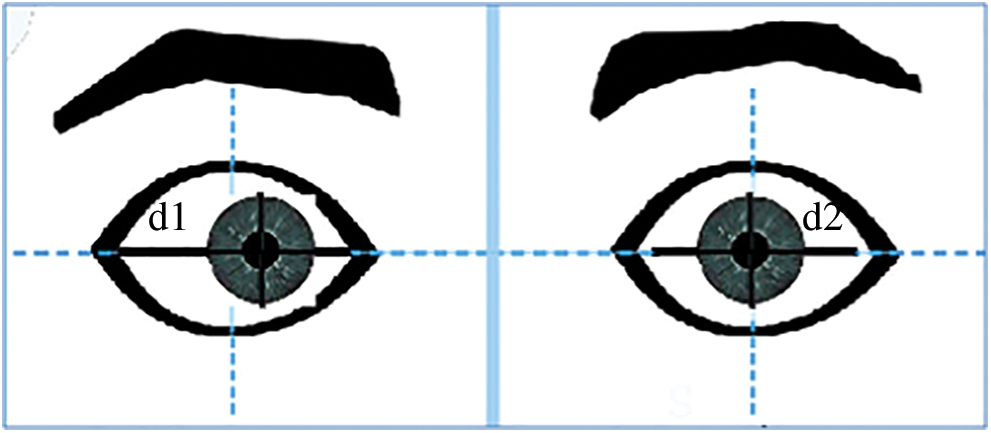
Figure 1: Depiction of d1, d2, which are the distances between the center of iris and the right, and left boundaries
G-Transform
G-Transform, as proposed here, is the integral of summation of several sinusoidal waves from i = 1 to N, N represents the last frame. All the sin waves have the same frequency f with different amplitudes (amplitude = di, where di is the distance measured from the center of the iris due to motion of the iris in subsequent frames of a video) and with different phases ( ). G-Transform represents several distances measured from the center of the iris due to motion of the iris in the frames of the videos that represent patients with different strabismus conditions including no strabismus (no strabismus will have zero to unnoticed eye movement). It amplifies the distance and calculates it in one single measurement for each eye.
Method to calculate G-Transform

where  ,
,
where k represents horizontal direction (k = 1 means movement to the right, and k = 2 means movement to the left)
The G-Transform for left eye, j = 1

The G-Transform for right eye, j = 2

Fig. 2 depicts simulation results showing the correlation between the actual angle of deviation of strabismus in patients from an actual physician diagnosis, and the G-Transform extracted from the videos of the patients, in the right eye.
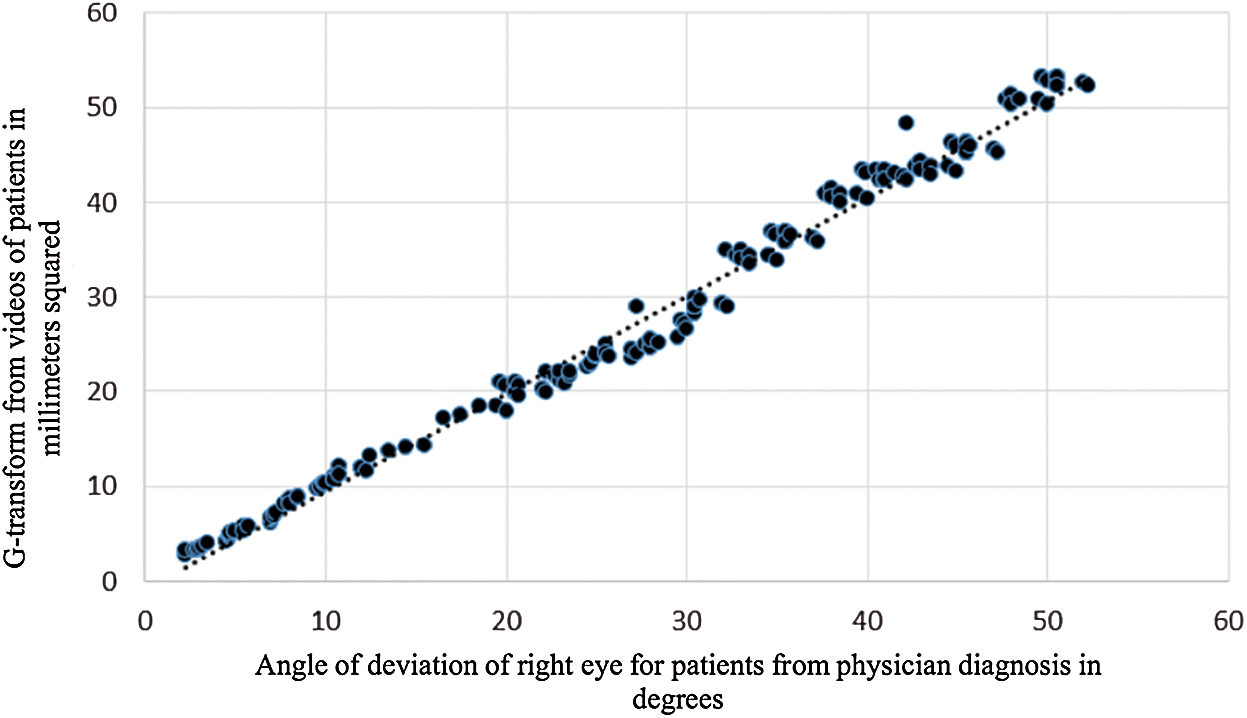
Figure 2: The correlation between actual angle of deviation of strabismus in patients, and the G-Transform extracted from the videos of the patients in right eye
Fig. 3 depicts Bland–Altman Plot for right eye between the actual angle of deviation of strabismus in patients from an actual physician diagnosis, and the G-Transform extracted from the videos of the patients, in the right eye. See Algorithm 1.

:
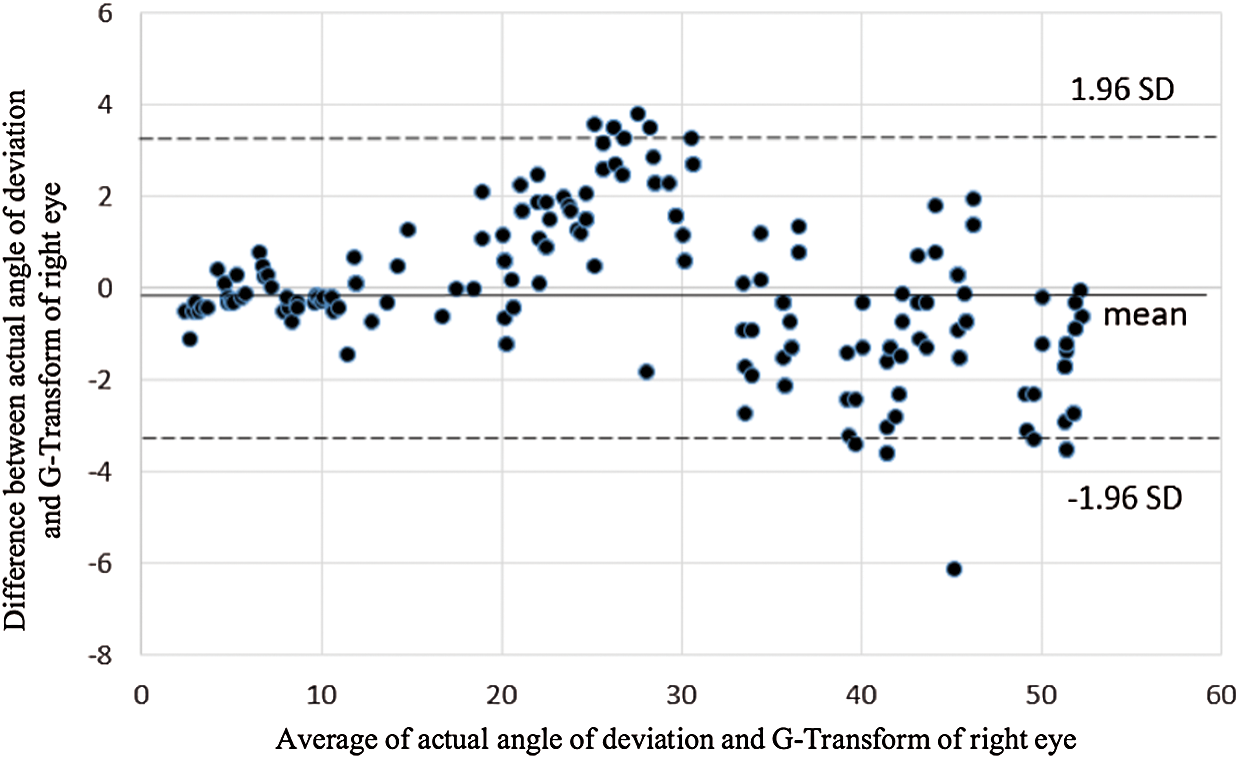
Figure 3: Bland–Altman Plot for right eye
Fig. 4 depicts simulation results showing the correlation between the actual angle of deviation of strabismus in patients from an actual physician diagnosis, and the G-Transform extracted from the videos of the patients, in the left eye.
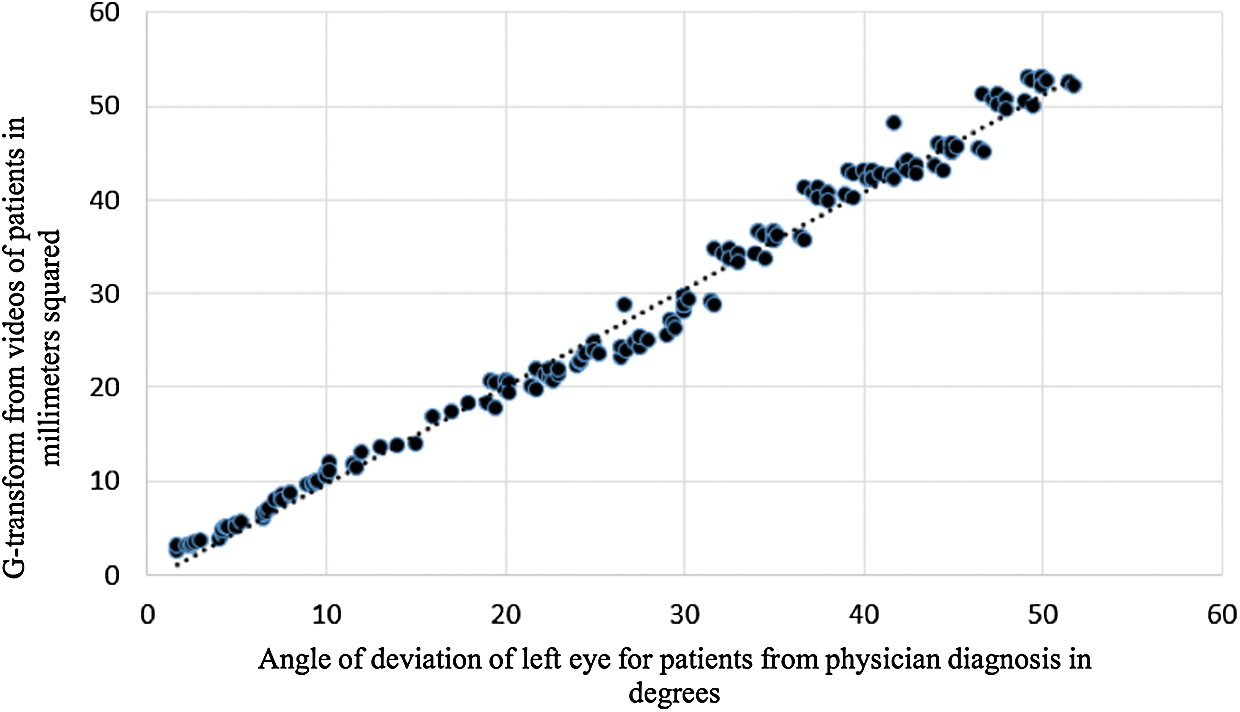
Figure 4: The correlation between actual angle of deviation of strabismus in patients, and the G-Transform extracted from the videos of the patients in left eye
Fig. 5 depicts Bland–Altman Plot for right eye between the actual angle of deviation of strabismus in patients from an actual physician diagnosis, and the G-Transform extracted from the videos of the patients, in the left eye.
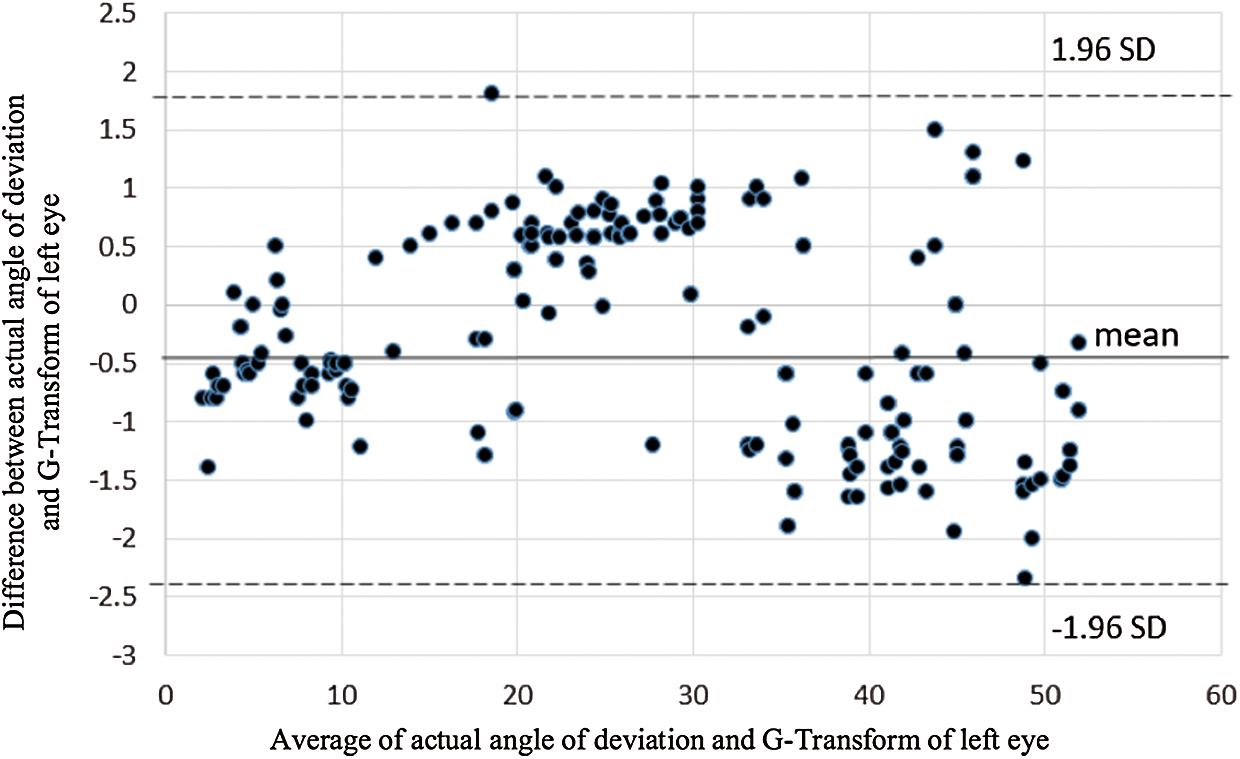
Figure 5: Bland–Altman Plot for left eye
The correlation plots in Figs. 2 and 4 for right and left eye respectively, present the positive correlation between the two measurements namely the actual angle of deviation: A, and the G-Transform: G. The strong linear relationship occurs between A and G as shown from the figure where the slope is 1. This line is at a 45-degree angle.
Pearson’s r in Eq. (5) indicates the kind of association between two variables, for r > 0 and approaching 1, the r indicates strong positive correlation.

We applied r in Eq. (5) to the two variables: the actual angle of deviation of strabismus in patients, and the G-Transform in both eyes. We used the data in Figs. 2 and 4.
For the right eye: r = 0.92
For the left eye: r = 0.93
This implies the high positive correlation between A and G.
Bland–Altman plots in Figs. 3 and 5, present the agreement between two measurements. The two measurements are the actual angle of deviation: A, and the G-Transform: G. The difference between A and G, where the upper and lower dotted lines denote the 1.96 SD, which is the 95% limit of agreement. The unnoted line illustrates the mean of the differences. The difference between the manual A and the computerized G plotted against the mean of the manual A and G. As shown, there is no general trend found that indicates that the values of one test to be higher or lower than the values of the other.
In the training phase we are going to build a decision tree from the actual diagnosis of the patients. Then a predictor is going to be built from patients’ videos and generate association rules with the decision tree.
The training phase is summarized as follows:
a) Build the decision tree from FEATURESP for all P.
b) Generate rules from the extracted features, FEATURESP and FEATURESV.
The testing phase is described as the phase that feeds new and unlabeled videos from the testing corpus into the system to be classified.
In this section we are introducing the different algorithms that comprises our system. Tab. 3 illustrated an example of the data from labeled videos of patients. The Diagnosis is “no strabismus” in any eye with angle of deviation < 5. Otherwise the Diagnosis is strabismus with the denoted angle of deviation. We have four different diagnosis as such: No Strabismus, Unilateral Strabismus with angles of deviation equal to  l, Unilateral Strabismus with angles of deviation equal to
  r, or Alternating Strabismus with angles of deviation equal to
  l and
l and  r.
r.
Table 3: Example of labeled videos of patients
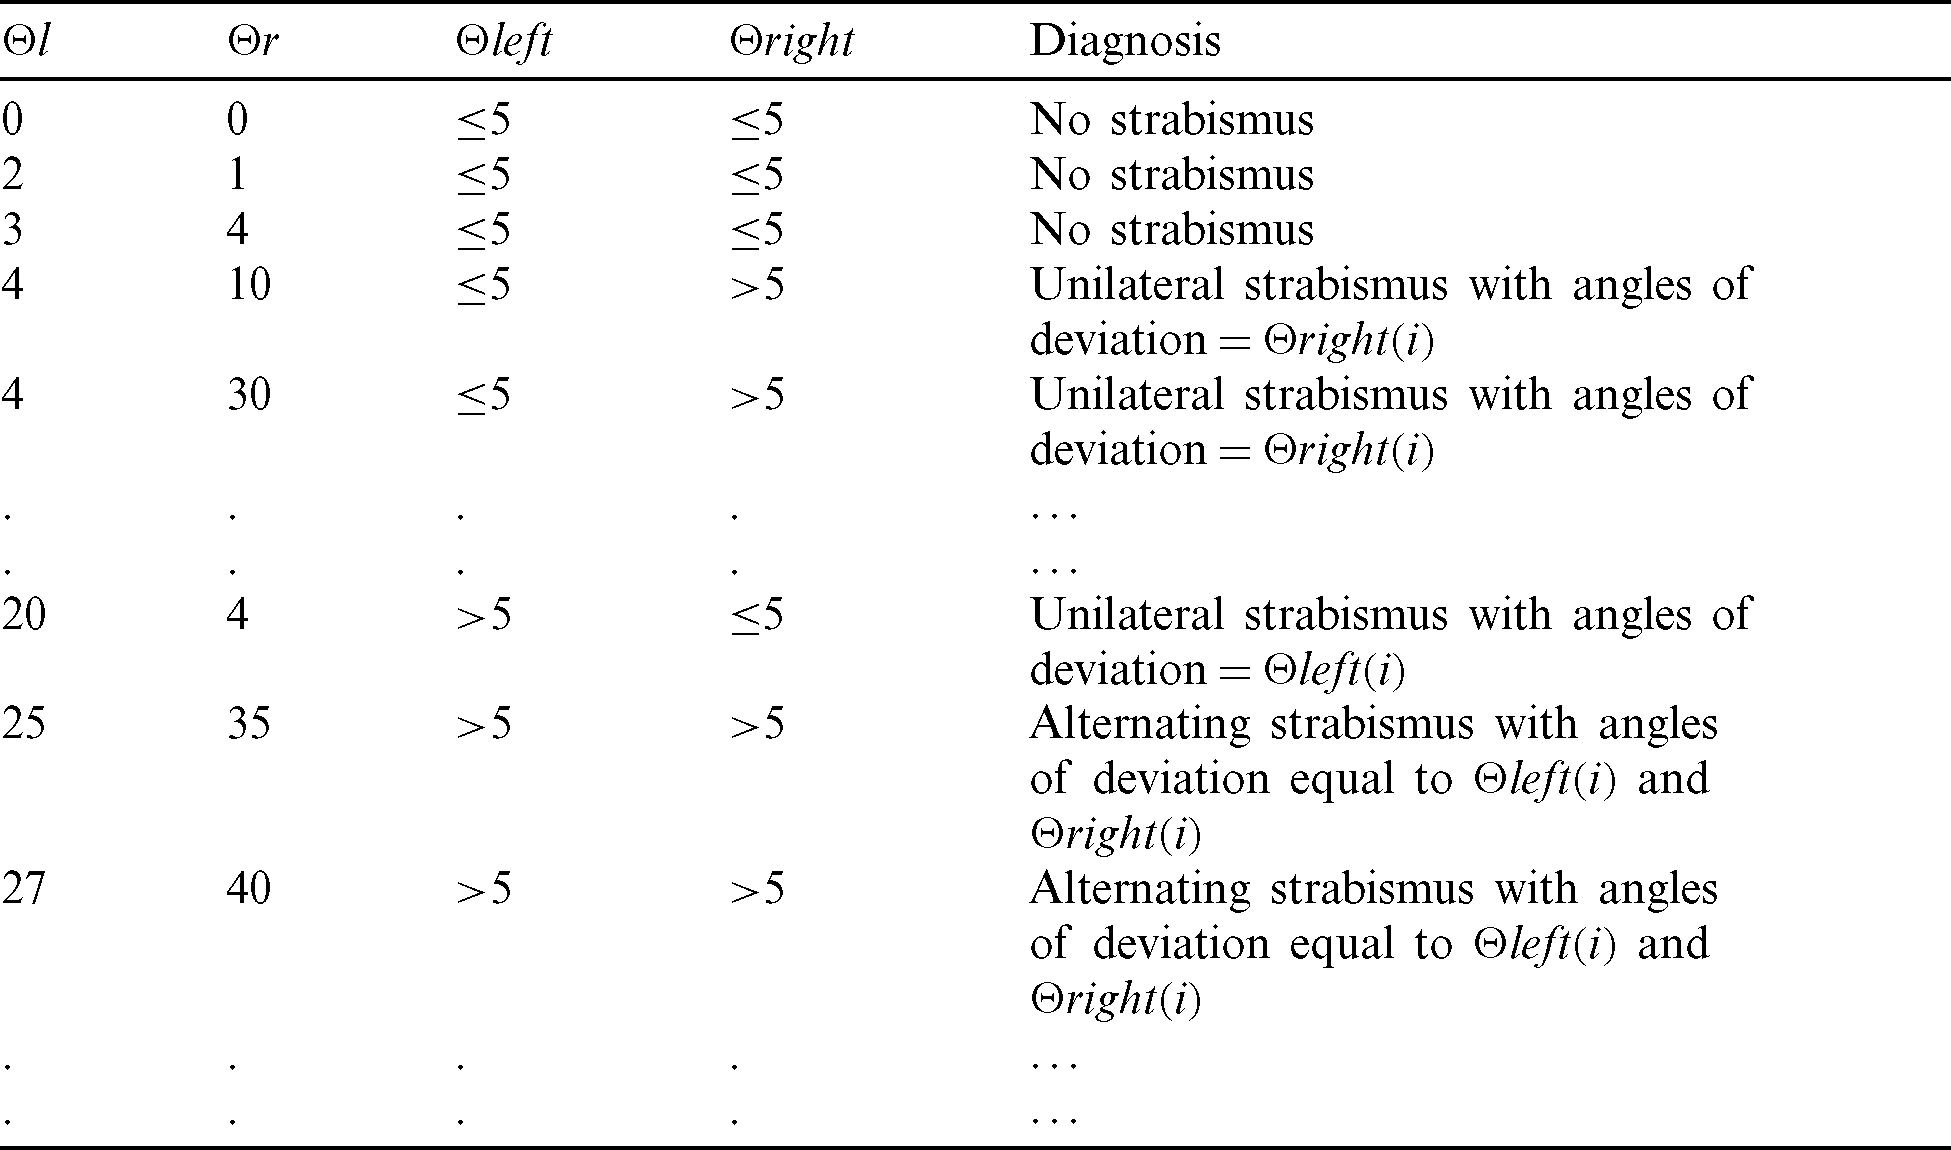
As shown in Tab. 3, two more attributes  and
and  are added. They have two values either “
 5” or “ > 5”. These two attributes are the feature attributes, and the target attribute is Diagnosis. We don’t use the attributes
  l and
l and  r in building the decision tree, which is depicted in Fig. 6.

Figure 6: Decision tree from data of real patients depending on angle of deviation from both eyes and patient diagnosis
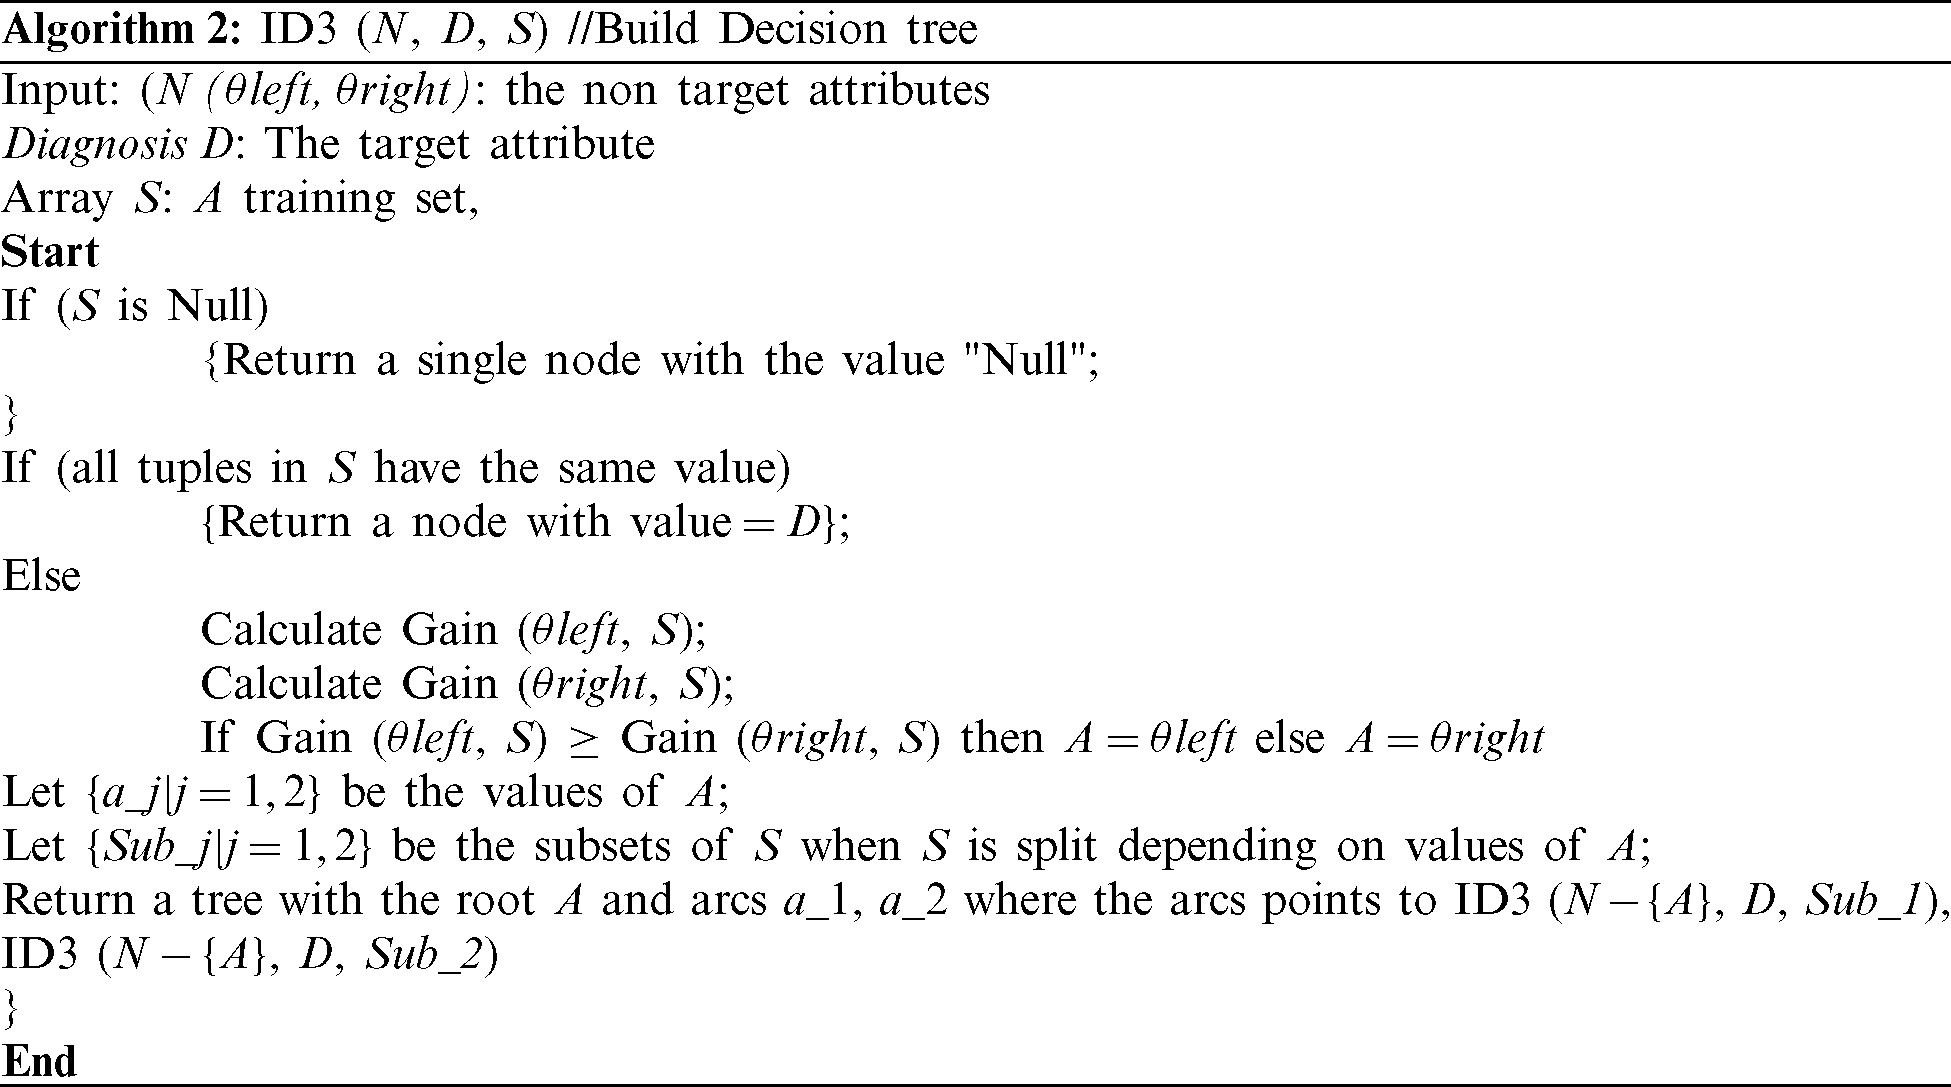
From Tab. 3 we built the ID3 decision tree as depicted in Algorithm 2, using  and
and  as non-target attributes and diagnosis as target attribute.
:
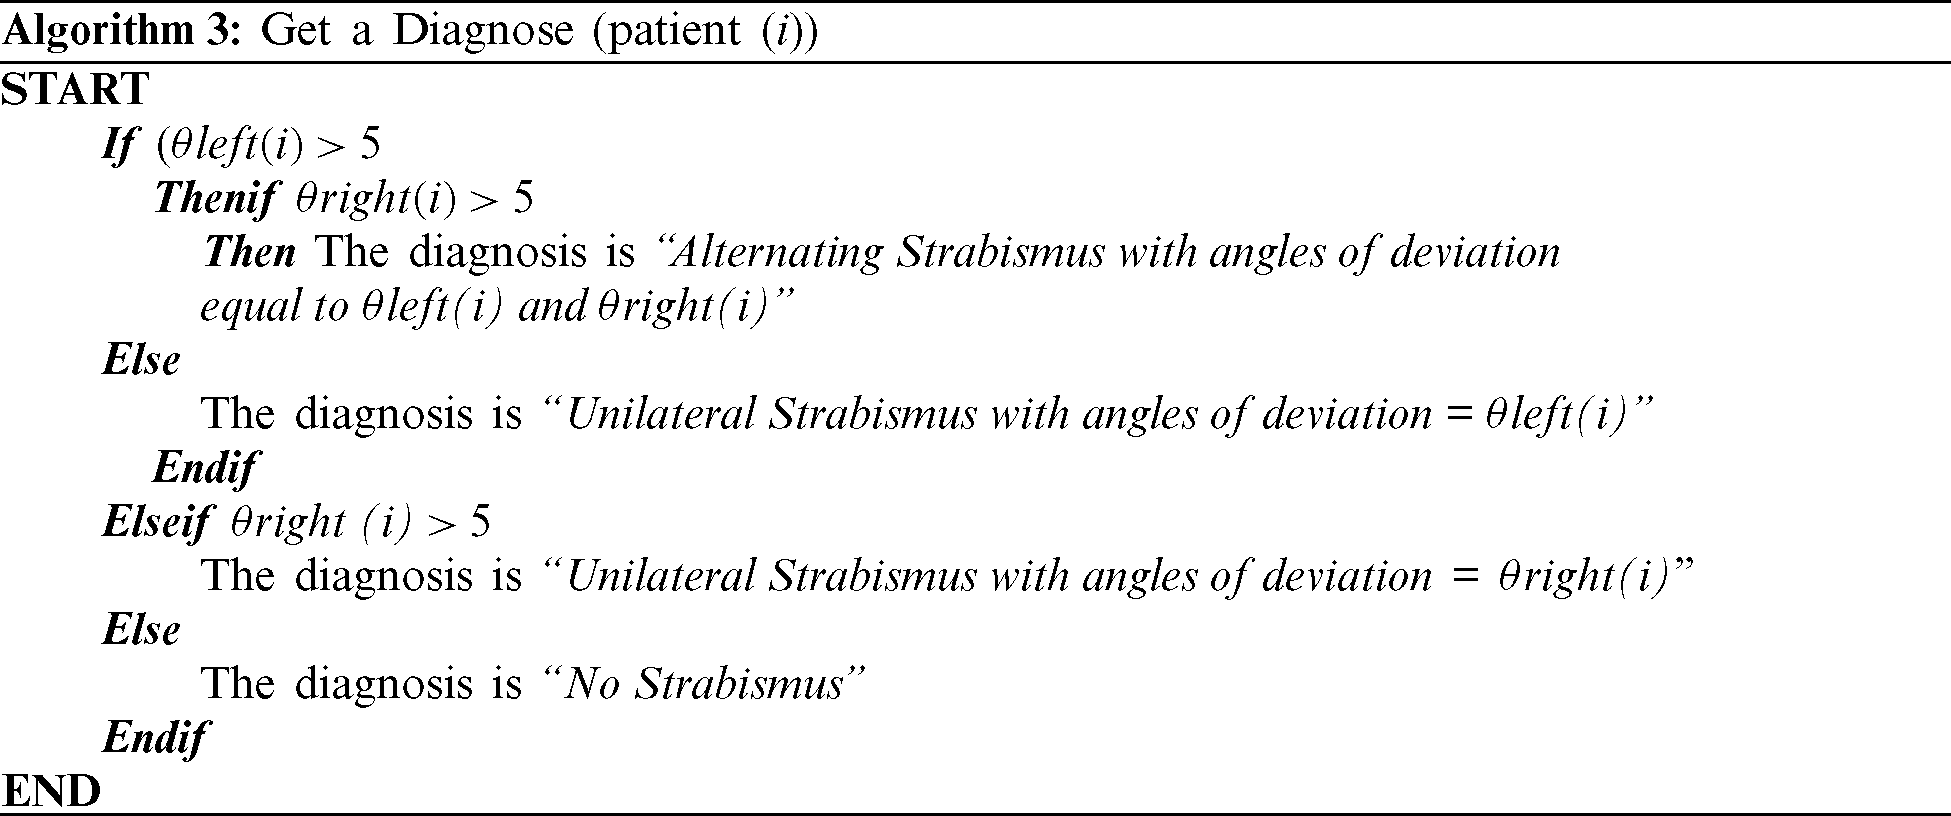
Algorithm 3 depicts deciding a diagnose from the decision tree for an arbitrary patient patient(i) with two known attributes  and
and  , and outputs the diagnosis.
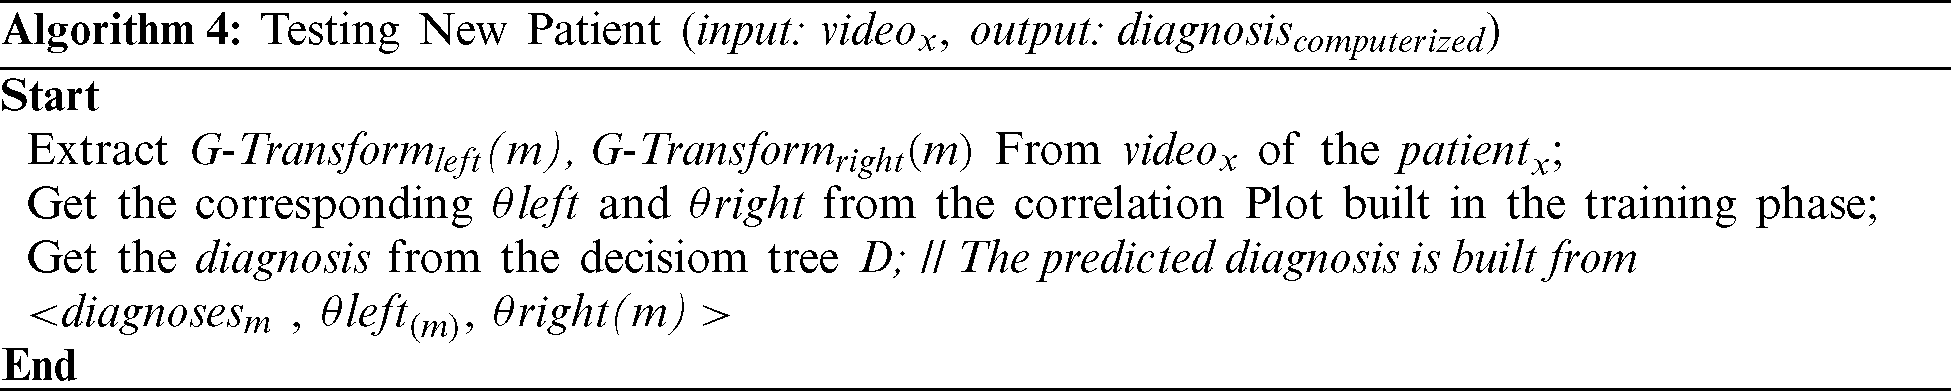
Algorithm 4 is to generate a method to determine actual diagnosis and actual angles of deviation of left and right eyes from the G-Transform of both left and right eyes.
For a new case, we first compute the G-Transform of both eyes, and then we get corresponding  and
and  from the correlation plots that is built from labeled cases from physician diagnosis (Figs. 2 and 4). Finally, we use the decision tree in Fig. 6 to get a diagnosis.
This study was performed through 192 cases from data set VD-ACTSE dataset [12]. Each video was 60 frames per second. A leave-out policy was followed, meaning that classification was done on 170 cases (input data set Sinput) and testing was done on the remaining 22 tested data set (Stested). For more accuracy, we repeated the classification 10 times, leaving out a different 22 cases each time. The total testing cases were 220.
Several tables summarizing our results:
• Tab. 4 summarizes different cases. The average deviation according to actual physician diagnosis and our proposed classifier for both left and right eye are presented. The actual diagnoses are compared to those of our proposed system. Mismatched happened in 9 cases, and cases matched in 211. Most of the mismatched were in cases with very small angles of deviation.
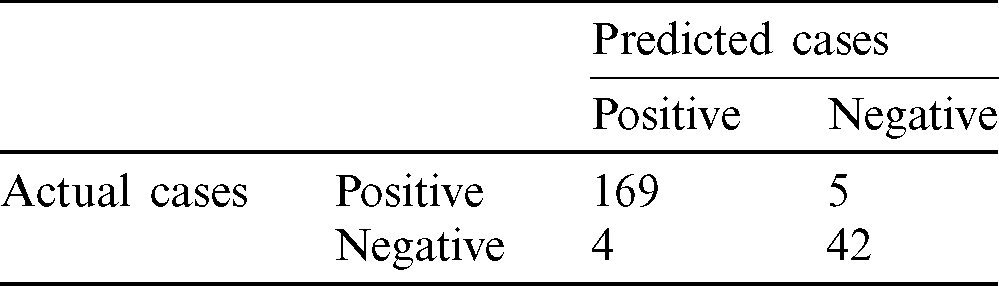
• Tab. 5 shows the confusion matrix to be used in the experiments.
• Tab. 6 shows the actual confusion matrix of the experiments, in which 169 cases were actually positive and diagnosed as positive (True positive) and 42 true negatives were predicted correctly. Only 5 positive cases were diagnosed as negative and only 4 negative case as positive
Table 4: The proposed classifier experimental results versus actual strabismus diagnosis results
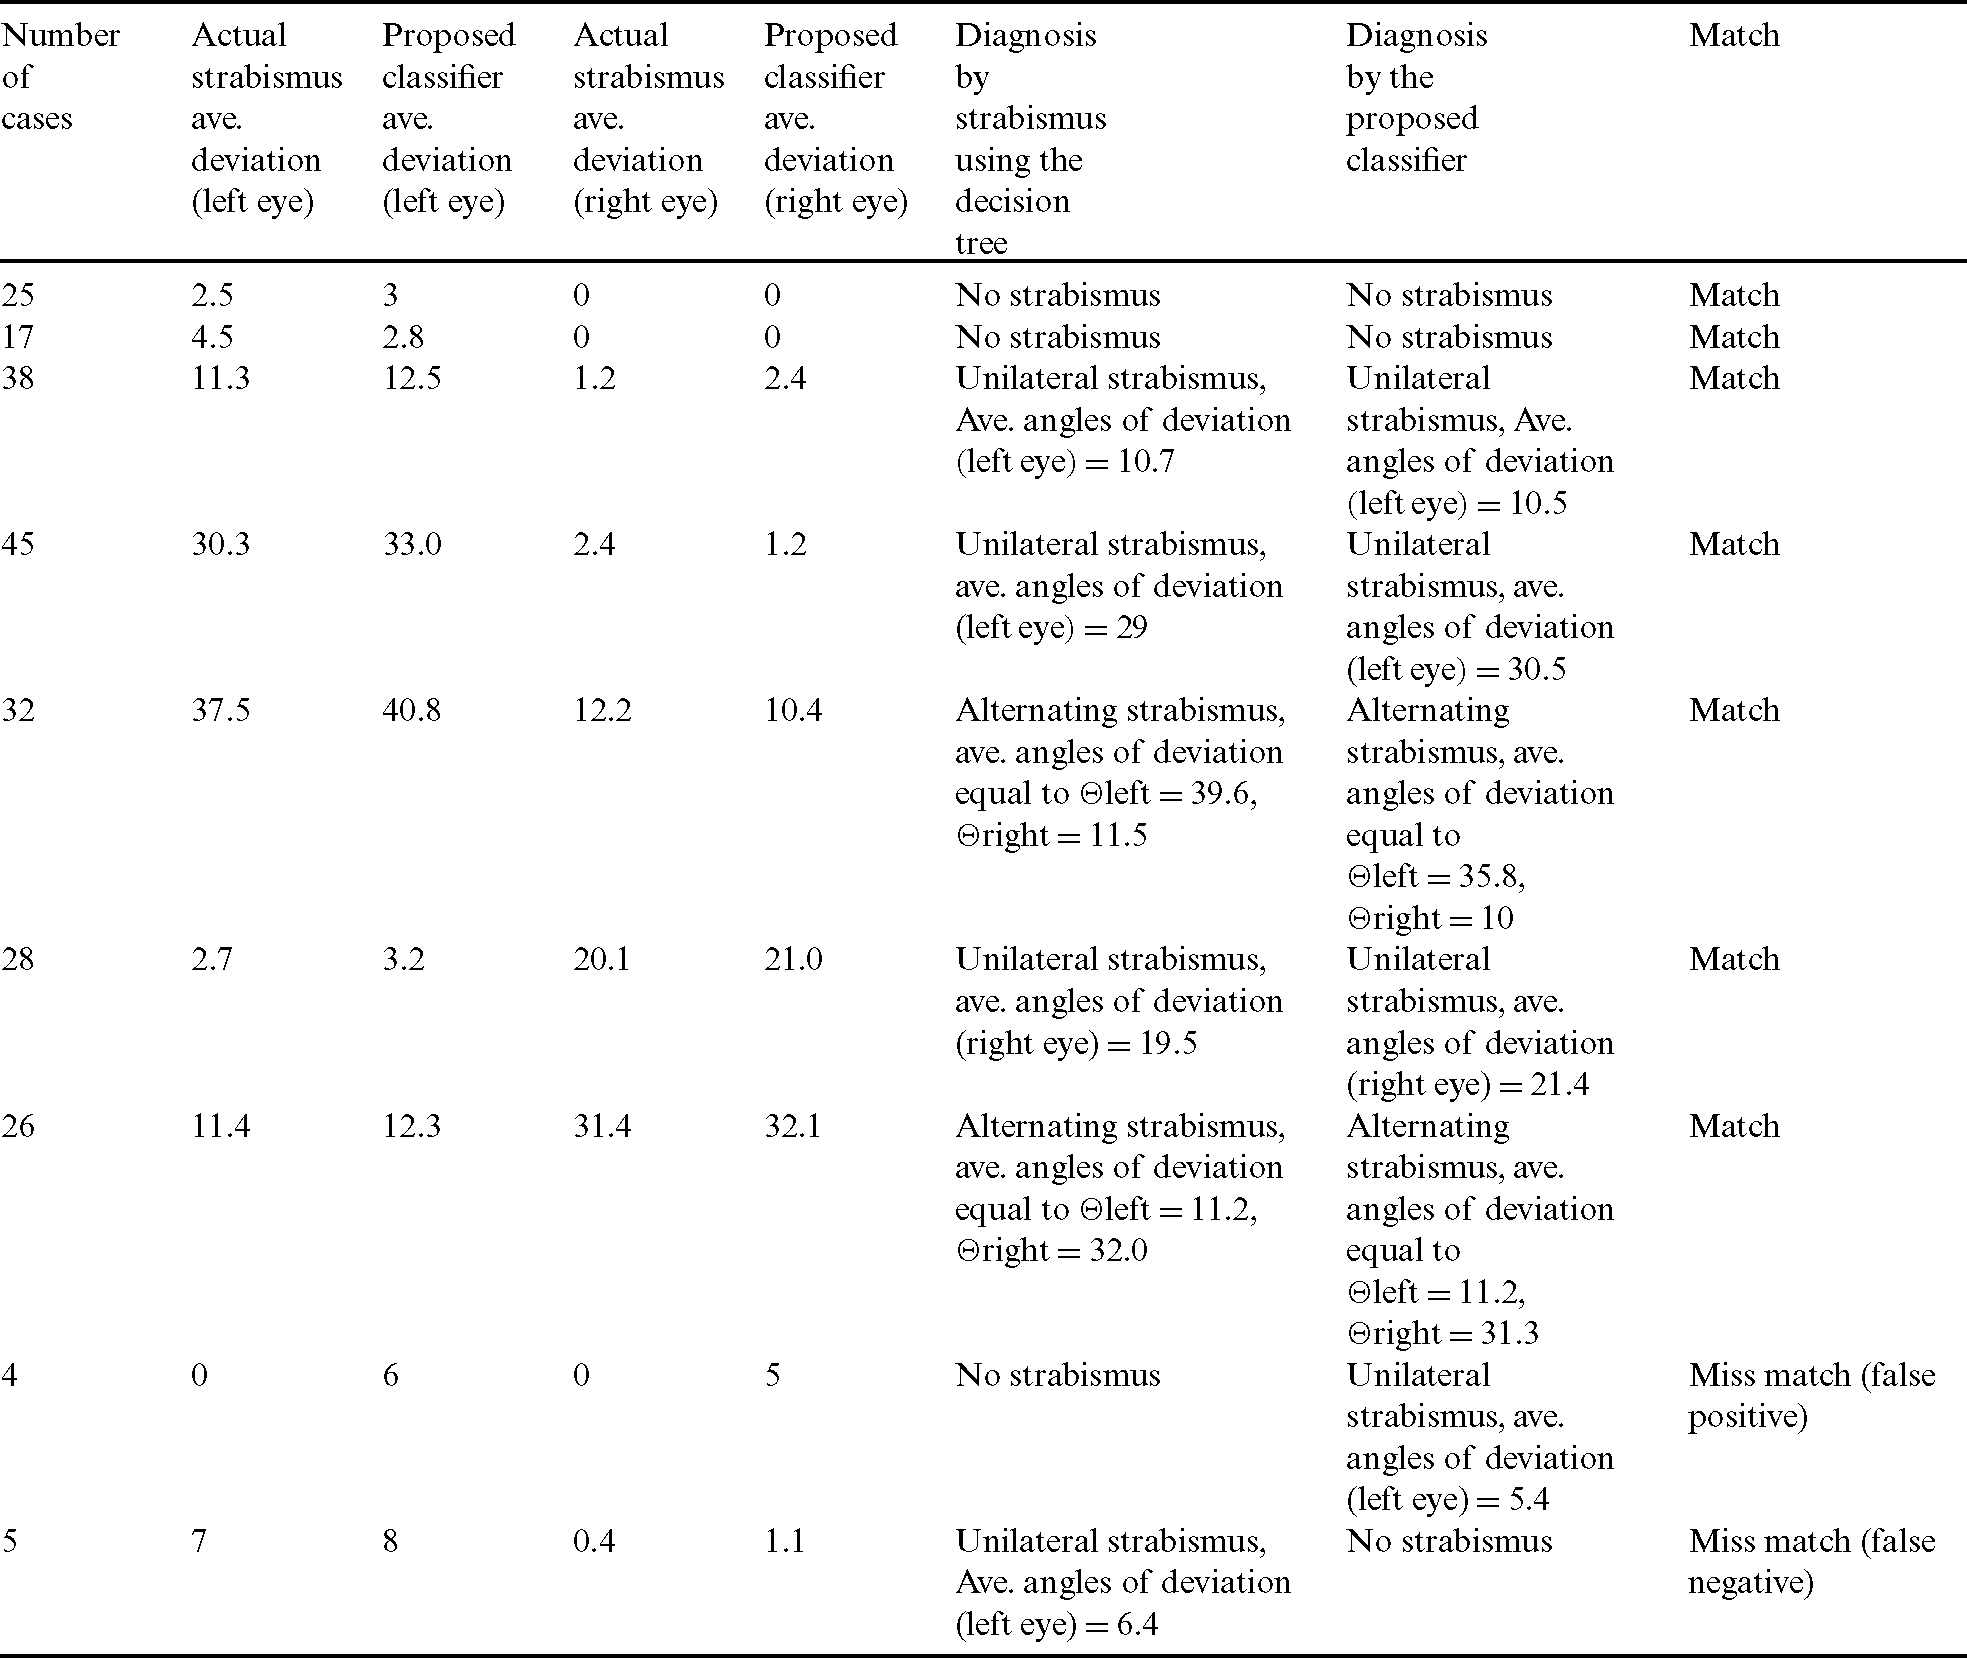
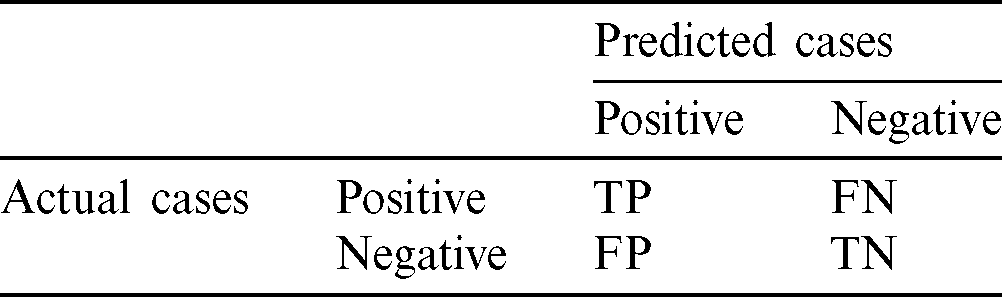
Table 6: Actual confusion matrix for one run of the classifier
The evaluation of a classifier is based on its accuracy, sensitivity, and specificity according to Eqs. (6)–(8) respectively.


where TP is the number of true positives (number of correctly predicted positive cases), TN is the number of true negatives (number of correctly predicted negative cases), FP is the number of false positives (number of incorrectly predicted positive cases), and FN is the number of false negatives (number of incorrectly predicted negative cases). The accuracy of a classifier is the percentage of correctly predicted cases among the test set, the sensitivity is the rate of true positives, and the specificity is the rate of true negatives.
Several figures show our simulation results:
• Fig. 7 shows the distribution of the different cases. The total number of cases, and the numbers of normal and strabismus cases are plotted, and the output of our proposed system is presented, showing the different number of cases of strabismus of different types in the testing set.
• Fig. 8 shows the accuracy, sensitivity, and specificity of five runs of the classifier, each with a different set of input data Sinput and a different set of tested data Stested. It also shows the average accuracy, sensitivity, and specificity of 200 runs of the classifier, each with a different set of input data Sinput and different set of tested data Stested.
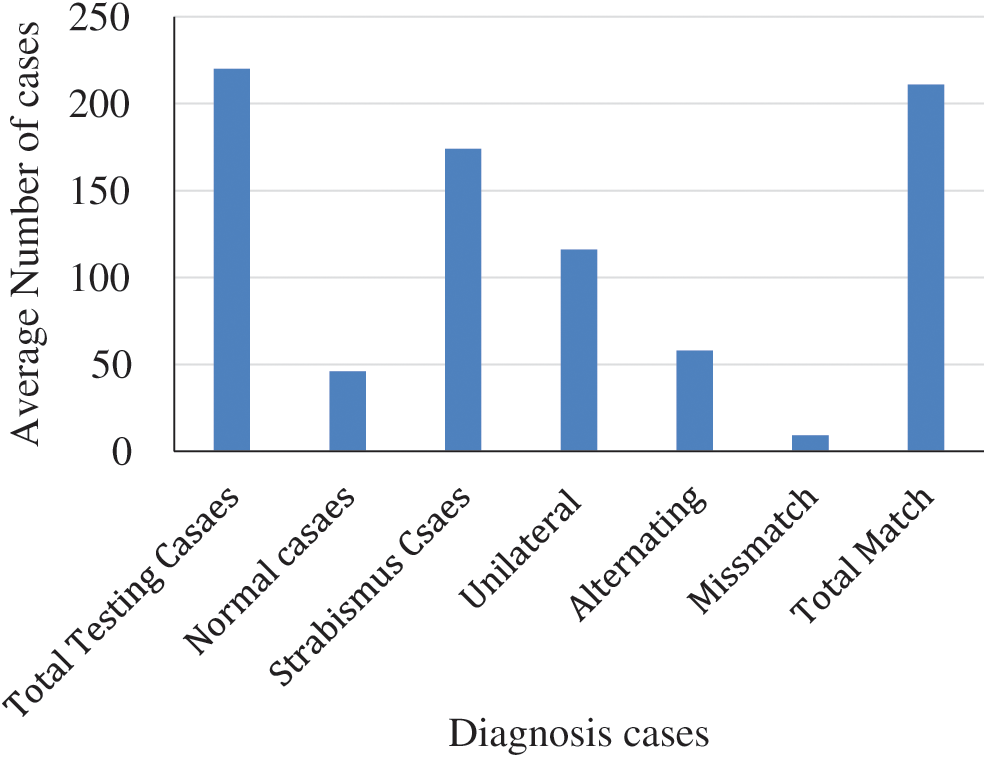
Figure 7: Average number of patient cases in 10 runs

Figure 8: Accuracy, sensitivity, and specificity of five different runs, and the average accuracy, average sensitivity, and average specificity of 200 runs
5.2 Results of the Deviation Measurement
For the purposes of analyzing the accuracy of the deviation predicted by the proposed algorithm, the angle of deviation as diagnosed by the physician for each case is considered the ground truth. The angles of deviation of the proposed computerized method are extracted using the correlation plots, and then compared with the ground truths. The accuracy of the angle of deviation measures was computed as the percentage of deviations for which the error between the prediction and the ground truth was lower than a threshold.
The experiments yielded different match and mismatch cases. 95.9% of the cases were match cases and predicted correctly; 4.1% were light cases and could not be detected from the videos.
In this paper, we have proposed a novel method for detecting and measuring strabismus. The method uses classification and feature-extraction techniques. The former is used to classify videos based on the labeled case videos of actual diagnosis. The latter is used to extract eye features from videos and define rules for future diagnosis. The algorithms used MPEG videos of subjects undergoing the cover test to predict the results. Training of the system was done by first classifying the actual cases by diagnosis and then generating matching rules from the displacement measurements of the movement of the iris. We validated the method using the ground truth of the deviations from the database of the actual diagnoses of the cases.
The experimental results suggest that our computerized system can perform to a high accuracy in evaluating strabismus deviation. The proposed system achieved a satisfying accuracy. The classifier was tested using a set of testing videos (testing corpora). The results showed 95.9% accuracy, 4.1% were light cases and could not be detected correctly from the videos, half of them were false positive and the other half was false negative.
Despite the promising results, the proposed method has to be validated in a bigger volume of videos. The system should also detect other types of strabismus.
Funding Statement: This research was funded by the Deanship of Scientific Research at Princess Nourah bint Abdulrahman University, through the Research Funding Program (Grand No. FRP-1440-32).
Conflicts of Interest: The authors declare that they have no conflicts of interest to report regarding the present study.
References
1. A. O. A. American Optometric Association, “Strabismus (crossed eyes),” 2019. [Online]. Available: https://www.aoa.org/healthy-eyes/eye-and-vision-conditions/strabismus?sso=y.
2. J. D. S. De Almeida, A. C. Silva, A. C. De Paiva and J. A. M. Teixeira. (2012). “Computational methodology for automatic detection of strabismus in digital images through Hirschberg test,” Computers in Biology and Medicine, vol. 42, no. 1, pp. 135–146.
3. N. M. Bakker, B. A. J. Lenseigne, S. Schutte, E. B. M. Geukers and P. P. Jonker et al. (2013). , “Accurate gaze direction measurements with free head movement for strabismus angle estimation,” IEEE Transaction Biomedical Engineering, vol. 60, no. 11, pp. 3028–3035.
4. B. De Smet, L. Lempereur, Z. Sharafi, Y. G. Gueheneuc, G. Antoniol et al. (2014). , “Taupe: Visualizing and analyzing eye-tracking data,” Science of Computer Programming, vol. 79, pp. 260–278.
5. L. Wang, D. Yu, F. Qiu and J. Shen. (2007). “A digital diagnosis instrument of Hess screen for paralytic strabismus,” in Int. Conf. on Bioinformatics and Biomedical Engineering, Wuhan, China, pp. 1252–1255.
6. S. T. Moore, I. S. Curthoys and T. Haslwanter. (1995). “Potential clinical applications of video-based eye position measurement,” IEEE Engineering in Medicine and Biology Society, vol. 2, pp. 1627–1628.
7. N. Pop, A. Demea, B. Gherman, D. Pisla and R. Holonec. (2019). “Virtual instrument used for the evaluation of extraocular motility,” in E-Health and Bioengineering Conf., Iasi, Romania, pp. 1–4.
8. Z. Chen, H. Fu, W. Lo and Z. Chi. (2018). “Strabismus recognition using eye-tracking data and convolutional neural networks,” Journal of Healthcare Engineering, vol. 2018, no. 4, pp. 1–9.
9. T. O. Simoes, J. C. Souza, J. D. S. De Almeida, A. C. Silva and A. C. De Paiva. (2019). “Automatic ocular alignment evaluation for strabismus detection using U-NET and ResNet networks,” in 8th Brazilian Conf. on Intelligent Systems, Salvador, Brazil, pp. 239–244.
10. Z. Chen, H. Fu, W. Lo, Z. Chi and B. Xu. (2018). “Eye-tracking-aided digital system for strabismus diagnosis,” Healthcare Technology Letters, vol. 5, no. 1, pp. 1–6. [Google Scholar]
11. M. W. Seo, H. K. Yang, J. M. Hwang and J. M. Seo. (2014). “The automated diagnosis of strabismus using an infrared camera,” in 6th European Conf. of the Int. Federation for Medical and Biological Engineering, Cham: Springer, vol. 45. [Google Scholar]
12. ADMINCSC, “Video dataset based on automated cover tests for strabismus evaluation,” 2019. [Online]. Available: https://ssitrc.chuhai.edu.hk/index.php/2019/01/31/video-dataset-based-on-automated-cover-tests-for-strabismus-evaluation/. [Google Scholar]
13. L. Kosikowski and A. Czyzewski. (2009). “Computer based system for strabismus and amblyopia therapy,” in Int. Multi-Conf. on Computer Science and Information Technology, Mragowo, pp. 493–496. [Google Scholar]
14. S. Kim, L. J. Lombardino, W. Cowles and L. J. Altmann. (2014). “Investigating graph comprehension in students with dyslexia: An eye tracking study,” Research in Developmental Disabilities, vol. 35, no. 7, pp. 1609–1622. [Google Scholar]
15. J. Orlosky, Y. Itoh, M. Ranchet, K. Kiyokawa, J. Morgan et al. (2017). , “Emulation of physician tasks in eye-tracked virtual reality for remote diagnosis of neurodegenerative disease,” IEEE Transaction on Visual Computing and Graphics, vol. 23, no. 4, pp. 1302–1311. [Google Scholar]
16. O. Yehezkel, M. Belkin and T. Wygnanski-Jaffee. (2019). “Automated diagnosis and measurement of strabismus in children,” American Journal of Ophthalmology, vol. 213, pp. 226–234. [Google Scholar]
17. P. Žiak, A. Holm, J. Halička, P. Mojžiš and D. P. Piñero. (2017). “Amblyopia treatment of adults with dichoptic training using the virtual reality oculus rift head mounted display: Preliminary results,” BMC Ophthalmology, vol. 17, pp. 105. [Google Scholar]
18. N. Herbison, D. MacKeith and A. Vivian. (2016). “Randomised controlled trial of video clips and interactive games to improve vision in children with amblyopia using the I-BiT system,” British Journal of Ophthalmology, vol. 100, no. 11, pp. 1511–1516. [Google Scholar]
19. Y. Zheng, H. Fu, R. Li, W. Lo, Z. Chi et al. (2019). , “Intelligent evaluation of strabismus in videos based on an automated cover test,” Applied Sciences, vol. 9, pp. 731. [Google Scholar]
20. J. Blaha and M. Gupta. (2014). “Diplopia: A virtual reality game designed to help amblyopics,” in 2014 IEEE Virtual Reality (VR), Minneapolis, MN, pp. 163–164. [Google Scholar]
21. G. Chanel, M. Bétrancourt, T. Pun, D. Cereghetti and G. Molinari. (2013). “Assessment of computer-supported collaborative processes using interpersonal physiological and eye-movement coupling,” in Humaine Association Conf. on Affective Computing and Intelligent Interaction, Geneva, pp. 116–122. [Google Scholar]
22. V. Vezhnevets and A. Degtiareva. (2003). Robust and Accurate Eye Contour Extraction, Moscow, Russia: Graphicon, pp. 81–84. [Google Scholar]
23. T. L. A. Valente, J. D. S. De Almeida, A. C. Silva, J. A. M. Teixeira and M. Gattass. (2017). “Automatic diagnosis of strabismus in digital videos through cover test,” Computer Methods and Programs in Biomedicine, vol. 140, pp. 295–305. [Google Scholar]
24. Z. Yang, H. Fu, B. Li, W. Lo and D. Wen. (2018). “An automatic stimulus and synchronous tracking system for strabismus assessment based on cover test,” in Int. Conf. on Intelligent Informatics and Biomedical Sciences, Bangkok, Thailand, vol. 3, pp. 123–127. [Google Scholar]
25. J. Lu, J. Feng, Z. Fan, L. Huang, C. Zheng et al. (2018). , “Automated strabismus detection based on deep neural networks for telemedicine applications,” arXiv preprint arXiv: 02940. [Google Scholar]
26. J. V. Eenwyk, A. Agah, J. Giangiacomo and G. Cibis. (2008). “Artificial intelligence techniques for automatic screening of amblyogenic factors,” Transactions of the American Ophthalmological Society, vol. 106, pp. 64–73. [Google Scholar]
27. W. Kulkarni, S. Ramtirth, M. Ambaskar, S. Patki and M. Kulkarni. (2018). “Driver alertness detection algorithm,” in Proc. Fourth Int. Conf. on Computing Communication Control and Automation, Pune, India, pp. 1–4. [Google Scholar]
28. M. H. Baccour, F. Driewer, E. Kasneci and W. Rosenstiel. (2019). “Camera-based eye blink detection algorithm for assessing driver drowsiness,” in IEEE Intelligent Vehicles Symposium (IVParis, France, pp. 987–993. [Google Scholar]
 | This work is licensed under a Creative Commons Attribution 4.0 International License, which permits unrestricted use, distribution, and reproduction in any medium, provided the original work is properly cited. |