DOI:10.32604/cmc.2021.014688
| Computers, Materials & Continua DOI:10.32604/cmc.2021.014688 | |
| Article |
The Interaction between Microcapsules with Different Sizes and Propagating Cracks
1College of Materials Science and Engineering, Chongqing University, Chongqing, 400045, China
2Institute of Continuum Mechanics, Leibniz University Hannover, Hannover, Germany
3Department of Geotechnical Engineering, Tongji University, Shanghai, China
4CIRTech Institute, Ho Chi Minh City University of Technology (HUTECH), Ho Chi Minh City, Vietnam
5Department of Architectural Engineering, Sejong University, 209 Neungdong-ro, Gwangjin-gu, Seoul, 05006, Korea
*Corresponding Author: Shuai Zhou. Email: shuaizhou@cqu.edu.cn
Received: 09 October 2020; Accepted: 06 November 2020
Abstract: The microcapsule-contained self-healing materials are appealing since they can heal the cracks automatically and be effective for a long time. Although many experiments have been carried out, the influence of the size of microcapsules on the self-healing effect is still not well investigated. This study uses the two-dimensional discrete element method (DEM) to investigate the interaction between one microcapsule and one microcrack. The influence of the size of microcapsules is considered. The potential healing time and the influence of the initial damage are studied. The results indicate that the coalescence crack is affected by the size of holes. The elastic modulus, the compressive strength and the coalescence stress decrease with the rising radius of holes. The initial damage in experiments should be greater than 95% of the compressive strength to enhance the self-healing effect. The large microcapsules require slight initial damage. Both a new type of displacement field near the crack and a new category of coalescence crack are observed. The influence of sizes of holes on the cracking behavior of concrete with a circular hole and a pre-existing crack is clarified.
Keywords: Microcapsule; size; cracking processes; DEM
The microcapsule-contained self-healing materials attract increasing research interest [1]. The microcapsules, composed of the shell and healing agents, are embedded in the concrete. After breaking, the inside healing agents can heal the cracked concrete automatically. Although a lot of related studies have been conducted [2–8], the influence of the diameter of microcapsules on the self-healing effect is not well investigated. The cracking behavior of cementitious materials can be studied by numerical methods [9]. Fig. 1 shows the scanning electron microscope (SEM) picture of microcapsules and microcracks [10]. Considering that the shell of the microcapsule is thin, it can be regarded as a circular hole. When the hole and the crack are connected, the self-healing initiates [6,10].

Figure 1: Microcapsules and microcracks in cementitious materials
The defects in concrete have been investigated for a long time [11]. Previous research considered the interaction between a hole and a crack [6,10,12], while the influence of the sizes of holes on the cracking behavior was not analyzed. The propagation of cracks [13–19] has been widely investigated by meshfree methods [20,21], peridynamics [22,23], DEM [24,25], the extended isogeometric analysis [26], the smooth extended finite element method [27] and the phantom node method [28]. Compared with many other numerical methods, DEM has a clear physical meaning and a solid foundation, i.e., Newton’s laws of motion. Few artificial adjustments are adopted. It presents many merits in simulating micro-crack initiation and propagation associated with the failure processes of brittle materials, and is widely used to investigate the cracking behavior of cementitious materials [29,30]. However, the influence of the sizes of holes in the concrete is ignored. The required curing time of the healing agents should be shorter than the potential healing time to prevent the propagation of cracks. The potential healing time is related to the coalescence between the crack and the microcapsules, and the failure time of the specimen. If the potential healing time is short, the rapid curing agent should be adopted. But the factor which influences the potential healing time has not been studied. In the experiments, the initial damage was imposed on the specimens to induce the self-healing effect [31,32]. However, the influence mechanism of the initial damage on the self-healing effect has not been fully investigated.
The cracking process of cementitious materials with different sizes of holes is discussed to investigate the influence of sizes of microcapsules on the microcapsule-contained self-healing materials. Section 2 conducts the experiments and develops the DEM model. The cracking process is described and analyzed in Section 3. The influence of different factors on the cracking behavior is discussed in Section 4. Finally, the conclusions of the present study are summarized in Section 5.
2 Experimental and Numerical Studies
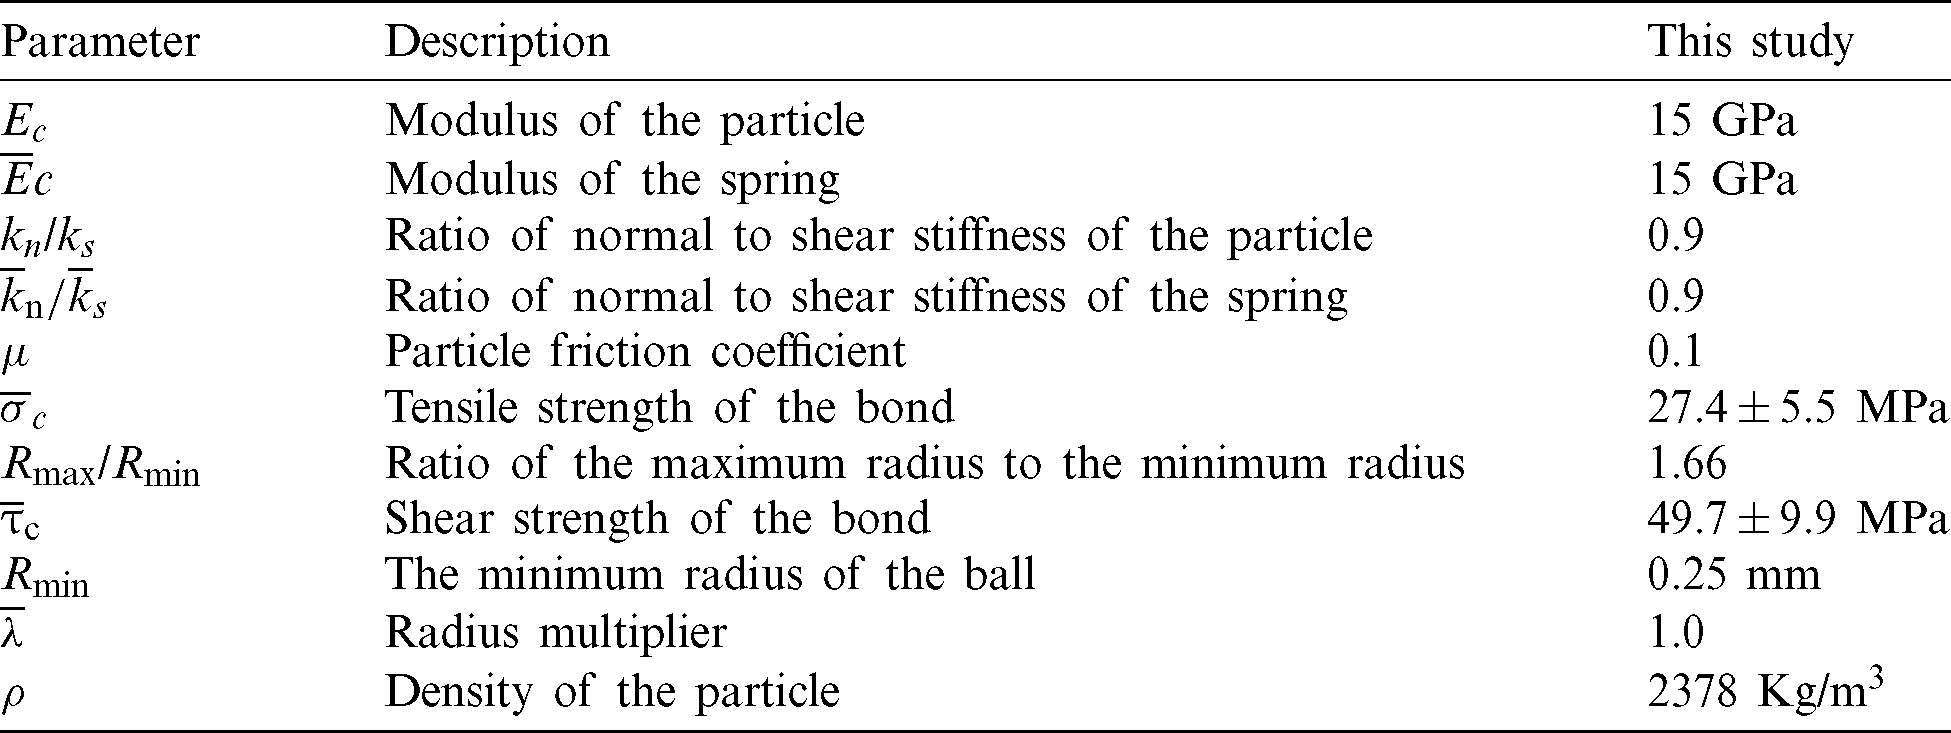
The experiments were conducted to study the effect of the size of holes on the specimens firstly. The materials were similar with that in our previous research [6]. In the cementitious materials, the water-cement ratio was 0.5, and the cement-sand ratio was 0.33 in mass. The samples adopted No. 42.5 ordinary Portland cement. Cylindrical specimens were produced and compressed to obtain the mechanical properties of the matrix, which is displayed in Tab. 1 [6]. By using the proper parameters of the DEM model in Tab. 2, the macro mechanical properties from experiments can be simulated properly.
Table 1: Experimental and numerical results of mechanical properties of materials
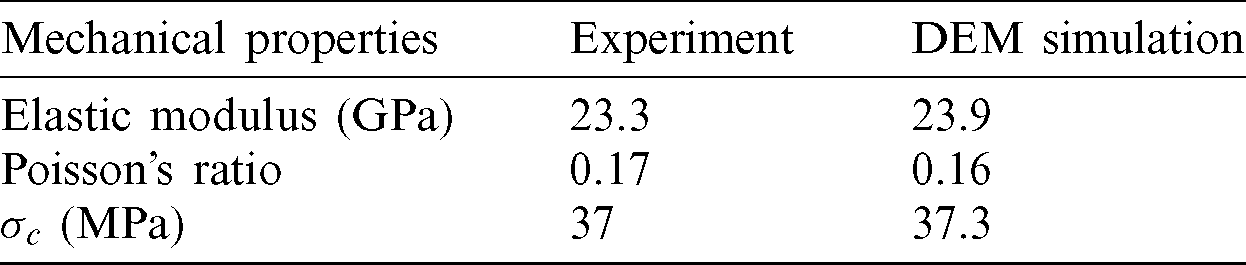
Table 2: Parameters of the DEM model
The produced specimens were  (in Fig. 2). The pre-existing crack was 30 mm, and different sizes of holes were considered. The detailed making process is illustrated previously [10,33].

Figure 2: The produced specimen
Two sets of specimens with different sizes of holes were tested. The radius of the hole in the first set of specimens was 5 mm, while the radius of the hole in the second set of specimens was 8 mm, to study the effect of sizes of holes on the cracking behavior of specimens. The MTS device was used to conduct the uniaxial compression test [34].
2.2 Development of the Numerical Model
Firstly, the intact DEM specimens were produced following the procedure by Itasca [35]. The specimen was  mm, which was the same as that in the experiment. Each specimen contained about 30,000 particles with a radius of 0.25 to 0.415 mm [10,30]. The parallel bond model was used between particles, which approximated the physical behavior of a cement-like substance joining two adjacent particles [10,29].
The iterative calibration procedure was adopted to set the microscopic properties of the DEM model [35]. The detailed adjustment process can be found in previous research [10,29,30]. By adopting the microscopic properties of the particles and the parallel bonds shown in Tab. 2, the measured cementitious material properties in Tab. 1 were obtained [10]. The numerical results are sensitive to the parameters. Considering the space limitation, the parametric sensitivity analysis will be conducted in our following research.
Certain particles from the rectangular model were removed to create a hole and a pre-existing crack. The radius of the hole (denoted as r) was 1, 5, 7.5, 10, 12.5, 15, 17.5, 20, 22.5, 25 and 27.5 mm. The length of the pre-existing crack (denoted as L) was 30 mm [10]. The ligament lengths (denoted as s) were 20, 25, 30 and 35 mm. The pre-existing crack inclination angles (denoted as d) were  ,
,  ,
,  ,
,  ,
,  ,
,  ,
,  ,
,  ,
,  and
and  . Here, sx-dy-rz represented a DEM model with s = x, d = y and r = z. According to Tab. 2, three models with random microscopic parameters were thus constructed in one configuration to generalize the typical cracking behavior [10,29,30].
The uniaxial compression test on the DEM models was carried out. The detailed cracking behavior, as well as the force fields and displacement fields, were monitored. Two walls were used to compress the DEM models [36]. A red line showed the micro-tensile crack, and a black line signified the micro-shear crack. When three or more microcracks were produced and connected, a macrocrack appeared [30].
2.3 Comparison between the Numerical Tests and the Experimental Tests
The experimental results and numerical simulations of two representative specimens with different sizes of holes are compared in this section. Here, two different radii of the hole (i.e., 5 and 8 mm) are considered. The compressive test of the specimen s30-d60-r5 is exhibited in Fig. 3. Fig. 4 presents the cracking behavior of the specimen s30-d60-r8. The top row comes from the experiment, and the bottom row is obtained from the simulation. The stresses in the parentheses are the compressive stresses when the first crack initiates, the secondary crack initiates, and the peak load appears. From Figs. 3 and 4, the numerical model can represent the experimental specimen properly.

Figure 3: Cracking processes of the specimen s30-d60-r5. (a) First crack (23.2 MPa) (b) secondary crack (26.3 MPa) (c) peak load (27.3 MPa) (d) first crack (22.3 MPa) (e) secondary crack (24.2 MPa) (f) peak load (29.2 MPa)

Figure 4: Cracking behavior of the specimen s30-d70-r8. (a) First crack (27 MPa) (b) secondary crack (29.1 MPa) (c) peak load (29.5 MPa) (d) first crack (28.9 MPa) (e) secondary crack (30.9 MPa) (f) peak load (32.0 MPa)
In Fig. 3d, the first crack appears at both tips of the pre-existing crack at almost the same time under the compressive load of 22.3 MPa. Then, the Type II shear cracks generate near the right tip of the pre-existing crack as secondary cracks at 24.2 MPa in Fig. 3e. Previous research summarizes the crack type [10]. From Figs. 3b and 3e, the secondary cracks nucleate in the matrix with a significant space to the tip of the pre-existing crack. This phenomenon is different from previous findings [34]. The broken area by the secondary cracks around existing cracks is larger than that near the first cracks. At the peak load of 29.2 MPa in Fig. 3f, another Type III shear crack as the secondary crack appears near the previous secondary crack. The right secondary cracks propagate upwards while the left secondary cracks extend downwards. The existing first crack propagates slowly, while the secondary crack develops quickly. In the experimental test (Fig. 3c) and the numerical test (Fig. 3f), the hole and the pre-existing crack are connected by the first crack. In the experiment, the secondary crack appears, and the final failure happens soon. However, in the simulations, the secondary crack occurs, and it takes a long time before the final failure happens. The reason may be that the propagating crack releases a lot of energy suddenly in experimental tests, and that does not happen in numerical tests.
Fig. 4 shows the cracking behavior of the specimen s30-d70-r8. The first crack and secondary cracks are marked by red circles in Fig. 4. The first crack occurs near the hole at 28.9 MPa (Fig. 4d). The first crack around the hole initiates earlier than that near the pre-existing crack since the hole is large, and the stress concentration is obvious around the hole. Hence, the hole is earlier to break than the pre-existing crack. Then, the shear microcracks occur in the intact part near the pre-existing crack tips. They connect and generate the secondary crack at 30.9 MPa in Fig. 4e. Compared with the first crack, the Type III shear crack as the secondary crack has a greater width. In the experiment, the secondary crack brings a loud sound, and powder is found on the surface of the secondary crack. Meanwhile, the first crack from the hole goes downward and connects with the pre-existing crack. At the peak load of 32.0 MPa, another Type III shear crack as the secondary crack appears near the right tip, and extends downward (Fig. 4f). The tensile-shear crack as the coalescence crack propagates from the hole to the pre-existing crack, which is different from that in Fig. 3. This new type of coalescence is named coalescence Type 6. It has not been observed since the hole was small in previous research [6].
3 Influence of Sizes on the Cracking Behavior
The cracking behavior of specimens when  is displayed in Fig. 5. The coalescence types are listed in the parentheses under Fig. 5. The first cracks below the pre-existing crack have similarities. However, the cracks above the pre-existing crack are different. When the radius of the hole is 4 mm, the Type I tensile cracks are generated as first cracks. When the radius of the hole is 7.5 or 11.25 mm, the first cracks are the Type III tensile crack. The secondary cracks appear later, and cover a wider area compared with the first cracks. Then, the first crack (in Figs. 5a and 5b) propagates as the coalescence crack. However, various holes lead to different coalescence crack types. 5 types of coalescence cracks have been witnessed as described in previous research [10]. In Fig. 5a, the coalescence type is Type 4. The coalescence type in Fig. 5b is Type 3. However, the coalescence crack between the hole and the pre-existing crack does not appear in Fig. 5c.

Figure 5: Cracking behavior with different radii of holes. (a) s30-d0-r4 (Type 4) (b) s30-d0-r7.5 (Type 3) (c) s30-d0-r11.25 (Type 1)
The parallel bond force fields are disturbed by the cracks [29]. The force fields of the three samples are presented in Fig. 6. The upper three figures show the force fields when the first crack generates, and corresponding first crack initiation stresses are in the parentheses. The lower three figures illustrate the force fields when the coalescence crack comes into being, and the coalescence stresses are in the parentheses. The stress redistribution occurs when a new crack initiates. The previous white zone narrows as new cracks occur, and the stress concentrates around the newly developed crack tips. The compressive zone is shown by the dense blue lines, while the white lines represent the tensile zone. At 15.8 MPa in Fig. 6a, 16.0 MPa in Fig. 6b and 17.0 MPa in Fig. 6c, multiple microcracks initiate from the lower side of the pre-existing crack. The tensile stress declines around the pre-existing crack, and the white lines move downward. There is no microcrack around the hole in Fig. 6. The reason lies in that the stress concentration around the crack tip is greater than that around the hole. Later, more microcracks occur, which reduce the tensile stress in the middle part of the crack. More microcracks appear to form macroscopic first cracks. One first crack becomes the coalescence crack in Fig. 6d at 19.8 MPa and in Fig. 6e at 19.5 MPa, which reduces the white zone around the hole. The compressive stress and the tensile stress are almost 0 there, and a big defect in the specimen is produced. The compressive stress singularity exists at crack tips, and initiates secondary cracks [34]. The white zone appears around the top and bottom of the hole, and the blue zone occurs near the two sides of the hole. If the white zones from the pre-existing crack and the hole overlap with each other, the tensile crack is preferred. The cracking position is in the white zone. If the blue zones from the two defects are overlapping, the shear first crack easily happens. In Figs. 6a–6c, the blue zone from the hole overlaps with the white zone from the pre-existing crack between the two defects. Hence, the first crack appears below the pre-existing crack due to a greater tensile stress under the pre-existing crack. In Fig. 6d, the tensile force above the pre-existing crack is beyond the tensile strength. Hence, the coalescence crack is the tensile crack. However, in Fig. 6e, the blue zone from the two defects are overlapping, where the shear force exceeds the shear strength. Hence, the shear coalescence crack occurs. In Fig. 6f, the hole is large. The shear first crack goes into the white zone from the hole, which stops propagating.

Figure 6: The force fields of specimens with different holes. (a) s30-d0-r4 (15.8 MPa) (b) s30-d0-r7.5 (16.0 MPa) (c) s30-d0-r11.25 (17.0 MPa) (d) s30-d0-r4 (19.8 MPa) (e) s30-d0-r7.5 (19.5 MPa) (f) s30-d0-r11.25
The newly developed cracks influence the displacement field. Two types of displacement fields are summarized: Type I tensile displacement field and Type II tensile-shear displacement field [10]. The displacement vectors of particles are signified by blue lines in Fig. 7. The displacement field types are also marked in Fig. 7. In the beginning, the microcracks are unconnected, which don’t disturb the displacement field. Then, in Fig. 7a, the macroscopic Type I tensile cracks lead to the displacement field Type I. In Fig. 7b, the macroscopic Type III tensile cracks cause the displacement field Type I near the right tip of the pre-existing crack. In Fig. 7c, the Type III shear crack as the secondary crack is activated at the right tip of the pre-existing crack, and causes the displacement field Type II. Meanwhile, the first crack above the pre-existing crack stops propagating. Here, a new type of displacement field is observed, namely displacement field Type III. The particles are moving in the same direction on both sides of the first crack, which means that the crack is closed and no relative movement exists. Hence, the crack stops propagating and the coalescence does not happen in Fig. 7c.

Figure 7: The displacement fields of specimens with different holes. (a) s30-d0-r4 (b) s30-d0-r7.5 (c) s30-d0-r11.25
According to the self-healing mechanism, the curing time of healing agents is related to the coalescence time and the failure time in the compressive test. Here, the potential healing time xt is defined as:

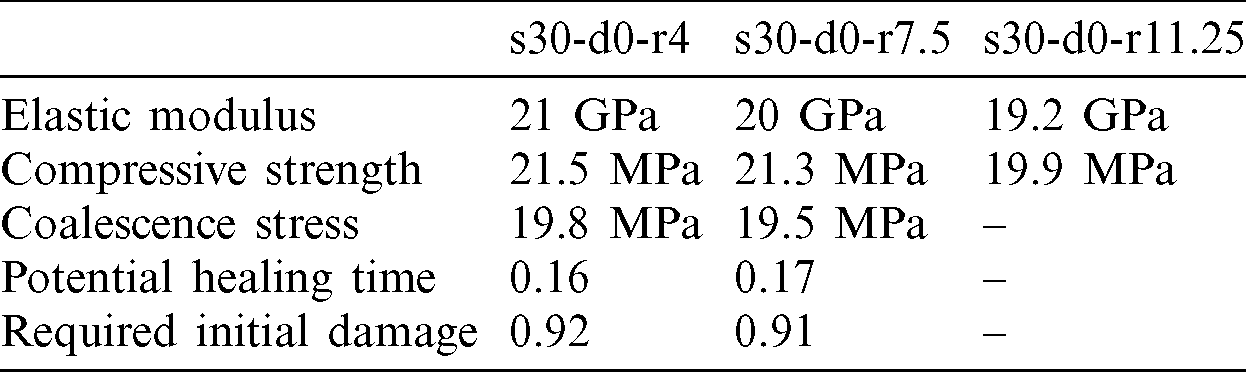
where Tcoalescence and Tfailure mean the time when the coalescence happens and the final failure occurs, respectively. Since the healing agent must cure between Tcoalescence and Tfailure to cause the self-healing effect, the potential healing time is important. The potential healing time of the three samples is illustrated in Tab. 3. When the radius is 4 mm, the potential healing time is 0.16. When the radius is 7.5 mm, the potential healing time is 0.17. However, the coalescence does not happen when the radius is 11.25 mm. The potential healing time increases with the rising radius of microcapsules.
Table 3: Macro properties of models with different sizes of holes
An initial compressive stress is applied on specimens to cause the initial damage and the following self-healing in experiments [31,32]. The required initial damage xd is defined as:

where  and
and  mean the compressive stress when the coalescence happens and the final failure occurs, respectively. The required initial damage signifies the needed initial compressive stress which can cause the self-healing effect. If the initial compressive stress is too small, the self-healing will not be initiated, which is consistent with previous experimental results [10]. The required initial damage is also presented in Tab. 3. When the radius is 4 mm, the required initial damage is 0.92. When the radius is 7.5 mm, the required initial damage is 0.91. If the initial damage is slight, the self-healing will not occur. Hence, the initial damage is suggested as 0.95 to cause the self-healing effect.
With the increasing size of holes, the mechanical properties decrease obviously. When the radius increases from 4 to 11.25 mm, the elastic modulus of the sample declines from 21 to 19.2 GPa, and the compressive strength reduces from 21.5 to 19.9 MPa. Hence, the microcapsules should not be too big since big holes reduce the mechanical properties of samples.
Fig. 8 displays the typical coalescence cracks in four specimens containing different holes (r = 7.5, 8.75, 11.25 and 12.5 mm) and with the same inclination angle d of  . The coalescence types are in the parentheses. The first cracks below the pre-existing crack are similar, while they are different above the pre-existing crack. The reason lies in that the crack below the pre-existing crack is far away from the hole, and the influence of the hole is slight. The Type I tensile cracks as first cracks are composed of micro-tensile cracks when the radius is 7.5 mm in Fig. 8a. The coalescence does not occur. When the radius is 8.75 and 11.25 mm, the first cracks are Type I shear cracks. Micro-tensile cracks and micro-shear cracks form the secondary cracks. The coalescence type in Fig. 8b is Type 5. The first crack initiates from the pre-existing crack. Meanwhile, the hole breaks. Finally, the two propagating cracks connect. The pre-existing crack propagates and directly connects with the hole in coalescence Type 3 in Fig. 8c. As is exhibited in Fig. 8d, the crack goes from the hole to the pre-existing crack. A new type of coalescence (i.e., coalescence Type 6) is witnessed. The coalescence crack initiates near the hole at first. Then, it propagates to the pre-existing crack. Based on the fracture mechanics, the coalescence cracks should initiate at the crack tips. Whereas, Fig. 8d clearly shows that when the hole is big, it may break at first and the first crack may generate elsewhere, which is consistent with the previous results [30]. They may initiate near the hole and go to the pre-existing crack in coalescence Type 6, which means that the first crack initiation position is influenced by the radius of the hole. Coalescence Type 6 is not wanted in the microcapsule-contained self-healing concrete since the microcapsule becomes the defect rather than the healing component.

Figure 8: Coalescence cracks with different radii of holes. (a) s30-d60-r7.5 (Type 1) (b) s30-d60-r8.75 (Type 5) (c) s30-d60-r11.25 (Type 3) (d) s30-d60-r12.5 (Type 6)
The potential healing time of the four samples is listed in Tab. 4. When the radius increases from 8.75 to 12.5 mm, the potential healing time rises from 0.111 to 0.12. The healing time is short compared with that in Tab. 3 since the inclination angle of the pre-existing crack is great. With the increasing radius, the potential healing time raises. Hence, rapid curing agents should be adopted if the small microcapsule is used. The required initial damage is also shown in Tab. 4. When the radius is 8.75 mm, the initial damage is 0.957. When the radius is 11.25 mm, the initial damage is 0.938. When the radius is 12.5 mm, the required initial damage is 0.931. With the increasing size of holes, the required initial damage decreases. The initial damage should be great enough to cause the self-healing, which agrees with the previous experimental research of the microcapsule-contained self-healing concrete [32]. The initial damage should be greater than 0.95 to cause the self-healing effect.
Table 4: Macro properties of models with different sizes of holes
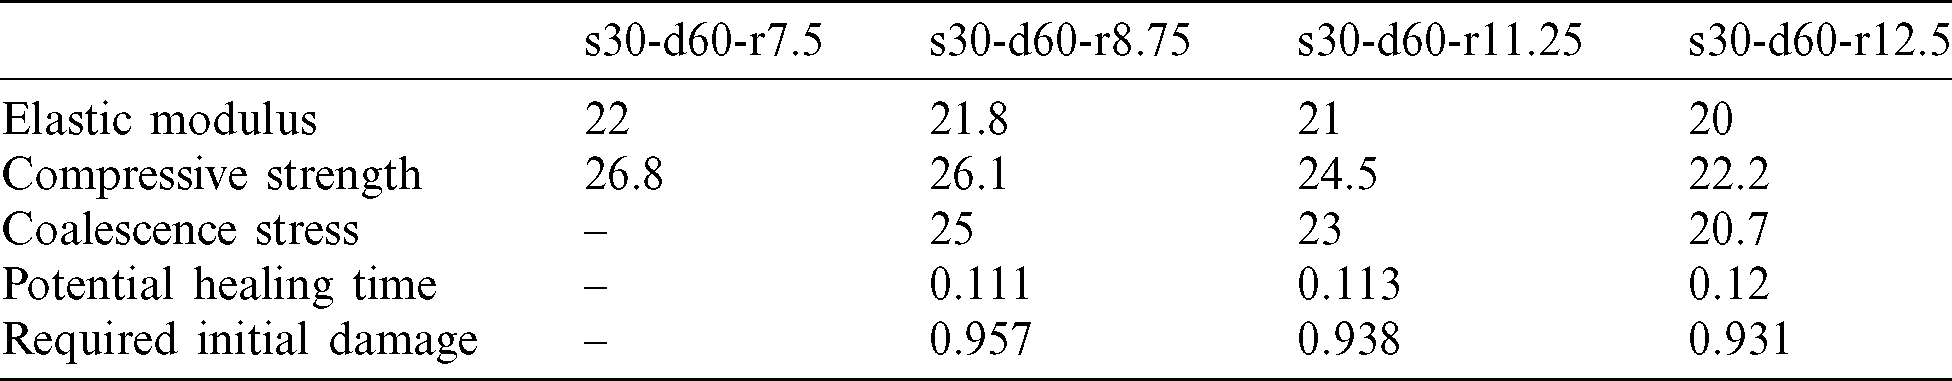
With the increasing size of holes, the mechanical properties decline. When the radius increases from 7.5 to 12.5 mm, the elastic modulus reduces from 22 to 20 GPa. Meanwhile, the compressive strength also declines from 26.8 to 22.2 MPa. Hence, the too-large microcapsules should be avoided since they decrease the mechanical properties of the concrete.
The influence of different configurations on the cracking behavior is analyzed in this section. It discusses the numerical simulations with different angles of pre-existing cracks ( ,
,  ,
,  ,
,  ,
,  ,
,  ,
,  ,
,  ,
,  and
and  ), different ligament lengths (S = 20, 25, 30 and 35 mm) and different sizes of holes (r = 1, 5, 7.5, 10, 12.5, 15, 17.5, 20, 22.5, 25 and 27.5 mm). Each configuration is simulated 3 times with different initial parameters of materials.
4.1 Types of Coalescence Cracks
The coalescence crack between the pre-existing crack and the hole with different sizes is displayed in Fig. 9. It is clear that the coalescence crack changes with the radius of holes. When the radius of the hole is very large (e.g., 12.5 mm), it breaks at first (in Fig. 9h). The coalescence Type 6 is witnessed. When the radius of the hole ranges from 8.75 to 11.25 mm, the two defects break at the same time, and Type 5 coalescence occurs in Figs. 9e–9g. When the size of the hole is medium, the first crack occurs near the pre-existing crack, and the coalescence Type 3 occurs in Figs. 9b and 9c. When the radius of the hole is small, the interaction between the hole and the pre-existing crack is negligible. Hence, the pre-existing crack cannot connect with the hole in Fig. 9a. The first crack initiation angle is affected by the radius of the hole from Fig. 9. When the hole is small (i.e., the radius is less than 5 mm), the crack initiation angle approaches  . However, the crack initiation angle is
  or
or  when the radius ranges from 5 to 12.5 mm in Fig. 9.

Figure 9: Crack coalescence pattern of specimens with different radii of holes. (a) s30-d60-r1 (Type 1) (b) s30-d60-r5 (Type 3) (c) s30-d60-r6.25 (Type 3) (d) s30-d60-r7.5 (Type 1) (e) s30-d60-r8.75 (Type 5) (f) s30-d60-r10 (Type 5) (g) s30-d60-r11.25 (Type 5) (h) s30-d60-r12.5 (Type 6)
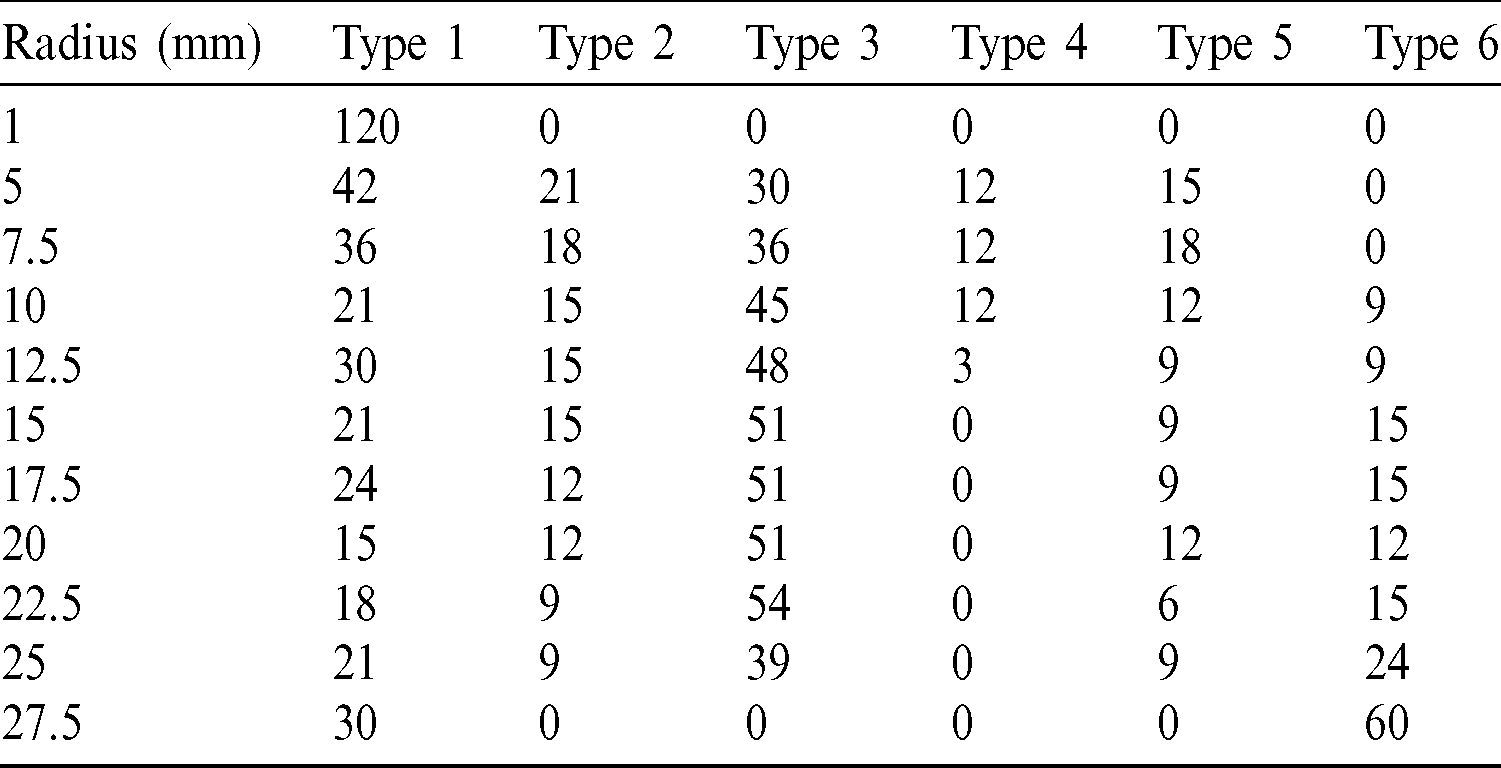
The number of coalescence types in different cases is summarized in Tab. 5. When the hole is very large (e.g., r = 27.5 mm), only coalescence Type 1 and Type 6 exist, which means that self-healing does not occur. If the hole is too small (e.g., r = 1 mm), the stress concentration is slight, and the hole does not attract the pre-existing crack. Only coalescence Type 1 occurs, and the healing effect is also not obvious. In the cases with a radius less than 27.5 mm, Type 3 coalescence occurs most frequently. The coalescence type is wanted in the research since the crack can be healed by the microcapsules. The non-coalescence crack also occurs in many cases, which explains that the healing efficiency is low. The coalescence Type 6 only happens in the cases when the radius of the hole is greater than 10 mm. The reason is that the stress concentration around the hole is greater than that near the pre-existing crack when the hole is large. Hence, the hole is easily fractured. Coalescence Type 4 only happens in the case when the radius of holes is less than 12.5 mm. If the hole is too big, the shear stress near the tip of the pre-existing crack increases greatly and the coalescence Type 4 will not happen considering that coalescence Type 4 is composed of Type III tensile cracks. The cracks near a big hole propagate easily. If the radius of holes is 1 mm, the interaction between the hole and the pre-existing crack is slight. The coalescence does not happen. Hence, the healing will not occur.
Table 5: The number of different coalescence types with different radii of holes
The influence of the size of holes on the potential healing time is shown in Fig. 10. If the radius increases from 5 to 25 mm, the potential healing time climbs from 0.13 to 0.21. It illustrates that the radius has a great influence on the potential healing time. A large hole has a long potential healing time, while the potential healing time is short if the radius is small. The reason is that when the hole is big, the coalescence easily occurs. After the coalescence, the final failure happens after a long time. However, if the radius is small, the coalescence occurs at a relatively great compressive stress, and the final failure happens soon. Hence, small microcapsules need a healing agent with a short curing time.

Figure 10: Potential healing time of different radii
The influence of the radius of holes on the required initial damage is exhibited in Fig. 11. It illustrates that the radius has a great influence on the required initial damage, and a small hole needs a great initial damage to cause the coalescence. When the radius is 5 mm, the required initial damage is 0.92. When the radius is 25 mm, the required initial damage is 0.81. The reason is that when the hole is big, the coalescence crack easily initiates, while the coalescence occurs at a relatively greater compressive stress if the radius is small. When the coalescence happens, the self-healing begins. Considering that the radius of microcapsules is scattered in the experiments, 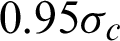 is suggested to cause the self-healing. The conclusion explains the poor self-healing effect in previous experiments [32].
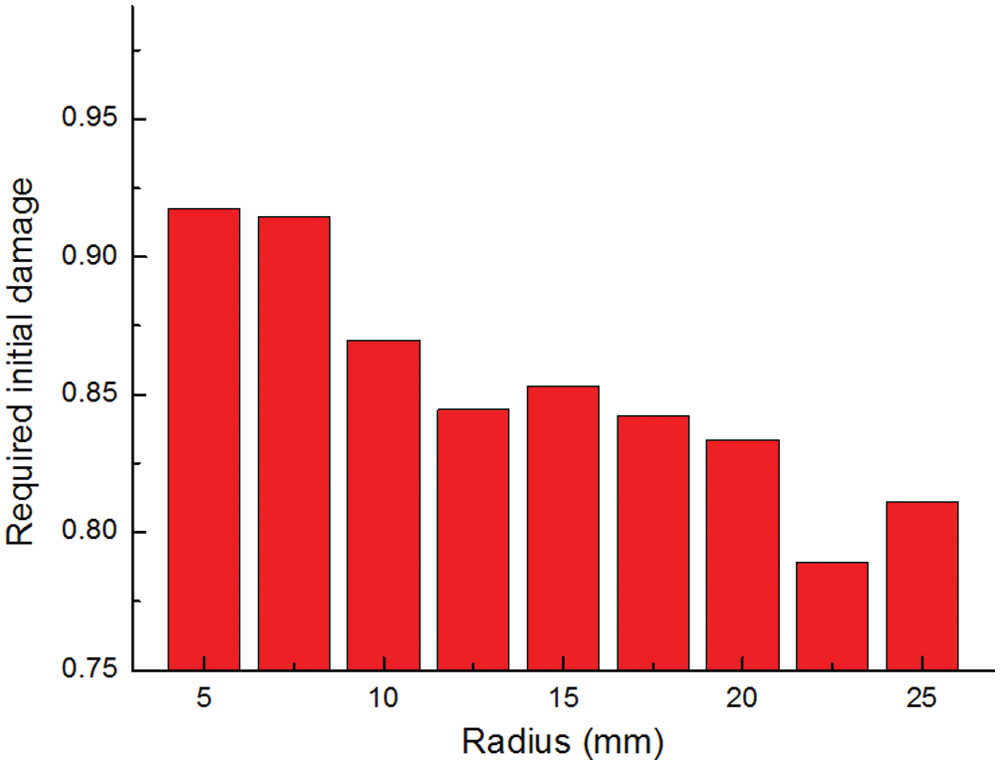
Figure 11: Required initial damage of specimens with different radii
This study investigates the interaction between a hole and a pre-existing crack with various sizes of holes to understand the influence of sizes of microcapsules on the self-healing cementitious materials. The following conclusions can be drawn based on the investigation.
1. The elastic modulus, the compressive strength and the coalescence stress decline with the increasing radius of holes. The microcapsules should have medium sizes to guarantee the healing effect.
2. The position and the extent of the stress concentration are influenced by the radius of holes. A new type of displacement field is observed in the research.
3. The pre-existing crack inclination angle, the ligament length and the radius of holes affect the coalescence crack. A new coalescence type is observed. The hole breaks at first when the radius is large, and the self-healing does not take an effect.
4. With the increasing radius, the potential healing time rises, and the required initial damage decreases. The required initial damage should be greater than  .
.
Funding Statement: This work was supported by the National Natural Science Foundation of China (No. 52002040) and the State Key Laboratory of High Performance Civil Engineering Materials (No. 2020CEM004).
Conflicts of Interest: The authors declare that they have no conflicts of interest to report regarding the present study.
References
1. S. R. White, N. R. Sottos, P. H. Geubelle, J. S. Moore, M. R. Kessler et al. (2001). , “Autonomic healing of polymer composites,” Nature, vol. 409, no. 6822, pp. 794–797.
2. M. S. Quayum, X. Zhuang and T. Rabczuk. (2015). “Computational model generation and RVE design of self-healing concrete,” Frontiers of Structural and Civil Engineering, vol. 9, no. 4, pp. 383–396.
3. H. Zhu, S. Zhou, Z. Yan, J. W. Ju and Q. Chen. (2016). “A two-dimensional micromechanical damage–healing model on microcrack-induced damage for microcapsule-enabled self-healing cementitious composites under compressive loading,” International Journal of Damage Mechanics, vol. 25, no. 5, pp. 727– 749.
4. S. Zhou, H. Zhu, J. W. Ju, Z. Yan and Q. Chen. (2017). “Modeling microcapsule-enabled self-healing cementitious composite materials using discrete element method,” International Journal of Damage Mechanics, vol. 26, no. 2, pp. 340–357.
5. X. Zhuang and S. Zhou. (2018). “Molecular dynamics study of an amorphous polyethylene/silica interface with shear tests,” Materials, vol. 11, no. 6, pp. 929.
6. S. Zhou and X. Zhuang. (2018). “Characterization of loading rate effects on the interactions between crack growth and inclusions in cementitious material,” Computers, Materials & Continua, vol. 57, no. 3, pp. 417–446.
7. S. Zhou, N. Vu-Bac, B. Arash, H. Zhu and X. Zhuang. (2019). “Interface characterization between polyethylene/silica in engineered cementitious composites by molecular dynamics simulation,” Molecules, vol. 24, no. 8, pp. 1497.
8. X. Zhuang and S. Zhou. (2019). “The prediction of self-healing capacity of bacteria-based concrete using machine learning approaches,” Computers, Materials & Continua, vol. 59, no. 1, pp. 57–77.
9. T. Rabczuk, S. Bordas and G. Zi. (2010). “On three-dimensional modelling of crack growth using partition of unity methods,” Computers & Structures, vol. 88, no. 23–24, pp. 1391–1411.
10. S. Zhou, H. Zhu, Z. Yan, J. W. Ju and L. Zhang. (2016). “A micromechanical study of the breakage mechanism of microcapsules in concrete using PFC2D,” Construction and Building Materials, vol. 115, no. 1, pp. 452–463. [Google Scholar]
11. L. N. Y. Wong and H. H. Einstein. (2009). “Crack coalescence in molded gypsum and carrara marble: Part 1. Macroscopic observations and interpretation,” Rock Mechanics and Rock Engineering, vol. 42, no. 3, pp. 475–511. [Google Scholar]
12. H. K. Lee and J. W. Ju. (2007). “A three-dimensional stress analysis of a penny-shaped crack interacting with a spherical inclusion,” International Journal of Damage Mechanics, vol. 16, no. 3, pp. 331–359. [Google Scholar]
13. N. Vu-Bac, T. Lahmer, X. Zhuang, T. Nguyen-Thoi and T. Rabczuk. (2016). “A software framework for probabilistic sensitivity analysis for computationally expensive models,” Advances in Engineering Software, vol. 100, pp. 19–31. [Google Scholar]
14. S. S. Nanthakumar, T. Lahmer, X. Zhuang, G. Zi and T. Rabczuk. (2016). “Detection of material interfaces using a regularized level set method in piezoelectric structures,” Inverse Problems in Science and Engineering, vol. 24, no. 1, pp. 153–176. [Google Scholar]
15. K. M. Hamdia, M. Silani, X. Zhuang, P. He and T. Rabczuk. (2017). “Stochastic analysis of the fracture toughness of polymeric nanoparticle composites using polynomial chaos expansions,” International Journal of Fracture, vol. 206, no. 2, pp. 215–227. [Google Scholar]
16. Rabczuk, T., Ren, H. and Zhuang, X. (2019). “A nonlocal operator method for partial differential equations with application to electromagnetic waveguide problem,” Computers, Materials & Continua, vol. 59, no. 1, pp. 31–55. [Google Scholar]
17. K. Hamdia, H. Ghasemi, X. Zhuang, N. Alajlan and T. Rabczuk. (2019). “Computational machine learning representation for the flexoelectricity effect in truncated pyramid structures,” Computers, Materials & Continua, vol. 59, no. 1, pp. 79–87. [Google Scholar]
18. H. Guo, X. Zhuang and T. Rabczuk. (2019). “A deep collocation method for the bending analysis of Kirchhoff plate,” Computers, Materials & Continua, vol. 59, no. 2, pp. 433–456. [Google Scholar]
19. Xiao, Z., Zhang, W., Zhang, Y. and Fan, M. (2020). “Fatigue investigations on steel pipeline containing 3D coplanar and non-coplanar cracks,” Computers, Materials & Continua, vol. 62, no. 1, pp. 267–280. [Google Scholar]
20. F. Amiri, D. Milan, Y. Shen, T. Rabczuk and M. Arroyo. (2014). “Phase-field modeling of fracture in linear thin shells,” Theoretical and Applied Fracture Mechanics, vol. 69, pp. 102–109. [Google Scholar]
21. F. Amiri, C. Anitescu, M. Arroyo, S. P. A. Bordas and T. Rabczuk. (2014). “XLME interpolants, a seamless bridge between XFEM and enriched meshless methods,” Computational Mechanics, vol. 53, no. 1, pp. 45–57. [Google Scholar]
22. H. Ren, X. Zhuang, Y. Cai and T. Rabczuk. (2016). “Dual-horizon peridynamics,” International Journal for Numerical Methods in Engineering, vol. 108, no. 12, pp. 1451–1476. [Google Scholar]
23. H. Ren, X. Zhuang and T. Rabczuk. (2017). “Dual-horizon peridynamics: A stable solution to varying horizons,” Computer Methods in Applied Mechanics and Engineering, vol. 318, pp. 762–782. [Google Scholar]
24. D. Ballhause, M. Konig and B. Kroplin. (2006). “Modelling of woven fabrics with the discrete element method,” Computers, Materials & Continua, vol. 4, no. 1, pp. 21–29. [Google Scholar]
25. A. Ghazvinian, V. Sarfarazi, W. Schubert and M. Blumel. (2012). “A study of the failure mechanism of planar non-persistent open joints using PFC2D,” Rock Mechanics and Rock Engineering, vol. 45, no. 5, pp. 677–693. [Google Scholar]
26. S. S. Ghorashi, N. Valizadeh, S. Mohammadi and T. Rabczuk. (2015). “T-spline based XIGA for fracture analysis of orthotropic media,” Computers & Structures, vol. 147, pp. 138–146. [Google Scholar]
27. L. Chen, T. Rabczuk, S. P. A. Bordas, G. R. Liu, K. Y. Zeng et al. (2012). , “Extended finite element method with edge-based strain smoothing (ESm-XFEM) for linear elastic crack growth,” Computer Methods in Applied Mechanics and Engineering, vol. 209–212, no. 1, pp. 250–265. [Google Scholar]
28. T. Chau-Dinh, G. Zi, P. S. Lee, T. Rabczuk and J. H. Song. (2012). “Phantom-node method for shell models with arbitrary cracks,” Computers & Structures, vol. 92, no. 1, pp. 242–256. [Google Scholar]
29. X. P. Zhang and L. N. Y. Wong. (2012). “Cracking processes in rock-like material containing a single flaw under uniaxial compression: A numerical study based on parallel bonded-particle model approach,” Rock Mechanics and Rock Engineering, vol. 45, no. 5, pp. 711–737. [Google Scholar]
30. X. P. Zhang and L. N. Y. Wong. (2013). “Crack initiation, propagation and coalescence in rock-like material containing two flaws: A numerical study based on bonded-particle model approach,” Rock Mechanics and Rock Engineering, vol. 46, no. 5, pp. 1001–1021. [Google Scholar]
31. Z. Yang, J. Hollar, X. He and X. Shi. (2011). “A self-healing cementitious composite using oil core/silica gel shell microcapsules,” Cement and Concrete Composites, vol. 33, no. 4, pp. 506–512. [Google Scholar]
32. S. Zhou, H. Zhu, J. W. Ju, Z. Yan, Q. Chen et al. (2015). , “Evaluation of self-healing properties of mortar containing microencapsulated epoxy resin,” Innovative Materials and Design for Sustainable Transportation Infrastructure, vol. 1, pp. 108–118. [Google Scholar]
33. X. Zhuang, J. Chun and H. Zhu. (2014). “A comparative study on unfilled and filled crack propagation for rock-like brittle material,” Theoretical and Applied Fracture Mechanics, vol. 72, no. 1, pp. 110–120. [Google Scholar]
34. A. Bobet. (2000). “The initiation of secondary cracks in compression,” Engineering Fracture Mechanics, vol. 66, no. 2, pp. 187–219. [Google Scholar]
35. Itasca. (2004). “PFC2D (particle flow code in 2 dimensions),” Version 3.1, Minneapolis, USA: Itasca Consulting Group, Inc. [Google Scholar]
36. X. Ding, L. Zhang, H. Zhu and Q. Zhang. (2014). “Effect of model scale and particle size distribution on PFC3D simulation results,” Rock Mechanics and Rock Engineering, vol. 47, no. 6, pp. 2139–2156. [Google Scholar]
 | This work is licensed under a Creative Commons Attribution 4.0 International License, which permits unrestricted use, distribution, and reproduction in any medium, provided the original work is properly cited. |

