DOI:10.32604/cmc.2021.014598
| Computers, Materials & Continua DOI:10.32604/cmc.2021.014598 | |
| Article |
An LSTM Based Forecasting for Major Stock Sectors Using COVID Sentiment
1Department of Computer Science, COMSATS University Islamabad, Attock Campus, Pakistan
2Department of Media Design and Technology, Faculty of Engineering & Informatics, University of Bradford, Bradford, BD7 1AZ, UK
3Department of Smart Device Engineering, School of Intelligent Mechatronics Engineering, Sejong University, Seoul, Korea
4Department of Computer Science & Engineering, Soonchunhyang University, Asan, 36538, Korea
*Corresponding Author: Yunyoung Nam. Email: ynam@sch.ac.kr
Received: 02 October 2020; Accepted: 29 November 2020
Abstract: Stock market forecasting is an important research area, especially for better business decision making. Efficient stock predictions continue to be significant for business intelligence. Traditional short-term stock market forecasting is usually based on historical market data analysis such as stock prices, moving averages, or daily returns. However, major events’ news also contains significant information regarding market drivers. An effective stock market forecasting system helps investors and analysts to use supportive information regarding the future direction of the stock market. This research proposes an efficient model for stock market prediction. The current proposed study explores the positive and negative effects of coronavirus events on major stock sectors like the airline, pharmaceutical, e-commerce, technology, and hospitality. We use the Twitter dataset for calculating the coronavirus sentiment with a Long Short-Term Memory (LSTM) model to improve stock prediction. The LSTM has the advantage of analyzing relationship between time-series data through memory functions. The performance of the system is evaluated by Mean Absolute Error (MAE), Mean Squared Error (MSE), and Root Mean Squared Error (RMSE). The results show that performance improves by using coronavirus event sentiments along with the LSTM prediction model.
Keywords: Business intelligence; decision making; stock prediction; long short-term memory; COVID-19; event sentiment
A stock market is a standardized place where people interact for stock trading or other monetary instruments on exchange. In stock exchange, securities (bonds, shares, and currency) trading at prices is governed by the forces of demand and supply. Stock trade plays a vital part within businesses for investors to make a beneficial return on their investment funds. Recent research indicates that various factors affect stock prices which include a company’s performance, country’s situation, political situation, government policies, interest rate, natural as well as human-made disasters, and market psychology. Due to these influences, very few investors understand the future fluctuations of markets. Stock market prediction is observed as a difficult task in economic-related time-series predictions. Due to these reasons, stock market prediction tends to be a difficult task as the change can be irregular and can get affected by many factors as highlighted by many researchers. The change in the stock exchange may be irregular and in a unique way which is often difficult to predict.
Stock exchange fluctuates unexpectedly due to the involvement of different macro-economic elements. Forecasting of stock prices is characterized by using hidden relationships, information intensity, noise along with a high degree of instability and uncertainty. There is a variety of complex monetary indicators and the fluctuations of the stock marketplace are often too high. Numerous factors including physiological, rational, or irrational, investor’s behavior, and other aspects are involved in stock predictions. All these factors together cause stock prices to be unstable, volatile and challenging to be predicted with high accuracy. However, with the advancements of technology, the risk factor involved in the stock exchange can be managed. Additionally, it also facilitates specialists to find out the maximum informative indicators to make a better stock prediction. There are two types of stock exchange evaluation used which include fundamental evaluation and technical evaluation. In this paper, both variables are taken into consideration. For fundamental evaluation, sentiment analysis is applied to social media information, and for technical evaluation, the LSTM model is implemented on historical stock data. Social media has become influential in society and its impact is growing day by day. In this context, we use sentiment analysis by collecting tweets regarding COVID-19 only. The sentiments expressed by individuals are extracted from tweets which are then used to check their impact on stock prices.
The coronavirus which emerged as a worldwide disaster had started in December 2019 in Wuhan province in China. It has widely spread out over time, continuing to be the worst humanitarian disaster in the history of human civilization. It has taken the lives of human beings which turned out to be excessive in number according to stats. The virus is still affecting people out there and many are going through this suffering. The worldwide economy also got dented in a lot of ways due to the rise of coronavirus. As, the stock markets are frequently unpredictable and can change suddenly, even followed by political circumstances, financial conditions, and significant events for the nation. Stock prices also fluctuate when breaking news circulates over social media like Twitter. These significant events affect the stock exchange worldwide. Since strict lockdowns are being imposed by the government and people are bound to stay home, some industries continue to be highly impacted. These industries include the tourism industry, the hospitality industry, and the airline industry. On the contrary, pharmaceutical organizations, E-Commerce, and tech-companies secure central level in Covid-19 and show growth over the stock market. Lockdown has also converted many of the spacious offices to online mode and everyone is supposed to focus on work from home. In the same way, online shopping is being promoted. Different medicine companies are also playing an active role in this situation. The rapid increase of coronavirus has shown drastic effects on economic markets worldwide. It has created an unexpected risk factor, affecting investors to face severe losses in a short interval. As worldwide economies are suffering from the impact of Covid-19, companies are experiencing losses, employees are becoming jobless and many other challenges are being faced on an individual level. In the prevailing situation, as many countries follow strict SOPs and quarantine policies, their household activities are notably restricted. The long-term outcomes of this disaster can also arise from economic disability, unemployment, and commercial enterprise failures. But contrarily, Covid-19 can turn out to be profitable in some sectors like information technology, pharmaceutical organizations, and e-commerce companies. This can be seen by their stock prices as there is noticeably positive growth during this period.
In this research, we have made the stock predictions for the airline, pharmaceutical, technology, e-commerce, and hospitality sectors. There is no company, industry, or economy which is considered immune to the devastating effects of coronavirus. Naturally, the impact of the virus on certain businesses is much serious than other industries, such as the airline sector, restaurants, and hospitality sectors. If positive dimensions are observed, it can be noticed that certain companies are preparing a vaccine to fight this virus effectively. Another constructive aspect is related to the information technology sector that has provided employees the opportunity to work remotely. These are few sectors from all walks of life that get profit during the coronavirus. We select five companies for Airline, Pharmaceutical, E-commerce, Technology, and Hospitality sectors which are positively or negatively affected by the corona pandemic. We collect historical stock market datasets from Yahoo finance from 2011 to 2020 for experiments to evaluate our proposed model. Moreover, we use the Twitter dataset and investigate the effect of corona events on stock prediction data. For the prediction part, we utilize Long-Term Short-Term Memory (LSTM). The contributions of our research work are presented as follows:
• We study the impact of coronavirus on stock exchange predictions.
• We investigate the effects of corona sentiment on stock prices over five major sectors including Airline, Pharmaceutical, E-commerce, Technology, and Hospitality
• To evaluate the effect of the LSTM model for Stock prediction by incorporating Twitter sentiment data on Corona tweets as well as without Corona sentiment data.
The remaining paper is organized as follows: Section 2 presents the related work; Section 3 explains methodology while Section 4 explains results and discussion followed by the conclusion.
Stock exchange prediction is essential, emerging, and challenging area for researchers [1]. In recent years, researchers have predicted the stock exchange market for better enterprise financial plans. In the past, these approaches gained recognition after delivering promising results using historical data [2].
2.1 Statistical Analysis Based Approaches
There are various statistical approaches used for stock exchange analysis and testing. The Exponential Smoothing Model (ESM) is a well-known smoothing method related to time series data. It uses an exponential window function to smooth time series data and analyze it [2,3]. Previously, statistical analysis of historical stock exchange data has been conducted through multiple autoregressive models. These models include autoregressive integrated moving average, generalized autoregressive conditional heteroscedasticity model, and autoregressive conditional heteroscedasticity [4]. Despite their effectiveness in the stock market prediction domain, these methodologies are degraded due to their high demand for massive data to learn features.
2.2 Machine Learning-Based Approaches
Machine Learning algorithms became the dominant choice of researchers to extract features from historical data for future market trend prediction with high accuracy. This category is enriched with artificial intelligence, which can predict nonlinear patterns to perform better in the field. The well-known methods that come under this domain for stock prediction are regression (linear, logistic), support vector machine (SVM), and KNN [5]. All these mentioned approaches have shown sound performances but possess limitations as well that lead the research community to propose more sophisticated methods [5]. Pattern recognition is a subfield of machine learning and is also used to identify as well as extract patterns from data. Technical evaluation relies on patterns detected directly in statistics; it requires the visual analysis of developed charts over time to reveal versions in volume, charge, or different resultant indicators such as rate momentum [6]. Stock market patterns can inform an investor regarding the progression of that stock [7]. Perceptually Important Points (PIP) is one of the widely used pattern recognition methodologies that involve dropping time-series dimensions (i.e., variety of records point) by preserving salient points and template matching [8].
2.3 Deep Learning-Based Approaches
After the advancement of machine learning and upgraded versions of hardware to run the experiment, researchers are moving towards deep neural networks for complex forecasting problems. Recurrent Neural Network (RNN) is famous for sequential information processing and time-series data as they use internal memory states to process input sequences [9]. RNN often requires high memory and hardware resources to process massive data. Therefore, to deal with the shortcoming of standard RNN, researchers have developed efficient variants of RNN [10]. The variants include Bi-directional RNN, LSTM, Bi-LSTM, and GRU, which have produced stunning results in multiple fields. Among all of these variants, LSTM is more consistent as it uses the forget gate, input gate, and output gate for processing cell states to focus most concerning information to improve performance [3]. The architecture of LSTM is appropriate for big data processing, which leads to enhance forecasting of significant events for the long interval time series. LSTM can produce better results in time-related predictions due to its proficiency in dealing with long term sequences. In [11], a group of researchers applied the LSTM approach to enhance through intricacy to the period forecasting problem of precipitation, and results have shown that LSTM model is better as compared to existing precipitation forecasting algorithms. Researchers [12] applied LSTM to nonlinear site traffic dynamics for the diminutive period investor’s prediction and achieved excellent performance in terms of constancy, stability, and accuracy. In [13], researchers used the LSTM model to forecast the speed of the wind. A deep convolutional network (DNN) [12] was developed to study the connection between the occurrence of stock prices and events that occurred in different time frames. Results showed that the LSTM model performs well for time sequence data evaluation, unlike memoryless classification techniques (logistic regression classifier and random forest) [14].
2.4 Sentiment Analysis Based Approaches
The purpose of sentiment analysis is to classify feedback, reviews, and gestures [15]. This trend needs the attention of a vast number of business communities and societies to overcome deficiencies and increase productivity [16]. The sentiment classification methods are mainly divided into machine learning approaches and lexicon-based approaches, which are further divided into corpus-based approaches or dictionary-based. In [17], a group of researchers explained the potential of using sentiment signals from unstructured text to improve the efficiency of models that predict stock market volatility trends. Such as reference [18] determined that there is a positive relationship between the number of investor’s remarks and closing prices of stocks. In [19], researchers have developed a sentiment index that reflects investor sentiment reforms.
In [20], the research was executed on the subject of the COVID-19 outbreak. Tweets have been categorized into negative, positive, and neutral categories with the assistance of different machine learning approaches including support vector machine, random forest, Logit Boosts, Naïve Bayes, Decision tree, and Max Entropy. Their studies show that the Logit Boost outfit classifier produces optimal results. In [21], a group of researchers analyzes the feelings and emotions of people in this global pandemic. They used Twitter API to collect the tweets related to COVID-19 and then used different machine learning techniques to analyze negative, positive, and neutral emotions. In their preprocessing, they utilized the NLTK library to extract tweets and then utilized the Text Blob library for sentiment analysis.
In [22], research has been carried out on the global sentiments contiguous COVID-19 epidemic on Twitter. They have taken tweets starting from January 28 to April 9, 2020, and accumulated more than 20 million Twitter posts using “ncov,” “Wuhan,” “COVID” and “corona” as seeking key-word and analyzed the sentiments using crystal Feel. Word clouds were produced for each of the four feelings based on best frequent unigrams and bigrams. In [23], researchers developed a list of hashtags interrelated to COVID-19 by extracting tweets from the Twitter API. They had taken two weeks of data starting from January 14 to 28, 2020. Afterward, an analysis had been performed to identify the emotional value (negative, positive, and neutral) and overwhelming feelings (sadness, surprise, fear, joy, pity, or shock) for each tweet. They used unsupervised machine learning approaches to analyze the tweets. In [5], for sentiment analysis researchers take tweets of twelve nations specifically associated with the COVID-19 starting from 11 March to 31 March 2020. This study has been done to analyze how citizens from different countries are dealing with a pandemic situation. The tweets have been amassed, pre-processed, and then used for sentiment analysis and text mining.
The proposed framework comprises three modules: data acquisitions, sentiment analysis of corona events, as well as stock exchange predictions using corona sentiment and without sentiment. For this work, we have selected five sectors and in each sector, we selected five major companies that are affected positively or negatively in this corona pandemic period. We have collected historical stock exchange data for all companies from yahoo finance. We used the Twitter dataset for event sentiment analysis to get news headlines and corona events information. Then for Stock exchange predictions, we used the LSTM model that is an advanced version of Recurrent Neural Network (RNN). The proposed methodology of this research is shown in Fig. 1. During the first phase, tweets are being processed. We calculated the sentiments of the corona event. This sentiment analysis data is combined with stock market data used to train the LSTM model.

Figure 1: Proposed methodology for corona sentiment-based stock exchange prediction
To calculate the sentiment of the tweet, we have utilized 15 days of coronavirus Twitter data, starting from April 16, 2020, to April 30, 2020. This dataset contains nearly 5.4 million daily tweets. This data set comprises of the following keywords: #coronavirus, #coronavirusoutbreak, #coronavirusPandemic, #covid19, #covid_19, #epitwitter, #ihavecorona, #StayHomeStaySafe, #TestTraceIsolate. For calculating the sentiment of tweets, we have utilized the Text Blob python library. This Text Blob library provides simple APIs for sentiment analysis and NLP related research. We have utilized this to tokenize the tweets, remove whitespaces, URLs, and punctuations. The tweets are categorized into three sets positive, negative, and neutral. In the first step, daily corona related tweets of positive, negative, and neutral intensity were presented in percentage and net daily sentiment has been calculated.
3.2 Long Short–Term Memory (LSTM) Network
RNN is a kind of neural network that can use the previous output as input in a hidden state. In conventional neural networks, all inputs and outputs are independent of each other. However, in some cases, such as when you need to anticipate the following word of a sentence, past words are required.
Therefore, researchers introduced the architecture of RNN, which solves this problem with the support of a hidden layer. The vital function of RNN is a hidden state, in which it can remember some sequential data. The basic structure of RNN is the input, hidden, and output layer. Input is received by the input layer, hidden layer activation is applied and then we get output from the output layer. Input: X(T) is used as the network input in timestamp (T) while Hidden Layer: H(T) indicates a hidden state during (T) and performs as the network’s memory. H(T) is calculated based on the hidden state and current input of the preceding timestamp:

The function F is regarded as a nonlinear transformation such as activation functions are ReLU and tanh. RNN has an input of hidden networks constraint by weight matrix U, hidden to output recurrent connections constraint by the weight matrix V and hidden to hidden loop recurrent connections, constraint by using the manner of weight matrix W and all these weights (U, V, and W) are shared during the time. The output: O(T) represents the network output in the timestamp. Due to internal memory, RNN can memorize significant information about the input received, which permits them to forecast the next step precisely. This makes the RNN algorithm ideal for sequential and time-series data like stock market predictions, text, video, speech, and weather forecasting. However, RNN suffers from the problem of vanishing and exploding gradients which obstructs the learning rate of long data sequences. In backpropagation, the process goes recurrent for every neuron and calculates derivative to activation function by multiplying learning constant and get newly assigned weights. The result of these calculations become very small derivatives which cause the values of weights to not change effectively through a recurrent training process and lead to inaccuracy of the neural network. When gradients become smaller, the process of weight assignment and parameter update becomes insignificant which means no change is to be observed in the learning rate. Therefore, we are not able to find our optimal combinations of weights that have a minimum error. In RNN, the output of the previous stage will be used as input of the existing stage. LSTM solves the long-standing dependence difficulty of RNN, which is that RNN cannot guess words kept in long-term memory. However, it can provide a perfect prediction based on current information. By default, LSTM can hold information for a long period.
The traditional LSTM architecture contains one unit (storage portion of LSTM unit called long memory cell), three “controllers,” often termed as gates, which create information stream, classified LSTM unit: the input, output, and forget gate. These gates are used to regulate and protect the data in the network as shown in Fig. 2.

Figure 2: The inner working of LSTM
The input gate is used to decide what new information will be stored in the cell state. It only works for the current input information and short-term memory for the previous time step. Subsequently, it should channel out the information from these variables that is not valuable. This is achieved by using two layers. The first layer can work as a filter that selects what information is useful and can pass through it and what information is not needed thus discard it. To develop the input gate layer, we pass short-term memory and input to the sigmoid function. The sigmoid function is used to adjust information and use inputs for filtering values to be forgotten. The sigmoid function range lies between 0 to 1 where 0 indicates that current information is not significant and 1 represents that input information is useful. This helps to decide the information to be kept or discarded. The second tanh layer takes current input and short-term memory. It passes these through the activation tanh function to control the network. The tanh function range lies between 1 to −1 and this layer creates a vector of new candidates. The value of the vector is multiplied by the adjustment value to attain significant information.
Forget gate is used to operate on information that is no longer a vital in-unit state and is going to be deleted through forget gate. The forget gate is also a selective filter to get the forget vector. Forget gate decides which information is useful and which information is through away from the long memory cell. To develop the forget gate layer, we pass the input and short term memory through the sigmoid function. If the output is 1 for a cell state information is preserved and saved for future use while output 0 is used to discard the information.
The output gate decides what we are going to present as an output. The output gate control what information or what data encoded within the cell state is sent to the network as input. This is done by utilizing the output vector. To develop the tanh layer, the vector is formed by applying tanh function to the cell and push values between −1 to +1. Furthermore, the sigmoid function is used to adjust the information. The inputs are then used to filter values that are to be remembered and at last, the vector value and adjusted value are multiplied to be sent as an input to the next cell. In this research study, we used the above described LSTM model for stock predictions. At this stage, the data is provided to a recurrent neural network and it is trained to make predictions, assign random deviations and weights. Our LSTM model consists of a sequential input layer, an LSTM layer, and a dense layer with a sigmoid activation function. The input data used for network generation are “open,” “high,” “low,” “volume,” “sentiments” and “close”. The evaluation of results obtained from the LSTM is based on Mean Squared Error and Mean Absolute Error standards. For this study, to predict the “Close” attribute value of stock data, our input features are “open,” “high,” “low,” “volume,” and “sentiments”. These features are already available in the dataset for stock prediction and sentiment features have been added from corona event data.
4.1 Stock Datasets Collection and Sentiment Analysis
This research reflects the top 5 sectors that are affected positively or negatively during the COVID-19 period. These sectors include the Airline sector, Pharmaceutical Sector, E-commerce Sector, Technology sector, and Hospitality Sector. From each of these sectors, we selected five reputed companies for data collection. The following Tab. 1 presents a description of companies selected in each sector. We collected daily historical stock price data sets for selected companies during the last ten years from January 2011 to April 2020. However, data for some companies is not available for the complete ten years and so we used the available dataset. We selected the top five reputed firms from each sector for stock price prediction which got highly affected in the COVID-19 period. We also used a large number of Twitter datasets in large-scale corona events during 2019–2020.
Table 1: Companies details for each sector

In stock price forecasting, various performance evaluation indicators are used such as mean square error (MAE), root means square error (RMSE) and root mean square error (MAE). These metrics are usually done in time series forecasting to measure the difference between actual and predicted values. Our problem is a regression problem, so we used these performance metrics for predicting error in actual values and predicted values in the stock prediction model.
It is the average square of the difference between estimated and actual values. If Y is a vector of n predictions, and  is the vector of observed values then:

4.1.3 Root Mean Squared Error (RMSE)
RMSE is used for finding the final minimized errors in forecasted values. This metric shows the average size of the estimated error in the predicted value. Simply, we used this metric to measures the quality of fit between the actual and predicted stock prices model.

4.1.4 Mean Absolute Error (MAE)
The mean absolute error refers to the calculation of the difference between two consecutive values. The absolute error is the difference error between the actual value and the predicted value. The error represents the average estimation error without seeing the direction of the expected value. The average absolute error is the average of all absolute errors.

In the above equation n shows the number of forecasted values,  and Yi represents forecasted as well as actual values.
This section presents the results and experimentation as well as a detailed discussion. To evaluate the effectiveness of the model, a comparison is carried out between sentiment and without sentiment stock prediction results. Firstly, we introduce the results of using the deep learning model long-term short-term memory (LSTM) for stock exchange predictions. To conduct the experiments, we have considered five sectors which are Airline, Pharmaceutical, Hospitality, E-commerce, and Technology Sector. We selected five companies for each sector that are top listed and most affected during this COVID-19 pandemic period. The selected companies for the Airline sector are American Airlines, Delta Airlines, Virgin Australia Airlines, United Airlines, and South West Airlines. The corona pandemic has disturbed and negatively affected the airline industry. The airline industry had started to face a decline worldwide since the beginning of the lockdown. In the financial outlook report, the International Air transport Association (IATA) forecast that this year airline industry will face a loss of $84bn. IATA states “The 2020 year is the worst year in the history of the aviation industry” [24].
The selected companies for the pharmaceutical sector are Eli Lilly and Company, Novartis, Gilead Sciences, Pfizer, and Johnson & Johnson. As economies around the globe are enduring from effects of Covid-19, businesses are encountering heavy losses and facing challenges. However, pharmaceutical companies are taking center stage in the COVID-19 battle such as Pfizer, Eli Lilly, and Gilead which are showing positive growth in their stocks and sales. The selected companies for the e-commerce sector are Amazon.com, Alibaba Group, JD.com, Walmart, and eBay. The important thing about the COVID-19 period is that all activities have been shifted to home from office, and remotely. People have switched to different online channels for shopping and grocery. According to research organization Statista, the e-commerce takes benefit and boom up the sale in March when most nations were in lockdown situation and worldwide people use online channels to sell and buy products.
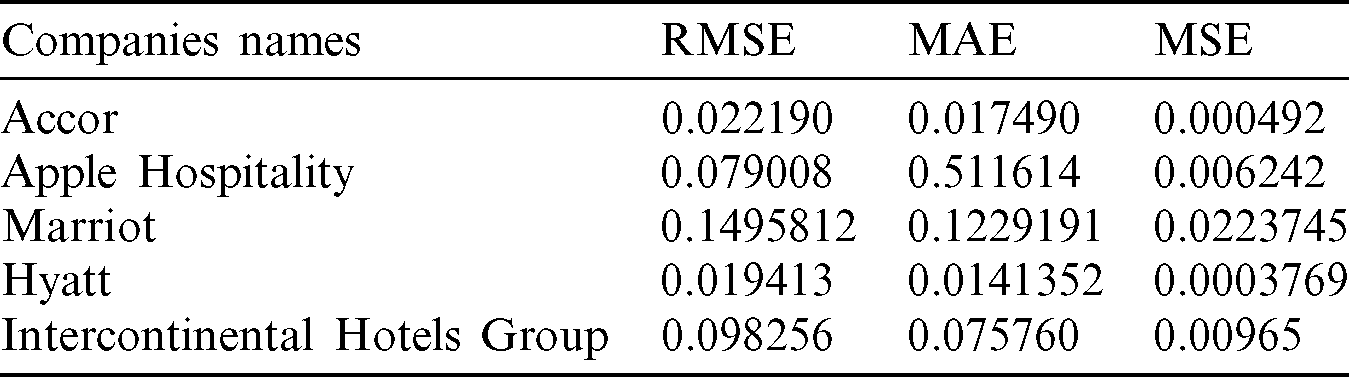
The selected companies for the Technology sector are Zoom Video Communications, Slack, the Meet Group, Cisco Systems, and Microsoft Corporation. The way consumers learn, work, shop, and entertain will change forever. The epidemic may accelerate the adoption of online education, video streaming and help enable more comprehensive access. Due to work from home, quarantine strategies have significantly promoted the video call and chat programs empowering people to maintain their studies and business. In return workplace software companies like slack, cisco, zoom, etc. have offered their services for free and highly boosted up their sales during the corona period. The selected companies for the Hospitality sector are Accor, Apple Hospitality REIT, Marriott International, Hyatt, Intercontinental Hotels Group. The Covid-19 has affected each sector worldwide and the hospitality sector got badly hit in this period. One of the industries directly affected is hotel and travel because social gatherings are also being avoided.
4.2.1 Results Using Historical Stock Data Without Corona Sentiment
In our first experiment, we have used LSTM architecture for all the above-mentioned companies. In this method, we use a large stock data set company that is nearly 10 years old or from the date when data for a specific company is available. In this experiment, we are not using event sentiment data analysis, and the comprehensive results in terms of MAE, MSE, and RMSE are shown in Tabs. 2–6.
Table 2: The stock exchange prediction result of airline sector companies without any sentiment data

Table 3: The stock exchange prediction result of pharmaceutical sector companies without any sentiment data

Table 4: The stock exchange prediction result of ecommerce sector companies without any sentiment data

Table 5: The stock exchange prediction result of technology sector companies without any sentiment data

Table 6: The stock exchange prediction result of hospitality sector companies without any sentiment data
4.2.2 Results Using Corona Sentiment
In the second set of experiments, we considered the Twitter sentiment of corona events as an input for stock exchange prediction. As the tweets for corona spans more than one day, so sentiments are calculated separately for each day. Since the sentiments are usually classified as negative and positive, hence each day is classified as a positive or negative sentiment day. It has been observed that positive sentiments are represented by +1 and negative sentiments are represented by −1. However, just +1 or −1 to shows sentiments of the day is not enough. Therefore, in this study, we used different parameters to calculate the overall sentiment of a single day. We have calculated the percentage of positive, negative, and neutral tweets. Then neutral tweets are ignored and subtracted the rate of negative tweets from positive tweets. This gives an overall better index to show the sentiment of the day. In this way, the sentiment percentage of corona events for each day is estimated. The results of stock rate prediction for all sectors are presented in Tabs. 7–11. These results indicate that corona event sentiment is an important factor in predicting stock prices. It has been observed that the incorporation of Twitter sentiment significantly improved the stock forecasting in all major companies except Southwest airlines, Alibaba Group, and Amazon.com.
Table 7: The stock exchange prediction result of airline sector companies using corona sentiment

Table 8: The stock exchange prediction result of pharmaceutical sector companies using corona sentiment
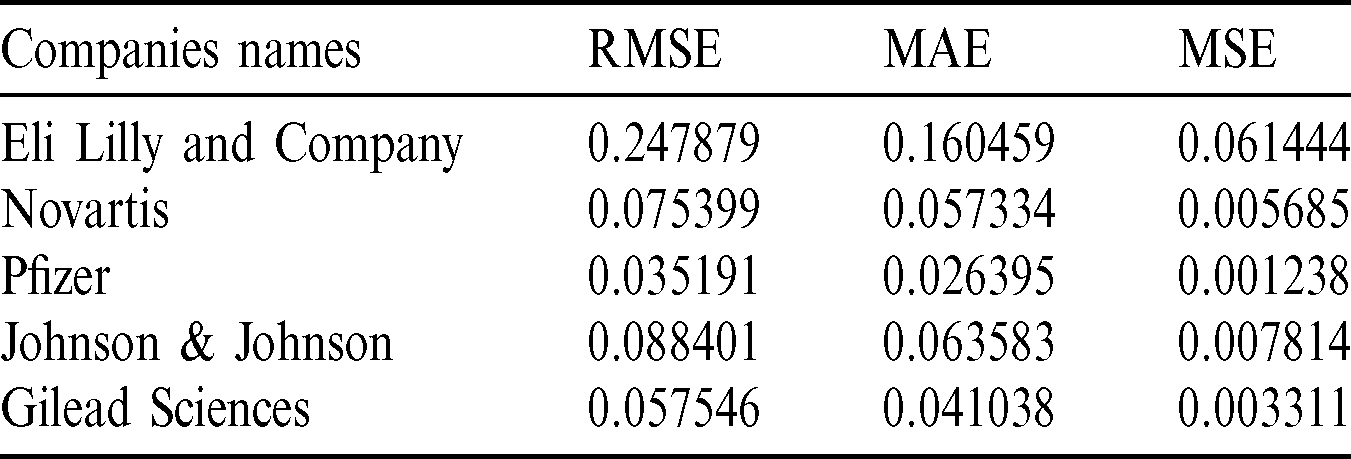
Table 9: The stock exchange prediction result of ecommerce sector companies using corona sentiment

Table 10: The stock exchange prediction result of technology sector companies using corona sentiment

Table 11: The stock exchange prediction result of hospitality sector companies using corona sentiment

The comparative analysis indicates that using corona sentiments gives better results as compared to without using sentiment analysis. So we conclude that events sentiments have helped the forecasting model to improve their results. The stock market is highly unpredictable, complex, and volatile but the integration of mega-events sentiment can increase the accuracy of forecasting as observed in our experiments. Social media is one of the major sources of estimating sentiments of such mega-events. With the increased availability of social media data streams, sentiments of mega-events can boost the performance of forecasting models. In this study, we have explored the role of corona pandemic sentiment analysis in conjunction with a deep learning model to analyze the effect on different sector’s economy. The error values of each sector using sentiment or without sentiments are shown in our experiments. It has been noticed that the error level of all sectors is quite less due to large historical datasets.
Stock exchange forecasting is an important aspect of a reliable and risk-free investment plan. Stock prediction is a challenging task due to volatile stock values which depend on the country’s political condition, community sentiments, and economic conditions. We performed a stock exchange prediction by combining the historical stock data and event sentiments. We developed a forecasting model that can learn time series data intelligently. The deep learning technique LSTM is used to perform stock prediction of the Airline, Pharmaceutical, E-commerce, and Technology, and Hospitality sectors. Daily stock data is used, ranging from 2011 to April 2020, and twitter dataset to estimate sentiment in response to major corona events. The proposed framework validates that the LSTM model in combination with event sentiment has increased the accuracy of stock exchange prediction In this study, it is observed that stock exchanges are sensitive to social media responses, which may also influence the financial incorporation of the economy. Therefore, twitter sentiments can be used along with prediction models to improve the performance of the stock exchange.
In future, multiple event sentiments analysis play an important role in stock predictions. The stock market is highly affected by the occurrence of major events worldwide. The news data and other social platforms are also playing an important role in stock exchange predictions because these platforms can be a good source of collecting information. Enhancing the computational complexity is another important research direction to improve this framework. Deep learning models have been widely used in stock predictions. There are many layers involved in the deep learning structures. These models use backpropagation and forward propagation to match the output with actual results. If the output is different from the actual value, the model adjusts weights again and produces output again. This process is time-consuming, so deep learning model training is slow. To solve this problem, evolutionary models can be used to find the most suitable weights to speed up this process, making the framework real-time which will make it more valuable and adaptable in the industry.
Acknowledgement: The authors are grateful to the COMSATS University Islamabad, Attock Campus, Pakistan for their support for this research.
Funding Statement: This research was supported by X-mind Corps program of National Research Foundation of Korea (NRF) funded by the Ministry of Science, ICT (No. 2019H1D8A1105622) and the Soonchunhyang University Research Fund.
Conflicts of Interest: The authors declare that they have no conflicts of interest to report regarding the present study.
References
1. H. Maqsood, I. Mehmood, M. Maqsood, M. Yasir, S. Afzal et al. (2020). , “A local and global event sentiment based efficient stock exchange forecasting using deep learning,” International Journal of Information Management, vol. 50, pp. 432–451.
2. S. Xingjian, Z. Chen, H. Wang, D. Y. Yeung, W. K. Wong et al. (2015). , “Convolutional LSTM network: A machine learning approach for precipitation nowcasting,” Advances in Neural Information Processing Systems, Montreal, Canada, pp. 802–810.
3. S. Sohangir, D. Wang, A. Pomeranets and T. M. Khoshgoftaar. (2018). “Big data: Deep learning for financial sentiment analysis,” Journal of Big Data, vol. 5, no. 1, pp. 1–25.
4. B. Billah, M. L. King, R. D. Snyder and A. B. Koehler. (2006). “Exponential smoothing model selection for forecasting,” International Journal of Forecasting, vol. 22, no. 2, pp. 239–247.
5. E. Chen, K. Lerman and E. Ferrara. (2020). “Tracking social media discourse about the COVID-19 pandemic: Development of a public coronavirus twitter data set,” JMIR Public Health and Surveillance, vol. 6, pp. e19273.
6. A. Angabini and S. Wasiuzzaman. (2011). “GARCH models and the financial crisis: A study of the Malaysian,” International Journal of Applied Economics and Finance, vol. 5, no. 3, pp. 226–236.
7. K. V. Nesbitt and S. Barrass. (2004). “Finding trading patterns in stock market data,” IEEE Computer Graphics and Applications, vol. 24, no. 5, pp. 45–55.
8. D. Shah, H. Isah and F. Zulkernine. (2019). “Stock market analysis: A review and taxonomy of prediction techniques,” International Journal of Financial Studies, vol. 7, pp. 1–22.
9. D. Bhuriya, G. Kaushal, A. Sharma and U. Singh. (2017). “Stock market predication using a linear regression,” in Int. Conf. of Electronics, Communication and Aerospace Technology, Coimbatore, India, pp. 510–513.
10. L. Zhang, S. Wang and B. Liu. (2018). “Deep learning for sentiment analysis: A survey,” Wiley Interdisciplinary Reviews: Data Mining and Knowledge Discovery, vol. 8, e1253. [Google Scholar]
11. S. Hochreiter and J. Schmidhuber. (1997). “Long short-term memory,” Neural Computation, vol. 9, no. 8, pp. 1735–1780. [Google Scholar]
12. X. Ma, Z. Tao, Y. Wang, H. Yu and Y. Wang. (2015). “Long short-term memory neural network for traffic speed prediction using remote microwave sensor data,” Transportation Research Part C: Emerging Technologies, vol. 54, pp. 187–197. [Google Scholar]
13. H. Liu, X. Mi and Y. Li. (2018). “Smart multi-step deep learning model for wind speed forecasting based on variational mode decomposition, singular spectrum analysis, LSTM network and ELM,” Energy Conversion and Management, vol. 159, pp. 54–64. [Google Scholar]
14. T. Fischer and C. Krauss. (2018). “Deep learning with long short-term memory networks for financial market predictions,” European Journal of Operational Research, vol. 270, no. 2, pp. 654–669. [Google Scholar]
15. J. Zhao, K. Liu and L. Xu. (2016). “Sentiment analysis: Mining opinions, sentiments, and emotions,” Computational Linguistics, vol. 42, no. 3, pp. 595–598. [Google Scholar]
16. H. Ghulam, F. Zeng, W. Li and Y. Xiao. (2019). “Deep learning-based sentiment analysis for Roman Urdu text,” Procedia Computer Science, vol. 147, pp. 131–135. [Google Scholar]
17. J. L. Seng and H. F. Yang. (2017). “The association between stock price volatility and financial news: A sentiment analysis approach,” Kybernetes, vol. 46, no. 8, pp. 1341–1365. [Google Scholar]
18. Z. Jin, Y. Yang and Y. Liu. (2019). “Stock closing price prediction based on sentiment analysis and LSTM,” Neural Computing and Applications, vol. 32, no. 13, pp. 9713–9729. [Google Scholar]
19. M. Baker and J. Wurgler. (2007). “Investor sentiment in the stock market,” Journal of Economic Perspectives, vol. 21, no. 2, pp. 129–152. [Google Scholar]
20. A. D. Dubey. (2020). “Twitter sentiment analysis during COVID-19 outbreak,” SSRN Electronic Journal, pp. 1–9, . https://ssrn.com/abstract=3572023. [Google Scholar]
21. B. P. Pokharel. (2020). “Twitter sentiment analysis during COVID-19 outbreak in Nepal,” . [Online]. Available: https://dx.doi.org/10.2139/ssrn.3624719. [Google Scholar]
22. C. Kaur and A. Sharma. (2020). “Twitter sentiment analysis on coronavirus using textblob,” EasyChair, pp. 2516–2314. [Google Scholar]
23. M. O. Lwin, J. Lu, A. Sheldenkar, P. J. Schulz, W. Shin, R. Gupta et al. (2020). , “Global sentiments surrounding the COVID-19 pandemic on Twitter: Analysis of Twitter trends,” JMIR Public Health and Surveillance, vol. 6, pp. 1–4. [Google Scholar]
24. K. Prokopovič. (2020). “2020 to become the worst year in the history of aviation,” . [Online]. Available: https://aviationvoice.com/iata-2020-to-become-worst-year-in-the-history-of-aviation-202006101843/. [Google Scholar]
 | This work is licensed under a Creative Commons Attribution 4.0 International License, which permits unrestricted use, distribution, and reproduction in any medium, provided the original work is properly cited. |