DOI:10.32604/cmc.2021.014580
| Computers, Materials & Continua DOI:10.32604/cmc.2021.014580 | |
| Article |
Image-Based Automatic Diagnostic System for Tomato Plants Using Deep Learning
1College of Computer Science and Information Technology, King Faisal University, Al-Ahsa, 31982, Saudi Arabia
2College of Science, King Faisal University, Al-Ahsa, 31982, Saudi Arabia
*Corresponding Author: Shaheen Khatoon. Email: ssyed@kfu.edu.sa
Received: 01 October 2020; Accepted: 07 November 2020
Abstract: Tomato production is affected by various threats, including pests, pathogens, and nutritional deficiencies during its growth process. If control is not timely, these threats affect the plant-growth, fruit-yield, or even loss of the entire crop, which is a key danger to farmers’ livelihood and food security. Traditional plant disease diagnosis methods heavily rely on plant pathologists that incur high processing time and huge cost. Rapid and cost-effective methods are essential for timely detection and early intervention of basic food threats to ensure food security and reduce substantial economic loss. Recent developments in Artificial Intelligence (AI) and computer vision allow researchers to develop image-based automatic diagnostic tools to quickly and accurately detect diseases. In this work, we proposed an AI-based approach to detect diseases in tomato plants. Our goal is to develop an end-to-end system to diagnose essential crop problems in real-time, ensuring high accuracy. This paper employs various deep learning models to recognize and predict different diseases caused by pathogens, pests, and nutritional deficiencies. Various Convolutional Neural Networks (CNNs) are trained on a large dataset of leaves and fruits images of tomato plants. We compared the performance of ShallowNet (a shallow network trained from scratch) and the state-of-the-art deep learning network (models are fine-tuned via transfer learning). In our experiments, DenseNet consistently achieved high performance with an accuracy score of 95.31% on the test dataset. The results verify that deep learning models with the least number of parameters, reasonable complexity, and appropriate depth achieve the best performance. All experiments are implemented in Python, utilizing the Keras deep learning library backend with TensorFlow.
Keywords: Tomato plant; disease classification and prediction; deep learning; convolutional neural network; RestNet; VGGNet; DenseNet
Damages and losses in crop production due to natural threats impact the livelihood of smallholder farmers as well as the economy and food security worldwide. Crop losses due to pests, pathogens (fungi, bacteria, and viruses), and nutritional deficiencies are responsible for losing 20%–40% of global agriculture productivity [1]. Usually, the occurrence of these problems is greatly related to the climate-change, and variation of the regional environment, such as humidity, temperature, precipitation, and salinity, which serve as a vector in which pathogens and pests can grow and thus adversely impact on the local community economic, health and farmers’ livelihood [2].
Generally, farmers use manual methods for plant disease diagnosis. Such diagnosis methods are conducted by experts such as plant pathologists, botanists, and agricultural specialists through visual inspection follow by laboratory tests. Such approaches are not suitable in local farming practices due to low human infrastructure capacity and high cost. Real-time and cost-effective disease recognition methods are required for the timely detection and diagnosis of tomatoes crop disorders. For these reasons, it has become essential to develop tools for the automatic diagnosis of plant disorders utilizing image processing and computer vision technology. Rapid disease diagnosis with early interventions will reduce impacts on the entire crop and food supply chains.
Studies have previously used traditional machine learning approaches such as K-Means [3], Support Vector Machines, Logistic Regression, and Multi-Layer forward prorogation [4] neural networks for plant disease classification and proven useful in image classification. However, these techniques are highly dependent on complex hand-crafted feature extraction and dimension reduction techniques, which need to be adapted whenever the underlying problem or dataset changes [5–8]. Hence, these techniques require extensive human effort and do not generalize well.
Recently, Artificial Intelligence (AI) has found widespread applications in agriculture. Mainly, deep learning has been widely applied to classify plant diseases, crop management, pests control, weed detection, and farmland management [6]. Convolutional Neural Network (CNN) based deep learning architectures such as AlexNet [9], VGG-16 [10], and Inception-ResNet [11] gained popularity in image classification tasks over the years. The AlexNet model won the ImageNet Large Scale Visual Recognition (ILSVR-2010) challenge and accurately predicted 1000 categories of images using a 1.2 million training image set. Ever since, multiple methods and frameworks have been proposed for image processing (object detection and classification), and applied to solving various problem-solving domain as an example of end-to-end learning [12–15]. Several recent studies have targeted to solve problems in the agricultural domain using deep learning models. Kamilaris et al. [12] conducted a survey of 40 studies for the application of deep learning in agriculture including several CNNs (e.g., AlexNet, VGG-16, and Inception-ResNet), the Long Short-Term Memory (LSTM) model, the Differential Recurrent Neural Network (DRNN) model, and Support Vector Machines (SVM).
Early investigation has validated deep-learning-based recognition of crop diseases in apple [16], banana [17], wheat [18], Alfalfa [19], tomato [20–22], and the dataset of multiple crops of healthy and diseased leaves [23,24]. However, existing crop disease detection models are mostly focusing on leaf symptoms to differentiate between healthy and diseased leaves. Numerous disease symptoms also appear in other body parts of the plant, such as stem and fruits. Furthermore, current work focuses on plant pathogens, pests, or nutrient deficiency; therefore, farmers need different tools to identify each type of problem. Thus, it is essential to integrate possible threats of a single crop to develop a comprehensive diagnostic system for accurate identification of a wide variety of disorders caused by various sources of a problem.
Inspired by the deep learning breakthrough in image recognition, this study aims to apply state-of-the-art deep learning architecture to detect visual symptoms of tomato plants for the instant classification of disease caused by pathogens and pests and nutritional disorders. We used a large dataset of healthy and infected parts of leaves and fruits of tomato plants to train the deep learning models. The labeled images of tomato leaves and pests are taken from openly available datasets.1,2 We further extended these datasets with tomato fruit and leaf images taken from agriculture farms of King Faisal University using high-resolution cameras. Moreover, we prepared a dataset of four macronutrient deficiencies, including Nitrogen, Potassium, Calcium, and Magnesium, and labeled them with the help of pathogens experts and botanists. We used the extended dataset to train a deep Convolution Neural Network (CNN) of different depth from scratch in the first case and then fine-tuned the pre-trained state-of-the-art deep learning architecture, i.e., VGGNet 16, ResNet with 50 and 152 layers, and DenseNet 121. Each model’s ability to correctly predict different classes of diseases, pests, and nutritional deficiencies is compared. The best model, i.e., DenseNet 121, achieved 95.31% accuracy on the held-out dataset. This study is the first step towards the smartphone-assisted disease diagnosis App for tomato plants. In the next step, we plan to add other crops such as cucumber, eggplants, green chilies, and date palm in the Kingdom of Saudi Arabia to support local farmers and to ensure food security and environmental sustainability in the Kingdom.
The rest of the paper is structured as follows: Section 2 reviews the literature on deep learning-based disease detection models for plant disease classification problems. Section 3 presents the end-to-end deep learning model for tomato plant diseases, pests, and nutritional deficiencies detection. The results achieved are discussed in Section 4. Finally, Section 5 concludes the paper with future work.
Deep learning-based image recognition models have been widely applied to address automated plant recognition and disease identification problems. For instance, Mohanty et al. [25] used a deep learning-based plant disease recognition model to detect 26 diseases for 14 types of crop species using the PlantVillage [26] dataset of 54,306 images of diseased and healthy plant leaves. They trained CNN to predict crop-disease pair on a given image of a leaf. They trained two deep learning architecture, i.e., AlexNet [9] and GoogLeNet [27], from scratch and compared results with a pre-trained version of the same models. The best model based on CNN architecture achieved an accuracy of 99.35% on a held-out test dataset. Wang et al. [16] utilized the same dataset to identify the disease severity by further annotating the apple leaves with four stages of disease severity, i.e., healthy, early, middle, and end-stages. In their experiments, VGG 16 with transfer learning achieved the highest accuracy of 90.5% on the test dataset.
Sladojevic et al. [28] also used CNN to develop plants disease recognition model using leaf images taken from the Internet. By discriminating the plant leaves from their surroundings, 13 common types of plant diseases were recognized by the proposed CNN-based model with 96.3% accuracy. Similarly, deep learning is also applied to plant species identification. For example, Dyrmann et al. [29] developed a CNN model to recognize 22 different types of weed and crops. The model was tested on 10,413 images and was able to achieve an accuracy of 86.2%. The model had a problem recognizing some plant species, and the study claimed that low accuracy is due to a small number of training instances for those species.
While the above studies have validated deep learning-based image recognition models on datasets of multiple crop classification and disease identification, there is a growing interest in developing deep image-based disease diagnostic models for a specific crop, assuming farmers already know what type of crop they are growing. In this case, an early investigation has validated deep learning-based recognition of crop diseases in apple [16], banana [17], wheat [18], Alfalfa [19], tomato [20–22], and the dataset of multiple crops of healthy and diseased leaves [23,24].
Athanikar et al. [30] applied multi-layered back propagation neural network (BPNN) to categorize images of healthy and diseased leaves of the potato crop. The images were collected from potato fields using high-resolution cameras, and different preprocessing techniques were used to enhance images. BPNN was trained on different types of leaves features such as color, texture, shape, and size and was able to predict healthy or diseased leaf with an accuracy of 86%. Moreover, Samanta et al. [31] used a histogram-based image processing technique to detect potato scab diseases. Extensive image segmentation was carried out to identify patterns of target spots; finally, an analysis of the target region was performed to identify the disease phase.
Liu et al. [32] used AlexNet, a CNN based deep learning architecture, to detect apple leaf diseases. They used 13,689 images of diseased apple leaves to detect four common types of apple leaf diseases. Experimental results showed that the proposed disease identification approach achieved an overall accuracy of 97.62%. Selvaraj et al. [17] trained three different types of CNNs architectures i.e., ResNet50, InceptionV2, and MobileNetV1, using transfer learning to detect banana diseases and pests. A total of 18,000 images from different parts of the banana plants were collected from fields and annotated with 18 different diseases and pests. Experimental results showed that most of the models achieved more than 90% accuracy on held-out dataset.
Fuentes et al. [20] proposed a real-time system for tomato plant diseases and insect detection system using images captured in fields using cameras with different resolutions. The system combined three families of meta-architectures (Faster R-CNN, R-FCN, and SSD) with deep feature extractors such as VGGNet and ResNet, to first detect the location of disease/pest and then classify them into nine different categories. Experimental results showed that meta-architectures with feature extraction could recognize different types of tomato plant diseases and pests collected in real scenarios. Our proposed system is different in the sense that it can recognize twenty-four different types of tomato plant diseases, pests, and nutritional deficiencies. Furthermore, we collected images of tomato leaves and fruits from Saudi Arabia under the assumption that the tomato plant is susceptible to different types of diseases and pests due to harsh environmental conditions. Additionally, recognizing a disease with respect to the source of problems such as pathogens, pests, or nutritional deficiencies would help the local farmers to take appropriate remedial action such as spreading chemicals, pesticides, or fertilizers at targeted areas.
The above studies show that CNNs based deep learning models had been applied successfully to various plant disease recognition and showed outstanding performance. Unfortunately, the attack of diseases is not only common to leaves, but other body parts of a plant are equally affected by such problems. Also, most of the studies are conducted on plant disease recognition, and only a few studies focus on pests with only a few common categories, e.g., [17,20]. To the best of our knowledge, this is the first study, which covers eight different types of pests observed in the tomato plant along with four macro-nutrient deficiency problems. Furthermore, most of the existing work focuses only on a single source of problems such as pathogens, pests, or nutritional deficiencies with few more common diseases. Consequently, when disease recognition tools are used under real-world conditions, they have to find the class that best explains the symptoms among the limited subset of disorders and often leads to an incorrect diagnosis. A comprehensive diagnosis system should be able to identify all possible sets of disorders caused by various sources of problems. Thus, it is essential to integrate possible threats of a single crop caused by various sources of problems under one tool. The proposed system has the ability to identify a large number of classes caused by several diseases, pests, and nutritional deficiencies in the tomato plant.
3 Deep Learning-Based Architecture for Tomato Plant Diseases, Pests, and Nutrients-Deficiency Recognition
Tomato plants are susceptible to several diseases caused by pathogens, pests, and nutritional disorders. Several factors can be attributed to affecting the plant, especially in Saudi Arabia and worldwide in general: (1) Harsh environmental conditions such as high temperature, dryness, sandy, and salinity land; (2) Pests that spread diseases from one plant to another; (3) Bacterial, viral, and fungal diseases; (4) Nutritional disorders due to fertilizers’ excess or deficiency. These problems usually present different physical signs and symptoms (variation in shapes, colors, lines, presence of pests or insects, etc.) at various plant parts, such as stems, leaves, and fruits. Due to similar patterns, it is challenging to differentiate different plant problems unless visually inspected by agriculture experts or analyzing a physical sample in a laboratory. Both approaches are time-consuming, costly, and not feasible for smallholder farmers due to lack of infrastructure. Early detection and treatment based on visual characteristics of leaves or fruits can avoid destroying the whole crop.
This work aims to identify twenty-four classes of diseases, pests, and nutritional deficiencies that impact tomatoes production, using deep learning as the system’s main body. An abstract view of the system is presented in Fig. 1. The proposed system consists of several components, from data collection to classification and prediction of the results. The following section describes the detail of each component of the proposed approach.

Figure 1: System overview of the deep-learning-based approach for plant diseases, pests, and nutrients-deficiency recognition. The deep learning architecture consists of several steps that use input images as sources of information and provide detection results in terms of classes ranked on confidence
3.2 Data Collection and Labeling
This study’s dataset contains images for three main categories of problem sources, i.e., diseases, pests, and nutritional deficiencies in the leaves and fruits of the tomato plants. To develop accurate image classifiers for tomato plants disease diagnosis purposes, we needed a large, verified dataset of images of diseased and healthy leaves and fruits. We used the Plant Village [26] dataset openly available for the public for the tomato leaf disease dataset. We selected eight classes of leaf diseases from the plant village dataset that are commonly observed in the local context. We further enriched this dataset with tomato fruit and leaf images for a few disease classes. Additionally, we extended the dataset with three more disease classes for tomato leaves and fruits, i.e., high temperature, leaf miner, and powdery mildew. The images were taken from the agriculture farms of King Faisal University, Alahsa, under natural conditions.
We used publicly available datasets for the pest dataset for eight common tomato pests provided at Mendeley data3 for the tomato leaves. We extended the dataset with more images taken from the local agriculture farms.
To collect data for nutrient deficiencies in tomato leaves and fruits, we cultivated tomato plants under greenhouse conditions at the agriculture farms of King Faisal University. During the growth process, we artificially induced four macro-nutrients deficiency, i.e., Nitrogen (N), Calcium (Ca), Magnesium (Mg), and Potassium (K). We captured tomato leaves and fruits images in the state of deficiency of these nutrients at different stages of the plant growth. Each image is examined by human experts and labeled with the appropriate nutrient deficiency class. We observed Nitrogen and Magnesium deficiency shown only on leaves, Potassium deficiency appeared on leaves in the early stage and fruits on the middle stage, and Calcium deficiency mostly appeared on the fruit.
Altogether, the dataset used for this study has twenty-four classes: Diseases (11), pests (8), nutritional deficiencies (4), and a class for tomato plant healthy leaves and fruits images (1).
The aim of the labeling process is assigning a class label to each image out of twenty-four classes. Agriculture experts have provided the knowledge of assigning an appropriate label. They helped us visually identifying characteristics of leaves and fruit attacked by disease, pests, or nutrient deficiencies to label under the right class of each category.
Tab. 1 shows the total number of images collected across twenty-four classes of problems that can affect the leaves and fruits of a tomato plant.
Table 1: List of categories included in the dataset of tomato diseases, pests, and nutritional deficiencies and their labeled samples

3.3 Disease, Pest and Nutrient-Deficiency Recognition Using CNN Architectures
To find the suitable Convolutional Neural Network (CNN), we first trained a shallow network (ShallowNet) from scratch to investigate how CNN would perform on the small dataset selected for the tomato disease recognition caused by pathogens, pests, and nutritional deficiencies. We then trained state-of-the-art CNN architectures using transfer learning by fine-tuning the top layer of pre-trained models trained on a large dataset. The results of ShallowNet are compared with pre-trained models to understand the relative impact of pre-trained weights on the tomato disease recognition task. In the following section, the network topology of each architecture is described.
To train the deep learning models, we built a shallow network from scratch for the purpose of tomato plant disease classification. The model involves few convolutional layers with few filters in each layer, followed by fully connected layers and ends with a softmax normalization. The ShallowNet was trained on 4, 6, 8, and 10 convolutional layers with an input size of 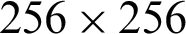 . Each convolutional layer has 32 filters of
  , with the same padding, the stride of one, and the Rectified Linear Units (ReLU) activation function. Each convolutional layer is followed by a
  max-pooling layer, except for the last convolutional layer with an additional dropout regularization layer of 20% dropout ratio to avoid overfitting. The first fully connected layer has 128 units with a ReLU activation and is followed by the last fully connected layer with 24 units, corresponding to twenty-four classes, which feed into the softmax layer to calculate the probability of the output.
It is worth mentioning that CNN-based models are largely impacted by the dataset’s size used to train the models. To understand the impact of a limited dataset on the CNN model’s performance, we used the concept of transfer learning. The key idea is taking an existing model trained on one type of problem and using it to train another related task by fine-tuning a network’s parameters. Pre-trained models are usually trained on a large dataset, and we can benefit from knowledge gained during training to fine-tune the target domain with a smaller dataset [25].
The capacity of pre-trained models varies based on the number of learnable parameters, operations, and depth. A CNN model complexity increases with an increasing number of parameters and operation. Moreover, as the depth increases, other challenges emerge, such as vanishing gradients, internal covariate shifts, and degradation problems [24]. While considering these factors and accelerate learning at the same time, we selected the four pre-trained models with significant variance in complexity and depth. We fine-tuned VGGNet with 16 layers [10], ResNet with 50 and 152 convolution layers [11], and DenseNet [33] with 121 layers to classify 24 categories of tomato plant diseases, pre-trained on ImageNet [34].
VGGNet: VGGNet is a CNN model proposed by Simonyan et al. [10]. The model attained a 7.5% error rate on the validation set and secured second place in the 2014 ImageNet Large Scale Visual Recognition Challenge (ILSVRC).
VGGNet involves 16 (VGG 16) convolutional layers and  size of input images. Typically, the model is famous for the unified arrangement of convolution layers with
  filters and max pool layers of
  filters stacked on top of each other in increasing depth. The model ends with three fully connected layers, followed by a linear layer with softmax activation for the output. The model involves about 120 million parameters and requires a considerable amount of memory, making it computationally more expensive for optimizing the learning parameters.
We used the same network topology to train VGG16 for the tomato disease classification task. Additionally, fine-tuning was done by truncating the original softmax layer and replacing it with a new fully-connected softmax layer with 24 output corresponding to 24 labels in our classification task.
ResNet: The ResNet (Residual Network) was introduced by He et al. [11]. The model won first place on the ILSVRC challenge in 2016 with an error rate of 3.7% on the ImageNet classification, ever since the model is used for solving computer vision problems across multiple domains.
The network is built upon many stacked residual units. These residual units are the set of building blocks used to construct the network. Each building block consists of several convolutional layers, followed by pooling layers. The architecture is similar to the VGGNet consisting of  filters, but ResNet is about eight times deeper than VGGNet and uses the concept of skip connection, i.e., non-linear convolution layers. The skip connection bypasses the previous residual block input and adds the input directly to the bottleneck residual block with an identity function. The identity function and the output of previous residual units are combined by summation to achieve feature mapping. Hence, the gradient can flow directly through identity mapping from earlier layers to later layers. The identity mapping enables the creation of deeper networks that can learn more complex mappings without the degradation problem usually observed in single-branch networks like VGGNet 16.
We fine-tuned ResNet using the same network topology presented in the original work. Each residual building block has two  convolutional layers with a
  convolution layer in between and a direct skip connection. Each convolution operation is followed by batch normalization and the ReLU activation function. We loaded the ResNet with 50 and 152 layers with pre-trained weight from ImageNet. Finally, a customized softmax layer was created for the task of tomato disease identification.
DenseNet: DenseNet was introduced by Huang et al. [33]. The model is based on the concept of a densely connected convolutional network. The architecture is made up of several dense blocks, each followed by transition layers. All layers in a dense block are directly connected in a feed-forward manner to ensure maximum information flow in the network. A single layer in a dense block has a  convolution filter, and it receives the feature- maps of all preceding layers as input, which concatenate its unique feature-maps to produce input for the next layer. To keep the feature dimension the same between each dense block, it uses a transition layer with a
  filter followed by a
  average pooling layer to down-sample the next block’s feature size.
For the task of tomato plant disease identification, we created DenseNet model with 121 layers, as presented in the original paper by Huang et al. [33]. The model was loaded with pre-trained weights from ImageNet. Additionally, the top fully connected layer was replaced with a new fully-connected layer and customized softmax layer for the task of tomato plant disease classification.
This section describes the dataset used in the experiment and evaluates the performance of deep learning models. All networks are implemented in Python programming language using Keras deep learning library with the Tensorflow backend. Experiments are carried out on GPU based workstation with 16 GB of RAM equipped with NVIDIA GTX 1080ti with 8 GB of memory and 1920 CUDA cores.
4.1 Training and Testing Dataset
We used images of healthy and infected images of the tomato plants for the task of image-based plant disease classification. The overall dataset contains 23,716 labeled images of healthy and infected parts of the tomato plant’s fruits and leaves grouped into disease, pest, and nutrition deficiency across twenty-four classes. Tab. 1 shows the number of images and classes for each category. The dataset is very challenging since images have varying background, shape, resolution, and illumination conditions.
We divided the dataset into a training set and testing set by applying stratified random sampling and split the dataset into 90% in the training set and 10% in the testing set. The training dataset contains 21,345 images, and the testing dataset contains 2371 samples. We further divided the training set into two subsets, i.e., 80% training set (17,076 images) and 20% validation set (4269 images). Since images contain the same leaf or fruit taken from different orientations or illumination, we developed a python script to map the same set of images either in training, testing, or validation dataset.
Image preprocessing techniques are applied to training and testing datasets to make them compatible with each network’s input size. We applied four types of image preprocessing techniques: First, all images are resized to  pixels for ShallowNet,
  for VGGNet, ResNet, and DenseNet. We performed model optimization and prediction on resized images. Second, we normalized all pixels’ values by the ratio of 1/255 to rescale high-resolution images into the network’s input size, following common approaches for deep learning architectures [9]. Third, we performed sample-wise standardization to increase the efficiency of end-to-end training. Standardization is achieved by subtracting a pixel from its mean value and dividing the result by the standard deviation of the pixel so that the individual features are distributed normally with zero mean and unit variance. Finally, training instances were augmented with several random variations, including rotation, zooming, flipping, mirroring, brightness, and contrast adjustment. Consequently, the size of the training set increased by 10-fold with a significant reduction of overfitting problems [32].
4.2 Fine-tuning Network Parameters
Each of the experiment runs for a total of 12 epochs with a batch size of 32. Where epoch is the number of training iterations, and batch size is the number of examples processed before the model is updated. Network weights were optimized using the Adam optimization algorithm. Since Adam optimizer only requires first-order gradients with little memory requirement; therefore, it is an efficient method for stochastic optimization [35]. We used a learning rate scheduler to modulate the changing learning rate of optimizer with an initial weight decaying factor and learning rate of 1e-2, which descends every iteration down to 1e-4. Moreover, the step size for updating learning was set to 10,000 iterations with the decay rate of 0.90. After appropriate experimentation, these values gave the best results during training.
Training and fine-tuning of the deep learning architectures were carried out, as described in Section 3.3. Our focus was on finding the best model suitable for the task of recognizing tomato diseases, pests, and nutritional deficiencies. In the first set of experiments, we trained a shallow network with different depths from scratch. In the second set of experiments, transfer learning was used by fine-tuning the pertained models, i.e., VGGNet-16, ResNet-50, ResNet 152, and DenseNet 121 using parameters described in Section 4.2.
We trained a small network with 4, 6, 8, and 10 convolution layers (ShallowNet) according to network topology described in Section 3.3. Fig. 2 shows the training, validation, and testing accuracy of the ShallowNet. Each bar in the figure shows the result of 12 runs with a batch size of 32. We noticed that at first, the validation and testing accuracy improves slightly with increasing the depth of the model. The ShallowNet with 8 layers achieved the best performance with a validation accuracy of 88% and a testing accuracy of 78%. However, the accuracy starts decreasing with increasing the depth from 8 layers onwards. The performance fall is due to insufficient training data to train the model with too many parameters. The limited size of the training data set is addressed by using transfer learning in the next set of experiments.

Figure 2: Accuracy of a shallow network across different convolutional layers
In the next set of experiments, transfer learning was applied by fine-tuning the state-of-the-art deep learning architecture pre-trained on the ImageNet dataset, as described in Section 3.3. We fine-tuned the VGGNet 16, ResNet 50, ResNet 152, and DenseNet 121. We truncated the original softmax layer in each architecture and replaced it with a new, fully connected softmax layer for the tomato disease identification problem.
Overall accuracy on the testing dataset is computed to evaluate the performance of each model on unseen data. The accuracy results of each model, with the total number of parameters, are shown in Tab. 2. Overall accuracy achieved on the test dataset varies from 78%–95%. It can be observed from the table that the testing accuracy of ShallowNet 8 is the lowest (78.05%) than all fine-tuned pre-trained models. Each pre-trained model achieved accuracy over 90%, except VGG 16, with 80.32% accuracy. Among all pre-trained models, DenseNet 121 achieved the highest test accuracy score of 95.31%, beating RestNet 50 and ResNet 152 by 3%–5% higher accuracy, respectively. The results verify that models with a large number of parameters perform poorly compared to models with fewer parameters.
Table 2: Accuracy of CNN-based models on the training, validation, and testing dataset

After fine-tuning the pre-trained models using 12 epochs, all models achieved accuracy above 95% on the validation dataset, except VGGNet 16. DenseNet-121 and ResNet 50 consistently performed better than ResNet 152 and VGGNet 16. Additionally, they converge earlier with fewer iterations, as perceived in Figs. 3b and 3d.

Figure 3: Accuracy performance of training and validation dataset: (a) VGGNet 16; (b) ResNet 50; (c) ResNet 152; (d) DenseNet 121
These results conclude that deeper models perform better than shallow models. Equally, deeper models can be more complex in terms of the number of operations and learnable parameters. However, the complexity of deep learning models is associated with their capacity to extract more features from the images; therefore, it is expected that a model with reasonable complexity and the least number of parameters should be the most accurate.
DenseNet 121 is lightweight with the least number of parameters, about eight times lesser than ResNet 152 and 16 times smaller than VGGNet 16. Therefore, it is easier to train DenseNet as compared to the other architectures evaluated in this study. Although ResNet achieved the state-of-the-art result on the ImageNet dataset, its performance is relatively lower than DenseNet in the tomato diseases’ classification task. Furthermore, it is worth noting that ResNet with 152 layers performed poorly than ResNet with 50 layers. The reason might be the early mapping of the residual unit to zero, leading to local optimization and poor generalization in the fine- grained classification.
On the other hand, ResNet yielded higher accuracy than VGGNet 16 on both validation and test datasets and converged on fewer iterations than VGGNet 16. Overall, DenseNet 121 achieved the highest accuracy of 98.05%, while VGG 16 achieved the least accuracy. The results are consistent with [24], where DenseNet 121 achieved the highest accuracy on the test dataset of multi-crop classification of diseased and healthy leaves.
Another observation derived in Tab. 2 is that although the best performance achieved by DenseNet 121 with an accuracy of 98.5% on the validation dataset and 95.31% on the test dataset, there exists a small difference in accuracy performance of ResNet 50 with 95.66% accuracy on validation dataset and 90.85% on the testing dataset. By closely observing Figs. 3b and 5d, it is noticeable that the accuracy pattern on the training dataset is almost the same for both models. It implies that more depth of network could be less significant in improving accuracy when a model reaches its sufficient depth.
4.4 Failure Analysis and Discussion
Based on the result obtained on the validation dataset, we generated a confusion matrix to analyses classification errors generated by the best model, i.e., DenseNet 121. We observed no interclass similarities of pest category exist with disease and nutritional deficiency categories by closely analyzing errors. Pests’ misclassification with the other two groups was not expected since pests’ images (worms, flies, etc.) have no similar visual characteristics with diseased leaves and fruits images. However, DenseNet 121 produced a high confusion among diseases and the nutrients deficiency category. The results are shown in Fig. 4. It can be observed from the error matrix (red boxes) that the model is highly confused between disease classes (‘early blight,’ ‘late blight,’ and ‘Yellow Leaf Curl Virus (YLCV)’) with nutritional deficiencies (Nitrogen and Magnesium) and vice versa. Nutrients’ deficiency, mainly Nitrogen, produced a lot of confusion and low accuracy (79%) with early blight (7%), late blight (4%), and YLCV (6%). Similarly, YLCV class produced high confusion with Nitrogen and Magnesium deficiency. This was expected since YLCV, early blight, late blight, and macronutrients (Nitrogen and Magnesium) deficiency produce similar symptoms, i.e., turning leaf into yellow at an early stage and produced unique symptom at an advanced stage.

Figure 4: Error matrix of DenseNet 121 on the validation dataset of tomato diseases and nutrient deficiency images. Red boxes show interclass similarities, and green boxes show intraclass similarities
It is also worth mentioning that the dataset is not big enough, and especially nutrient deficiency images are less compared to disease category images. Therefore, the most likely cause of classification errors is insufficient training data. We are currently collecting and labeling more images for each disease’s early stages from various perspectives of leaf and fruit symptoms to improve the model’s accuracy to address this issue. Since early-stage symptoms are more important to diagnose to prevent massive scale crop destruction, it is expected that the dataset should have sufficient instances to diagnose early-stage diseases accurately.
It is also worth noting from Fig. 4 that besides interclass misclassification, i.e., disease and nutrient deficiency, a small interclass variance also exists within each category. We further tested the two most successful CNN models to analyze the interclass classification errors, i.e., DenseNet 121 and ResNet 50, on the test dataset. The results are shown in Fig. 5. Each matrix shows accuracy per class (diseases, pests, and nutritional deficiencies) and the quantitative representation of classes in which actual classes are misclassified. The observation in Figs. 5a and 5b shows some confusion between Nitrogen, Potassium, and Magnesium deficiency. Since all these deficiencies show yellow leaf symptoms at an early stage, there is a high probability of misclassification. The same is the case in Figs. 5c and 5d, where there is a confusion between bacterial spots, septoria spot, and target spot as well as in early blight, late blight, and YLCV. In these cases, all these diseases show similar symptoms, i.e., leaf spotting and yellowing in the disease’s early stage. Finally, Figs. 5e and 5f show that the taro caterpillar’s predicted label is mixed with cotton bowel worm. The apparent reasons for these classification errors are the lack of sufficient training data. A rigorous image labeling is required to address these problems. Furthermore, it can also be observed that the success rate of ResNet 50 is slightly lower than DenseNet 121.
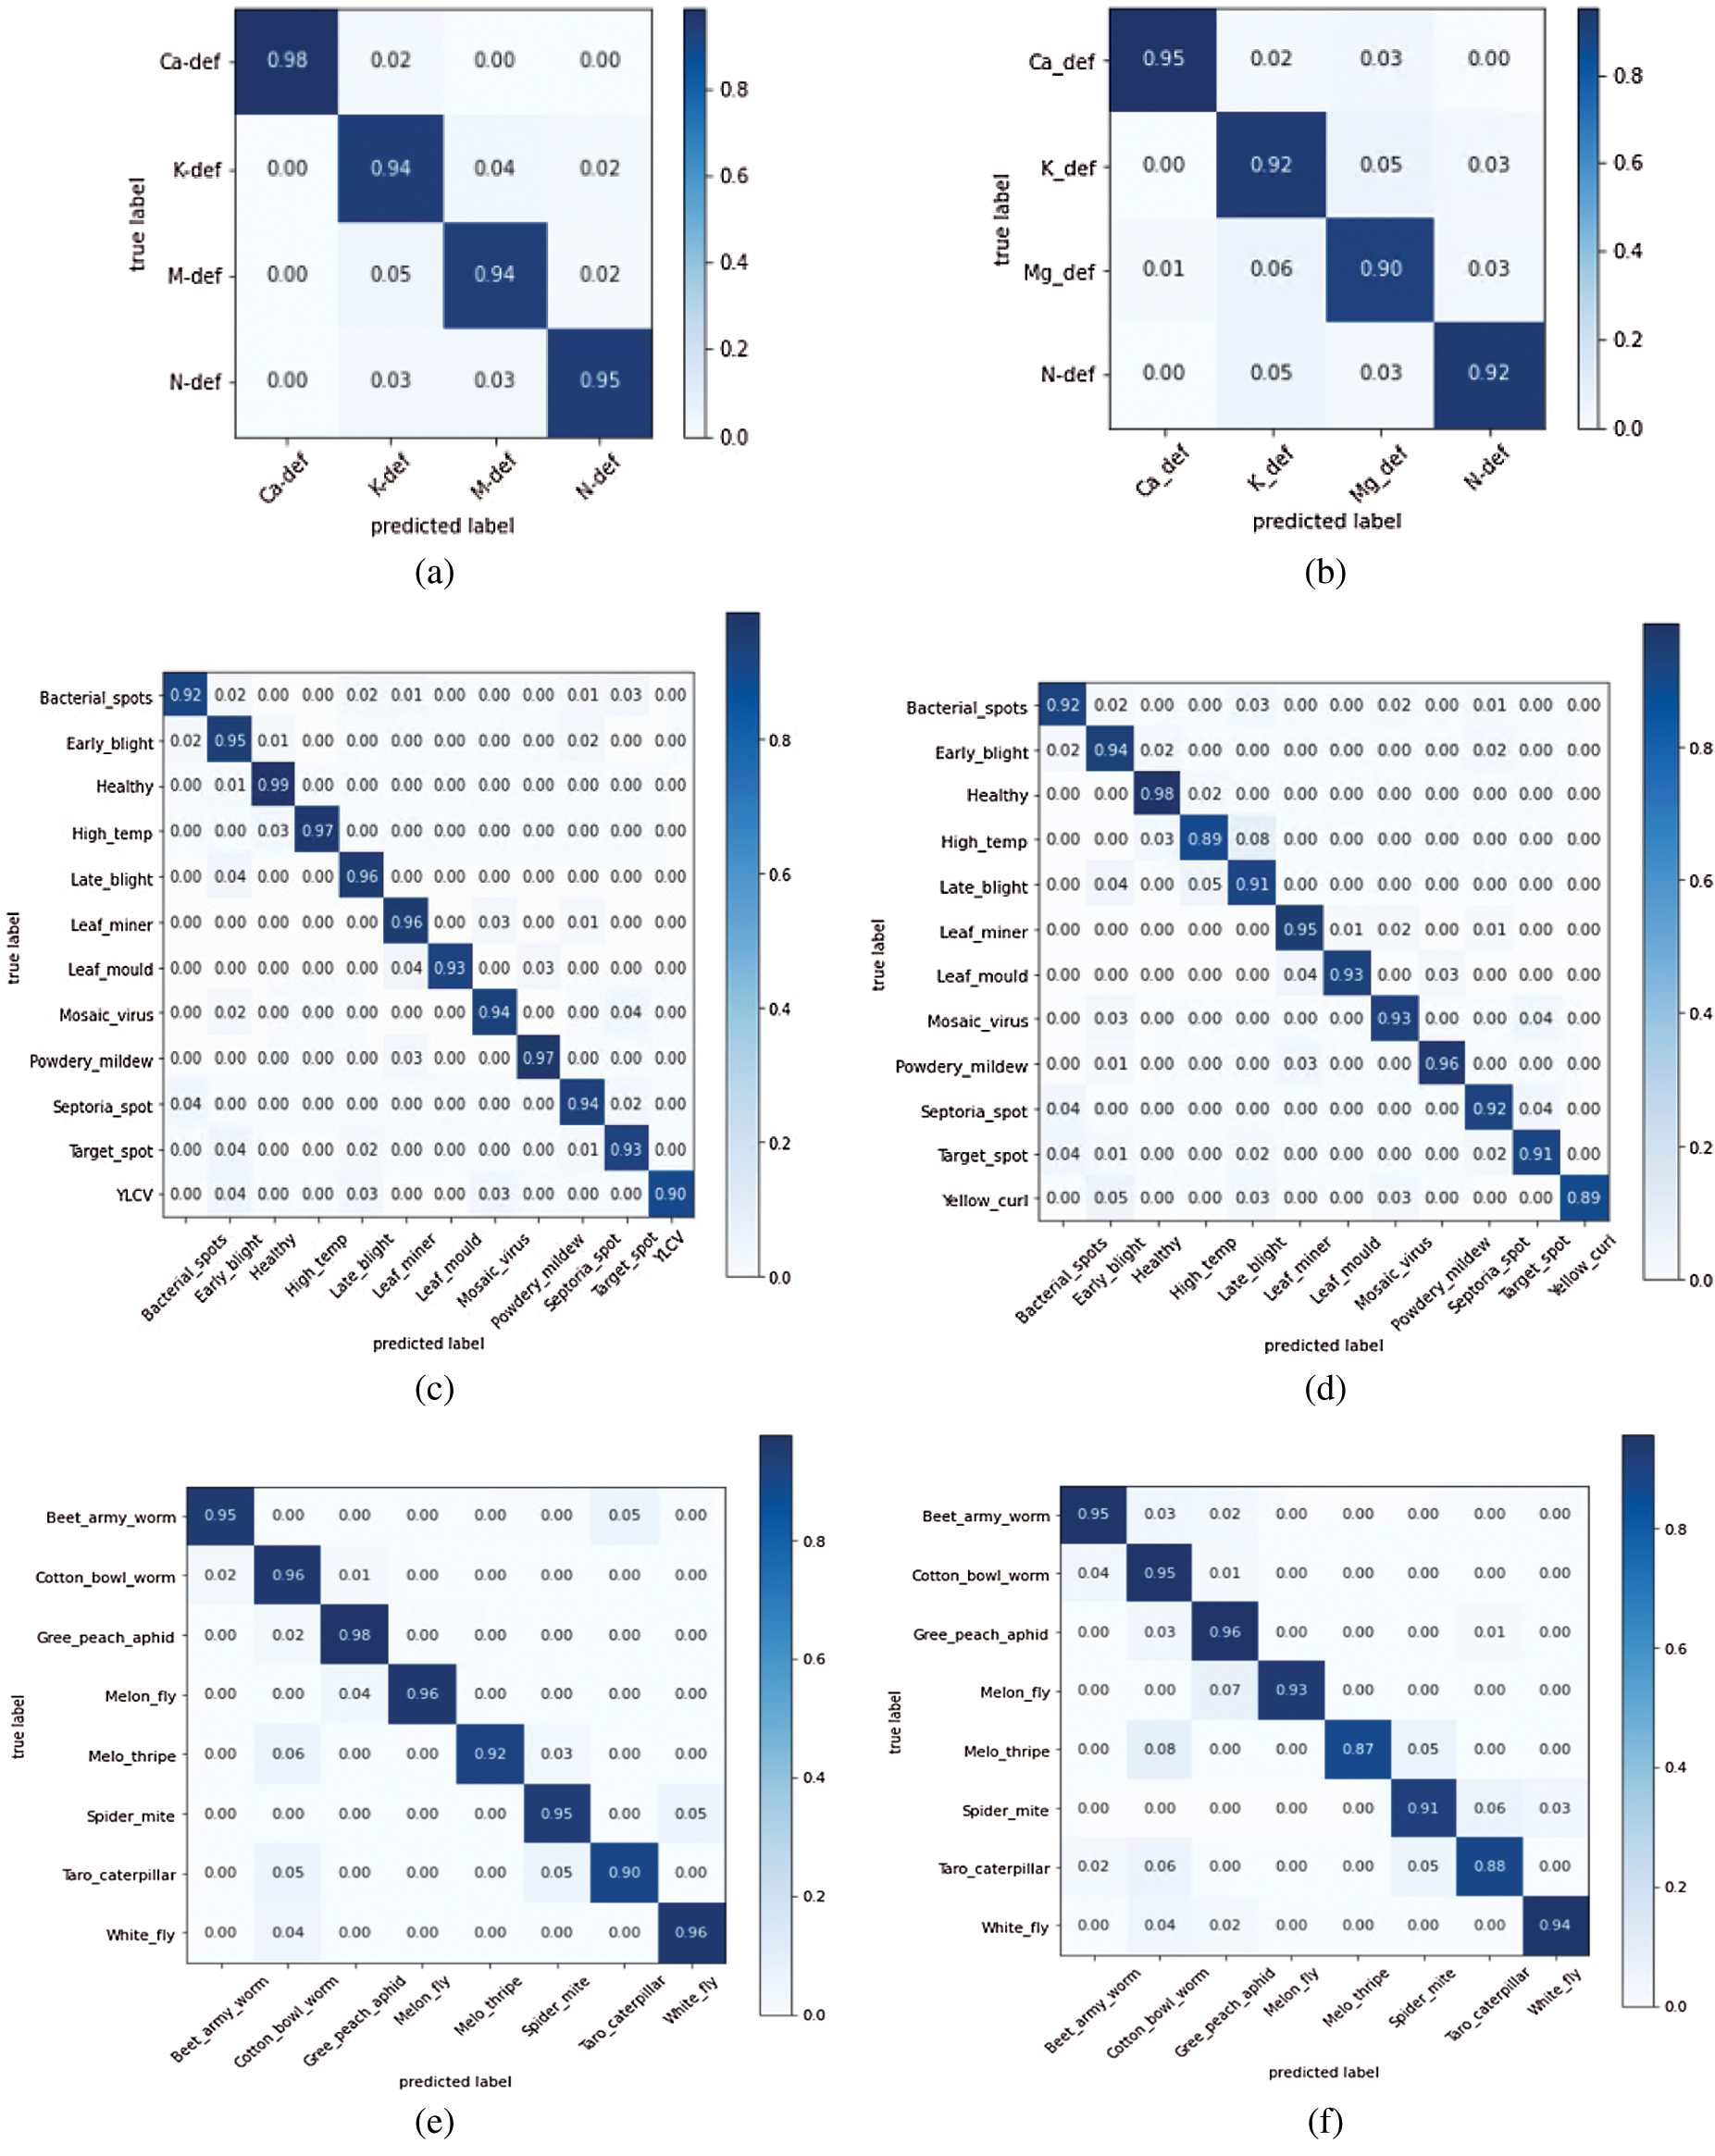
Figure 5: Confusion matrix for the best models: (a) Nutritional deficiencies-DenseNet 121; (b) Nutritional deficiencies-ResNet 50; (c) Tomato plant diseases-DenseNet 121; (d) Tomato plant diseases-ResNet 50, (e) Tomato plant pests-DenseNet 121; (f) Tomato plant pests-ResNet 50
In this research, we developed, trained, and tested various deep learning models using specific CNN architectures for the identification of tomato diseases caused by pathogens, pests, and nutritional deficiencies in a unified manner. The models’ training was performed using 23,716 images of the tomato plants’ diseased and healthy leaves and fruits. Our experimental dataset consists of images from openly available datasets together with additional images of tomato fruit and leaf images taken from the local agriculture farms. The dataset comprises images from three categories (diseases, pests, and nutritional deficiencies) and is divided into a total of 24 classes. The most successful CNN architecture, DenseNet 121, achieved a success rate of 95.31% (top-1 error of 4.69%) in the classification of 2371 previously unseen images (testing set).
It is worth mentioning that the inclusion of twenty-four classes of tomato leaf and fruit images spanning disease, pests, and nutrition deficiency related labels together in the dataset makes this work the most diverse tomato disease identification task addressed uniformly using deep learning models. Nevertheless, despite the high accuracy, there are several challenges to be addressed before deploying this research in practice. Firstly, the dataset used for testing the models is originated from the same origin as the training dataset. To assess the system’s practical usability, the test dataset should come from real fields–-preferably from heterogeneous sources different from the training dataset. Secondly, although the proposed system has 24 classes of the same crop, it is still not an exhaustive list of threats that can affect the tomato plants. Various environmental factors, such as humidity, temperature, precipitation, and salinity, have different impacts on plants, and therefore, a comprehensive diagnostic system should be able to integrate such factors in the deep learning model. Our future work will address some of these issues in detail. Nonetheless, the proposed deep learning approach outlined in this paper has its own potentials and can be adequately adapted with proper considerations for the quantity and quality of the training data to make the trained models suitable for broader real-world applications.
Acknowledgement: We extend our appreciation to the College of Agriculture, King Faisal University, for providing access to its agriculture farms and providing expertise for data labeling.
Funding Statement: The authors extend their appreciation to the Deputyship for Research & Innovation, Ministry of Education in Saudi Arabia, for funding this research work through the Project No. IFT20065.
Conflicts of Interest: There are no conflicts of interest to report regarding the present study.
Notes
1 https://data.mendeley.com/datasets/s62zm6djd2/1.
2https://plantvillage.psu.edu/diseases.
3A database of eight common tomato pest images: https://data.mendeley.com/datasets/s62zm6djd2/1.
References
1. S. Savary, A. Ficke, J. N. Aubertot and C. Hollier. (2012). “Crop losses due to diseases and their implications for global food production losses and food security,” Food Security, The ScienceSociology and Economics of Food Production and Access to Food, vol. 4, pp. 519–537.
2. M. Pautasso, T. F. Doring, M. Garbelotto, L. Pellis and M. J. Jeger. (2012). “Impacts of climate change on plant diseases–-opinions and trends,” European Journal of Plant Pathology, vol. 133, no. 1, pp. 295–313.
3. K. Lin, L. Gong, Y. Huang, C. Liu and J. Pan. (2019). “Deep learning-based segmentation and quantification of cucumber powdery mildew using convolutional neural network,” Frontiers in Plant Science, vol. 10, pp. 155.
4. X. Cheng, Y. Zhang, Y. Chen, Y. Wu and Y. Yue. (2017). “Pest identification via deep residual learning in complex background,” Computers and Electronics in Agriculture, vol. 141, pp. 351–356.
5. J. Amara, B. Bouaziz and A. Algergawy. (2017). “A deep learning-based approach for banana leaf diseases classification,” Business, Technologie und Web (BTW 2017)–Workshopband, Bonn, Germany, Lecture Notes in Informatics (LNIGesellschaft für Informatik, pp. 79–88.
6. K. Liakos, P. Busato, D. Moshou, S. Pearson and D. Bochtis. (2018). “Machine learning in agriculture: A review,” Sensors, vol. 18, no. 8, pp. 2674.
7. D. Pujari, R. Yakkundimath and A. S. Byadgi. (2016). “SVM and ANN based classification of plant diseases using feature reduction technique,” International Journal of Interactive Multimedia and Artificial Intelligence, vol. 3, no. 7, pp. 6–14.
8. X. Yang and T. Guo. (2017). “Machine learning in plant disease research,” European Journal of BioMedical Research, vol. 3, no. 1, pp. 6–9.
9. A. Krizhevsky, I. Sutskever and G. E. Hinton. (2017). “Imagenet classification with deep convolutional neural networks,” Communications of the ACM, vol. 60, no. 6, pp. 84–90.
10. K. Simonyan and A. Zisserman. (2014). “Very deep convolutional networks for large-scale image recognition,” International Conference on Learning Representations, . [Online]. Available: http://arxiv.org/abs/1409.1556. [Google Scholar]
11. K. He, X. Zhang, S. Ren and J. Sun. (2016). “Deep residual learning for image recognition,” in Proc. of the IEEE Conf. on Computer Vision and Pattern Recognition, pp. 770–778, . [Online]. Available: https://arxiv.org/abs/1512.03385. [Google Scholar]
12. A. Kamilaris and F. X. Prenafeta-Boldú. (2018). “Deep learning in agriculture: A survey,” Computers and eEectronics in Agriculture, vol. 147, pp. 70–90. [Google Scholar]
13. L. Pan, C. Li, S. Pouyanfar, R. Chen and Y. Zhou. (2020). “A novel combinational convolutional neural network for automatic food-ingredient classification,” Computers, Materials & Continua, vol. 62, no. 2, pp. 731–746. [Google Scholar]
14. M. Shorfuzzaman and M. Masud. (2020). “On the detection of COVID-19 from chest X-ray Images using CNN-based transfer learning,” Computers, Materials & Continua, vol. 64, no. 3, pp. 1359–1381. [Google Scholar]
15. Y. Tan, L. Tan, X. Xiang, H. Tang, J. Qin et al. (2020). , “Automatic detection of aortic dissection based on morphology and deep learning,” Computers, Materials & Continua, vol. 62, no. 3, pp. 1201–1215. [Google Scholar]
16. G. Wang, Y. Sun and J. Wang. (2017). “Automatic image-based plant disease severity estimation using deep learning,” Computational Intelligence and Neuroscience, vol. 2017, pp. 1–8. [Google Scholar]
17. M. G. Selvaraj, A. Vergara, H. Ruiz, N. Safari, S. Elayabalan et al. (2019). , “AI-powered banana diseases and pest detection,” Plant Methods, vol. 15, no. 1, pp. 92. [Google Scholar]
18. E. L. Stewart and B. A. McDonald. (2014). “Measuring quantitative virulence in the wheat pathogen Zymoseptoria tritici using high-throughput automated image analysis,” Phytopathology, vol. 104, no. 9, pp. 985–992. [Google Scholar]
19. F. Qin, D. Liu, B. Sun, L. Ruan, Z. Ma et al. (2016). , “Identification of alfalfa leaf diseases using image recognition technology,” PLoS One, vol. 11, no. 12, e0168274. [Google Scholar]
20. A. Fuentes, S. Yoon, S. Kim and D. Park. (2017). “A robust deep-learning-based detector for real-time tomato plant diseases and pests recognition,” Sensors, vol. 17, no. 9, pp. 2022. [Google Scholar]
21. A. F. Fuentes, S. Yoon, J. Lee and D. S. Park. (2018). “High-performance deep neural network-based tomato plant diseases and pests diagnosis system with refinement filter bank,” Frontiers in Plant Science, vol. 9, pp. 1162. [Google Scholar]
22. J. Liu and X. Wang. (2020). “Tomato diseases and pests detection based on improved Yolo V3 convolutional neural network,” Frontiers in Plant Science, vol. 11, pp. 898. [Google Scholar]
23. K. P. Ferentinos. (2018). “Deep learning models for plant disease detection and diagnosis,” Computers and Electronics in Agriculture, vol. 145, pp. 311–318. [Google Scholar]
24. E. C. Too, L. Yujian, S. Njuki and L. Yingchun. (2019). “A comparative study of fine-tuning deep learning models for plant disease identification,” Computers and Electronics in Agriculture, vol. 161, pp. 272–279. [Google Scholar]
25. S. P. Mohanty, D. P. Hughes and M. Salathe. (2016). “Using deep learning for image-based plant disease detection,” Frontiers in Plant Science, vol. 7, pp. 1419. [Google Scholar]
26. D. Hughes and M. Salathe. (2015). “An open access repository of images on plant health to enable the development of mobile disease diagnostics,” . [Online]. Available: https://arxiv.org/abs/1511.08060. [Google Scholar]
27. C. Szegedy, S. Ioffe, V. Vanhoucke and A. Alemi. (2016). “Inception-v4, inception-resnet and the impact of residual connections on learning,” . [Online]. Available: https://arxiv.org/abs/1602.07261. [Google Scholar]
28. S. Sladojevic, M. Arsenovic, A. Anderla, D. Culibrk and D. Stefanovic. (2016). “Deep neural networks based recognition of plant diseases by leaf image classification,” Computational Intelligence and Neuroscience, vol. 2016, no. 6, pp. 1–11. [Google Scholar]
29. M. Dyrmann, H. Karstoft and H. S. Midtiby. (2016). “Plant species classification using deep convolutional neural network,” Biosystems Engineering, vol. 151, pp. 72–80. [Google Scholar]
30. G. Athanikar and P. Badar. (2016). “Potato leaf diseases detection and classification system,” International Journal of Computer Science and Mobile Computing, vol. 5, no. 2, pp. 76–88. [Google Scholar]
31. D. Samanta, P. P. Chaudhury and A. Ghosh. (2012). “Scab diseases detection of potato using image processing,” International Journal of Computer Trends and Technology, vol. 3, no. 1, pp. 109–113. [Google Scholar]
32. B. Liu, Y. Zhang, D. He and Y. Li. (2018). “Identification of apple leaf diseases based on deep convolutional neural networks,” Symmetry, vol. 10, no. 1, pp. 11. [Google Scholar]
33. G. Huang, Z. Liu, L. Van Der Maaten and K. Q. Weinberger. (2017). “Densely connected convolutional networks,” in Proc. of the IEEE Conf. on Computer Vision and Pattern Recognition, California, USA, pp. 4700–4708. [Google Scholar]
34. M. M. Ghazi, B. Yanikoglu and E. Aptoula. (2017). “Plant identification using deep neural networks via optimization of transfer learning parameters,” Neurocomputing, vol. 235, pp. 228–235. [Google Scholar]
35. D. P. Kingma and J. Ba. (2014). “Adam: A method for stochastic optimization,” . [Online]. Available: https://arxiv.org/abs/1412.6980. [Google Scholar]
 | This work is licensed under a Creative Commons Attribution 4.0 International License, which permits unrestricted use, distribution, and reproduction in any medium, provided the original work is properly cited. |