DOI:10.32604/cmc.2021.014561
| Computers, Materials & Continua DOI:10.32604/cmc.2021.014561 | |
| Article |
An AIoT Monitoring System for Multi-Object Tracking and Alerting
1Korea Electronics Technology Institute, Seongnam, 13509, Korea
2Electronics and Telecommunications Research Institute, Daejeon, 34129, Korea
3Hancom With Inc., Seongnam, 13493, Korea
4Hanshin University, Osan-si, 18101, Korea
*Corresponding Author: Jeongwook Seo. Email: jwseo@hs.ac.kr
Received: 28 September 2020; Accepted: 24 October 2020
Abstract: Pig farmers want to have an effective solution for automatically detecting and tracking multiple pigs and alerting their conditions in order to recognize disease risk factors quickly. In this paper, therefore, we propose a novel monitoring system using an Artificial Intelligence of Things (AIoT) technique combining artificial intelligence and Internet of Things (IoT). The proposed system consists of AIoT edge devices and a central monitoring server. First, an AIoT edge device extracts video frame images from a CCTV camera installed in a pig pen by a frame extraction method, detects multiple pigs in the images by a faster region-based convolutional neural network (RCNN) model, and tracks them by an object center-point tracking algorithm (OCTA) based on bounding box regression outputs of the faster RCNN. Finally, it sends multi-pig tracking images to the central monitoring server, which alerts them to pig farmers through a social networking service (SNS) agent in cooperation with an oneM2M-compliant IoT alerting method. Experimental results showed that the multi-pig tracking method achieved the multi-object tracking accuracy performance of about 77%. In addition, we verified alerting operation by confirming the images received in the SNS smartphone application.
Keywords: Internet of Things; multi-object tracking; pig pen; social network
The factory-type pig farming may cause serious problems such as diseases and odors since it lowers the immunity of pigs and makes environmental management difficult [1,2]. The improper enlargement of the factory-type pig pens and reduction of workers inevitably induces disease vulnerable breeding structure and hygiene management failure [3,4]. Actually, pig farmers in Korea suffered from foot-and-mouth disease (FMD) in 2010 and African swine fever virus (ASFV) in 2019. Especially, the FMD can survive up to 24–36 h in human bronchus, allowing airborne transmission from humans to pigs, so infected farms or visitors should not contact pigs for more than one week after entry [5]. Also, once any disease occurs in pig pens, sick pigs tend not to move as lying alone away from the herd [6]. However, it is almost impossible for pig farmers to monitor individual objects like pigs and visitors every hour, and it is not appropriate for them to passively observe the status of all pig pens [7].
A smart farming aims to scientifically prevent diseases and manage livestock by exploiting automatic monitoring systems with modern cutting-edge technologies. However, they still have some limitations not to be overcome. For instance, object tracking methods only using identification devices such as radio-frequency identification (RFID), global positioning system (GPS), Bluetooth, and WiFi are difficult to pinpoint exact conditions of livestock [8–10]. Some of these problems can be solved by converting camera images into meaningful data without human intervention for livestock detection and tracking [11]. As conventional computer vision solutions, there are polygon approximation algorithm [12], laplacian operator [13], and multilevel thresholding segmentation [14]. However, they are very complicated in preprocessing processes. Image classification using convolution neural networks (CNNs), one of artificial intelligence (AI) or deep learning models, can easily surpass conventional methods [15]. Many multi-object detection models as image classification have been proposed such as you only look once (YOLO) [16], single shot multi-box detector (SSD) [17], and faster region-based convolutional neural network (RCNN) [18,19]. Also, multi-object tracking methods have attracted a lot of attention in recent years [20–22]. Furthermore, effective alerting solutions are required for pig farmers to recognize disease risk factors based on the results of multi-object detection and tracking as soon as possible [23,24].
Therefore, this paper proposes a novel monitoring system using an Artificial Intelligence of Things (AIoT) technique combining artificial intelligence and Internet of Things (IoT) to automatically detect and track multiple pigs and alert their conditions in pig pens. The rest of this paper is organized as follows. Section 2 describes the proposed AIoT monitoring system including multi-pig detection, multi-pig tracking, and one-M2M-compliant IoT alerting methods in detail. Section 3 shows some experimental results to verify its performance and usefulness. Some concluding remarks are given in Section 4.
2 Description of a Proposed AIoT Monitoring System
The proposed AIoT monitoring system is illustrated in Fig. 1 that consists of AIoT edge devices and a central monitoring server. We developed an AIoT edge device with four functions: Video frame images extraction, multi-pig detection, multi-pig tracking, and IoT alerting client for automatically detecting and tracking multiple pigs from a CCTV camera installed in a pig pen and alerting their conditions to a pig farmer’s smartphone through a central monitoring server having an IoT alerting server and a social networking service (SNS) agent.
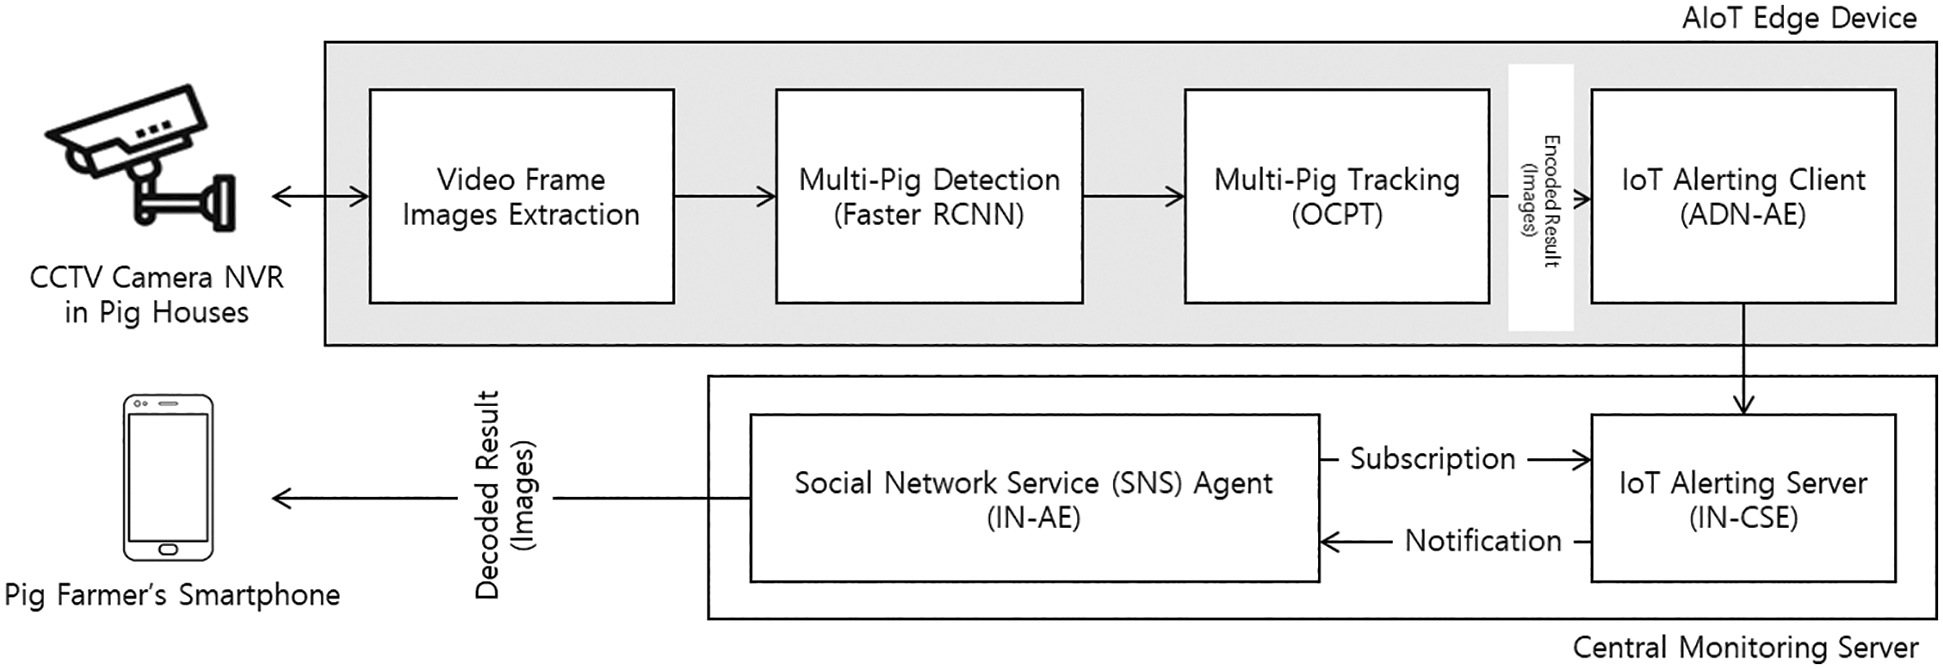
Figure 1: Block diagram of the proposed AIoT monitoring system
2.1 Video Frame Images Extraction
The procedure of the video frame images (VFI) extraction method with a network video recorder (NVR) client, implemented in a form of representational state transfer (REST) application programming interface (API), is shown in Fig. 2.
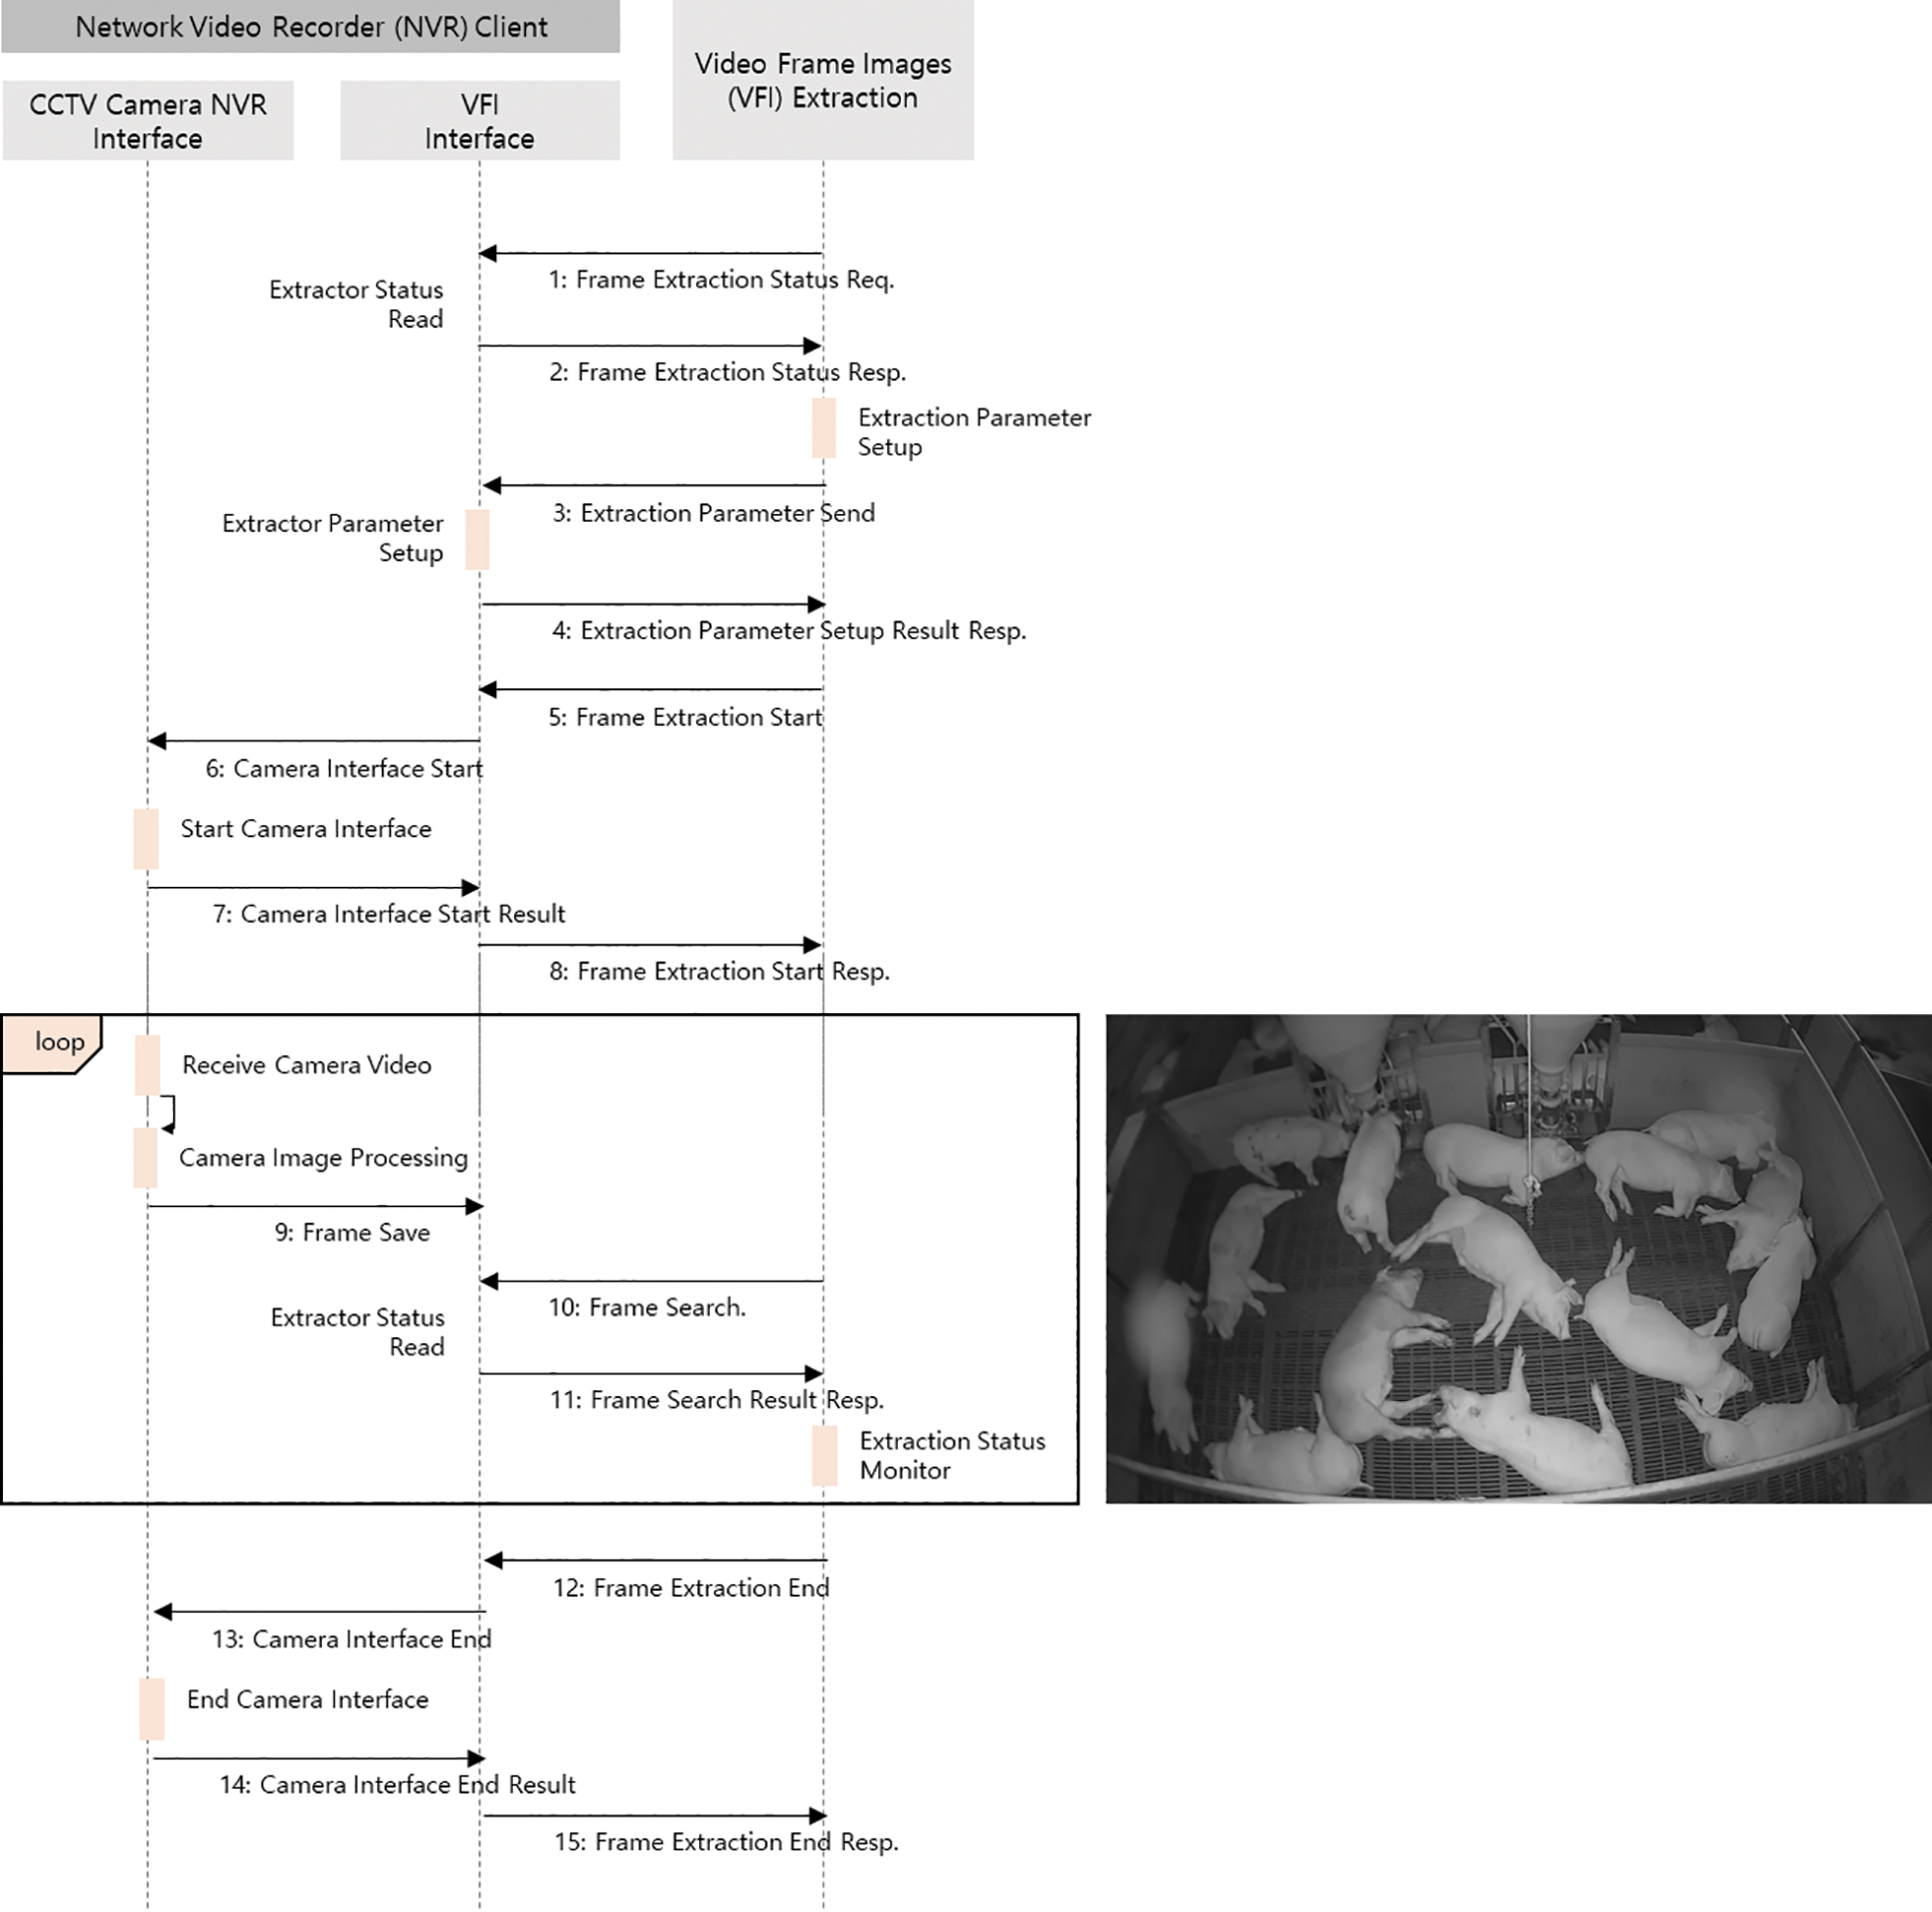
Figure 2: Procedure of the video frame images extraction method with a network video recorder client
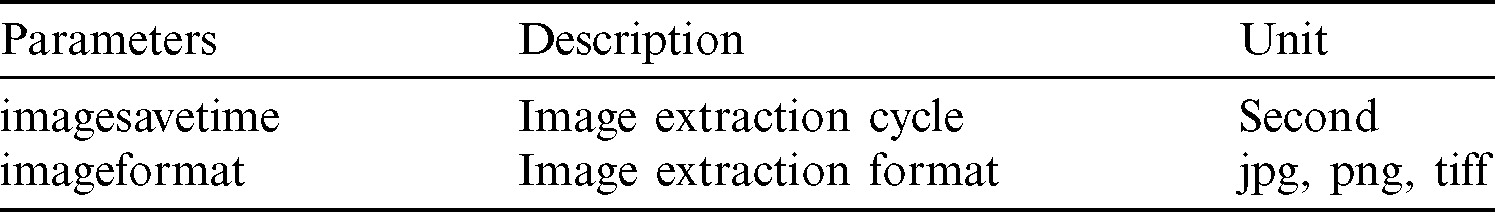
It collects the VFI according to the predefined setup parameters in Tabs. 1 and 2 and then provides them to next multi-pig detection and tracking methods. As shown in Tab. 1, the setup parameters such as checktime, nvrsavetime, ftpip, ftpid, ftppasswd, and camname for saving the VFI from a CCTV camera NVR server to an NVR Client supporting the file transfer protocol are described. In addition, the setup parameters such as imagesavetime and imageformat for extracting the VFI searching results from the VFI interface to the VFI extraction are described in Tab. 2. The whole steps of the VFI extraction method are as follows. The frame extraction status reading and the extraction parameter setup between the VFI interface and the VFI extraction is performed from Steps 1 to 4. From Steps 5 to 8, the VFI extraction requests the start of frame extraction and camera interface to the VFI interface and the CCTV camera NVR interface, respectively. During loop operation from Steps 9 to 11, we can extract the VFI searching images by receiving video files, processing their images, and searching them. Finally, we can finish the VFI extraction from Steps 12 to 15.
Table 1: Setup parameters for saving the video frame images
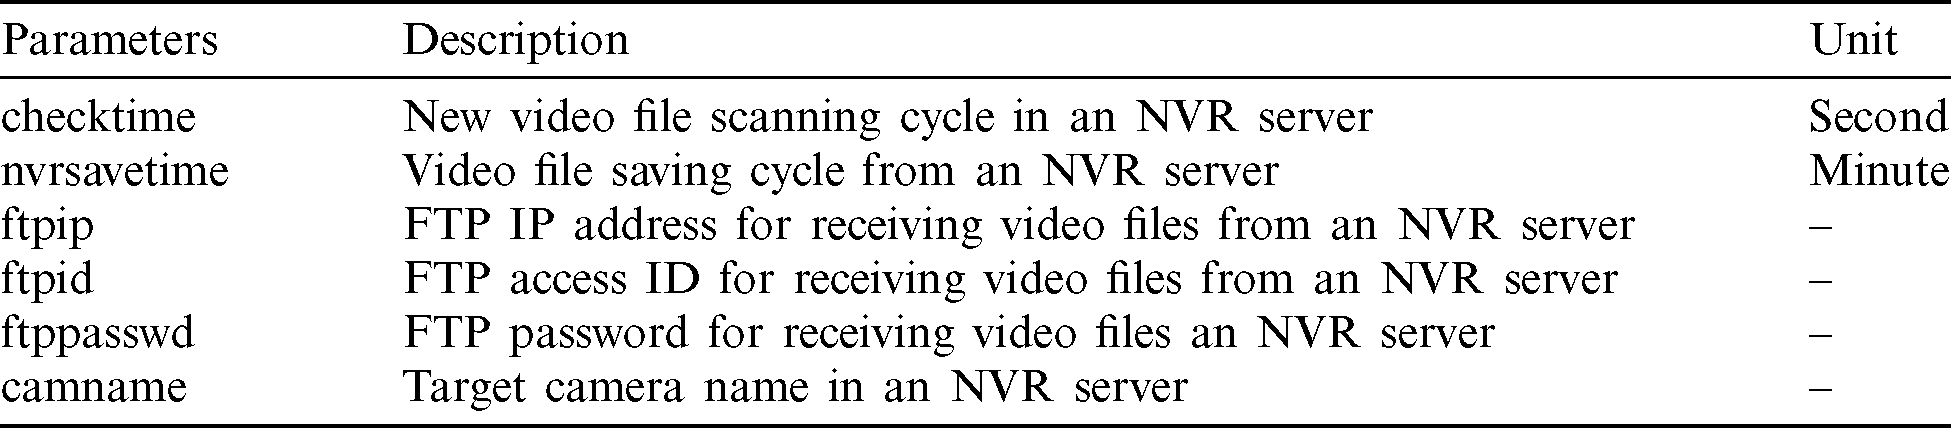
Table 2: Setup parameters for extracting the video frame images
2.2 Multi-Pig Detection with Faster RCNN
Usually, pigs suspected of having diseases tend to move less and go off away from the herd. So automated detection and tracking of behavioral changes in pigs is important to recognize disease risk factors quickly. Detection of multiple pigs is a preceding step to tracking of them [25]. For multi-pig detection, we build a faster RCNN model trained by using a dataset we made in Common Objects in Context (COCO) format [26] from the VFI searching images. To annotate the images, the annotation tool modified based on the Imglab was used. Although it is able to support all the annotations: bounding box, keypoint, and segmentation, we only consider the bounding box annotation. The faster RCNN model inherits the basic framework of the fast RCNN but calculates region of interest (ROI) by using a region proposal network (RPN) instead of the selective search [27]. It is the leading framework in various applications of object detection since it has very good advantages in effectiveness and efficiency. The ResNet50 architecture is applied as a backbone network or shared layer for feature extraction, which is a residual learning model to solve the problem of vanishing or exploding gradients that may occur as the neural network deepens. After receiving feature maps from the ResNet50, the RPN outputs a set of proposals, each of which has a score of its probability of being an object, called an objectness score, and also the class (or label) of the object. Then, these proposals are refined by a bounding box regression and a box classification (object or background) with sigmoid activation. Note that anchor boxes are responsible for providing a predefined set of bounding boxes of different sizes and ratios as reference when first predicting object locations for the RPN. The loss function of the RPN is defined by Eq. (1).

where i represents the index of anchor, pi represents the probability value predicting whether an object exists in anchor i, and  is the ground truth (GT) label where 1 is the object and 0 is the background. Also, ti represents the coordinates of the bounding box
 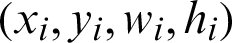 and
and  represents the coordinates of the GT box. For normalization, Ncls and Nreg are set to the mini-batch size and the number of anchor positions, respectively and
  is used as a balancing parameter to prevent the imbalance between Ncls and Nreg. Here Ncls and Nreg can be expressed by

where  is defined as

After passing through the RPN, different sized proposed regions will be output. In the ROI layer, different sized regions are set to the same size. Next, the fast RCNN object detection provides final bounding boxes and their object classes (or labels) through a bounding box regressor and an object classifier with softmax activation, following fully connected (FC) layers. The loss function of the fast RCNN is similar to the equation given in Eq. (1) but Lcls uses the categorical cross entropy given as

As an optimizer to minimize loss functions of the RPN and the fast RCNN, we used the RMSprop in [28].
2.3 Multi-Pig Tracking with an Object Center-Point Tracking Algorithm
As shown in Fig. 3, multi-pig tracking is performed by the proposed object center-point tracking algorithm (OCTA) based on the bounding boxes from the faster RCNN model.
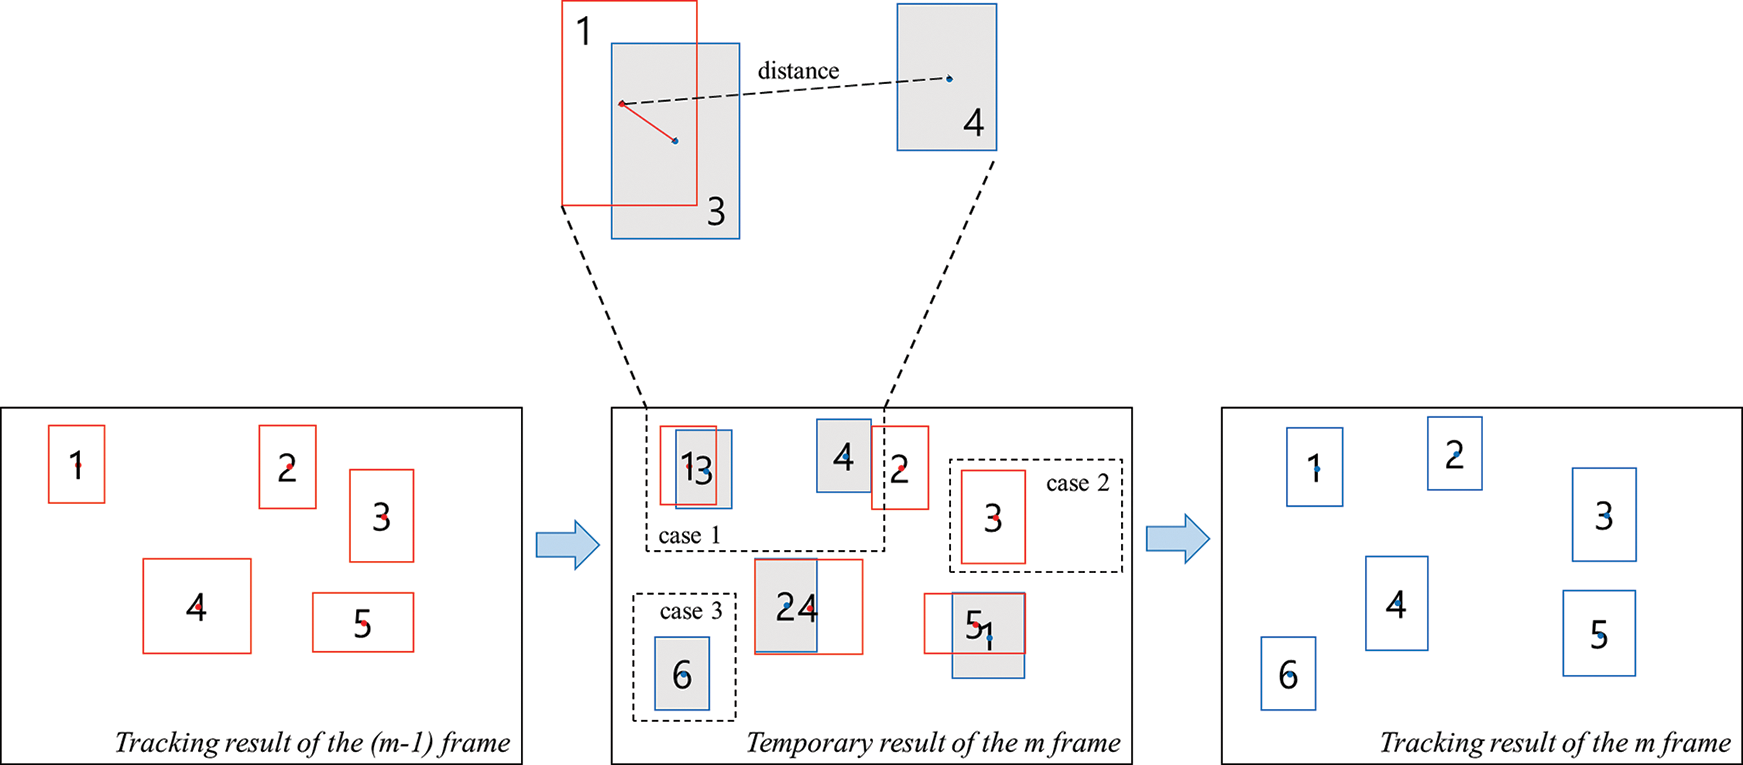
Figure 3: Conceptual explanation of the proposed object center-point tracking algorithm
First, the OCTA gets the number of center-points Nm −1 by counting bounding boxes of objects, namely pigs, detected in the m −1 image frame and then calculates their center-points  by coordinates of bounding boxes
  as shown in Eq. (6).

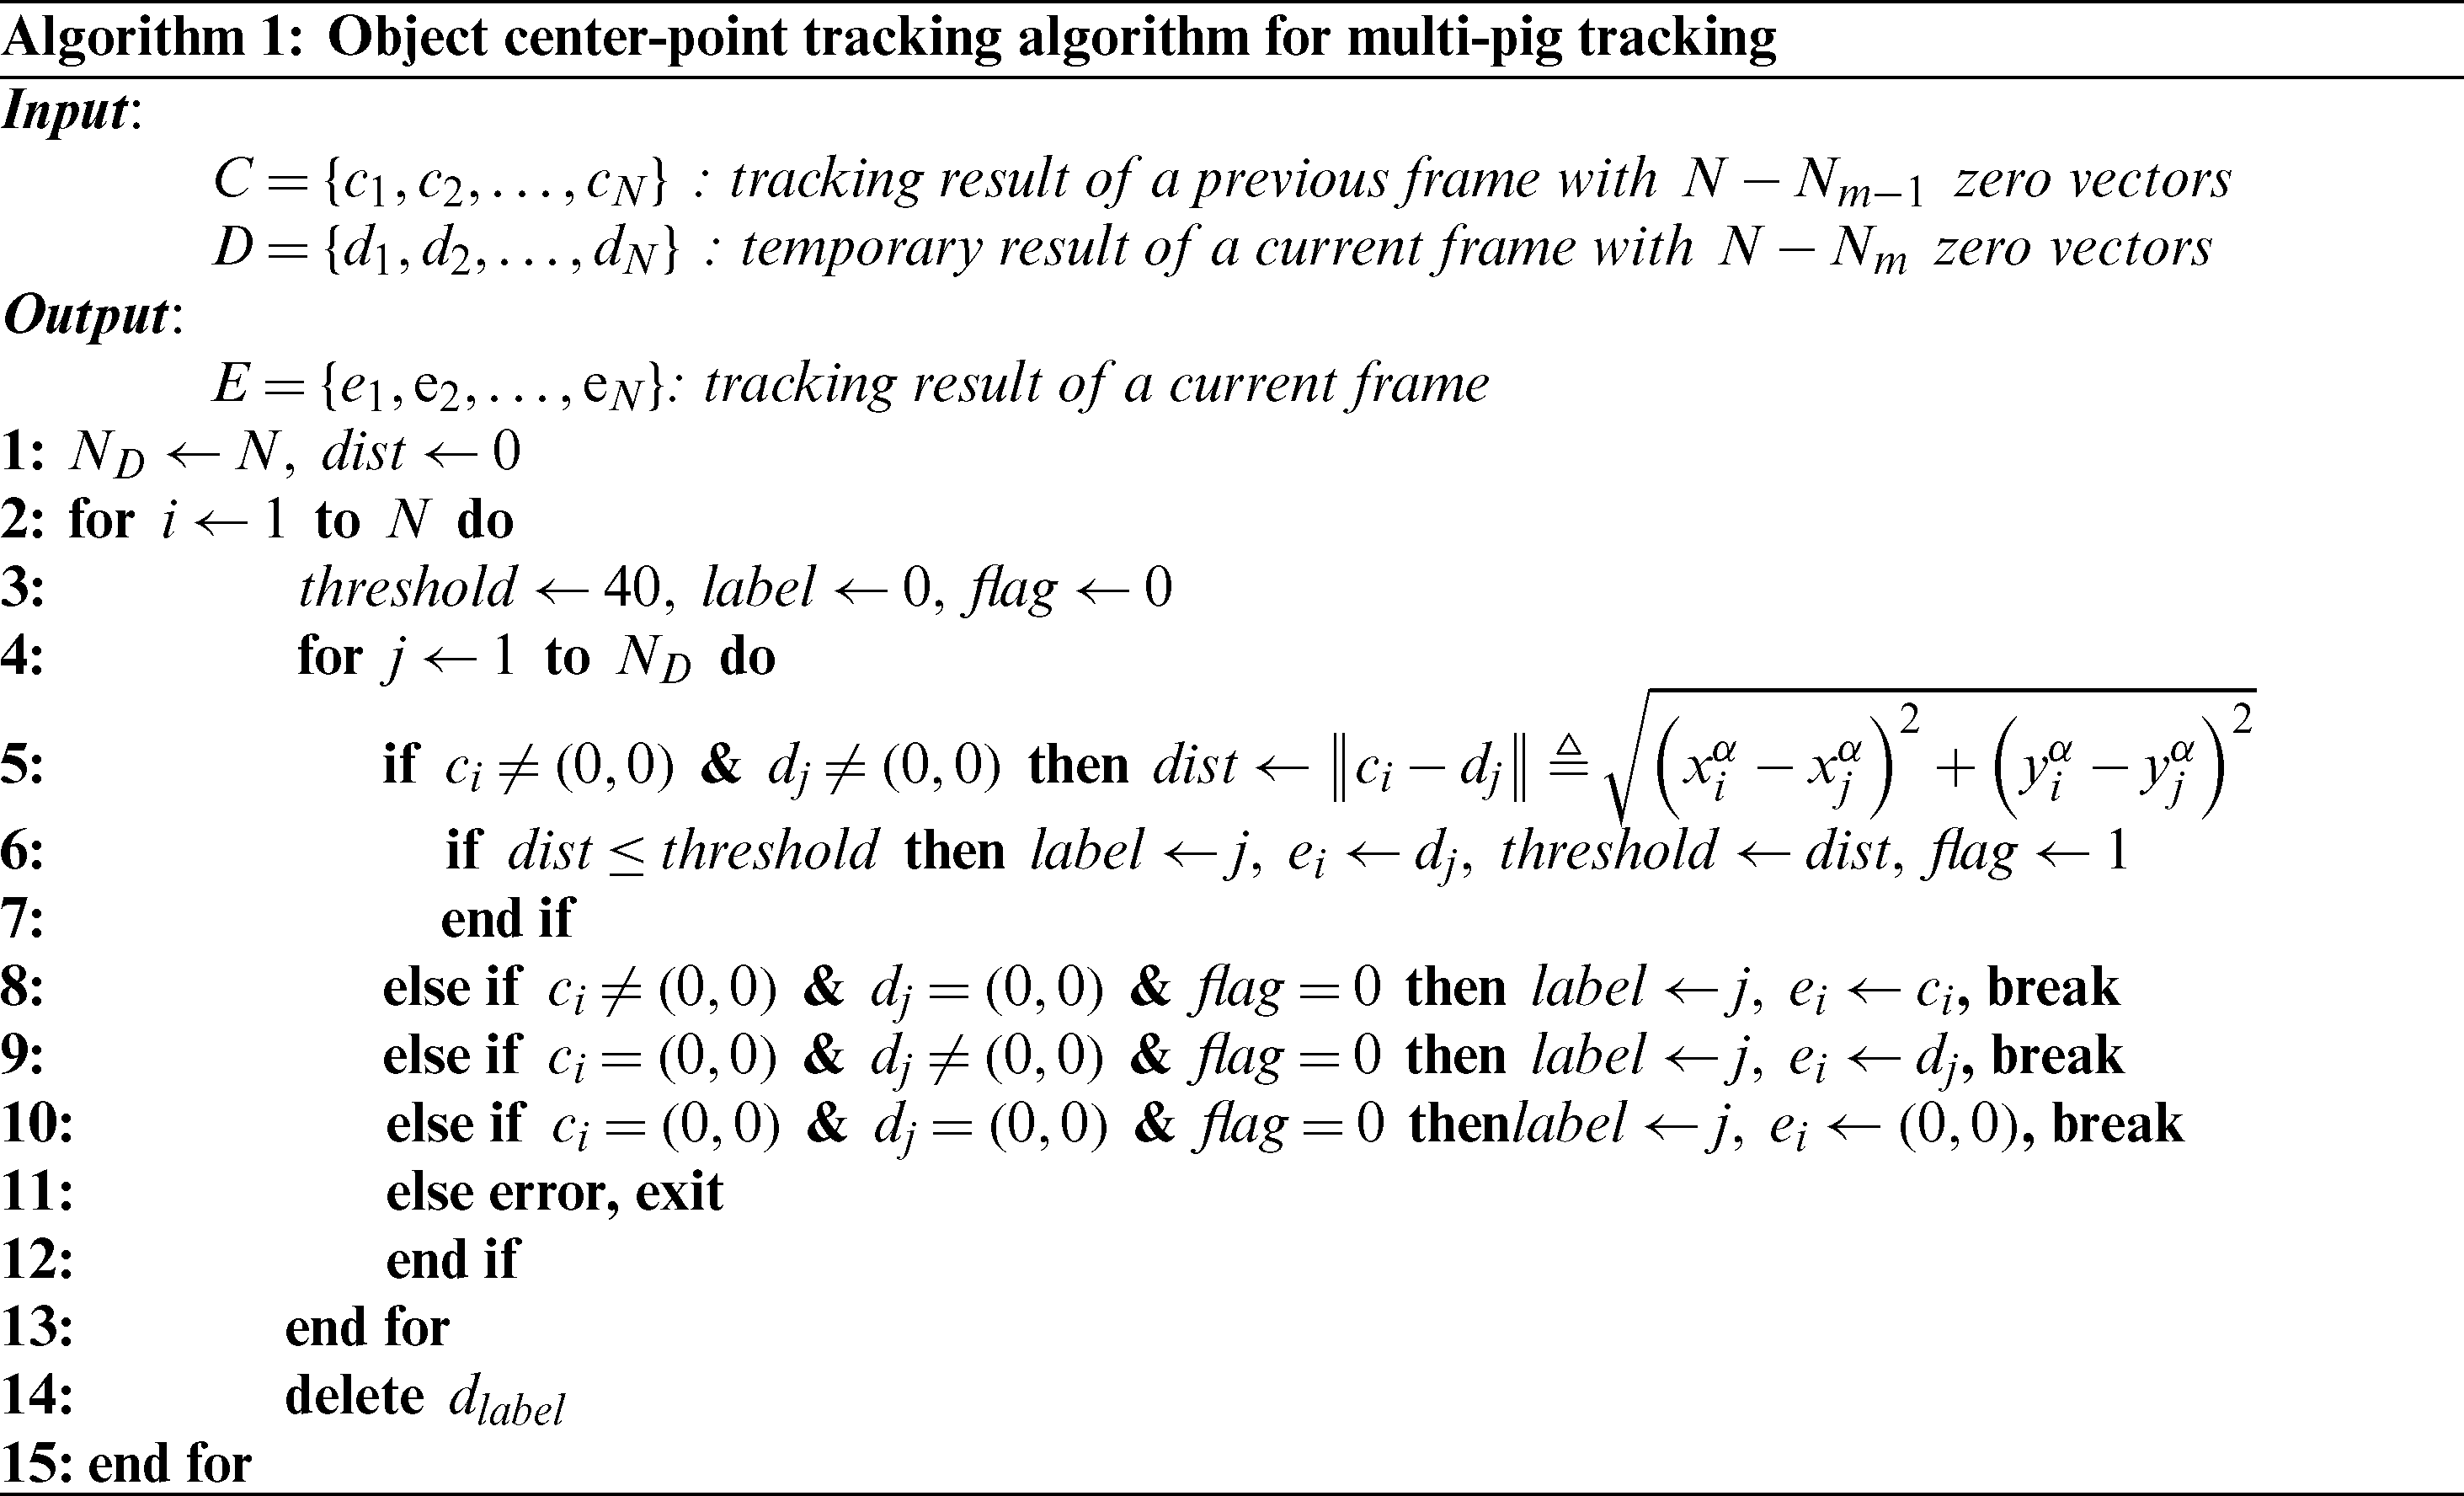
Next, in a similar way, it gets the number of center-points Nm in the m image frame and then calculates their temporary center-points,  . After that, each center-point is tracked according to Algorithm 1 mapping a previous center-point to a temporary center-point with minimum distance between them. Assuming that the number of center-points N is known without loss of generality, we append
  and
and 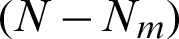 zero vectors
  to the tracking result of a previous frame and the temporary result of a current frame, respectively. Note that the size and its indices of the temporary result are automatically changed when
  in line number 14 was deleted. Consequently, ND is reduced such as
  1.
1.
We design the proposed algorithm considering three cases. In the “Case 1” in Fig. 3, it calculates Euclidean distance between ci and dj less than the threshold obtained from experimentation (Here, we use 40 as the threshold) and substitutes the threshold with the candidate distance in order to find the nearest distance. When the nearest was found, the corresponding center-point dj becomes an output center-point ei. In the “Case 2”, a center-point ci is assigned to an output center-point ei if it does not find any distance less than the given threshold. In the “Case 3” in Fig. 3 a center-point dj is assigned to an output center-point ei when there is no a center-point ci but a center-point dj. It is the case that new objects in a current frame are detected that did not exist in a previous frame.
2.4 oneM2M-Compliant IoT Alerting
The resulting images from multi-pig detection and tracking are encoded by Base64 to represent binary image data in an ASCII string format [29]. An IoT alerting client sends the Base64-encoded images to an IoT server. The IoT alerting client and server were modeled as an application dedicated node-application entity (ADN-AE) and an infrastructure node-common service entity (IN-CSE) described in oneM2M specifications, respectively [30]. Actually, they were implemented by using an open-source IoT platform called Mobius [31]. A social network service (SNS) agent modeled as an infrastructure node-application entity (IN-AE) requests a subscription message to the IoT server for receiving an alerting message including the Base64-encoded images from the IoT server when some notification criteria are satisfied. For instance, whenever the IoT server receives a content instance such as the images sent from the IoT client, it immediately notifies the alerting message to the SNS agent. Since the SNS agent was implemented by Telegram, users can visually monitor any situation in a pig pen with their smartphones.
3 Experimental Results and Discussion
This section describes experimental conditions and results to evaluate the performance of the proposed system. We collected 2182 images from an on-site CCTV camera in an actual indoor pig pen and created a COCO dataset augmented five times with vertical flips, horizontal flips and random rotations. In addition, we split the COCO dataset into 80% train and 20% evaluation sets and used a CentOS 7 workstation including one GTX 1060 GPU to build the faster RCNN model with hyper-parameters such as 100 epochs, 1,000 iterations, 32 number of ROIs per an iteration, etc. For the test performance of the OCTA, we used new one hundred consecutive frame images. Also, as its performance metric, we considered multiple object tracking accuracy (MOTA) shown in [32]. It can be defined as follows.

where ln denotes the number of objects in a frame index n, an denotes the number of miss errors, bn denotes the number of false positive errors, and dn denotes the number of mismatch errors.
Fig. 4 shows resulting images of the proposed OCTA during multi-pig detection and tracking in two consecutive frames. Most pigs were successfully detected and tracked by the faster RCNN model and the OCTA. However, a few pigs had not been detected by the faster RCNN model and they were not tracked by the OCTA.
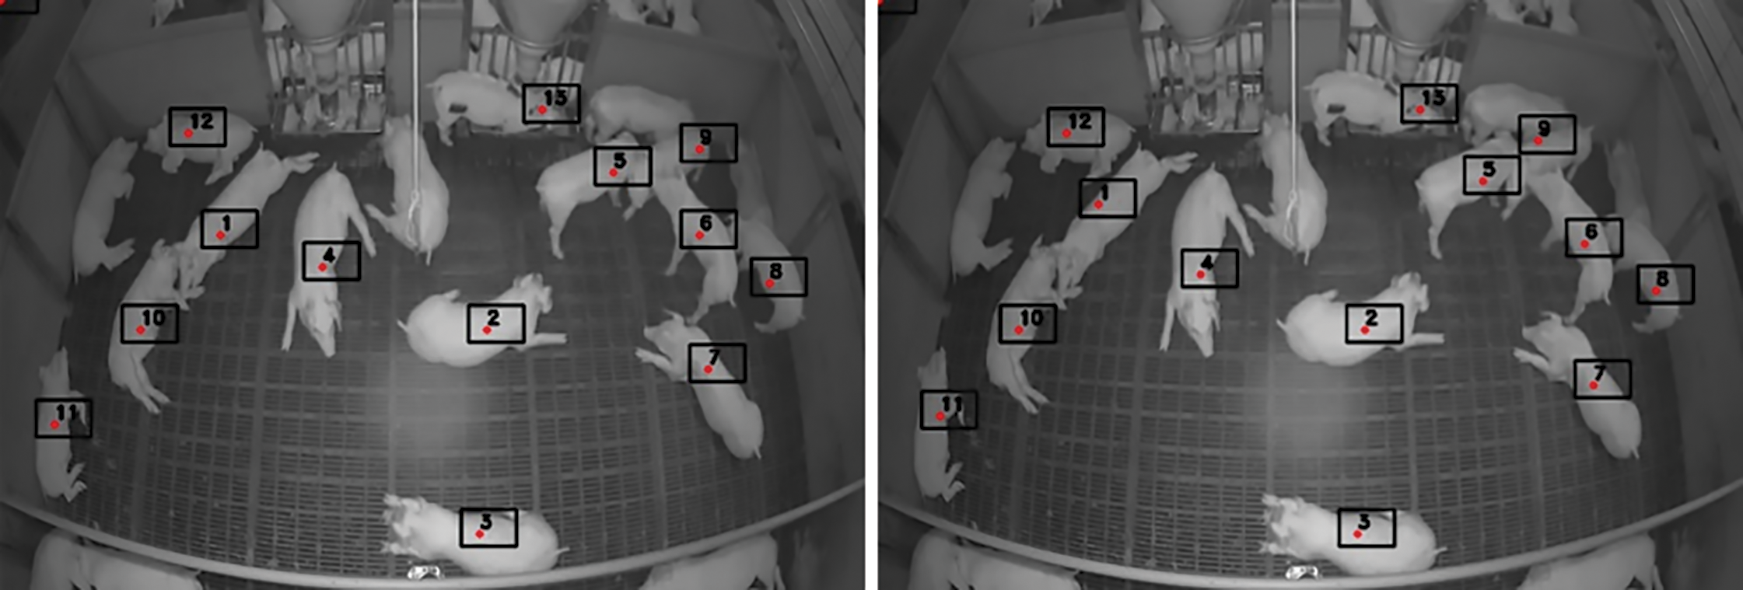
Figure 4: Resulting images of the proposed OCTA for multi-pig tracking in two consecutive frames: a round dot (center-point), a number in a box (object index)
In Fig. 5, cumulative error rates (CERs) of miss, false positive, mismatch, and total errors are shown according to indices of one hundred consecutive frame images. First, the number of miss errors does not increase significantly and its CER curve looks almost constant because the OCTA tracks most objects detected by the faster RCNN model even though it may sometimes miss a few objects in consecutive frame images. Second, the number of false positive errors gradually increases and its CER curve looks like a straight line. This phenomenon is due to the detection failure of the faster RCNN. Accordingly, the OCTA cannot track the undetected objects. Third, the number of mismatch errors occasionally increases and its CER curve looks like a staircase. Sudden occurrence of the mismatch errors can be caused when the OCTA mistakenly swaps two or more detected objects as they pass close to each other or when the OCTA reinitializes with different object indices. Finally, the number of total errors is a sum of miss, false positive and mismatch errors and its CER value in the last frame image is about 23%. Therefore, the MOTA performance of the proposed OCTA is about 77%.
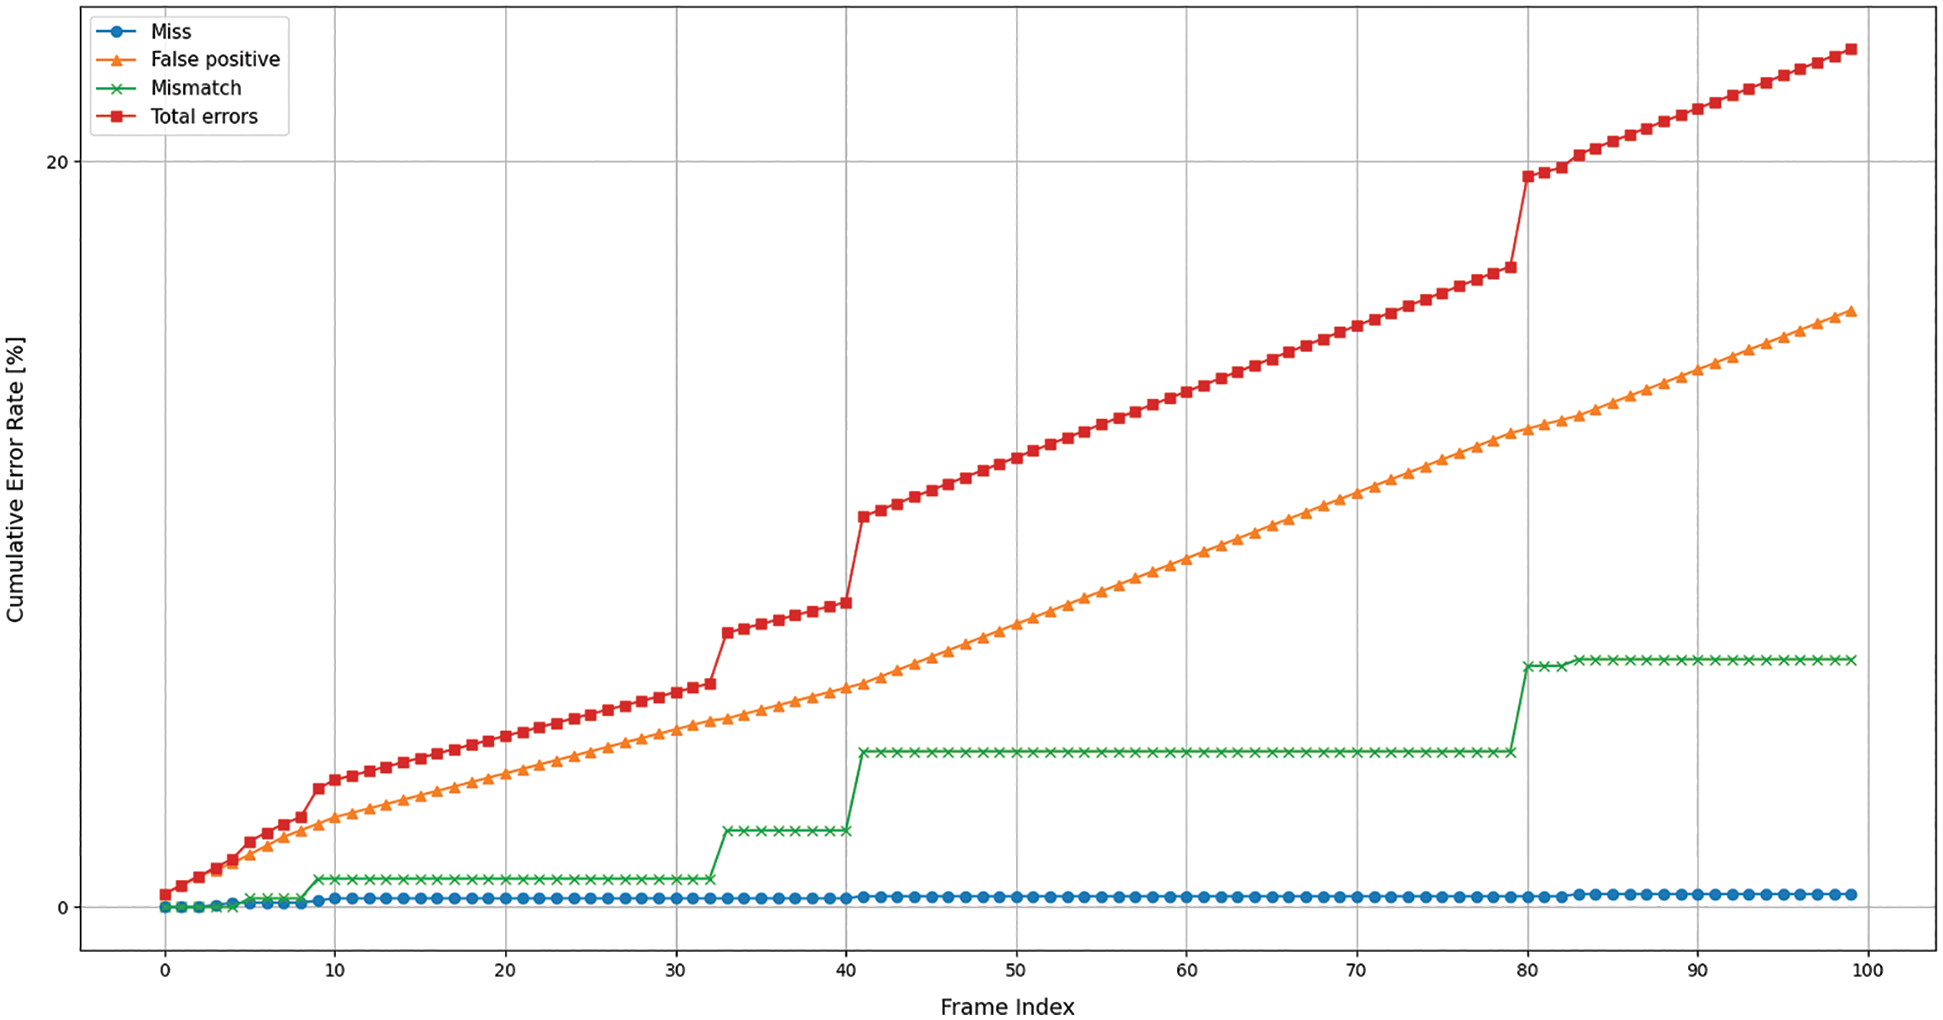
Figure 5: Cumulative error rates of miss, false positive, mismatch, and total errors according to indices of one hundred consecutive frame images
In Fig. 6, two images parsed from alerting messages are shown on a Telegram application in a smartphone. As mentioned before, alerting messages were sent from the IoT alerting server. A pig farmer can recognize any situations in a pig pen such as pig carcasses, abnormal behaviors, environmental conditions, etc. by monitoring output images from multi-pig detection and tracking.
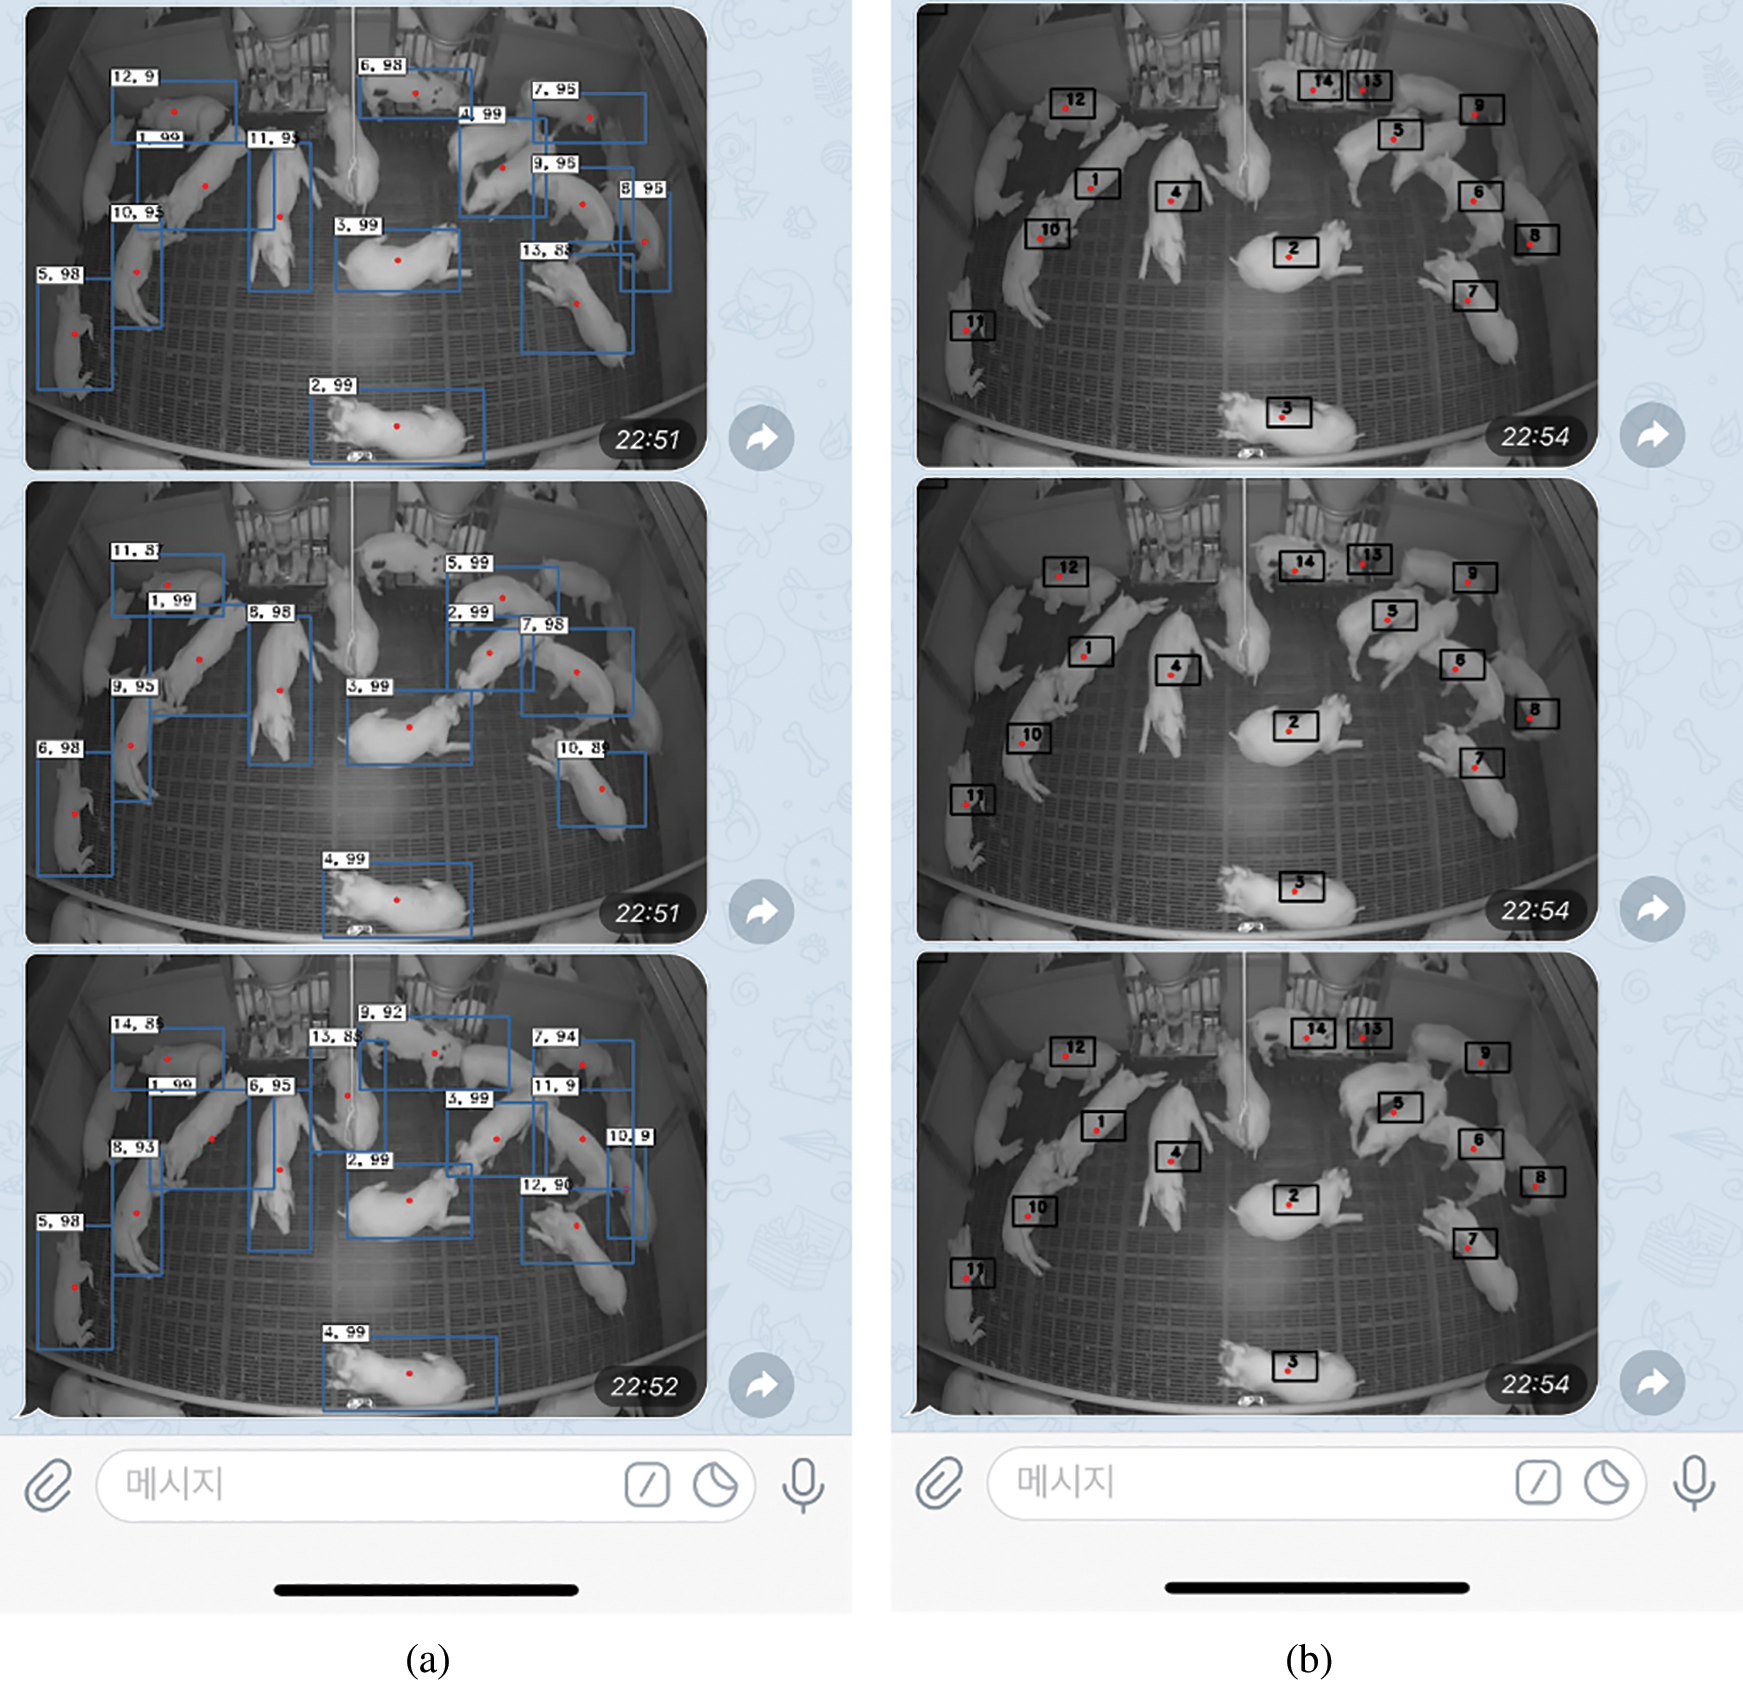
Figure 6: Alerting messages (images) on a Telegram application in a smartphone: (a) output image of the faster RCNN model, (b) output image of the OCTA
In this paper, we proposed the AIoT monitoring system to efficiently recognize any situations in a pig pen by using the faster RCNN multi-pig detection, the OCTA multi-pig tracking, and oneM2M-compiant IoT alerting methods. We built the faster RCNN model based on the frame images taken from an actual indoor pig pen and tracked the pigs in the frame images with the proposed OCTA that uses bounding box regression outputs of the faster RCNN model. For performance evaluation of the OCTA, we analyzed the CERs of its miss, false positive, mismatch, and total errors and found that false positive errors highly depend on performances of multi-object detection methods, miss errors can be reduced by multi-object tracking methods, occurrence of mismatch errors results from pig behaviors. As a result, the OCTA could achieve the MOTA performance of about 77%. Finally, through some experimental results of the oneM2M-compiant IoT alerting method, we confirmed overall operations of the proposed AIoT monitoring system.
Funding Statement: This work was supported by Institute of Information & communications Technology Planning & Evaluation (IITP) Grant funded by the Korea government (MSIT) (No. 2018-0-00387, Development of ICT based Intelligent Smart Welfare Housing System for the Prevention and Control of Livestock Disease).
Conflicts of Interest: The authors declare that they have no conflicts of interest to report regarding the present study.
References
1. H. K. Kim, S. J. Moon, J. D. Lee and S. O. Choi. (2012). “Cattle shed management system based on wireless sensor network with bio and environmental sensors,” The Journal of Korean Institute of Communications and Information Sciences, vol. 38, no. 7, pp. 573–586.
2. P. I. C. North America. (2014). “Standard animal care: Daily routines,” in Wean to Finish Manual. Hendersonville, TN, USA: PIC, pp. 23–24.
3. H. G. Kim, C. J. Yang and H. Yoe. (2012). “Design and implementation of livestock disease forecasting system,” The Journal of Korea Information and Communications Society, vol. 37C, no. 12, pp. 1263–1270.
4. J. G. Park and J. O. Kim. (2015). “Development of milk feeding robot system for individual management of calves,” The Journal of Korean Institute of Information Technology, vol. 13, no. 2, pp. 35–44.
5. H. S. Yoo. (2011). “Foot and mouth disease: Etiology, epidemiology and control measures,” Infection and Chemotherapy, vol. 43, no. 2, pp. 178–185.
6. Y. J. Kang and D. O. Choi. (2012). “Development a animal bio-information monitoring device,” Journal of the Korea Entertainment Industry Association, vol. 6, no. 2, pp. 101–106.
7. F. Tuyttens, S. De Graaf, J. Heerkens, L. Jacobs, E. Nalon et al. (2014). “Observer bias in animal behaviour research: Can we believe what we score, if we score what we believe?,” Animal Behaviour, vol. 90, pp. 273–280.
8. J. Schleppe, G. Lachapelle, C. Booker and T. Pittman. (2010). “Challenges in the design of a gnss ear tag for feedlot cattle,” Computers and Electronics in Agriculture, vol. 70, no. 1, pp. 84–95.
9. P. Ahrendt, T. Gregersen and H. Karstoft. (2011). “Development of a real-time computer vision system for tracking loose-housed pigs,” Computers and Electronics in Agriculture, vol. 76, no. 2, pp. 169–174.
10. S. Neethirajan. (2017). “Recent advances in wearable sensors for animal health management,” Sensing and Bio-Sensing Research, vol. 12, pp. 15–29. [Google Scholar]
11. E. Psota, M. Mittek, L. Perez, T. Schmidt and B. Mote. (2019). “Multi-pig part detection and association with a fully-convolutional network,” Sensors, vol. 19, no. 4, pp. 852. [Google Scholar]
12. X. Bai, C. Sun and F. Zhou. (2009). “Splitting touching cells based on concave points and ellipse fitting,” Pattern Recognition, vol. 42, no. 11, pp. 2434–2446. [Google Scholar]
13. H. Xu and Y. Xiao. (2018). “A novel edge detection method based on the regularized laplacian operation,” Symmetry, vol. 10, pp. 697. [Google Scholar]
14. Y. Z. Guo, W. X. Zhu, P. P. Jiao, C. H. Ma and J. J. Yang. (2015). “Multi-object extraction from topview group-housed pig images based on adaptive partitioning and multilevel thresholding segmentation,” Biosystems Engineering, vol. 135, pp. 54–60. [Google Scholar]
15. R. Mu and X. Zeng. (2019). “A review of deep learning research,” KSII Transactions on Internet and Information Systems, vol. 13, no. 4, pp. 1738–1764. [Google Scholar]
16. J. Redmon, S. Divvala, R. Girshick and A. Farhadi. (2016). “You only look once: Unified, real-time object detection,” in Proc. CVPR, Las Vegas, LV, USA, pp. 779–788. [Google Scholar]
17. W. Liu, D. Anguelov, D. Erhan, C. Szegedy, S. Reed et al. (2016). “Ssd: Single shot multibox detector,” in Proc. ECCV, Amsterdam, The Netherlands, pp. 21–37. [Google Scholar]
18. S. Ren, K. He, R. Girshick and J. Sun. (2015). “Faster R-CNN: Towards real-time object detection with region proposal networks,” in Advances in Neural Information Processing Systems, Montréal, Canada, pp. 91–99. [Google Scholar]
19. Z. Zhang and B. Y. Kang. (2020). “Ensemble of convolution neural networks for driver smartphone usage detection using multiple cameras,” The Journal of Information and Communication Convergence Engineering, vol. 18, no. 2, pp. 75–81. [Google Scholar]
20. M. Danelljan, G. Bhat, F. S. Khan and M. Felsberg. (2017). “ECO: Efficient convolution operators for ctacking,” in Proc. CVPR, Honolulu, Hawaii, USA, pp. 6638–6646. [Google Scholar]
21. L. Zhang, H. Gray, X. Ye, L. Collins and N. M. Allinson. (2019). “Automatic individual pig detection and tracking in surveillance videos,” Sensors, vol. 19, no. 5, pp. 1188. [Google Scholar]
22. Y. Huang, C. Ju, X. Hu and W. Ci. (2019). “An anti-occlusion and scale adaptive kernel correlation filter for visual object tracking,” KSII Transactions on Internet and Information Systems, vol. 13, no. 4, pp. 2094–2112. [Google Scholar]
23. R. D. Kosmider, L. Kelly, R. L. Simons, A. Brouwer and G. David. (2011). “Detecting new and emerging diseases on livestock farms using an early detection system,” Epidemiology and Infection, vol. 139, no. 10, pp. 1476–1485. [Google Scholar]
24. S. Sivamani, H. Kim, M. Lee, C. Shin, J. Park et al. (2015). “An android-based feed behavior monitoring system for early disease detection in livestock,” in D. S. Park, H. C. Chao, Y. S. Jeong and J. Park, Computer Science and Ubiquitous Computing, Singapore: Springer, pp. 79–84. [Google Scholar]
25. H. S. Parekh, D. Thakore and U. K. Jaliya. (2014). “A survey on object detection and tracking methods,” International Journal of Innovative Research in Computer and Coummunication Engineering, vol. 2, no. 2, pp. 2970–2978. [Google Scholar]
26. T. Y. Lin, M. Maire, S. Belongie, J. Hays, P. Perona et al. (2014). “Microsoft coco: Common objects in context,” in Proc. ECCV, Zurich, Switzerland, pp. 740–755. [Google Scholar]
27. K. He, X. Zhang, S. Ren and J. Sun. (2016). “Deep residual learning for image recognition,” in Proc. CVPR, Las Vegas, NV, USA, pp. 770–778. [Google Scholar]
28. S. Ruder. (2016). “An overview of gradient descent optimization algorithms,” CoRR, pp. 1–14. [Google Scholar]
29. C. C. Wei, P. Y. Su and S. T. Chen. (2020). “Comparison of the LoRa image transmission efficiency based on different encoding methods,” International Journal of Information and Electronics Engineering, vol. 10, no. 1, pp. 1–4. [Google Scholar]
30. Service Layer Core Protocol Specification, TS-0004-v2.27.0, oneM2M. [Google Scholar]
31. Installation Guide Mobius Release 2, OCEAN. [Google Scholar]
32. K. Bernardin and R. Stiefelhagen. (2008). “Evaluating multiple object tracking performance: The clear mot metrics,” EURASIP Journal on Image and Video Processing, vol. 2008, pp. 1–10. [Google Scholar]
 | This work is licensed under a Creative Commons Attribution 4.0 International License, which permits unrestricted use, distribution, and reproduction in any medium, provided the original work is properly cited. |