DOI:10.32604/cmc.2021.014553
| Computers, Materials & Continua DOI:10.32604/cmc.2021.014553 | |
| Article |
Modeling COVID-19 Pandemic Dynamics in Two Asian Countries
1School of Finance, Shanghai Lixin University of Accounting and Finance, Shanghai, China
2Department of Statistics, Yazd University, Yazd, Iran
3Department of Mathematics, College of Science and Humanities in Al-Kharj, Prince Sattam bin Abdulaziz University, Al-Kharj, 11942, Saudi Arabia
4Department of Mathematics, Faculty of Science, Mansoura University, Mansoura, 35516, Egypt
5Department of Statistics, Mathematics and Insurance, Benha University, Benha, 13511, Egypt
*Corresponding Author: Zubair Ahmad. Email: z.ferry21@gmail.com
Received: 28 September 2020; Accepted: 05 November 2020
Abstract: The current epidemic outbreak COVID-19 first took place in the Wuhan city of China and then spread worldwide. This deadly disease affected millions of people and compelled the governments and other concerned institutions to take serious actions. Around 0.28 million people have died from the COVID-19 outbreak as of May 11, 2020, 05:41 GMT, and the number is still increasing exponentially. The results of any scientific investigation of this phenomenon are still to come. However, now it is urgently needed to evaluate and compare the disease dynamics to improve the quarantine activities and the level of individual protection, to at least speed up the rate of isolation of infected persons. In the domain of big data science and other related areas, it is always of interest to provide the best description of the data under consideration. Therefore, in this article, we compare the COVID-19 pandemic dynamics between two neighboring Asian countries, Iran and Pakistan, to provide a framework to arrange the appropriate quarantine activities. Simple tools for comparing this deadly pandemic dynamic have been presented that can be adopted to produce the bases for inferences. Most importantly, a new statistical model is developed to provide the best description of COVID-19 daily deaths data in Iran and Pakistan.
Keywords: COVID-19 pandemic dynamics; Pakistan; mathematical modeling; statistical methods; Monte Carlo simulation
The first COVID-19 case was detected in Wuhan city of China, which has a well-known seafood wholesale market. On December 31, 2019, the Wuhan Municipal Health Commission reported a bunch of 27 pneumonia cases of unknown etiology. Initial reports tell us that the people associated with the wholesale business were first infected by zoonotic transmission (transmission of disease from animal to humans) of SARS and MERS. This infection continued on a large scale and covered the whole city. More information about this pandemic can be explored at: https://en.wikipedia.org/wiki/Coronavirus_disease_2019. The comparison of the COVID-19 epidemic dynamics among different countries is of great concern. In this regard, the researchers are producing their best efforts to provide a guideline that can help in controlling this global pandemic. Some previous efforts to compare the epidemic dynamics in Italy and mainland China were introduced; see for detail [1,2]. A comparison of the epidemic dynamics in Ukraine and neighboring countries is provided in [3]. Comparisons of the COVID-19 in Europe, USA, and South Korea have been carried out in [4]. For more detail, we refer the interested readers to [5–12].
In the current situation, it is of great interest to study more about COVID-19 and compare different countries as many as possible. Therefore, in this article, an effort has been made to compare the COVID-19 pandemic outbreak in the two neighboring countries of the Asian region Iran and Pakistan.
This article is structured as follows: Comparing COVID-19 events between Iran and Pakistan is provided in Section 2. The proposed method is discussed in Section 3. A special case of the proposed method is introduced in Section 4. Some properties of the proposed method are discussed in Section 5. Section 6 presents the estimation of the model parameters. Section 7 is devoted to modeling COVID-19 events. Finally, the article is concluded in the last section.
2 Comparison of the COVID-19 Events between Iran and Pakistan
In this section, a very simple and easy method to compare the pandemic dynamics in Iran and Pakistan is presented. The comparison is made by considering the COVID-19 events such as the total number of cases, total recovered, total deaths, and total active cases. The comparison of the COVID-19 daily cases and daily deaths in Iran and Pakistan are presented in Fig. 1. From Fig. 1, one can easily observe that the numbers of daily cases and daily deaths for Iran and Pakistan are increasing over time. Furthermore, a detailed description of the total number of cases, total recovered, total deaths, and total active cases from the COVID-19 epidemic pandemic are presented in Fig. 2. The percentage of the total COVID-19 epidemic pandemic events for Iran and Pakistan are displayed in Fig. 3.

Figure 1: Plots for the COVID-19 daily cases and daily deaths in Iran and Pakistan

Figure 2: Plots for the COVID-19 total deaths (TD), the total number of cases (TC), total recovered (TR), and total active cases (TAC) in Iran and Pakistan

Figure 3: The percentage of the total COVID-19 epidemic pandemic events for Iran and Pakistan
The newly infected and newly recovered cases and the outcome cases (recovery or deaths) in Iran and Pakistan are displayed in Figs. 4 and 5, respectively.
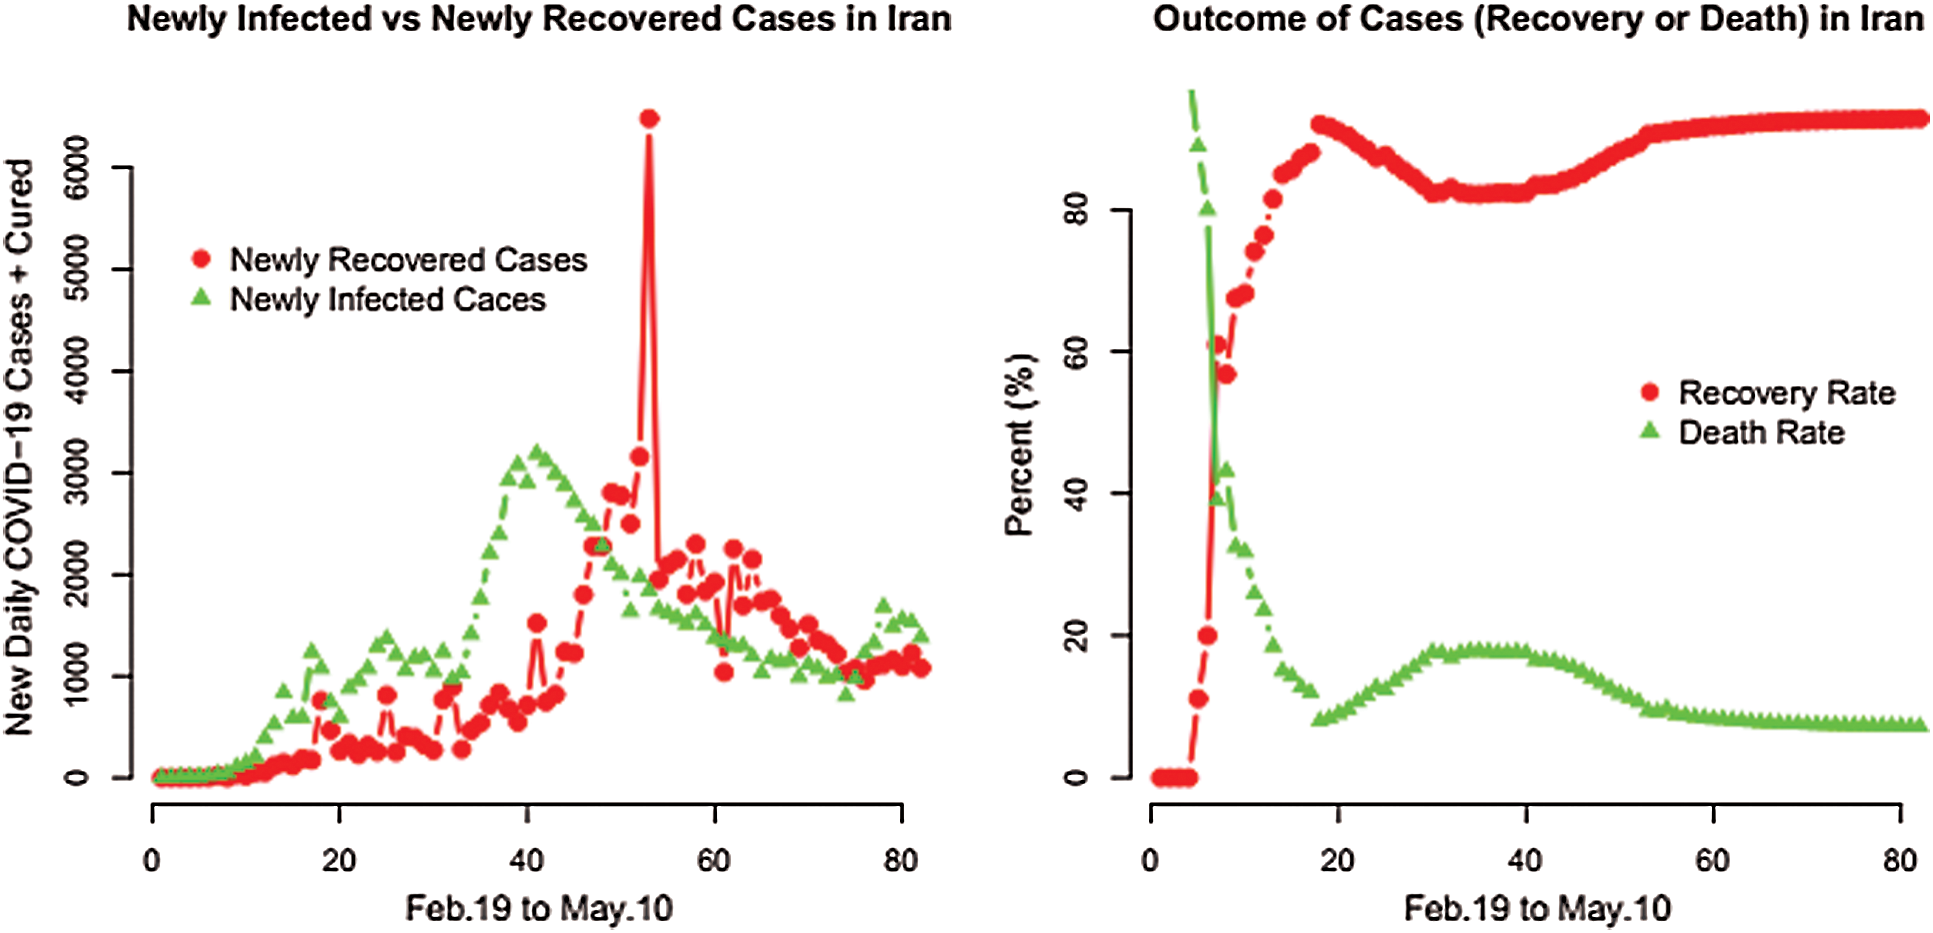
Figure 4: Plots for the COVID-19 newly infected and newly recovered cases along with the outcome cases in Iran

Figure 5: Plots for the COVID-19 newly infected and newly recovered cases along with the outcome cases in Pakistan
3 Development of the Proposed Family
In this section, we propose a new family of statistical models to provide the best description of the COVID-19 daily deaths data. The authors in [13] defined the T–X family method to introduce new families of distributions. Let  be the probability density function (pdf) of a random variable, say T, where
  and let
  be a function in
  of a random variable, say X, satisfying the conditions given below:
1. 
2.  is differentiable and monotonically increasing, and
3.  as
as  and
and  as
as  .
.
The cumulative distribution function (cdf) of the T–X family has the form

where  satisfies the conditions stated above. The probability density function (pdf) corresponding to Eq. (1) is

For the contributed work based on the T–X approach, we refer to [14–19]. Taking inspiration from Eq. (1), we introduce a new class of statistical models suitable for modelling the COVID-19 daily deaths data. Henceforth, we call the proposed method as the new alpha power-X (NAP-X) family of statistical models. Let  then its cdf is given by

The pdf corresponding to Eq. (2) reduces to

If  follows Eq. (3) and setting

in Eq. (1), we obtain the cdf of the NAP-X family as

The pdf corresponding to Eq. (4) is given by

Hereafter, a random variable X has the pdf given by Eq. (5) will be denoted by NAP-X  .
.
4 A New Alpha Power-Weibull: A Special Sub-Model
In this section, we define a special sub-model of the NAP-X family, called the new alpha power-Weibull (NAP-W) distribution. Let  be the cdf of the Weibull distribution given by
  0 where
  . Then, the cdf of the NAP-W distribution is specified by

The pdf corresponding to Eq. (6) reduces to

Some possible shapes for the pdf of the NAP-W distribution for selected values of the model parameters are sketched in Figs. 6 and 7.
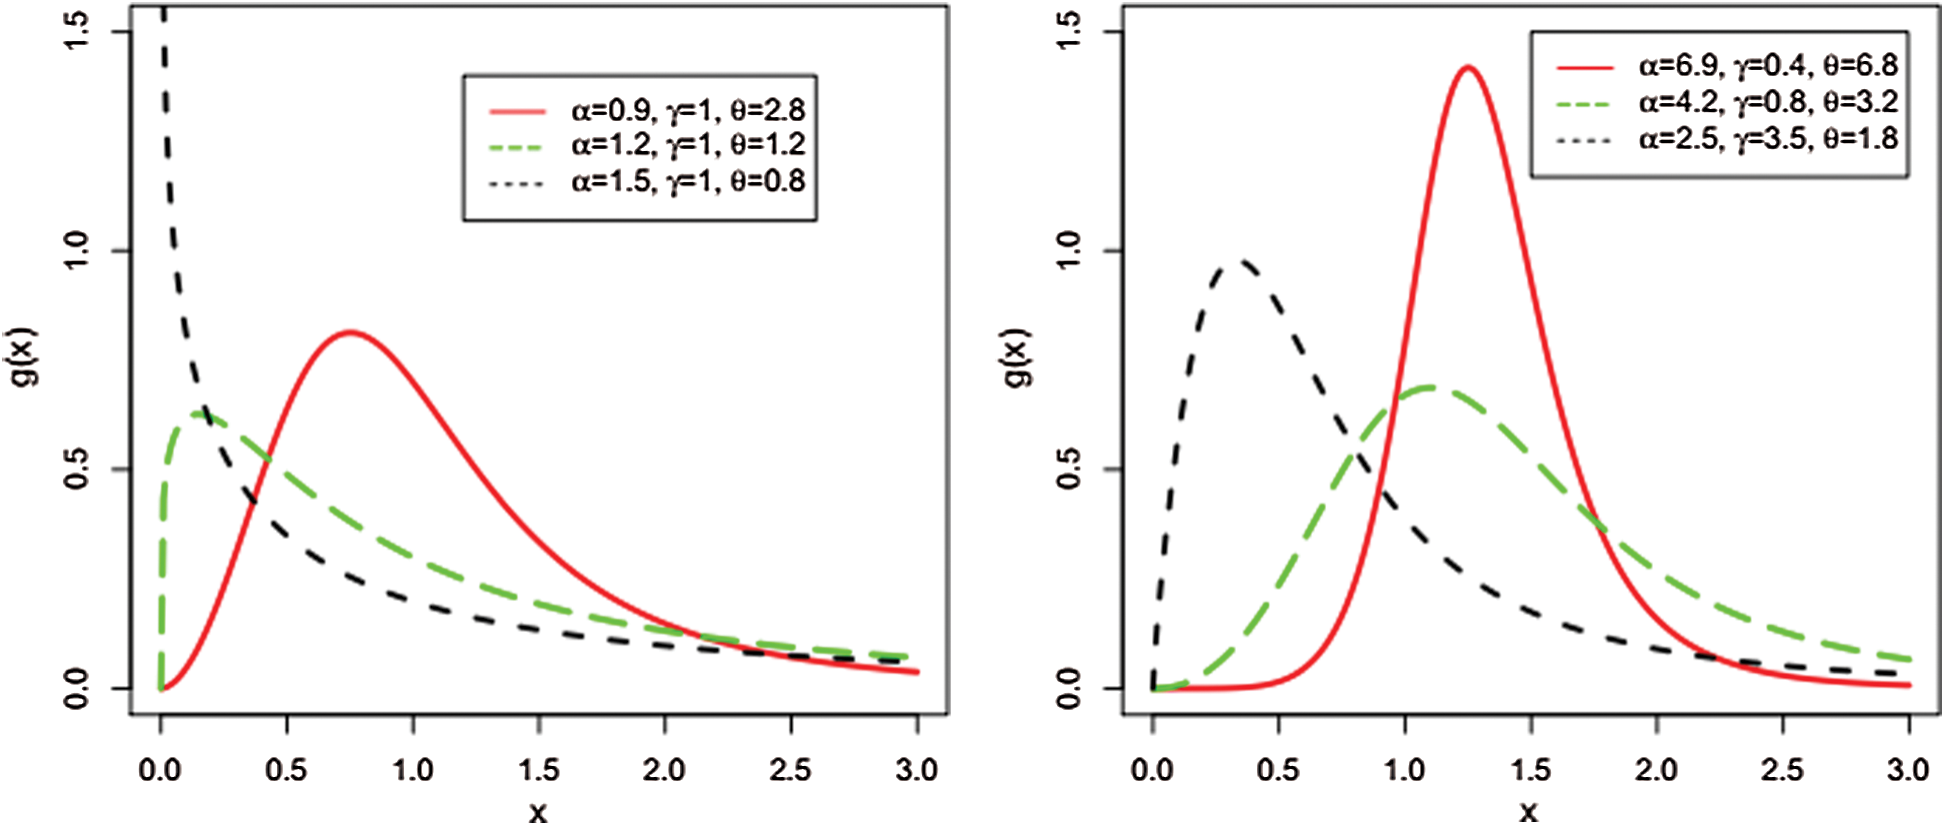
Figure 6: Different plots for the pdf of the NAP-Weibull distribution

Figure 7: Different plots for the pdf of the NAP-W distribution
5 Maximum Likelihood Estimation and Monte Carlo Simulation Study
In this section, we use the maximum likelihood method to estimate the NAP-W parameters and provide a Monte Carlo simulation study to assess the behavior of these estimators.
5.1 Maximum Likelihood Estimation
In this sub-section, we obtain the maximum likelihood estimators (MLEs) of the parameters of the NAP-W distribution from complete samples. Let  be an observed sample of size n obtained from Eq. (7). The corresponding log-likelihood function can be expressed as

The partial derivatives of the log-likelihood function for the parameters  are given, respectively, by

and

Solving  and
and  simultaneously yields the MlEs
  of
of  .
.
5.2 Monte Carlo Simulation Study
In this sub-section, we perform a Monte Carlo (MC) simulation study to explore and assess the behavior of the MLEs of the NAP-W model via the optim() R-function with the argument  It is used for maximizing the log-likelihood function of a probabilistic model. We consider 750 MC-replicates under different sample sizes
  750. For each sample size, we compute the average MLEs, mean square errors (MSE), biases, and absolute biases. The results obtained after performing the MC simulation are provided in Figs. 8 and 9.

Figure 8: Plots of MLEs, MSEs, biases, and absolute biases of the NAP-W model for  ,
,  and
and 

Figure 9: Plots of MLEs, MSEs, biases, and absolute biases of the NAP-W model for  ,
,  and
and 
6 Modeling COVID-19 Daily Deaths Data for Iran and Pakistan
As we stated above that comprehensive statistical analyses for events related to COVID-19 pandemic are still to come. Now, it is urgently needed to introduce a suitable model to provide a better description of COVID-19 daily deaths data to get a reliable estimate of the required number of places in hospitals, level of individual protection, and rate of isolation of infected persons, among others.
In this section, we model COVID-19 daily deaths that have been occurred in Iran and Pakistan. The NAP-W distribution is adopted to model the daily deaths data in Iran and Pakistan. Since, the daily deaths data which are analyzed in this paper is discrete by nature. Therefore, before analyzing, we have to transform the discrete data to be continuous. The data were collected in a raw form; therefore, they can be transformed into any type of data. Some available techniques can be adopted to transform discrete data into continuous such as re-sampling and continuity correction factor and as.numeric(), among others. In this paper, the continuity correction factor is adopted to transform the data into continuous form. We found that the proposed NAP-Weibull model can be applied quite effectively to provide the best description of the COVID-19 daily deaths data of the two neighbors countries.
It is well known that selecting the appropriate approximation model is desirable to assign some preference to the alternatives. Note that the distributional parameters of a parametric model play an important role in determining the adequacy of the overall fit. For COVID-19 daily deaths data of Iran, the values of the model parameters are  ,
,  and
and  . For the daily deaths data in Pakistan due to COVID-19, the values of the model parameters are
  ,
,  and
and  .
.
Thus, after computing the values of the model parameters, now we can show how the proposed model provides the best description of COVID-19 daily deaths data. For such purpose, we considered the graphical sketching of the estimated cdf, Kaplan-Meier (KM) survival function, and the probability-probability (PP) plot. The fitted cdf and KM survival plots of the NAP-W model for COVID-19 daily deaths data in Iran are presented in Fig. 10. Further, the fitted cdf and KM survival plots of the NAP-W distribution for COVID-19 daily deaths data in Pakistan are provided in Fig. 11. The PP plots for the COVID-19 daily deaths data in Iran and Pakistan are displayed in Fig. 12. The black lines in Figs. 10 and 11 shows the real behaviors of COVID-19 daily deaths data in Iran and Pakistan, whereas the green and red line show the performance of the proposed NAP-W model.

Figure 10: The estimated cdf and KM survival plots of the NAP-W model for COVID-19 daily deaths data in Iran

Figure 11: The estimated cdf and KM survival plots of the NAP-W model for COVID-19 daily deaths data in Pakistan

Figure 12: The PP plots for COVID-19 daily deaths data in Iran and Pakistan
Figs. 10–12 illustrate that the proposed NAP-W model fits COVID-19 total death data in Iran and Pakistan very closely, leading to the conclusion that the proposed model performs well. Speaking compactly, the Monte Carlo simulation study and the real data examples reveal that the NAP-W model can be a very useful candidate for analyzing COVID-19 data with ranging characteristics.
The COVID-19 pandemic is becoming one of the deadliest viruses, greatly affecting daily life affairs. The situation with the coronavirus pandemic in the Asian region, particularly in Iran and Pakistan, is very threatening. Henceforth, Iran and Pakistan are in urgent need of assistance in speeding up the isolation of infected and contact persons to prevent the new daily infections. The government and other responsible organizations might be interested in providing bases for comparison and providing a better description of the data under consideration to get reliable estimates of the parameters of interest. In the present article, a brief comparison of the COVID-19 events such as total cases, total deaths, totally recovered, and active cases in Iran and Pakistan are provided. Such a brief and clear-cut comparison of the COVID-19 events might be helpful to accommodate the affected peoples.
Furthermore, we propose a new family of statistical distributions that can be used to model COVID-19 pandemic dynamics events. We just provided a platform for the researchers to utilize our proposed method in modeling COVID-19 events. A special sub-model of the proposed family called a new alpha-power Weibull distribution is considered in detail. The model parameters are estimated via the maximum likelihood estimation method. The flexibility of the proposed model is shown by fitting the daily deaths data in Iran and Pakistan due to the COVID-19, and it is observed that the proposed model may provide a close fit to the COVID-19 events. We do expect that the researchers will use our model to utilize it to formulate regression models and tailored NAP-Weibull distribution towards prediction as well as evaluating the link between various risk factors for such and other related purposes.
Availability of Data and Materials:The data sets used in this paper are provided within the main body of the manuscript.
Funding Statement: This study is supported by the Department of Statistics, Yazd University, Iran.
Conflicts of Interest:The authors declare that they have no conflicts of interest to report regarding the present study.
References
1. I. Nesteruk. (2020). “Coronavirus epidemic outbreak in Europe: Comparison with the dynamics in mainland China,” KPI Science News, vol. 1, no. 1, pp. 15–17.
2. I. Nesteruk. (2020). “Comparison of the coronavirus epidemic dynamics in Italy and mainland China,” Preprint, ResearchGate, vol. 4, pp. 1–6.
3. I. Nesteruk. (2020). “Comparison of the coronavirus pandemic dynamics in Ukraine and neighboring countries,” Preprint, ResearchGate, vol. 4, pp. 1–10.
4. I. Nesteruk, “Comparison of the coronavirus pandemic dynamics in Europe, USA and South Korea,” MedRxiv, vol. 2000, pp. 1–6, 2020.
5. H. G. Hong and Y. Li. (2020). “Estimation of time-varying reproduction numbers underlying epidemiological processes: A new statistical tool for the COVID-19 pandemic,” PLoS One, vol. 15, pp. 1–18.
6. L. Ying, A. A. Gayle, A. Wilder-Smith and J. Rocklöv. (2020). “The reproductive number of COVID-19 is higher compared to SARS coronavirus,” Journal of Travel Medicine, vol. 27, pp. 1–16.
7. M. Zuo, S. K. Khosa, Z. Ahmad and Z. Almaspoor. (2020). “Comparison of COVID-19 pandemic dynamics in Asian countries with statistical modeling,” Computational and Mathematical Methods in Medicine, vol. 2020, pp. 1–16.
8. D. Langemann, I. Nesteruk and J. Prestin. (2016). “Comparison of mathematical models for the dynamics of the chernivtsi children disease,” Mathematics and Computers in Simulation, vol. 23, pp. 68–79.
9. Y. Chen, J. Cheng, Y. Jiang and K. Liu. (2020). “A time delay dynamical model for outbreak of 2019-nCoV and the parameter identification,” Journal of Inverse and Ill-Posed Problems, vol. 28, no. 2, pp. 243–250.
10. B. F. Maier and D. Brockmann. (2020). “Effective containment explains sub exponential growth in recent confirmed COVID-19 cases in China,” Science, vol. 368, pp. 742–746. [Google Scholar]
11. S. A. Sarkodie and P. A. Owusu. (2020). “Investigating the cases of novel coronavirus disease in China using dynamic statistical techniques,” Heliyon, vol. 6, no. 4, pp. 1–5. [Google Scholar]
12. K. Roosa, Y. Lee, R. Luo, A. Kirpich, R Rothenberg et al. (2020). , “Real-time forecasts of the COVID-19 epidemic in China from February 5 to February 24, 2020,” Infectious Disease Modelling, vol. 5, pp. 256–263. [Google Scholar]
13. A. Alzaatreh, C. Lee and F. Famoye. (2020). “A new method for generating families of continuous distributions,” Metron, vol. 71, no. 1, pp. 63–79. [Google Scholar]
14. Z. Ahmad, G. G. Hamedani and N. S. Butt. (2019). “Recent developments in distribution theory: A brief survey and some new generalized classes of distributions,” Pakistan Journal of Statistics and Operation Research, vol. 15, no. 1, pp. 87–110. [Google Scholar]
15. Z. Ahmad, E. Mahmoudi, G. G. Hamedani, O. Kharazmi. (2020). “New methods to define heavy-tailed distributions with applications to insurance data,” Journal of Taibah University for Science, vol. 14, no. 1, pp. 359–382. [Google Scholar]
16. G. M. Cordeiro, A. Z. Afify, E. M. Ortega, A. K. Suzuki, M. E. Mead et al. (2019). , “The odd lomax generator of distributions: Properties, estimation and applications,” Journal of Computational and Applied Mathematics, vol. 347, no. 1, pp. 222–237. [Google Scholar]
17. W. He, Z. Ahmad, A. Z. Afify and H. Goual. (2020). “The arcsine exponentiated-x family: Validation and insurance application,” Complexity, vol. 2020, pp. 1–20. [Google Scholar]
18. A. A. Al-Babtain, M. K. Shakhatreh, M. Nassar and A. Z. Afify. (2020). “A new modified kies family: Properties, estimation under complete and type-II censored samples, and engineering applications,” Mathematics, vol. 8, no. 8, pp. 13–45. [Google Scholar]
19. W. Zhao, S. K. Khosa, Z. Ahmad, M. Aslam, A. Z. Afify et al. (2020). , “Type-I heavy tailed family with applications in medicine, engineering and insurance,” PLoS One, vol. 15, no. 8, pp. 1–24. [Google Scholar]
 | This work is licensed under a Creative Commons Attribution 4.0 International License, which permits unrestricted use, distribution, and reproduction in any medium, provided the original work is properly cited. |