DOI:10.32604/cmc.2021.013774
| Computers, Materials & Continua DOI:10.32604/cmc.2021.013774 | |
| Article |
Machine Learning Enabled Early Detection of Breast Cancer by Structural Analysis of Mammograms
1Department of Computer Sciences, Kinnaird College for Women, Lahore, 54000, Pakistan
2College of Computer and Information Sciences, Jouf University, Sakaka, Aljouf, 72341, Saudi Arabia
3Physics Department, College of Science, Jouf University, Sakaka, Aljouf, 72341, Saudi Arabia
4Division of Computer Science & Information Technology, University of Education, Lahore, 54000, Pakistan
5Department of Computer Science, Lahore Garrison University, Lahore, 54000, Pakistan
6Department of Basic Sciences, Deanship of Common First Year, Jouf University, Sakaka, Aljouf, 72341, Saudi Arabia
*Corresponding Author: Fahad Ahmad. Email: drfahadahmadmian@gmail.com
Received: 20 August 2020; Accepted: 30 October 2020
Abstract: Clinical image processing plays a significant role in healthcare systems and is currently a widely used methodology. In carcinogenic diseases, time is crucial; thus, an image’s accurate analysis can help treat disease at an early stage. Ductal carcinoma in situ (DCIS) and lobular carcinoma in situ (LCIS) are common types of malignancies that affect both women and men. The number of cases of DCIS and LCIS has increased every year since 2002, while it still takes a considerable amount of time to recommend a controlling technique. Image processing is a powerful technique to analyze preprocessed images to retrieve useful information by using some remarkable processing operations. In this paper, we used a dataset from the Mammographic Image Analysis Society and MATLAB 2019b software from MathWorks to simulate and extract our results. In this proposed study, mammograms are primarily used to diagnose, more precisely, the breast’s tumor component. The detection of DCIS and LCIS on breast mammograms is done by preprocessing the images using contrast-limited adaptive histogram equalization. The resulting images’ tumor portions are then isolated by a segmentation process, such as threshold detection. Furthermore, morphological operations, such as erosion and dilation, are applied to the images, then a gray-level co-occurrence matrix texture features, Harlick texture features, and shape features are extracted from the regions of interest. For classification purposes, a support vector machine (SVM) classifier is used to categorize normal and abnormal patterns. Finally, the adaptive neuro-fuzzy inference system is deployed for the amputation of fuzziness due to overlapping features of patterns within the images, and the exact categorization of prior patterns is gained through the SVM. Early detection of DCIS and LCIS can save lives and help physicians and surgeons todiagnose and treat these diseases. Substantial results are obtained through cubic support vector machine (CSVM), respectively, showing 98.95% and 98.01% accuracies for normal and abnormal mammograms. Through ANFIS, promising results of mean square error (MSE) 0.01866, 0.18397, and 0.19640 for DCIS and LCIS differentiation during the training, testing, and checking phases.
Keywords: Image processing; tumor; segmentation; dilation; erosion; machine learning; classification; support vector machine; adaptive neuro-fuzzy inference system
Cancer disease refers to the uncontrolled growth of cells in a particular part of the body. Lumps, micro-classifications, and artificial distortions are formed by the abnormal growth of cells and referred to as tumors. In women, ductal carcinoma in situ (DCIS) and lobular carcinoma in situ (LCIS) are the most common types of cancer [1]. According to World Health Organization statistics, 627,000 women died due to DCIS and LCIS in 2018. The survival rates of DCIS and LCIS patients are entirely dependent on their diagnosis and treatment. Detecting cancer at an early stage is necessary to treat it and to help increase the survival rate. DCIS and LCIS begin in both genders’ breast cells and expand to other parts of the body. Today, these are the second most common type of cancer after lung cancer [2]. Therefore, early diagnosis of cancer is crucial. Medical imaging techniques are widely used in diagnosing cancer and monitoring the progress of the disease.
Several strategies were enforced to locate the neoplastic cell space; however, those methodologies worked solely within the image preprocessing steps. Nevertheless, for final confirmation, doctors ought to opt for different radiological and laboratory tests to reach a diagnosis, causing rather more pain to the patients. Therefore, there is a necessity to work additional image processing steps into diagnosing schemes to seek out cancers from the images, which is extremely helpful in diagnosing neoplastic cells. Mammography is the imaging technique used to examine the breasts’ internal structures through low-dose X-rays [3], and it is the first test used for checking and diagnosing DCIS and LCIS.
Performing screening mammography at the right time can be helpful in the early detection and treatment of DCIS and LCIS. Nevertheless, there is a possibility of identifying an abnormality that looks like cancer but turns out to be healthy tissue while using mammography; this is referred to as a false negative report. Such misdiagnosis will lead to more tests, which can be stressful for the patient. Improvement in the image is necessary to represents better image processing, such as segmentation and identification for diagnostic analysis, image refinement, and attribute extraction [4].
For classification, a machine learning algorithm called the support vector machine (SVM) would be executed. The main reason behind utilizing an SVM is that it helps to find the hyper-plane in N-dimensional space, meaning it helps to extract N number of features [5]. The SVM helps to classify given data points into two distinct classes so that the breast’s affected and unaffected regions can easily be differentiated. The SVM achieves greater precision with fewer computational resources. It classifies the data in a way that defines boundaries among different classes according to the margins. However, the SVM does not directly provide probability estimates, so they are calculated using an expensive five-fold cross-validation process instead [6].
An adaptive neuro-fuzzy inference system (ANFIS) is used to further purify and clarify a diagnosis by eradicating the feature space’s fuzziness after SVM classification. An ANFIS combines both neural-network and fuzzy logic. It provides the benefits of both systems in a single framework. The inference system consists of a set of IF-THEN rules that possess the ability to learn. The ANFIS framework reads the input values and describes the membership functions. The membership function parameters change as the system learns. The main advantage of using ANFIS architecture is that it is enriched with adaptability and smoothness.
For cancer diagnosis at the preliminary stage, image processing, SVM, and ANFIS are used to achieve refined results. A mammogram is passed through various steps to enhance its contrast and visibility, making it easier for the oncologist to access it. Necessary image preprocessing measures includes image acquisition, contrast enhancement, and segmentation techniques [7]. Through this method, one or many attributes of the image matrix are reconstructed.
A dataset from the Mammographic Image Analysis Society (MIAS) is used to implement the proposed approach. The dataset includes a total of 322 images of mammograms that are  pixels in size. There are 207 normal images and 116 abnormal images. Abnormal images are divided further into the two categories of benign and malignant. There are 64 benign cases and 52 malignant cases.
2.1 Removal of Artifacts and Labels
In mammograms, the removal of artifacts, labels, and pectoral muscles are the most critical and challenging task [8]. The removal of the pectoral muscles is the first step in detecting DCIS and LCIS [9,10]. The pectoral muscles’ density is almost the same as the intensity of the breast’s fatty tissues and tumor regions. To find a region of interest and for feature extraction, it is necessary to remove the pectoral muscles from the images. Figs. 1a and 1b illustrate mammograms after removing pectoral muscles and labels.
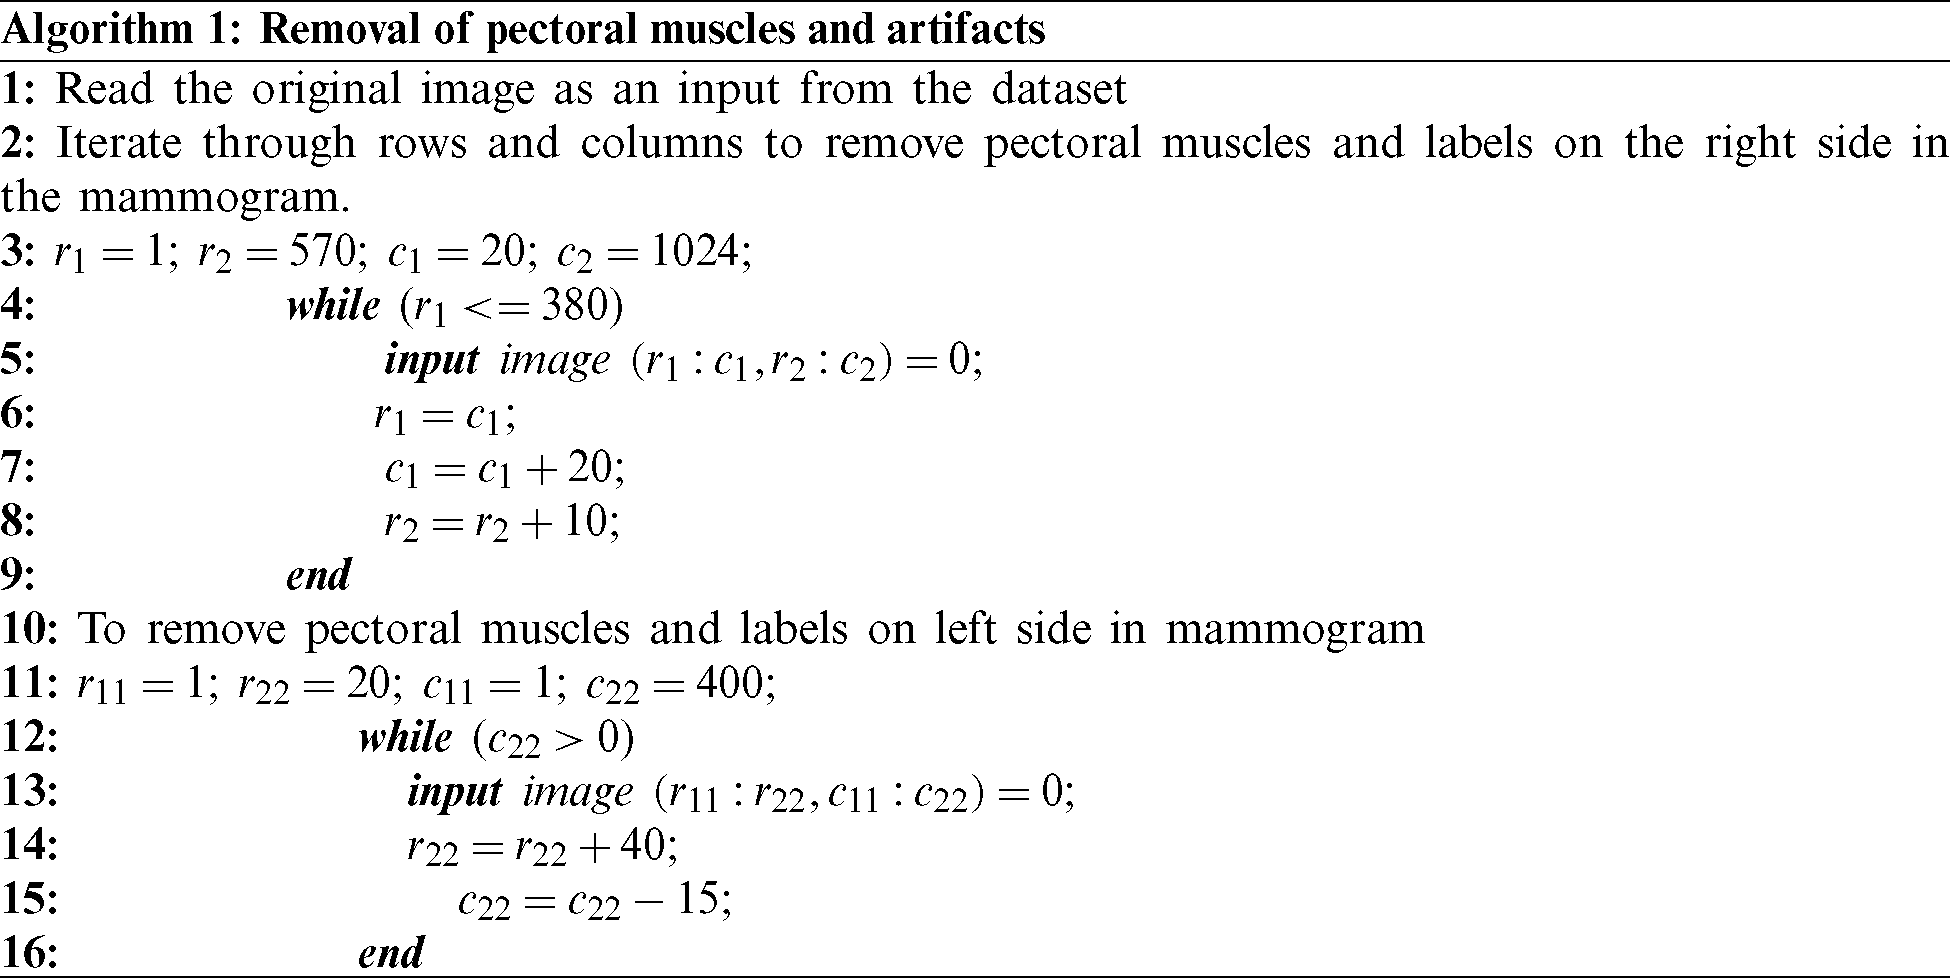

Figure 1: (a) Mammogram images of a breast: The left side represents a breast with pectoral muscles, and the right side represents a breast after the pectoral muscles have been removed. (b) Mammogram images of a breast: The left side represents a breast with pectoral muscles, and labels and the right side represents a breast after the pectoral muscles and labels have been removed
The main objective of image enhancement is to keep adjusting the attributes of an image to correct it for a particular task or even for a particular observer. Image enhancement is an essential aspect in the production of medical imaging. Due to small exposures, various aspects of a complete image cannot be distinguished from the dark background. Carcinogenic cells in an affected breast become easy to detect by using image-processing techniques [11]. In this study, to enhance mammograms for visibility and to view hidden details, contrast-limited adaptive histogram equalization (CLAHE) is used to improve the mammograms. CLAHE gives the best results on small contrast medical images. It divides an input image (mammogram) into non-overlapping contextual regions known as tiles. Block size and clip limit are the two basic vital parameters that control enhanced image quality in CLAHE. If the input image has the minimal intensity, CLAHE can make it more substantial and make an image histogram appear flatter. The more the block size contrast of the image increases, the more abundant the dynamic ranges will be. Figs. 2a and 2b show images before and after enhancement. CLAHE is used with default num tiles [8 8] and a 0.01 clip limit.

Figure 2: (a) Results after enhancement of image (mdb150). (b) Results after enhancement of image (mdb005)
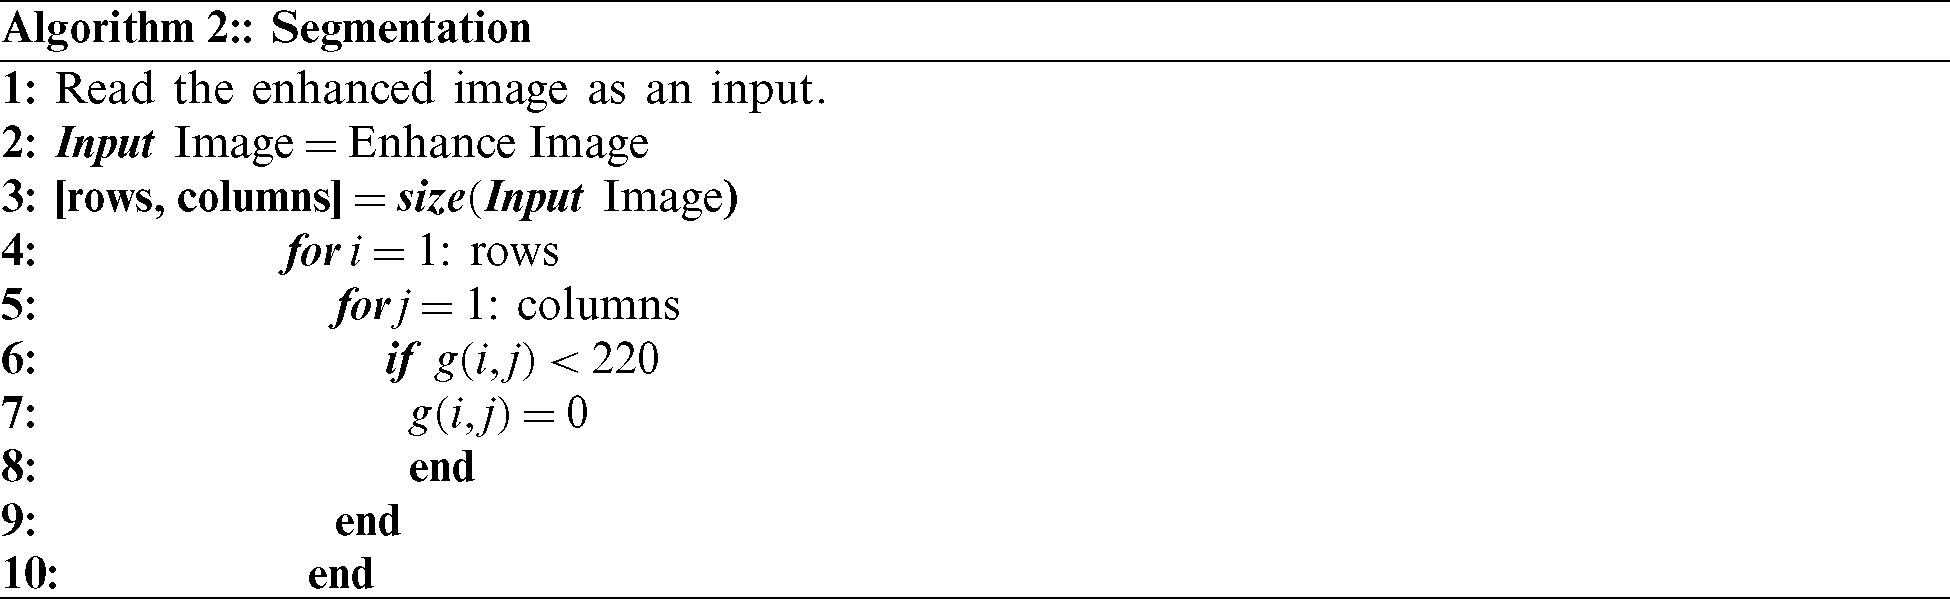
Segmentation is a technique used to categorize or recognize sub-arrangements in a particular image. Local and global segmentation are the two basic classes of segmentation. Local segmentation is concerned with a specific region of the image, whereas global segmentation is concerned with the total image’s dissection, which entails a massive range of pixels [12]. Local segmentation can be achieved with two subcategories and two further sub-processes, depending upon the image’s properties. In detection based on discontinuity, the image is alienated into parts based on the cutoff; the boundaries are constructed on the disruption and merged to shape an image’s boundaries. In detection based on similarities, the pixels of an image are divided depending on certain resemblances, groupings, junctions, or gaps involved in this kind of segmentation.
In our work, segmentation is done by setting the threshold value to 220. Setting the threshold value accurately is very important. If the threshold is too small, then the pixels become brighter, and if the threshold is too large, the pixels become darker. Threshold values greater than 220 will be set to 0. The mathematical formula for single-value thresholding is given below. In Eq. (1), x and y are the image’s intensities, and T is the threshold value set to 220. Figs. 3a and 3b show images before and after thresholding, in which the threshold value is set to 220.


Figure 3: (a) Original image before and after thresholding. (b) Enhanced image before and after thresholding
The following steps are encompassed in the process from segmentation to thresholding.
Morphological operations are defined to eliminate imperfections from the segmented portion of mammograms and extract certain components useful in analyzing the affected region [13]. Morphological operations are based on the ability of the structural elements to function. Structural elements can be of any size or shape. Furthermore, each pixel of the input image gives a new pixel due to processed image. Segmentation is done by setting the threshold value such that the area of concern is segregated from the residual image [14]. The most common morphological operations applied to the image are erosion and dilation. These multifarious operations are performed with the help of compound Eq. (2):

Dilation helps in the growth of the segmented region by adding pixels to the boundaries of an object. The pixel intensities added to the image’s objects are determined by the structuring element’s size and shape. Dilation has the property of fixing intrusions. Tiny gaps in the segmented region are filled by dilation to make it more apparent. The dilation of image f by structuring element s is given by  . The structuring element s is positioned with its origin at (x, y), and the new pixel value is determined using Eq. (3):

Fig. 4 shows the structuring element used to perform dilation on mammograms from the MIAS dataset. The structuring element is a disk shape and returns the output image, which is the same in size as the input image. Figs. 5a and 5b show the images before and after dilation is applied to the segmented image.
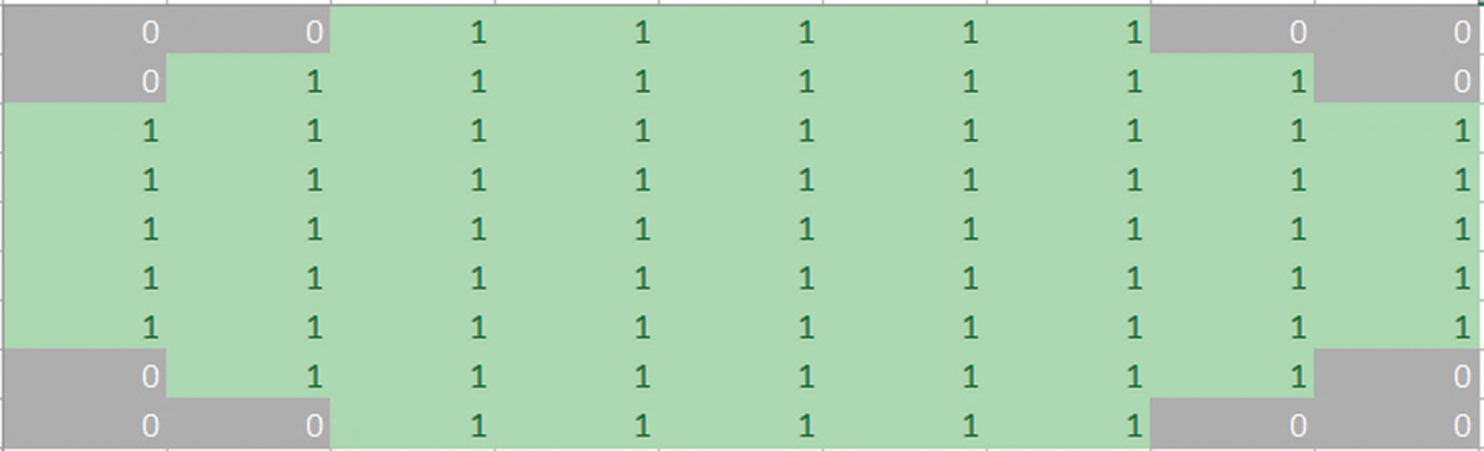
Figure 4: Structuring element strel (‘disk,’ 5)
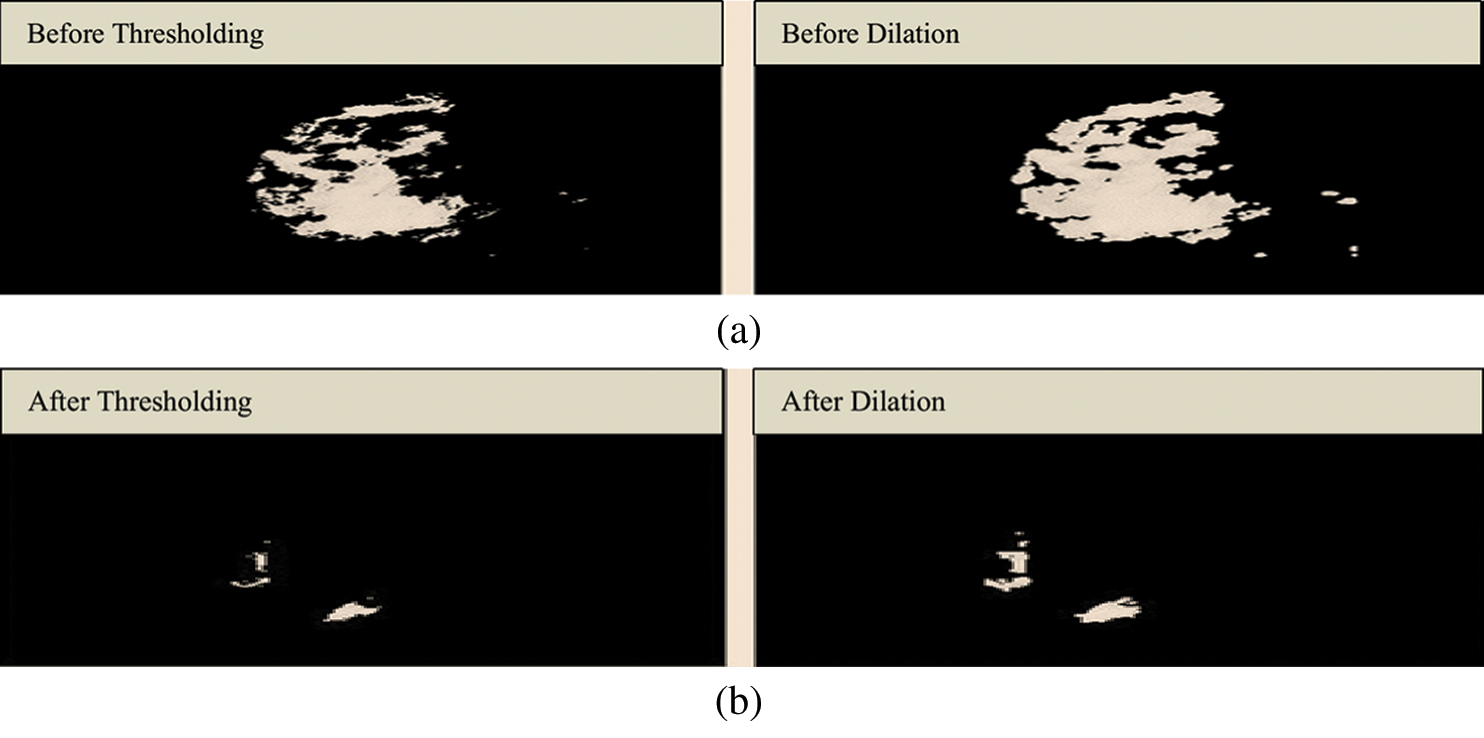
Figure 5: (a) Results before applying a dilation. (b) Results after applying a dilation
Erosion will shrink the segmented region, and it is used to strip away extrusion. The function f gives the erosion of image f through the structuration of component  . The structuring component s is located with its origin at (x, y), and the new pixel value is calculated using the rule that x and y are the intensities in image
  . Erosion is performed by taking the structuring element of shape with disk size 10.
Fig. 6 shows the structuring element used to perform erosion on dilated mammograms in the MIAS dataset. This structuring element is of a disk shape and returns an output image that is the same size as the input image. Figs. 7a and 7b show the images before and after the application of dilation and erosion.
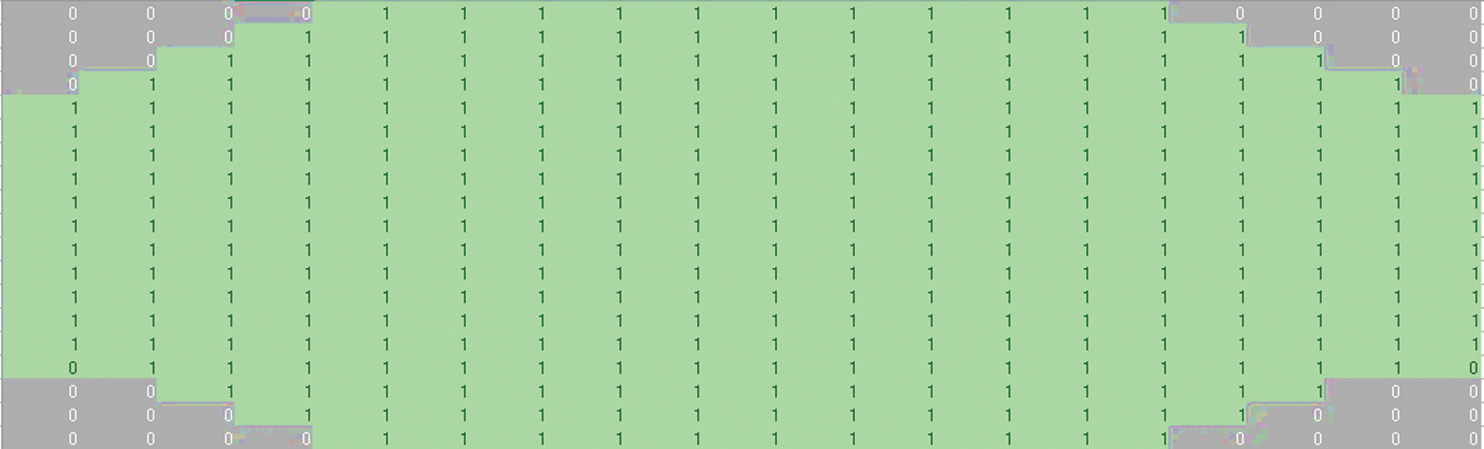
Figure 6: Structuring element strel (‘disk,’ 10)
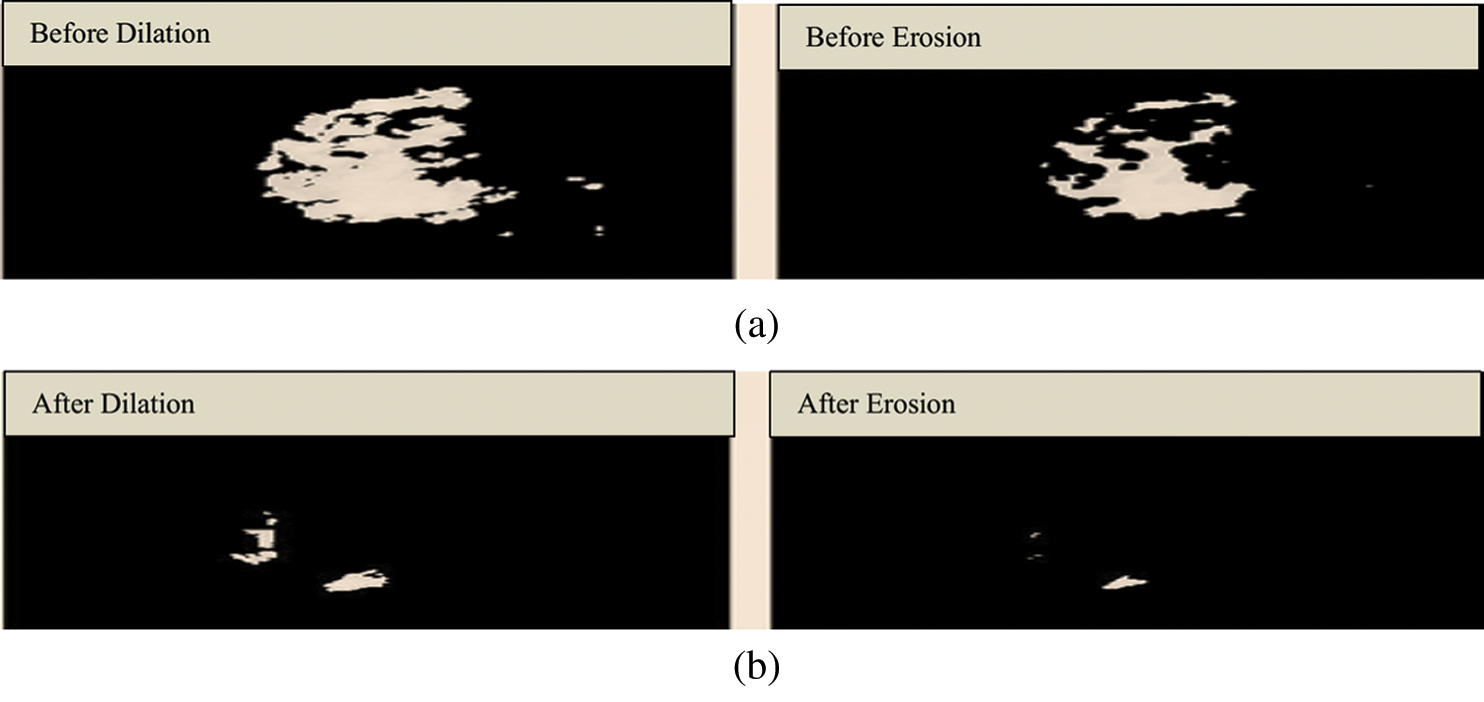
Figure 7: (a) Results before applying erosion. (b) Results after applying erosion
Figs. 8a to 8d show mammograms before and after cropping to help visualize the image’s original and segmented portions.
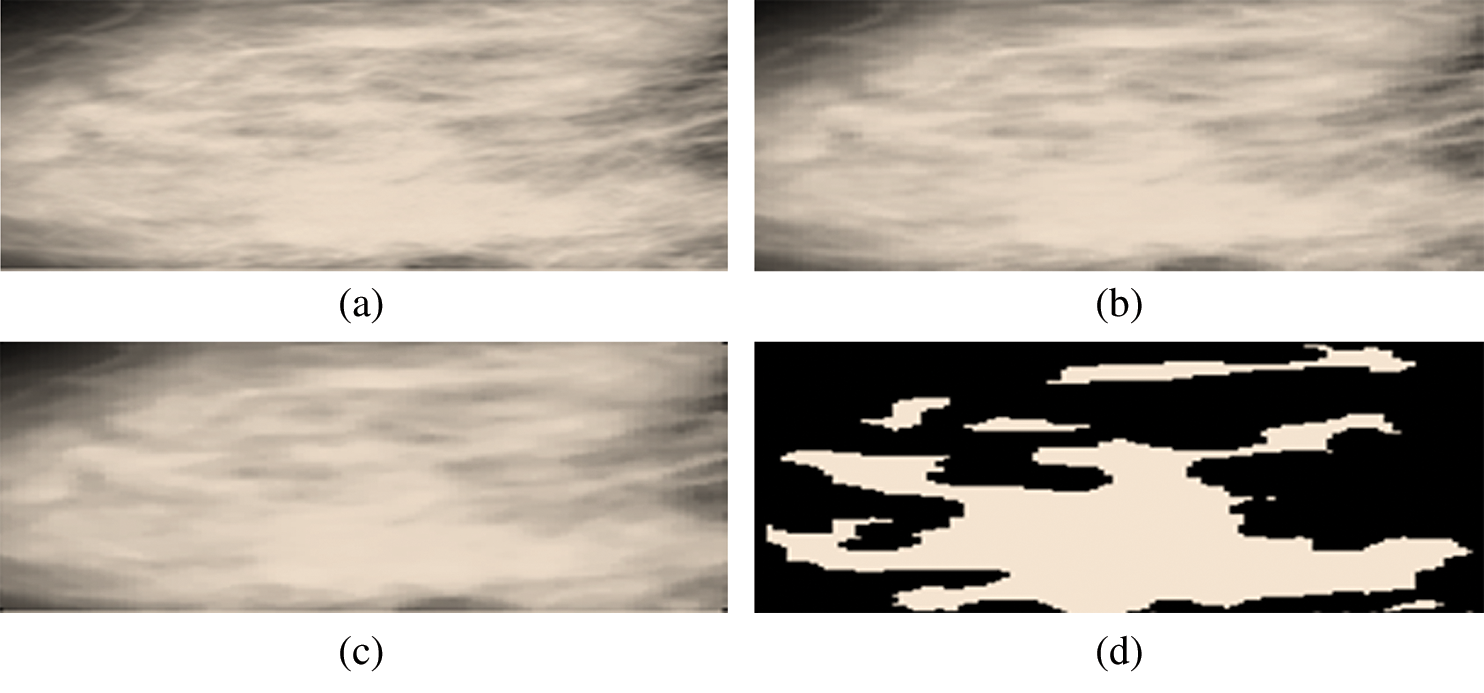
Figure 8: (a) Cropped region of interest. (b) Region of interest after resizing. (c) Region of interest after a median. (d) Cropped segmented region of interest
Fig. 9a is labeled with the affected part, and Fig. 9b is a cropped image representing the affected area.
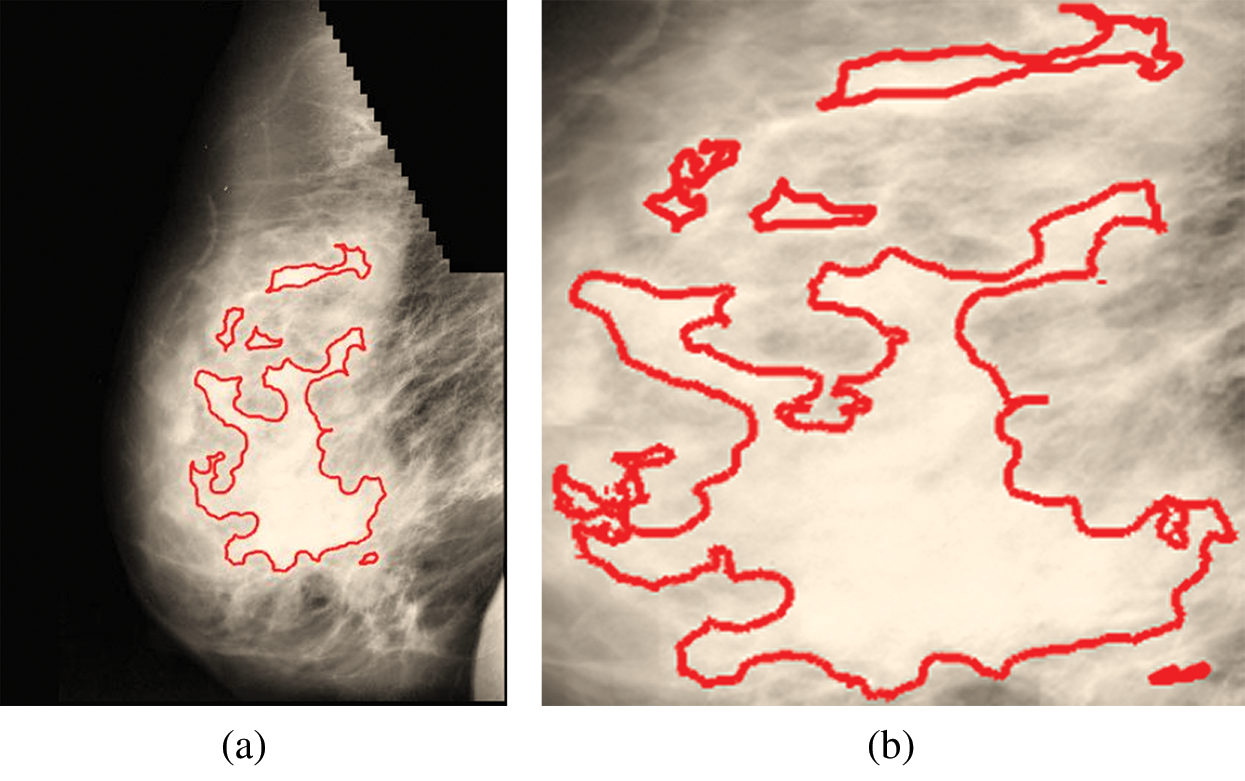
Figure 9: (a) Affected part. (b) Affected part after cropping
Many features like the gray-level co-occurrence matrix (GLCM), Harlick texture features, first-order texture features, second-order texture features, shape features, and statistical features are extracted from the segmented region of the image to perform classification [15,16]. Image is formed by the pixels those have intensities used by GLCM that is an image analysis technique employed to determine different combinations of gray-level intensities that co-occur in an image, as shown in Fig. 10. GLCM s variation in image texture at the pixel of interest.
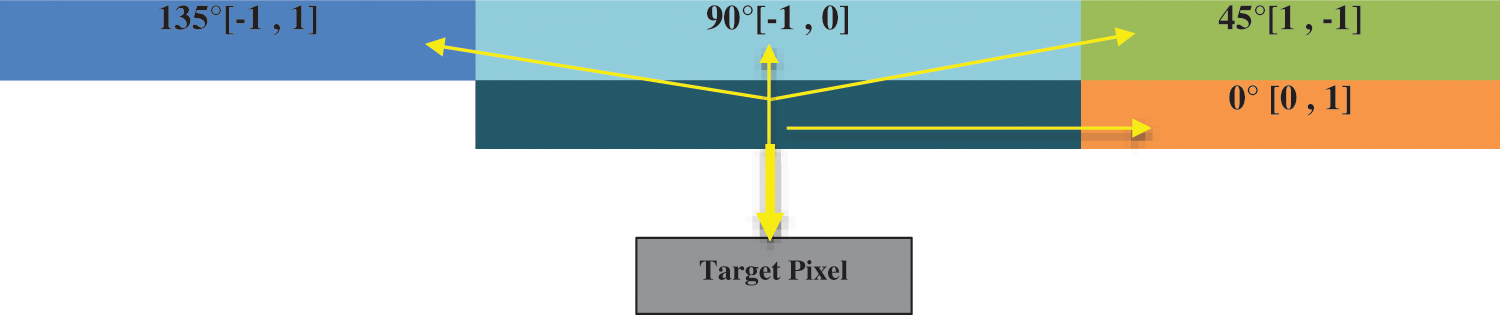
Figure 10: Gray-level co-occurrence matrix direction analysis
Features are calculated from mammograms, and further, an SVM is utilized to classify the features into two disjoint classes normal and abnormal. However, image processing is done before the SVM enactment. SVM is designed to separate a set of training images into two different classes:  , where xi in d-dimensional feature space and yi in {0, +1} are the class labels, with
 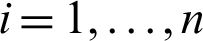 . The SVM builds the optimal separating hyperplanes. Those images with an attribute on one side of the hyperplane belong to class-0(Normal images), and the others belong to class +1 (Abnormal images). Eq. (4) is used to differentiate between the two different kinds of patterns in the SVM.

The value i is less than or equal to n, and yi is either 0 or 1, indicating the class to which point xi belongs. The value w is the normal vector to the hyperplane.
The second technique that will be deployed in this study is an ANFIS. This technique helps to check the dataset to eradicate vagueness due to overlapping values among the patterns. It will test for uncertainty between benign and malignant patterns and will help to eliminate their fuzziness. An ANFIS is considered a universal estimator, as it comprises the benefits of both neural networks and fuzzy logic [17]. The Sugeno Fuzzy method (also called a TSK fuzzy model) is used to build a structured method to produce fuzzy rules from datasets [18]. The first layer transfers the input to the next layer. In the first layer, each node is provided with an independent function  where
where  (i) are member functions and O1, i shows the output of an input ith node of the first layer as described by Eq. (5).

By using this technique, the learning algorithm is employed to find the parameters by applying a backpropagation scheme, as shown in Eq. (6).

Each node output shows the firing strength wi of a rule and operators that perform the fuzzy operation and can be used as the node function in this layer. The third layer creates rules, so it is named the ruler layer.
In the third layer of the ANFIS architecture, each node calculates normalized weights. Defuzzification occurs in the fourth layer. The fourth layer uses the inference of the rules, and then outputs are generated. Whereas in Eq. (7), the normalized firing strength from the previous layer is the nodes’ parameter set value [19]. The final layer combines all of the defuzzified input and calculates the output by employing Eqs. (8) and (9), respectively. The whole procedure progression is demarcated in Fig. 11.


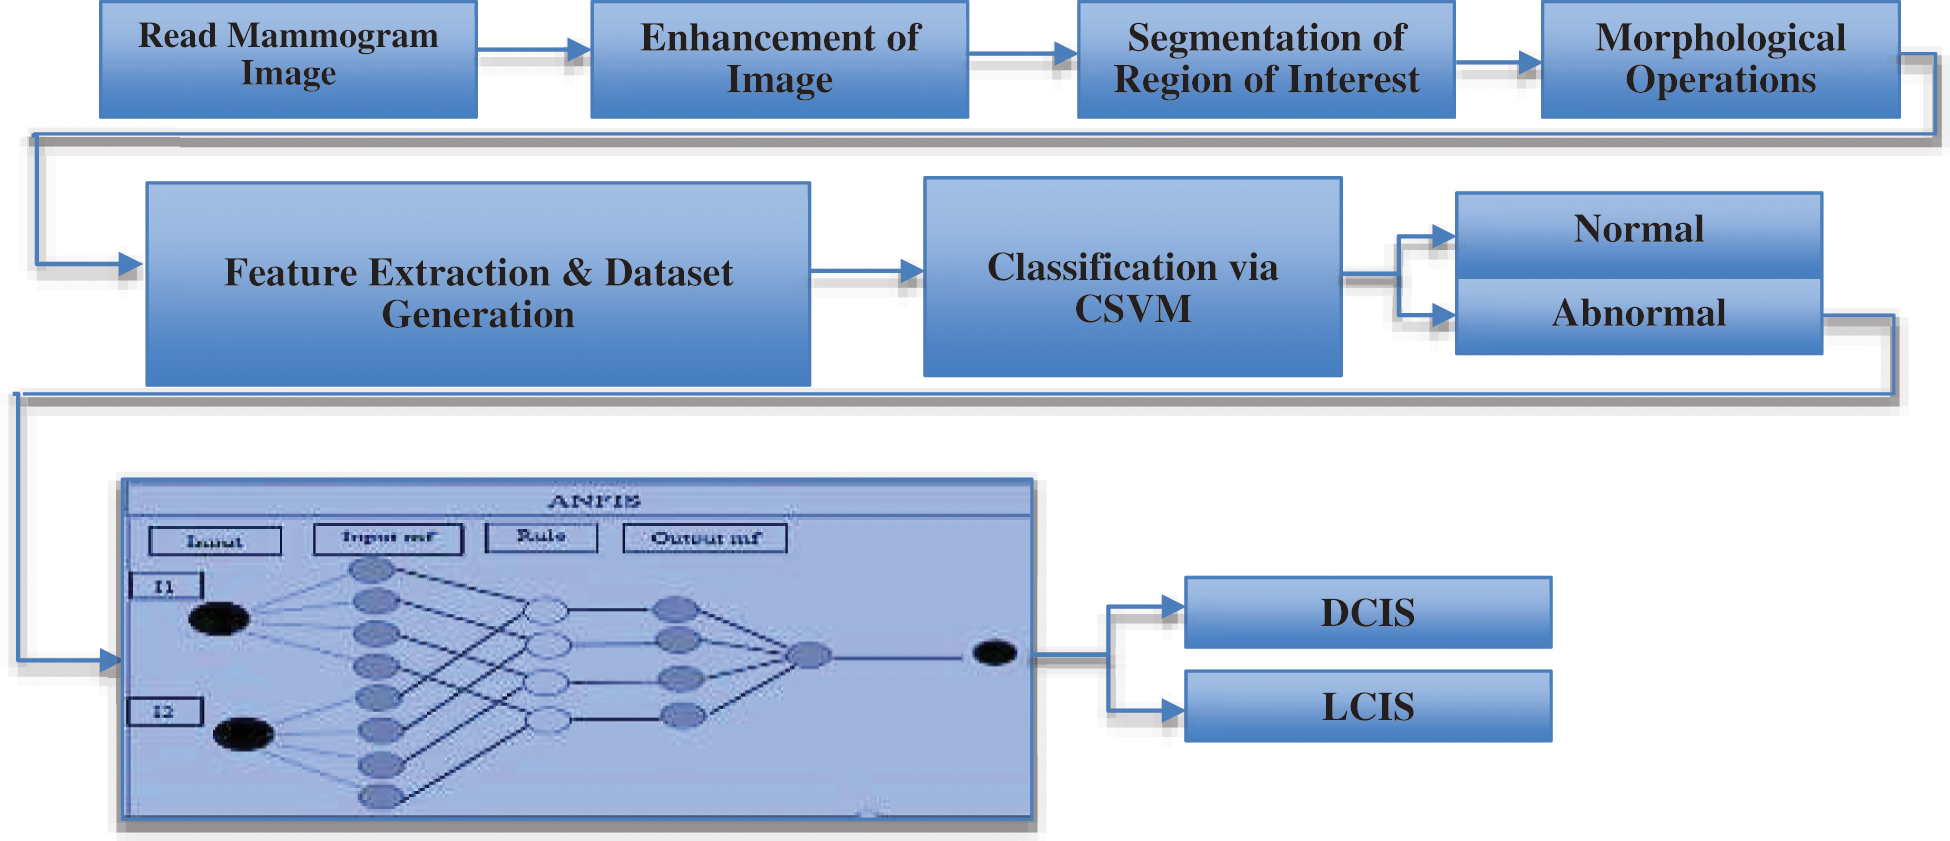
Figure 11: Proposed framework for early breast cancer detection
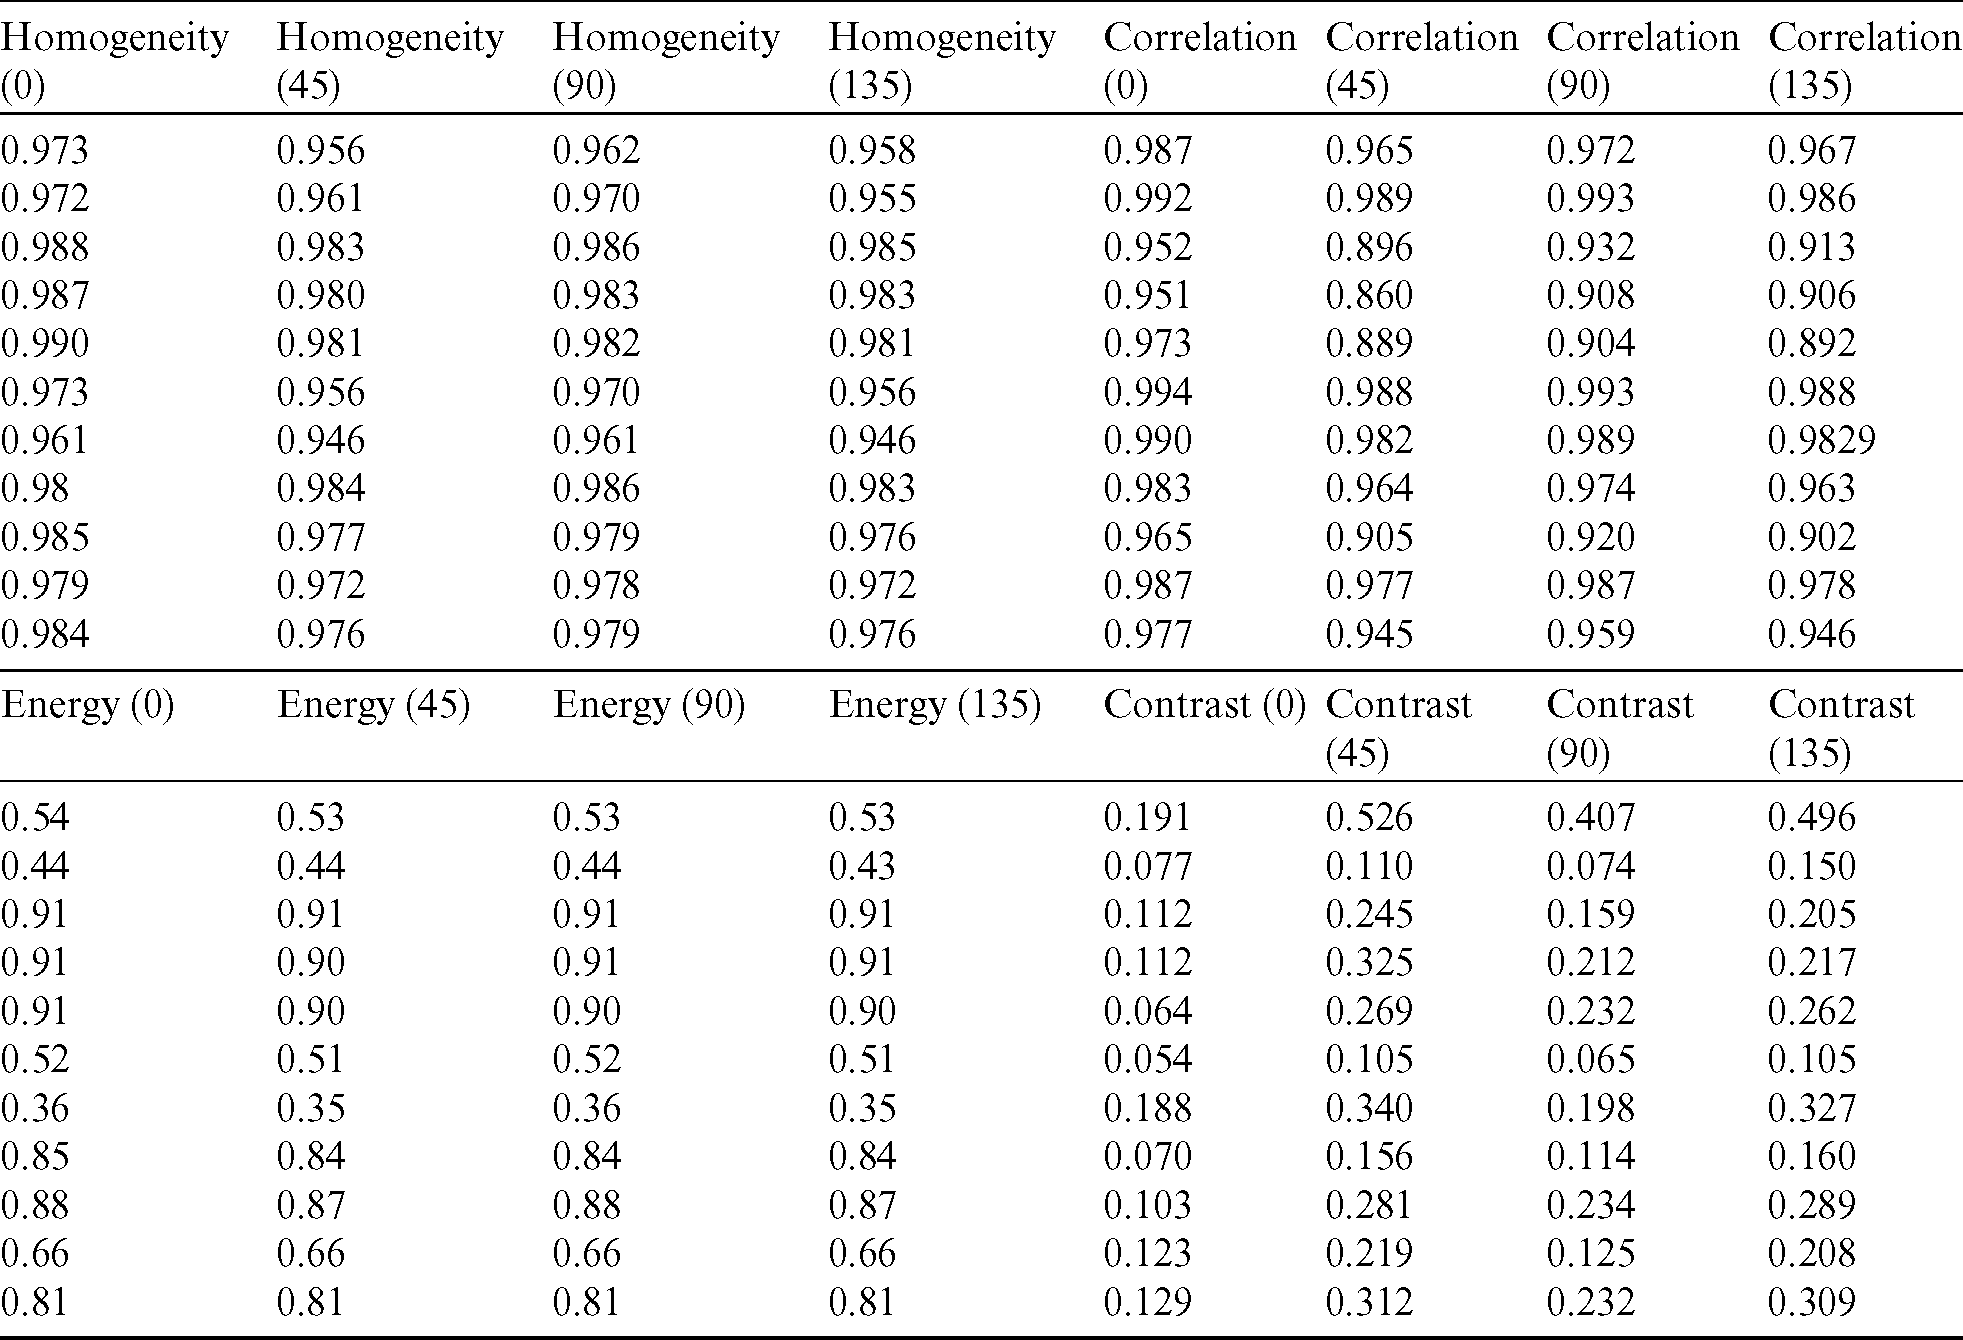
Figs. 12a–12c respectively illustrate normal, benign, and malignant mammograms derived after the whole procedure is implemented. Attributes and features extracted through the procedure presented in Fig. 11 are displayed in Tab. 1.

Figure 12: (a) MDB174 normal. (b) MDB005 benign. (c) MDB197 malignant
Table 1: Attributes derived from mammograms
The generated dataset from the images is given to the SVM to classify the data into two distinct categories. In the first step, to build an SVM model with acceptable accuracy, extracted features are given to the SVM with label classes for the input data pattern classifications. With the help of fine-tuning, the SVM gives the best accuracy results in the classification of mammograms in comparison with other traditional classification techniques. The cubic kernel technique empowers the SVM to discover a hyperplane in the portion space, and thus nonlinear separation can be accomplished in the feature space.
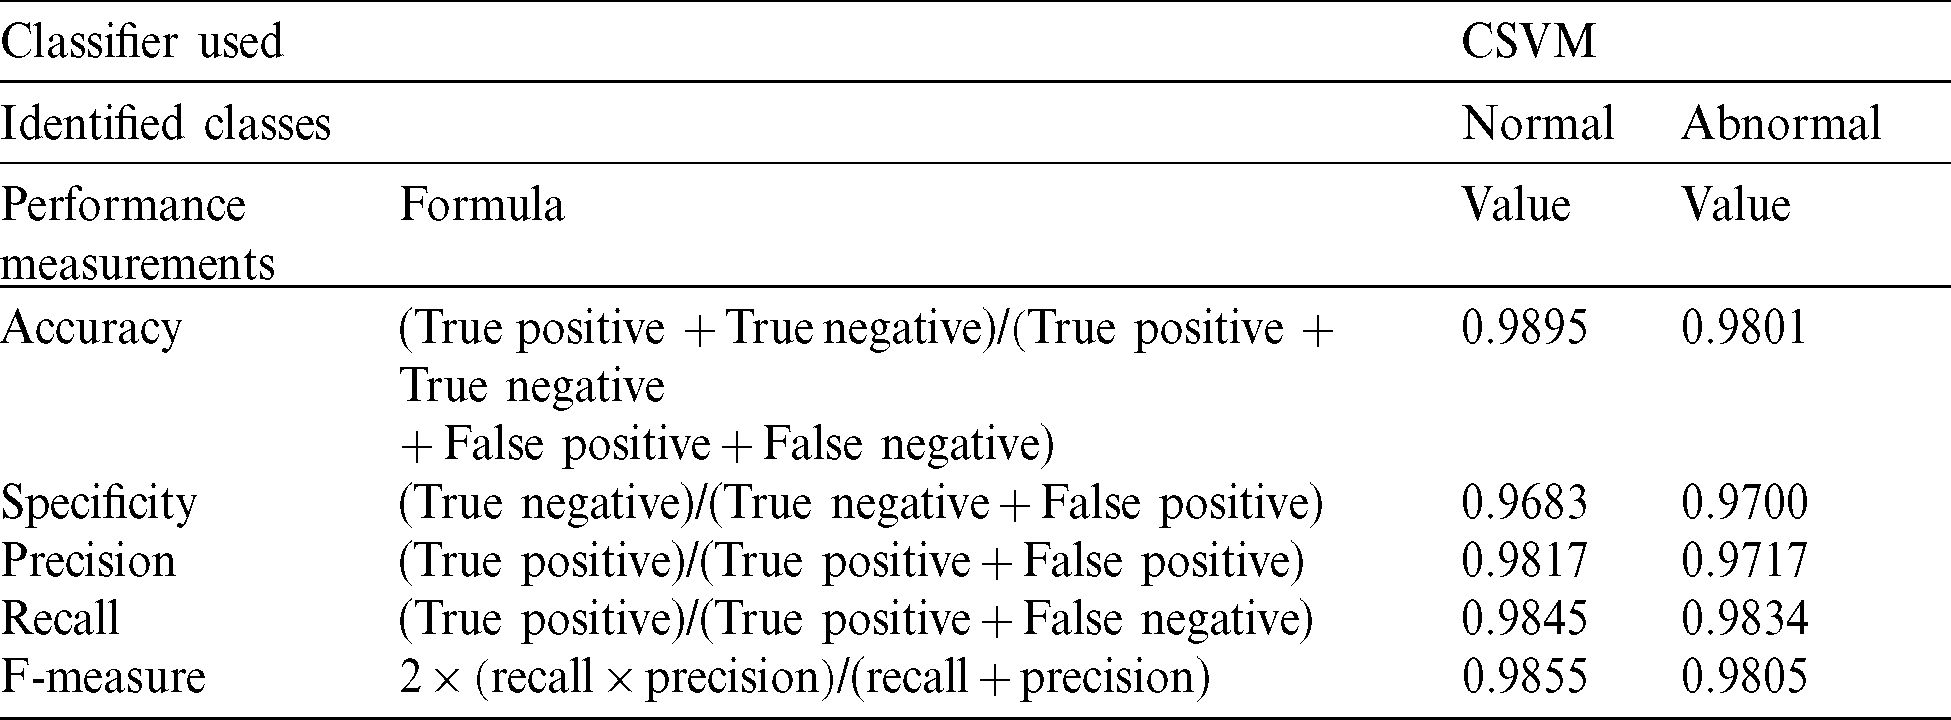
The CSVM detects normal or abnormal mammograms using the classifications of accuracy, specificity, precision, recall, and F-measure as dominant performance metrics [20,21]. Tab. 2 shows the evaluation parameters used for performance measurement.
Table 2: Evaluation parameters used for the performance measurement
Data is classified into normal and abnormal categories for the identification of DCIS and LCIS through the SVM. The ANFIS deals with the computational uncertainty by incorporating the “degree of truthiness” instead of the typical Boolean logic. The abnormal patterns are separated from the total dataset, and dominant feature identification is performed before input into the ANFIS [22]. The Fsc_chi2 function is used to select essential predictors from the dataset. The results show that the higher-ranked predictors are essential. Fig. 13 represents the eight most important predictors that are selected from the x variables: energy (0), energy (45), energy (90), energy (135), contrast (0), contrast (90), contrast (135), and Harlic_contrast.
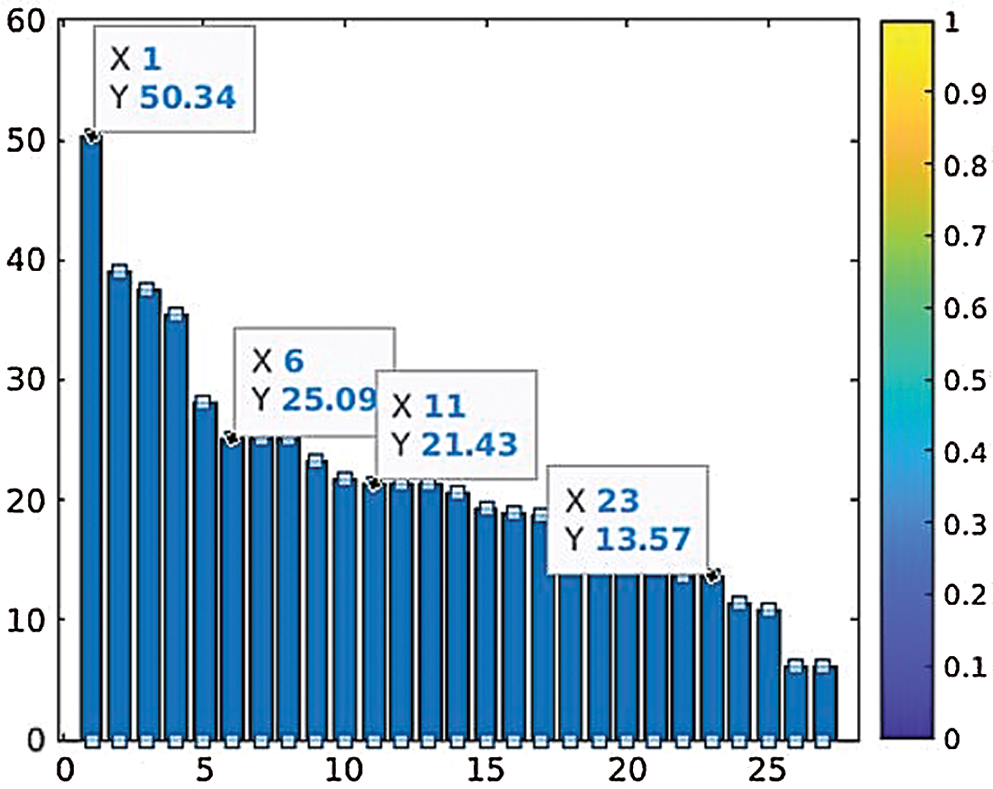
Figure 13: Parameter ranking based on prediction reputation
3.2 Implementation of the Adaptive Neuro-Fuzzy Inference System
An ANFIS was deployed to eliminate the inherent fuzziness of the patterns classified through the SVM for the exact identification of DCIS and LCIS. Fig. 14 illustrates the fuzzy inference system in which membership functions are defined for all input parameters related to DCIS and LCIS, as shown in Tab. 3. Then, a rule base is generated for the identified parameters displayed in Tab. 4. The initial configuration of the ANFIS is presented in Tab. 5. We have used 70% of the dataset as training data, kept 15% for testing, and kept a further 15% for checking. Finally, the results of the exact identification can be seen through the surface viewer in Tab. 6.

Figure 14: Fuzzy inference system
Table 3: Input parameter membership functions


Table 5: Configuration of the adaptive neuro-fuzzy inference system

Table 6: The adaptive neuro-fuzzy inference system results through the surface viewer

DCIS and LCIS are some of the most widespread cancers in women and men worldwide. Detection of these cancers in patients through mammography may facilitate the extension of the automatic diagnostic regime for DCIS and LCIS. The amount of false-positive cases in fibrous breast tissues is high; locating masses is much more challenging than calcifications because their sizes and shapes differ, and the image quality of mammograms could be affected. Assessment and decision-making on machine learning for clinical and radiological diagnosis are crucial [23,24]. Intelligent classification techniques may help physicians identify symptoms that may not be observed through a conventional approach. Early detection of DCIS and LCIS can save lives and help physicians initiate treatment [25,26].
In this research, a carcinoma detection scheme is projected on breast mammograms by preprocessing the images using CLAHE and separating the tumorous tissues through segmentation. Furthermore, morphological operations are applied to mammograms, such as erosion and dilation, and then GLCM texture features, Harlick texture features, and shape features are extracted from the regions of interest. An SVM classifier will be used to detect normal and abnormal patterns, and then an ANFIS will be used for the meticulous classification of former patterns through the SVM [27].
SVM classification is used to classify the features extracted from mammograms into two classes: Normal and abnormal. Considerable results are obtained through cubic support vector machine (CSVM), respectively, showing 98.95% and 98.01% accuracies for normal and abnormal mammograms. The SVM’s identified abnormal patterns are further processed through the ANFIS to make a correct diagnosis about DCIS and LCIS. The ANFIS trained, tested, and checked procedures to acquire the eight inputs with the highest ranks, based on their prediction role and three outputs. After setting ‘0’ error tolerance and 100 epochs in the training set, we achieved a mean square error (MSE) of 0.01866 during the training phase. Furthermore, during the testing phase, we achieved an MSE of 0.18397 and an MSE of 0.1964 during checking. The statistics presented here revealed promising results for the precise identification of DCIS and LCIS.
The ANFIS illustrates the physiognomies of rapid and accurate learning to use both linguistic data and excellent generalization competence [28]. The ANFIS is a rule-based method that can quickly build previously extracted connections and record-based measures to help physicians or surgeons make prompt decisions. For the screening mammography mass data collection, the implications indicate that the techniques of image processing, SVM, and ANFIS have significantly improved their efficiency and, used together, can be a robust potential solution for the detection of DCIS and LCIS.
Acknowledgement: Thanks to our families and colleagues who supported us morally.
Funding Statement: The authors received no specific funding for this study.
Conflicts of Interest: The authors declare that they have no conflicts of interest to report regarding the present study.
References
1. F. Khan, M. A. Khan, S. Abbas, A. Athar, S. Y. Siddiqui et al. (2020). , “Cloud-based breast cancer prediction empowered with soft computing approaches,” Journal of Healthcare Engineering, vol. 2020, pp. 1–16.
2. M. M. Fathima, D. Manimegalai and S. Thaiyalnayaki. (2013). “Automatic detection of tumor subtype in mammograms based on GLCM and DWT features using SVM,” in Int. Conf. Information Communication and Embedded Systems, Chennai, India, pp. 1–6.
3. A. A. Mohamed, W. A. Berg, H. Peng, Y. Luo, R. C. Jankowitz et al. (2018). , “A deep learning method for classifying mammographic breast density categories,” Medical Physics, vol. 45, no. 1, pp. 314–321.
4. P. Sahni and N. Mittal. (2019). “Breast cancer detection using image processing techniques,” in Advances in Interdisciplinary Engineering, 1 ed., Singapore: Springer, pp. 813–823.
5. M. A. Khan, S. Abbas, K. Khan, M. A. Al Ghamdi and A. Rehman. (2020). “Intelligent forecasting model of COVID-19 novel coronavirus outbreak empowered with deep extreme learning machine,” Computers, Materials & Continua, vol. 64, no. 3, pp. 1329–1342.
6. R. Karthik, R. Menaka and C. Chellamuthu. (2015). “A comprehensive framework for classification of brain tumor images using SVM and curvelet transform,” International Journal of Biomedical Engineering and Technology, vol. 17, no. 2, pp. 168–177.
7. A. Qayyum and A. Basit. (2016). “Automatic breast segmentation and cancer detection via SVM in mammograms,” in Int. Conf. on Emerging Technologies (ICETIslamabad, Pakistan, pp. 1–6.
8. H. Khalid, M. Hussain, M. A. Al Ghamdi, T. Khalid, K. Khalid et al. (2020). , “A comparative sematic literature review on knee bone reports from MRI, X-rays and CT scans using deep learning and machine learning methodologies,” Diagnostics, vol. 10, no. 8, pp. 518.
9. I. I. Esener, S. Ergin and T. Yuksel. (2018). “A novel multistage system for the detection and removal of pectoral muscles in mammograms,” Turkish Journal of Electrical Engineering & Computer Sciences, vol. 26, no. 1, pp. 35–49.
10. M. W. Nadeem, M. A. Al Ghamdi, M. Hussain, M. A. Khan, K. M. Khan et al. (2020). , “Brain tumor analysis empowered with deep learning: A review, taxonomy, and future challenges,” Brain Sciences, vol. 10, no. 2, pp. 118. [Google Scholar]
11. T. Chaira and A. K. Ray. (2017). Fuzzy Image Processing and Applications with MATLAB, CRC Press, USA. [Google Scholar]
12. A. S. Assiri, S. Nazir and S. A. Velastin. (2020). “Breast tumor classification using an ensemble machine learning method,” Journal of Imaging, vol. 6, no. 6, pp. 39. [Google Scholar]
13. K. M. Sundaram, D. Sasikala and P. A. Rani. (2014). “A study on preprocessing a mammogram image using adaptive median filter,” International Journal of Innovative Research in Science, Engineering and Technology, vol. 3, no. 3, pp. 10333–10337. [Google Scholar]
14. Y. Gao, X. Li, M. Dong and H. P. Li. (2018). “An enhanced artificial bee colony optimizer and its application to multi-level threshold image segmentation,” Journal of Central South University, vol. 25, no. 1, pp. 107–120. [Google Scholar]
15. M. S. Al-Tarawneh. (2012). “Lung cancer detection using image processing techniques,” Leonardo Electronic Journal of Practices and Technologies, vol. 11, no. 21, pp. 147–158. [Google Scholar]
16. R. Sangeetha and K. S. Murthy. (2017). “A novel approach for detection of breast cancer at an early stage using digital image processing techniques,” in Int. Conf. on Inventive Systems and Control (ICISCCoimbatore, India. [Google Scholar]
17. Z. Lai and H. Deng. (2018). “Medical image classification based on deep features extracted by deep model and statistic feature fusion with multilayer perceptron,” Computational Intelligence and Neuroscience, vol. 2018, pp. 1–13. [Google Scholar]
18. G. Ahmad, M. A. Khan, S. Abbas, A. Athar, B. S. Khan et al. (2019). , “Automated diagnosis of hepatitis B using multilayer mamdani fuzzy inference system,” Journal of Healthcare Engineering, vol. 2019, no. 1, pp. 1–11. [Google Scholar]
19. H. Li, J. Wang, H. Du and H. R. Karimi. (2017). “Adaptive sliding mode control for Takagi–Sugeno fuzzy systems and its applications,” IEEE Transactions on Fuzzy Systems, vol. 26, no. 2, pp. 531–542. [Google Scholar]
20. B. Haznedar and A. Kalinli. (2018). “Training ANFIS structure using simulated annealing algorithm for dynamic systems identification,” Neurocomputing, vol. 302, pp. 66–74. [Google Scholar]
21. K. Stapor. (2017). “Evaluating and comparing classifiers: Review, some recommendations and limitations,” in Int. Conf. on Computer Recognition Systems, Springer, Poland, pp. 12–21. [Google Scholar]
22. P. V. De Campos Souza, L. C. B. Torres, A. J. Guimaraes, V. S. Araujo, V. J. S. Araujo et al. (2019). , “Data density-based clustering for regularized fuzzy neural networks based on nullneurons and robust activation function,” Soft Computing, vol. 23, no. 23, pp. 12475–12489. [Google Scholar]
23. Y. Guo, X. Yin, X. Zhao, D. Yang and Y. Bai. (2019). “Hyperspectral image classification with SVM and guided filter,” EURASIP Journal on Wireless Communications and Networking, vol. 2019, no. 1, pp. 56. [Google Scholar]
24. I. A. Lawal. (2018). “Incremental SVM learning,” in Learning from Data Streams in Evolving Environments, 1 ed., vol. 41. Switzerland: Springer, pp. 279–296. [Google Scholar]
25. M. A. Khan, S. Abbas, A. Atta, A. Ditta, H. Alquhayz et al. (2020). , “Intelligent cloud based heart disease prediction system empowered with supervised machine learning,” Computers, Materials & Continua, vol. 65, no. 1, pp. 139–151. [Google Scholar]
26. S. Y. Siddiqui, A. Athar, M. A. Khan, S. Abbas, Y. Saeed et al. (2020). , “Modelling, simulation and optimization of diagnosis cardiovascular disease using computational intelligence approaches,” Journal of Medical Imaging and Health Informatics, vol. 10, no. 5, pp. 1005–1022. [Google Scholar]
27. P. Mohanaiah, P. Sathyanarayana and L. Gurukumar. (2013). “Image texture feature extraction using GLCM approach,” International Journal of Scientific and Research Publications, vol. 3, no. 5, pp. 1–5. [Google Scholar]
28. S. Shahzadi, B. Khaliq, M. Rizwan and F. Ahmad. (2020). “Security of cloud computing using adaptive neural fuzzy inference system,” Security and Communication Networks, vol. 2020, no. 8, pp. 1–15. [Google Scholar]
 | This work is licensed under a Creative Commons Attribution 4.0 International License, which permits unrestricted use, distribution, and reproduction in any medium, provided the original work is properly cited. |