DOI:10.32604/cmc.2021.013159
| Computers, Materials & Continua DOI:10.32604/cmc.2021.013159 | |
| Review |
Osteoporosis Prediction for Trabecular Bone using Machine Learning: A Review
1Department of Computer Science, Government College University, Faisalabad, Pakistan
2Faculty of Information and Communication Technology (FICT), Universiti Tunku Abdul Rahman (UTAR), Kampar, Malaysia
3Department of Computer Science, School of Systems and Technology, University of Management and Technology, Lahore, Pakistan
4Department of Computer Science, Lahore Garrison University, Lahore, Pakistan
*Corresponding Author: Vasaki a/p Ponnusamy. Email: vasaki@utar.edu.my
Received: 28 July 2020; Accepted: 05 October 2020
Abstract: Trabecular bone holds the utmost importance due to its significance regarding early bone loss. Diseases like osteoporosis greatly affect the structure of the Trabecular bone which results in different outcomes like high risk of fracture. The objective of this paper is to inspect the characteristics of the Trabecular Bone by using the Magnetic Resonance Imaging (MRI) technique. These characteristics prove to be quite helpful in studying different studies related to Trabecular bone such as osteoporosis. The things that were considered before the selection of the articles for the systematic review were language, research field, and electronic sources. Only those articles written in the English language were selected as it is the most prominent language used in scientific, engineering, computer science, and biomedical researches. This literature review was conducted on the articles published between 2006 and 2020. A total of 62 research papers out of 1050 papers were extracted which were according to our topic of review after screening abstract and article content for the title and abstract screening. The findings from those researches were compiled at the end of the result section. This systematic literature review presents a comprehensive report on scientific researches and studies that have been done in the medical area concerning trabecular bone.
Keywords: Magnetic resonance imaging; high resolution; trabecular bone (TB); bone structure; machine learning
There are two types of bone tissues found in the human body, one of which is cancellous bone or trabecular bone. The trabecular bone is found in the skull, pelvic bones, ribs, vertebrae in the spinal column, and at the ends of long bones. The trabecular bone holds the utmost importance due to its significance regarding early bone loss [1,2]. Diseases like osteoporosis greatly affect the structure of the Trabecular bone which results in different outcomes like high risk of fracture [3]. The MRI technique would be restricted to the skeletal locales where a trabecular substance is present in higher concentrations, for example, spine, proximal femur, and distal forearm. Estimations at these locations would mirror the bone misfortune because of the increased metabolic activity [4].
An important parameter to study the changes in bone structure is Bone mineral density (BMD). This parameter accounts for the skeletal changes in Trabecular bones [5–9] resulting in alterations in bone strength. MRI is a rising innovation for gaining high-goals images of Trabecular bone structure. Traditionally, in MRI, bone yields low flag and seems dim because of the generally low wealth of protons and a to a great degree short T2 unwinding time like most strong state tissues [10]. Data in regards to structure, topology, and introduction of the Trabecular bone system and also cortical thickness and zone can be extricated from the images by implementing computerized post-preparing methods [11]. In this paper, the new preparation for magnetic resonance imaging has been studies which gives proof that the virtual bone biopsy can precisely and reproducibly recognize the 3D Trabecular design in clinical circumstances [12]. Magnetic reverberation imaging evaluation of the bone structure and micro-architecture has been proposed as another technique to survey bone quality and crack hazard in vivo [13].
Furthermore, Magnetic resonance images [14–19] might be utilized to inspect bones, joints, and subtle tissues, e.g., ligament, muscles, and muscles for injuries or the immediacy of simple differences from the norm or different conditions, e.g., tumor, fiery malady, intrinsic anomalies, osteonecrosis, bone marrow ailment, and herniation or degeneration of plates of the spinal line, X-rays might be utilized to evaluate the aftereffects of restorative orthopedic strategies.
Content-based information retrieval (CBIR) going years, content-based information retrieval frameworks have been produced to sort out and use the profitable image sources adequately and effectively for different accumulations of the medical image. Most of the continuous systems in the biomedical field are planned to arrange and recuperate images as demonstrated by the auxiliary classes of their substance. According to a study conducted by Akgundogdu et al. [4], good results were seen in multi queries when utilizing a CBIR technique utilizing the Gray-level co-occurrence matrix (GLCM) centered surface features abstraction and categorization of features based on multi Support vector machine (SVM). The authors also found that the method was not proved to be good enough in the case of single queries [4]. A multi-level technique of extracting features and content-based image retrieval was introduced by [20]. During the first level, a support vector machine was used to classify the biomedical images into two categories [3]. In the second level, the K nearest neighbor (KNN) algorithm was used to further classify the two types of images obtained through SVM [3]. This method was also suitable for the multi queries as the previous one. The efficiency of this method was increased considerably due to the use of two classifiers at two levels. However, the study does not debate the performance progress of the image recovery procedure. The same optimization in the image retrieval process was seen as evident in the study of [3] due to two levels of classification. This approach is also not suitable for a single image query. K nearest neighbor and SVM classifier approaches were used by Kalbkhani et al. [11] to liken the results of classification done on the biomedical MRI. The MRIs were categorized into 8 dissimilar categories and the results showed that better results were generated using the SVM approach as compared to KNN [10]. Yudong et al. was used as a Backpropagation neural network (BPNN) technique. To classify MRI images while the wavelet transform was utilized to excerpt texture structures [6,10]. This hybrid approach to classification generated good results. Carried out a study in which two classes (normal and abnormal) were suggested to categorize the biomedical MRI images. Various classifiers were utilized to compare these categories. It was also cleared that SVM generates better results as compared to the Artificial neural network (ANN) [11].
This paper represents, by direct examination with the first technique, the subjective enhancement for the premise of mimicked MRI acquired from the engineered plate and pole structures and high goal images of Trabecular bone examples. Besides proceeding to infer a strategy for deciding the affectability of the method, as far as the span of the littlest recognizable trabecular plates, poles, and holes in plates. At long last, by reprocessing information from a recently distributed clinical investigation, this appears that the new preparing framework is sufficiently delicate to identify little changes in Trabecular engineering in light of medication mediation [2]. In summary, the objective of this paper is to present a detailed systematic review of machine learning in trabecular bone disease using MRI both from a methodology-driven and application perspective.
2.1 Data Sources and Search Strategies
The things that were considered before the selection of the articles for the systematic review were language, research field, and electronic sources. Only those articles were selected that were written in the English language as it is the most prominent language that is used in scientific, engineering, computer science, and biomedical researches. This literature review was conducted on the articles published between 2006 and 2020. The articles on the following topics were found using a web of science sources [21].
• Magnetic Resonance Imaging
• Machine Learning
• Trabecular Bone structural analysis
• Cancellous bone MRI
• Trabecular Bone MRI
• Osteoporosis
To combine the above-mentioned queries, AND operation was used. In this research, the term “image processing” was not used as it is a vast field and provides numerous results that are not specific to the field of this study. The purpose of searching for medical imaging was to gather the information related to image processing done on medical images, especially MRI. The substance of each theoretical research was at first dissected with the point of distinguishing proof of the utilization of elite registering structures to help the increasing speed of procedures of therapeutic image handling and investigation.
The search strategy extracted 1050 papers which were according to our topic of review after screening abstract and article content for the title and abstract screening shown in Fig. 1.
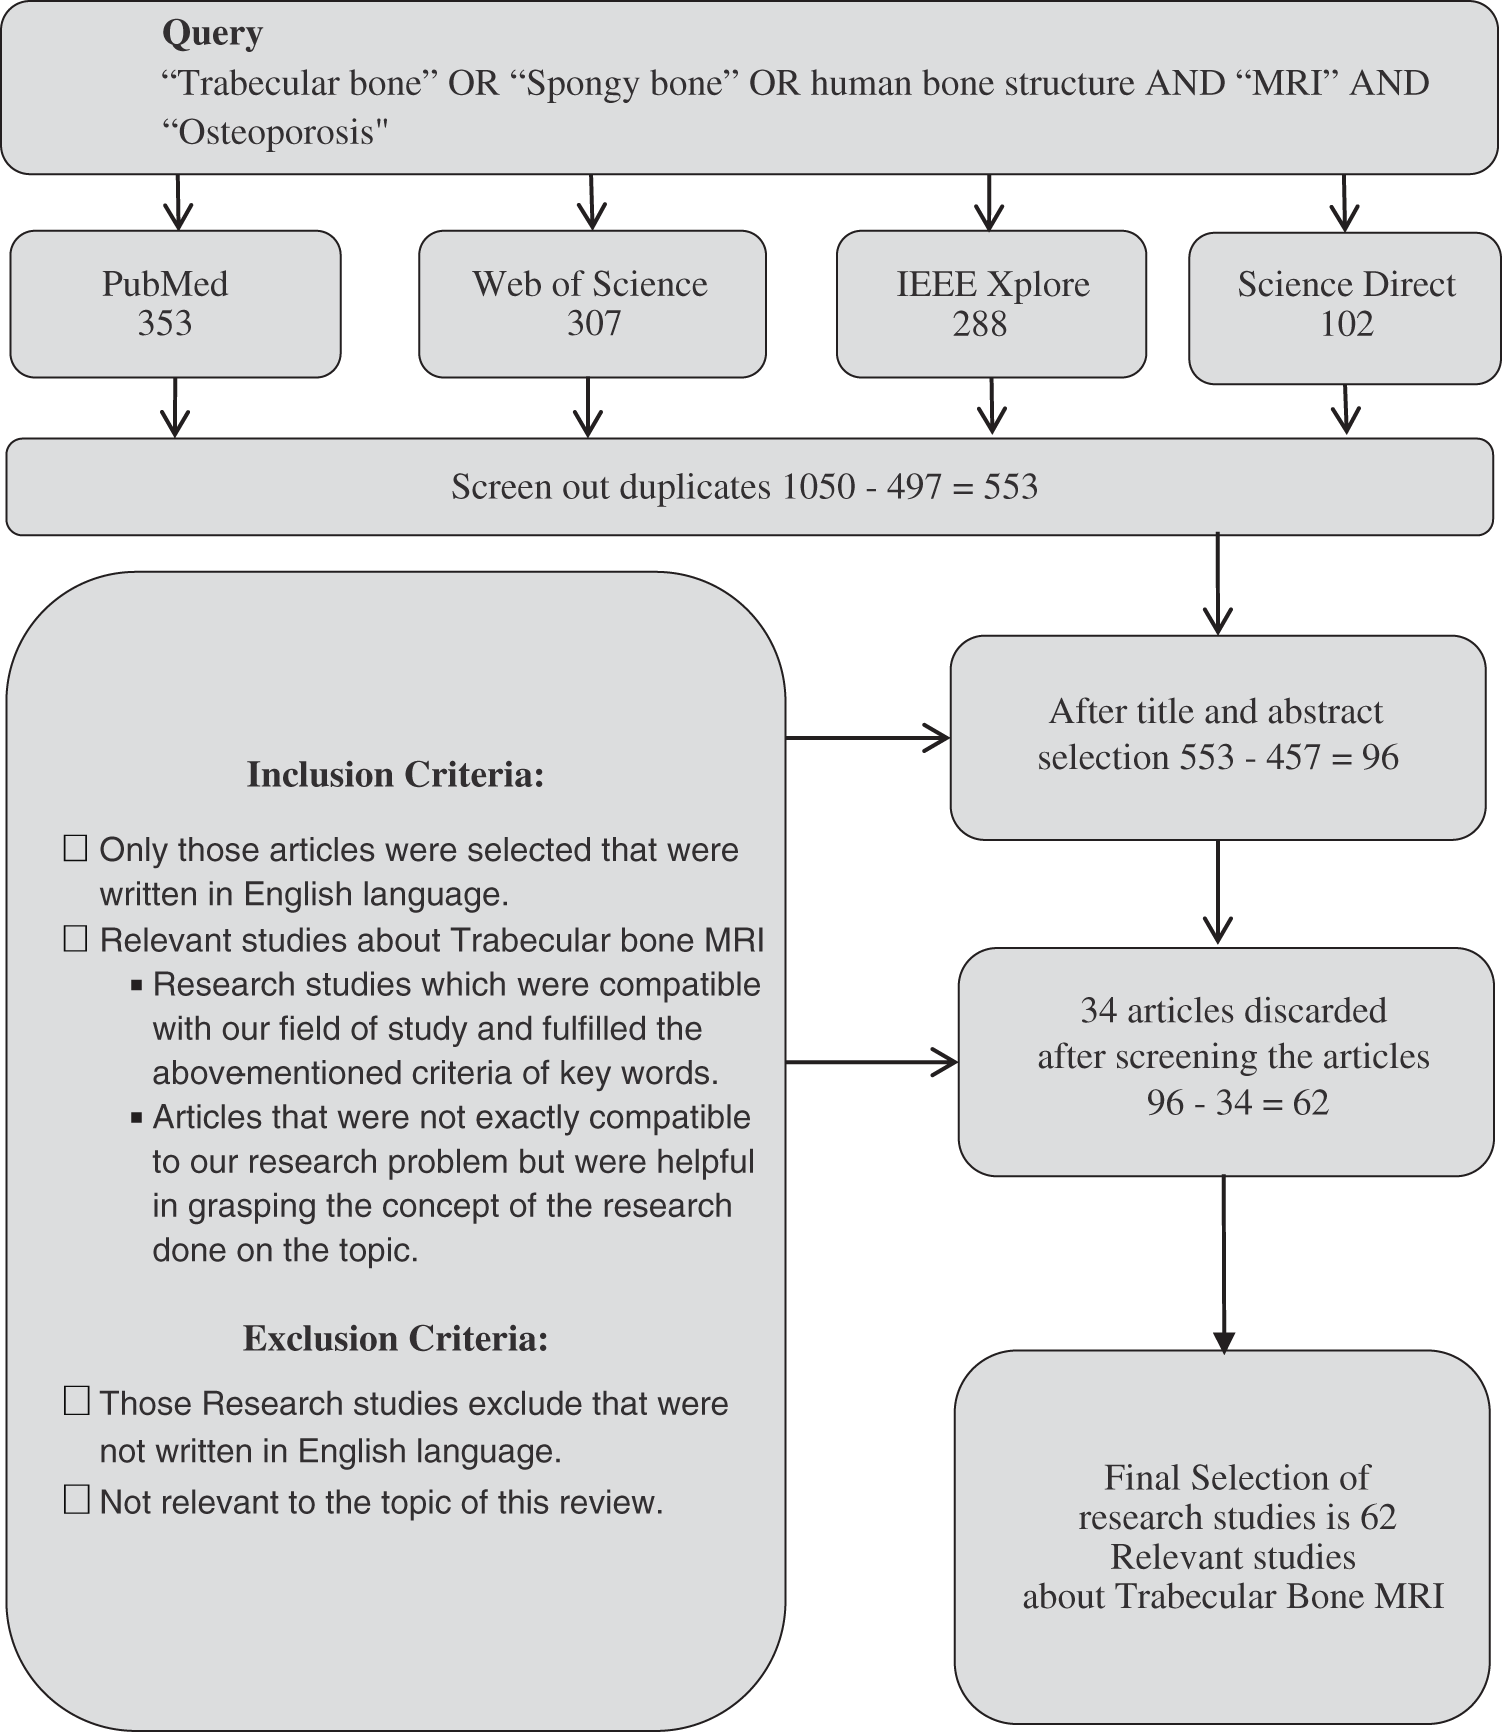
Figure 1: Article selection flow chart
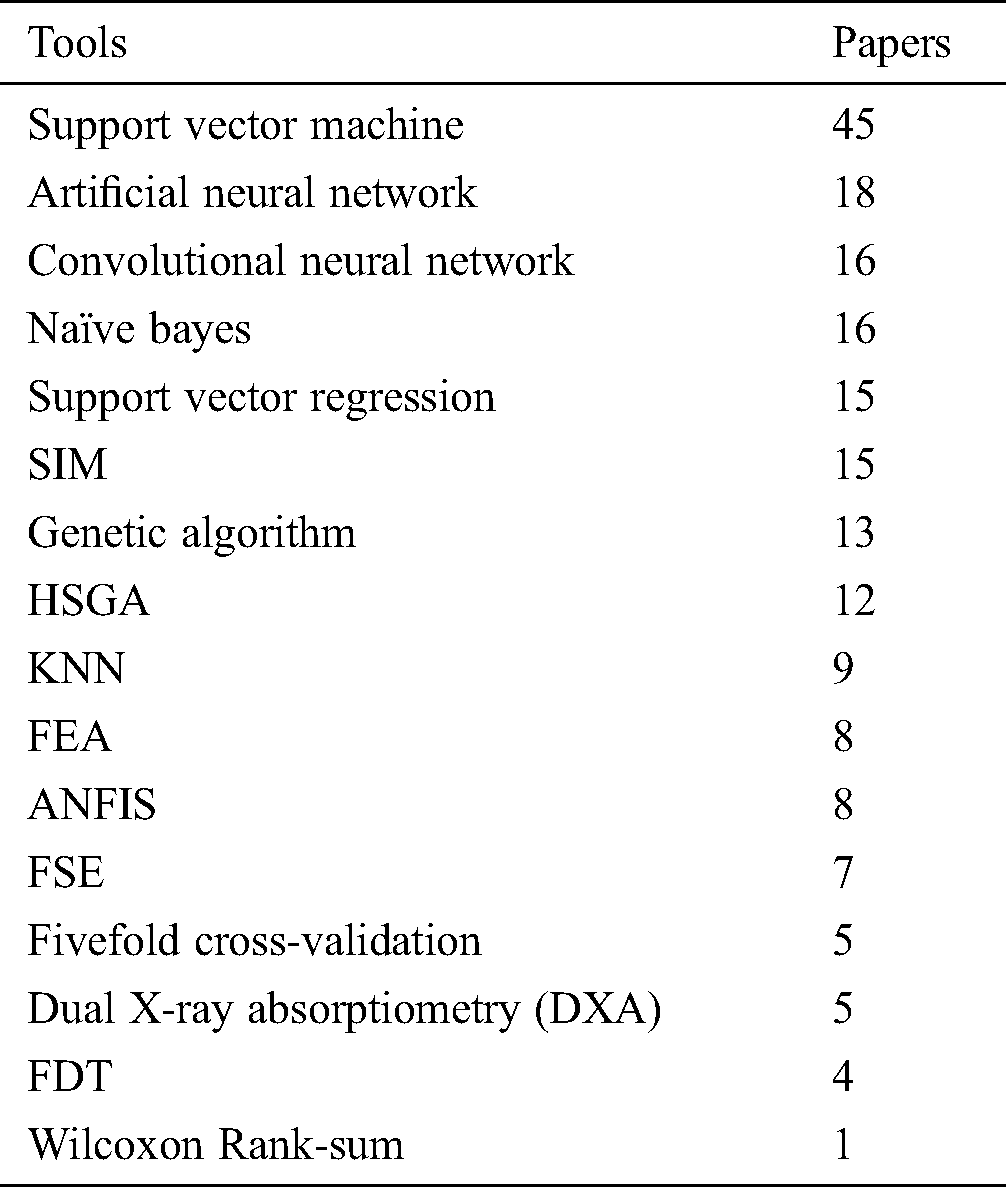
Different tools and techniques using in different papers of Trabecular bone MRI and how many papers use each technique see in Tab. 1.
Table 1: Tools and techniques used in selected studies
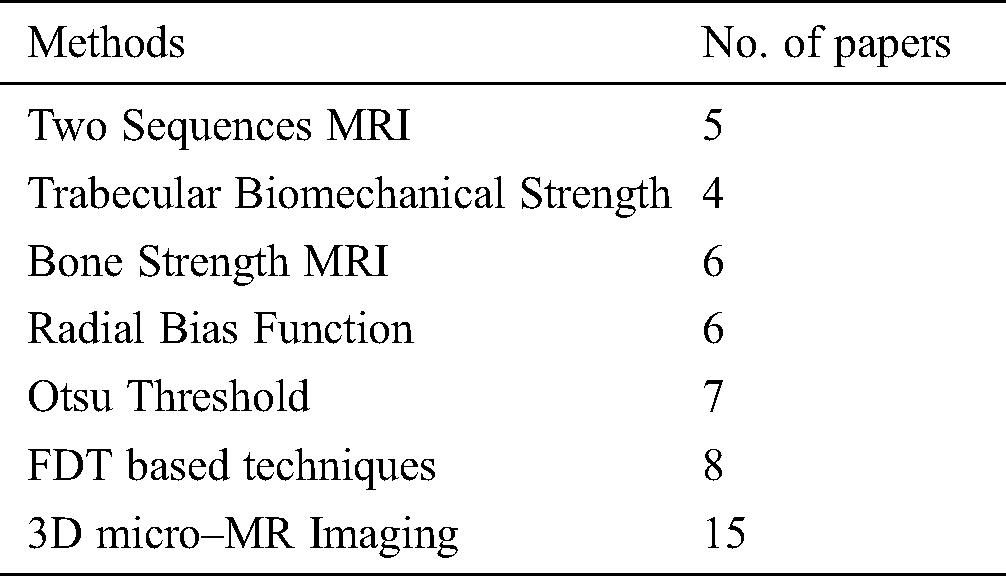
Different methods are used to get MRI of Trabecular bones. Tab. 2 defines which methodology is used in different papers.
Table 2: Methods used in a review
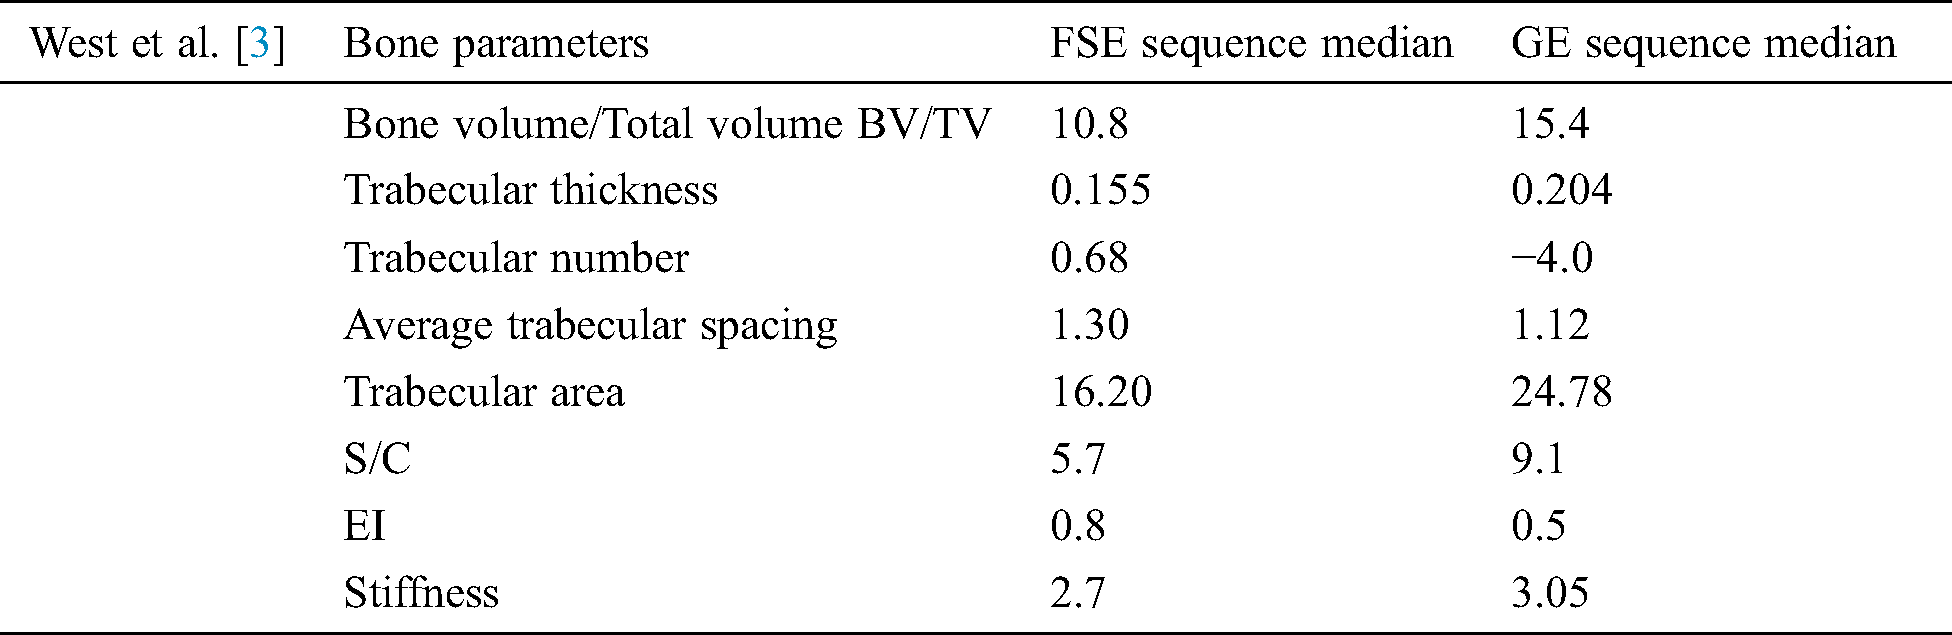
The study conducted by [3] used two sequences of MRI to liken different bone parameters. It was found that the median of the values of parameters was lowered in the case of the FSE sequence when the Wilcoxon Rank-sum test was applied as compared to the GE sequence [3]. These parameters are mentioned in Tab. 3.
Table 3: West et al. [3] used two sequence MRI technique and get these outputs mentioned
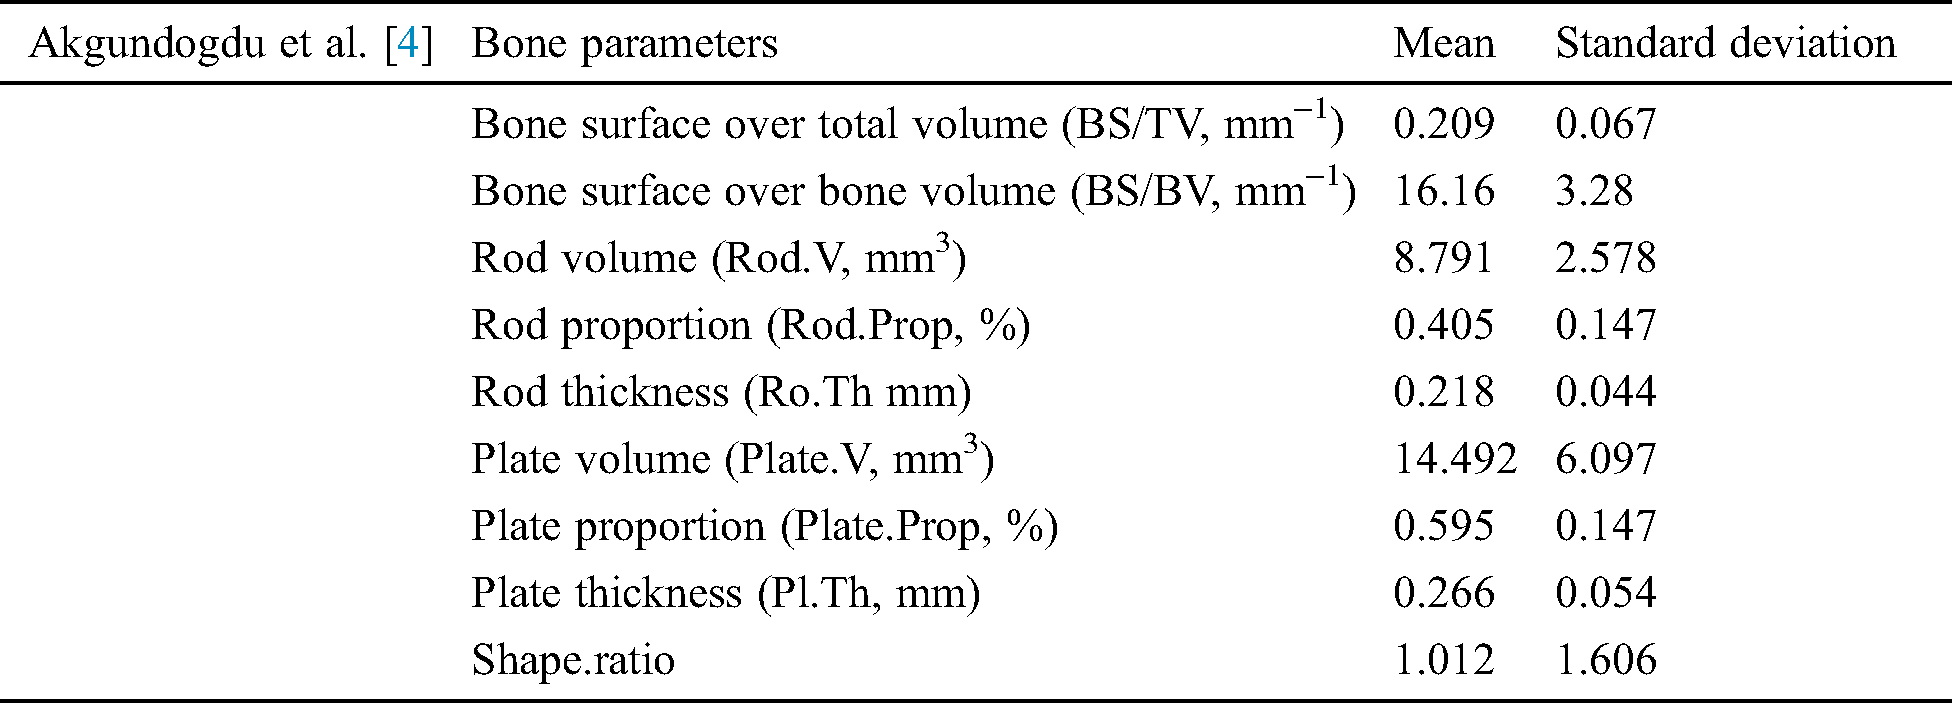
In [4] trabecular bone miniaturized scale engineering and its mechanical firmness created different image handling and recreation methods to explore. They assessed morphological, topological, and mechanical bone highlights utilizing man-made consciousness techniques [4]. A clinical report of joint and osteoporotic bone examples is completed on 2 populations. In grouping the distinctive examples have been thought about in exhibitions of Adaptive neuro-fuzzy inference system (ANFIS), examples have Support vector machines and Genetic algorithm (GA). With the Genetic algorithm, results demonstrate that the best division achievement (100%) is accomplished. Using Hybrid skeleton graph analysis (HSGA) and Finite element analysis (FEA) the different trabecular bone factors were analyzed [4]. These factors are detailed in Tab. 4.
Table 4: Akgundogdu et al. [4] used two sequence MRI and get these results
3.2.2 Trabecular Bio-Mechanical Strength
In [22] used the biomechanical strength of trabecular bone MR imaging techniques to determine. Datasets from knee joints were taken to determine the geometrical structure of Trabecular bone and machine learning was used for feature extraction of the specimens. The Scaling index method (SIM) was used to approximate the mechanical as well as symmetrical properties of the 67 bone cubes of trabecular bone that were taken from the knee joints. It was found that SIM enhanced the capability of MRI to demonstrate the quality of bone. The strength of the Trabecular bone was determined by Yield stress (YS). For each bone cube specimen, SIM, and another feature estimation method, known as Bone Volume fraction (BVF) was used to calculate the extracted features. From these features, two algorithms namely Support vector regression (SVR) [23] and linear multi regression analysis were used to estimate the yield strength of the bones.
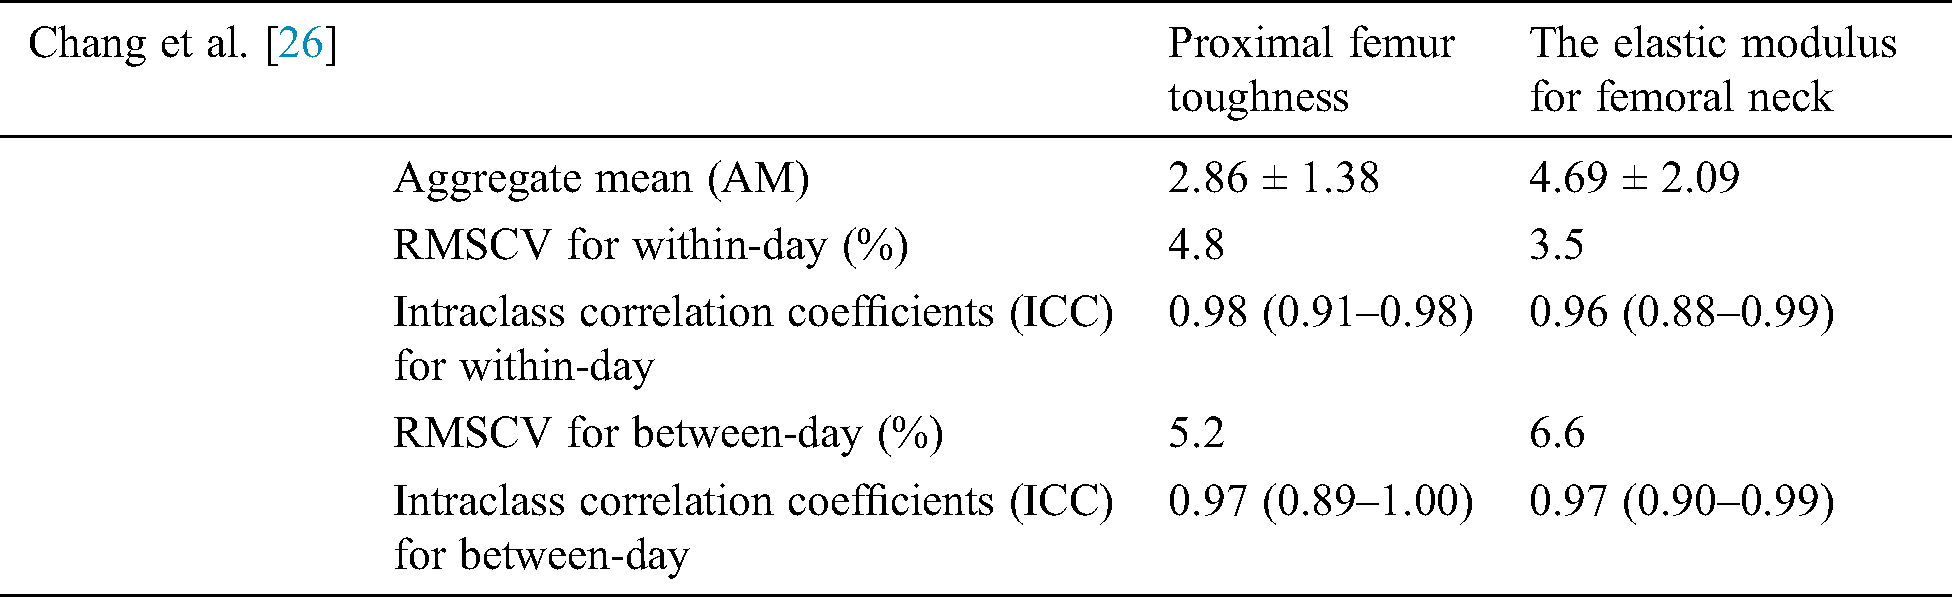
Baum et al. [24] carried out a study in which the motivation was to determine whether the research for bone strength improves using the MRI and Dual X-ray absorptiometry (DXA) approaches. MRI was used for cortical and Trabecular bone structure while DXA was used for bone mass to indicate trabecular bone strength [24]. Thirty-eight remaining lower arms were reaped from formal infixed human bodies [24]. Bone mineral content (BMC) and Bone mineral density (BMD) of the distal range were estimated utilizing X-ray absorptiometry. Cortical and Trabecular auxiliary proportions of the distal sweep were figured in high goals MRIs. Cortical estimates included normal cortical thickness and cross-sectional zone. Trabecular estimates included morphometric and surface parameters. The lower arms were biomechanically tried in a fall reenactment to quantify supreme outspread bone quality (disappointment stack). Relative spiral bone quality was controlled by isolating outspread disappointment stacks by age, weight file, span length, and normal sweep cross-sectional territory, individually [13,25,26]. Baum et al. [13] were also conducted to examine the reproducibility error in the structure of trabecular bone using MRI distal radius of 1.5 T and 3.0 T at a distal radius of 1.5 T MRI, the root means square reproducibility errors were in the range of 0.69 percent to 4.94 percent while at the distal radius of 3.0 T MRI the range error varied from 0.38 to 5.80 percent. The study found out that in the structure of trabecular bone, the errors were inside a suitable range and were almost similar for both distal radii. Chang et al. [26] Inspected the MRI reproducibility measure of proximal femur strength. The images of the femur were taken to assess its microstructure at 3 T. Stiffness for the femur and elastic modulus for the femoral neck were calculated. It was found that MRI produces suitable results of reproducibility measures for medical investigations. The study gives aggregate mean, day Root-mean-square coefficients of variation or RMS-CV (both for within-day and between-day) and Intra-class correlation coefficients (ICC) with confidence intervals for both parameters of bone architecture (proximal femur stiffness and femoral neck elastic modulus) [26]. These parameters are detailed in the following Tab. 5.
Table 5: Chang et al. [26] discuss the MRI reproducibility measures of proximal femur strength. The images were accessed in 3D to get effective results
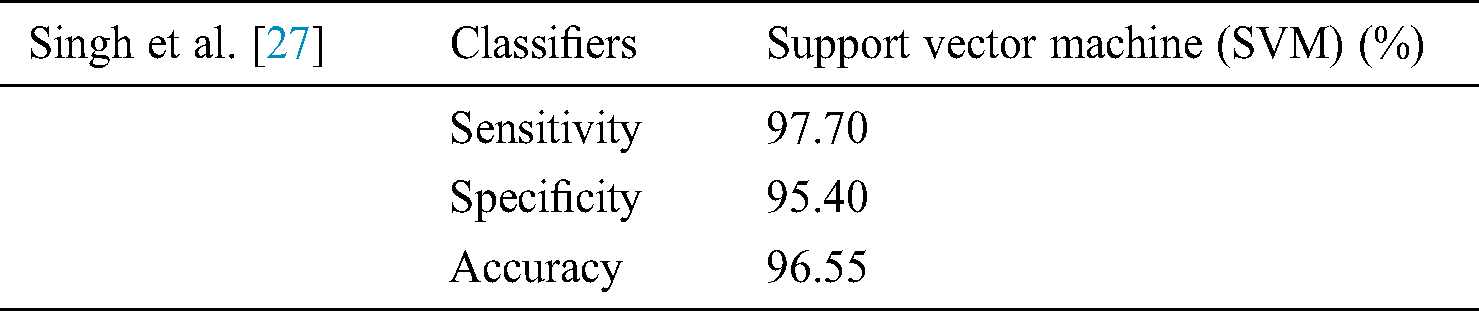
In [27] argued that the complex structure of bone makes it challenging for the complete automatic identification of diseases like osteoporosis. Double X-ray absorptiometry (DXA) is mostly used for such diagnosis. However, this strategy introduces explicit constraints, for example, the extensive size of the diagnostic equipment, a generally staggering expense, and restricted accessibility. The technique they suggested relies on the programmed preparation of X-beam images [27]. The X-ray image of the bone structure was measurably prepared and deliberately changed to remove unfair factual highlights of various requests. These bone features were analyzed through machine learning algorithms to categorize them into two groups, one with osteoporosis and the other one as the healthy subjects. The classifiers used for feature extraction used in this study are Artificial neural networks, Support vector machine, K-nearest neighbor (KNN), and Naive Bayes [27].
The outcomes are noteworthy as far as precision and time unpredictability. Exploratory outcomes show an order rate of 98 percent when utilizing the Support vector machine (classifier which is empowering for programmed osteoporosis conclusion utilizing bone X-beam image. The low time intricacy of the proposed technique makes it appropriate for continuous applications [27]. Results mentioned in Tab. 6.
Table 6: Singh et al. [27] use support vector machine on the X-Ray beam image
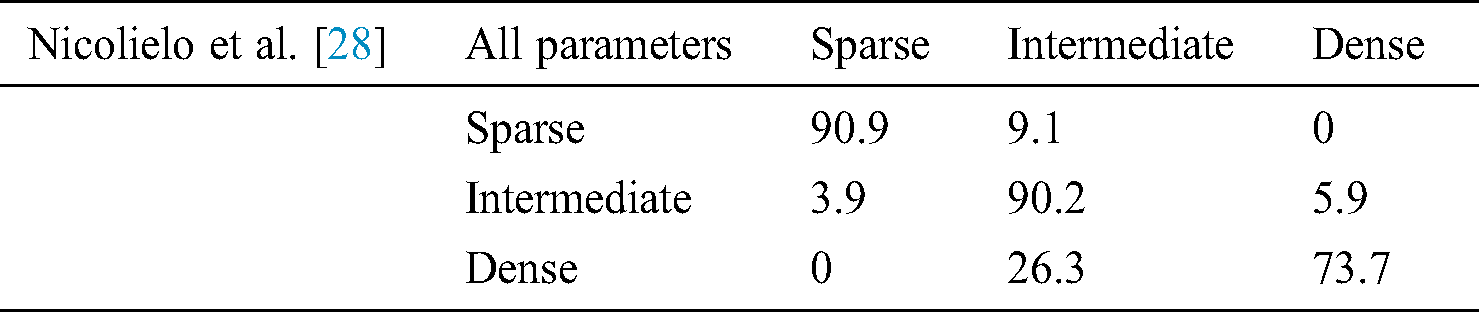
In [28] proposed a study to create and approve a computerized grouping technique that decides the trabecular bone example at embed site dependent on three-dimensional bone morphological parameters got from Cone-beam computed tomography (CBCT) images [29,30]. The point of the present investigation was to create and approve a programmed strategy to help bone quality grouping at the embed site dependent on three-dimensional morphological attributes of the trabecular bone [28]. The productivity of this PC based characterization was then contrasted and the oral radiologists performed the customary emotional assessment [28]. All these parameters are detailed in the following Tab. 7.
Table 7: Classification of trabecular bone patterns using linear discriminant analysis based on quality parameters [28]
Sapthagirivasan et al. [30] proposed a study in which digital hip radiographs were used to examine the trabecular boundness. They asserted that this technique produces good results in finding out the diseases and shortcomings like low Bone mineral density (BMD) and osteoporosis. The major purpose of the research was to examine the capability of the SVM algorithm to extract features from trabecular bone structure using digital hip radiographs so that lower bone mineral density could be identified [30,31]. SVM based Computer-aided diagnosis (CAD) framework was utilized in this study to assess the risk of trabecular bone diseases. The features of trabecular bone such as alignment, firmness of spur, delta, and boundness were examined.
Classification based on Radial bias function (RBF) was also carried out [30]. Good accuracy of results was achieved in this study due to the use of fivefold cross-validation analysis. Hence, it was proposed that SVM based computer-aided diagnosis is an optimal framework for estimating risk related to osteoporosis. Wilcoxon rank test was performed to measure the performance of trabecular bone features.
Kim et al. [31] researched to find out the resolution of MR imaging to detect the structural parameters of trabecular bones. The study also found the accurate and acceptable resolution of MRI that is necessary for accurate assessment of trabecular parameters.
Otsu threshold technique was used by Kim et al. [31] to carry out computer-generated simulation for the trabecular bone. The guideline explanation behind this examination is to apply a bone division computation dependent on the Otsu edge method for images with differentiating objectives, to attain trabecular bone factors estimations, to evaluate the effect of the objectives on trabecular bone parameters, and to choose an imaging objective that is sufficiently high for correct fundamental examination and can be cultivated inside a normal compass time for patients. A 4.7-T Bruker Bio-Spec magnetic resonance imaging RI scanner was used to image ten distal femoral condyle samples. For that purpose a 3D firm large-angle spin-echo system having numerous iso-cubic voxels sizes (65, 130, 160, 196, 230, and 260 mm were used The parameters that were determined in the study were [31]: Conventional bone parameters • Structural bone parameters • Skeleton-based local trabecular thickness. The result of this investigation proposes that the different bone parameters were very much protected up to 230 mm images [26].
Majumdar et al. [32] carried out a study in which they utilized high-resolution MRI along with computerized image analysis techniques to evaluate and describe the structure of trabecular bones in three dimensions [32–35]. Other measurements and assessments done in this study include anisotropy, and connectivity of human vertebral, femoral, and calcaneal samples [1]. The motivation behind this study was to prove the following areas:
• Calculated predictions show derived from magnetic resonance imaging for skeletal variations in the structure and alignment of trabecular bones [32,34].
• Three-dimensional structural features along with bone mineral density enhance modulus of elasticity estimation by the use of fabric tensor formulation [20,32].
• Three-dimensional structural features derived from Magnetic Resonance imaging along with bone mineral density enhance the anticipation of stiffness by utilizing numerous regression techniques, and the study also demonstrated that if the outcomes agreed with the ones generated utilizing high-resolution MR Trabecular images [20,32–35].
In [36] asserted that it is outstanding that BMD estimation is a broadly accessible method for distinguishing people with trabecular diseases like osteoporosis. Nonetheless, bone quality depends on the measure of material as well as on properties identified with bone quality. Huge advancement has been made in the improvement of MRI strategies for surveying bone status amid the previous years. This study examined the specialized standards, clinical applications, late advances, confinements, and future patterns of MRI methods accessible for the conclusion of trabecular disorders (osteoporosis) [36]. Utilizing MRI, bone status can be assessed either by T2* estimations, which are delicate to handle heterogeneity caused by powerlessness contrasts at the bone substance interfaces or by high-goals imaging. In T2* estimations, the decline in bone content and its rot attributes give helpful data about the structure and nature of the trabecular bone. T2* estimations have been performed at a few areas of the hub and fringe skeleton, for example, spine, proximal femur, and calcaneus. It has additionally been demonstrated that osteoporotic and ordinary subjects might be recognized utilizing T2* rot attributes. Notwithstanding T2* estimations, high-goals MR imaging might be utilized to measure trabecular bone design. Angle resound and turn reverberate arrangements have been utilized to acquire images in vitro and in vivo basically at fringe locales of the skeleton. A few image preparing strategies have been connected to gauge bone structure. Mechanical advances in Magnetic Resonance Imaging scanners offer energizing new conceivable outcomes in the bone investigation and may add to our comprehension of trabecular disorders.
In a study conducted by [37], a technique based on FDT is used to figure out the thickness of trabecular bone in low-goals routines that have been imagined. The Affectability of the strategy to image voxel size, revolution, and clamor has been inspected and the reproducibility of the technique is dissected. The thickness esteems have been observed to be steady for a wide scope of goals routines (from CT to MRI information in living organisms).This exploration presented another strategy named Fluffy separation change (FDT) to discover the thickness of trabecular bones this calculation technique could viably manage images gained at a voxel estimate equivalent to the average trabecular bone thickness. The strategy’s vigor is appeared based on—CT images of human trabecular bone, re-examined at continuously coarser goals, and after utilization of revolution and expansion of clamor as a way to reproduce the in vivo circumstance. Reproducibility of the system is shown with—CT images by differentiating histograms of thickness inside and between enlightening accumulations and with—MRI volume educational files of human volunteers imaged again and again. At last, within Vivo—MR images from an earlier report in rabbits exposed to corticosteroid exposure, it is exhibited that transient treatment bringing about trabecular diminishing can be measured with the new strategy [38,39]. A review of multi-modal data recovery for medicinal imaging contemplates, Also the design of an answer for programmed therapeutic image classification and recovery utilizing blends of content and image inquiries [40].
The total arrangement was planned and executed over an extensible open-source restorative imaging chronicle programming. The research also investigated the utilization of sight and sound data recovery to restorative imaging, alongside a conceivable arrangement with the simple combination in genuine PACS situations. By the by, the endeavors towards this objective are yet unfinished. The framework’s powerful precision of recovery relies upon the connected arrangement of restorative image recovery methods, which must be efficiently picked and assessed. An entire investigation of the arrangement as far as recovery will unquestionably be tended to in future work. Moreover, the classification database and the proposed classifier will comprise a free commitment independent from anyone else once the arranged enhancements and assessment strategies are finished. Meanwhile, this paper makes a brief portrayal of these segments and their coordination with the design [40].
In [41] looked at the capacity of computational biomechanics based on 3D micro–MR imaging to distinguish mechanical changes in trabecular bone and cortical bone in the distal tibia of episode renal transplant beneficiaries a half year after renal transplantation and contrast them and bone mineral thickness results [42]. It was found that the structural properties of trabecular bones were considerably lower in the period after 6 months as compared to baseline (2 weeks after the renal transplantation). The study found that magnetic resonance imaging-based micro–limited component examination proposes solidness and disappointment quality of the distal tibia decline over a 6-month interim after renal transplantation [41].
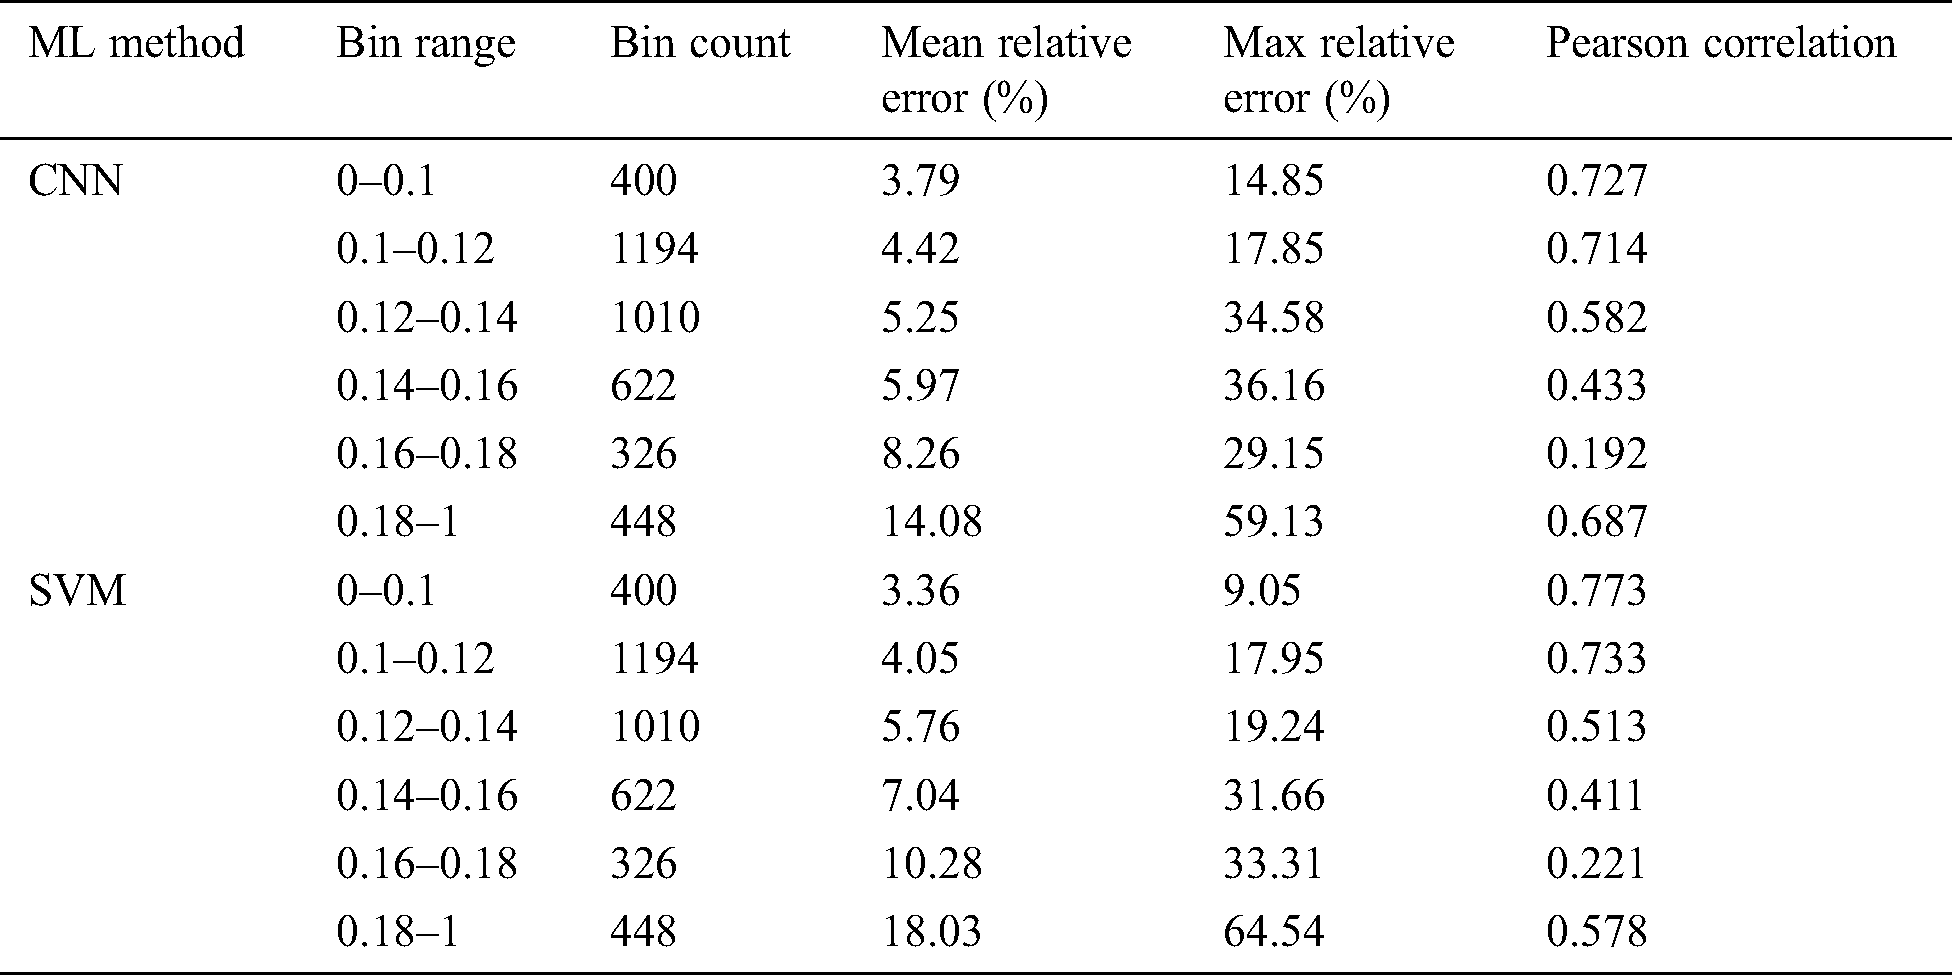
In [43] asserted that material science-based models, utilizing Limited component examination (LCE), have indicated an incredible guarantee in having the capacity to non-obtrusively gauge biomechanical amounts of enthusiasm for the setting of osteoporosis. In any case, these models have high computational interest, constraining their clinical selection. In this original copy, they present a profound learning model dependent on a Convolutional neural system (CNN) algorithm for foreseeing normal strain as an option in contrast to material science-based methodologies. The model is prepared on a huge database of artificially produced cancellous bone life structures, where the objective qualities are figured utilizing the material science-based FEA show. The execution of the readied model was assessed by differentiating the desires against material science set up together computations as for an alternate test enlightening record. The connection between profound learning and material science-based forecasts was shown to be considerably good [43], and no deliberate inclination was found in Bl and Altman examination. The CNN algorithm displays likewise performed superior to anything the recently presented SVM show which depended on carefully assembled highlights. Appeared differently to the material science-based figuring, ordinary execution time was reduced by an abundance of various occasions, inciting consistent examination of typical strain. The algorithm suggested in this study is shown in the following Tab. 8.
Table 8: Trabecular bone parameters error analysis [43]
3.2.8 Fractal and GLCM Features
In [44] researchers present Fractal analysis is very useful in image processing it can characterize the shape and greyscale complications. In this paper, the writer proposed the combination of box-counting with GLCM features. This magical combination proved better outcomes especially in the classification of medicinal texture from MRI and CT scan images of trabecular bones. It improves the clinical tests of osteoporosis pathologies. The author uses SVM for the classification of MATLAB it provides an accuracy of 85.71%.
3.2.9 Fourier Transforms and Neural Networks
In [45] authors presents a novel computerized methodology investigation of trabecular (or cancellous) bone structure. The procedure utilizes a Fourier change to create a “ghastly fingerprint” of an image. Data go to a neural system for differentiating after chief segments examination is connected to distinguish key highlights from the Fourier change. Testing this on a progression of 100 histological areas of trabecular bone from patients an ordinary gathering accurately classified over 90% of the aggregate with a general exactness of 77–84%. Such high achievement rates on a little gathering propose this may give a straightforward, yet incredible, the technique for distinguishing modifications in bone structure [16,21,44–55].
3.2.10 Geometric Features and Support Vector Regression
Huber et al. [22] presents the methodology of SVM on using supervised learning which can improve MR based purpose of trabecular bone quality. Two basic methodologies are used to mean square error and SIM to get the best prediction results.
A combination of BVF and SIM features a minimum prediction result of RMSE = 1.021 MPa was obtained and by using SVR. The prediction accuracy with only SIM features and SVR RMSE = 1.023 Mpa was better than BVF alone and multi regression RMSE = 1.073 Mpa.
3.2.11 Dixon Magnetic Resonance Images
In [56] authors presents the technique of DIXON MRI for improving the accuracy of thigh composition. The writer applies these algorithms to the dataset. (a) Four contrast images (b) Water and fat images [57] (c) Unsuppressed images were acquired from 190 subjects.
3.2.12 MRI–Based Three-Dimension
In [58] authors use a sum of 178 case knees were coordinated to 353 control knees. The entire joint (i.e., tibia, femur, and patella) 3-D bone shape vector had the most grounded extent of the impact, with knees in the most noteworthy tertile having a 3.0 occasions higher probability of creating occurrence radiographic knee OA a year later contrasted and those in the least tertile (95% certainty interim [95% CI] 1.8–5.0, P < 0.0001) [58–63]. The affiliations were much more grounded among knees that had typical radiographs previously occurrence.
It has been observed that bone’s architectural make-up despite its mineral thickness concerning osteoporosis has been emphasized in a couple of creations [3]. The hugeness of looking over this phenomenon is of great importance. This bone’s architectural makeup despite all its concerns has managed to capture the importance and emphasis in different creations. The high spatial objectives required to decide the bone’s microstructure in a clinically conceivable yield time is trying. At present, the most fitting modalities meeting these requirements in vivo are high objectives periphery quantitative imaging and MRI [64]. MRI can image diverse goals like the proximal femur yet as a rule with lower spatial objectives. This technique has recently started being used for the study of trabecular bone density and structure. It is a highly non-invasive technique which gives a highly resolved visualization of trabecular bones without having any kind of exposure to radiation. Methods of HR-MRI have been developed which is not only assess the bone microstructure but also its density. A visualization technique named ‘virtual bone biopsy’ has been proposed which is based on the three-dimensional analysis of trabecular bone structure from different specimens measured in vitro in high field MR. Images with an in-plane resolution of the order of 78–150 VM and a slice thickness of ~500 m are used for such purpose. These images make it possible to visualize the trabecular bone structure. However, if one wishes to use these structures and images in the prediction of osteoporotic fractures, one must think about the quantification of these structures. Techniques used for such purpose must be reliable, robust, and sensitive.
In like manner, multi-detector figured tomography has been used for high-objectives imaging of trabecular bone structure; in any case, the radiation partition is an obliging segment [21]. This article gives a blueprint of the differing modalities, particular essentials, and continuous upgrades in this creating field. These modalities include the three-dimensional imaging modalities, which are one of those which hold the potential to provide a better and comprehensive understanding of the bone’s microarchitecture. It is expected that this visualization and analysis of bone’s structure would provide an improved understanding of the current bone’s biology and have been predicted to have numerous applications in this field. With the help of recent technological advancements, the current anthropological applications of bone analysis could be honed by accelerating the research into the fourth-dimensional realm. This procedure would explore those methodological approaches that have been used by the anthropologists in history to assess the cortical bone structure. Experiences about imaging traditions and likewise image procedures for bone structure estimation are also inspected. The dedication of trabecular bone structure to bone quality is of critical energy for the examination of osteoporosis and diverse issue depicted by changes in the skeletal system. MRIs of trabecular bone has ascended as a promising strategy for looking over trabecular bone structure. With the current advancement in technology, the resolution of the images obtained after clinically acceptable scan times and the Signal to noise ratio (SNR) is promising that can be compared to the actual thickness of the trabecular bone. This type of limited and specific spatial resolutions could only be achieved by thoroughly going the processing and analysis algorithms that are designed to operate under such stale conditions. Three different structural parameters have been observed through these techniques. These parameters include characterizing scale, topology, and orientation. Further, it has been observed and proved that the bone loss caused by osteoporosis affects all three of these classes however the most prominent effect has been seen in topology, in which the trabecular plates are converted to rods with the latter’s eventual disconnection.
Let take a gander in vitro at the extents of trabecular structure procured using MR imaging and higher-objectives X-shaft tomographic microscopy imaging of strong shapes from human distal radii. Standard measures, for instance, trabecular bone zone parcel, trabecular width, trabecular isolating and trabecular number, surface-related measures, and 3D accessibility of the trabecular framework have been gotten from these photos [30].
The analysis of trabecular bone structure is an imperative substance in surveying bone delicacy, which is significant in the analysis of osteoporosis [65]. This is because the trabecular part of the bone is highly metabolic in comparison to its cortical part, which in turn helps specifically during the treatment processes. Various imaging systems have been utilized to break down bone structure noninvasively. Projection radiography has been utilized with great outcomes in the fringe skeleton; in any case, this is just a two-dimensional system, which reflects trabecular bone structure to a specific degree. High-goals tomographic procedures, for example, high-goals attractive reverberation imaging and processed Computed tomography (CT), have restricted spatial goals yet the possibility to image three-dimensional design of trabecular bone. This technique works on the basic principle of the superimposition of various X-ray images taken from different angles. Superimposition is done via computer processing which then provides a cross-sectional view of the bone, blood vessels, and even the soft tissues inside a body. With the advances in attractive reverberation equipment and programming and new CT systems, non-invasive imaging of trabecular bone is ending up increasingly plausible.
MR imaging securing and preparing strategies point by point, this systematic literature review presents a comprehensive report on the scientific researches and studies that have been done in the medical area concerning trabecular bone architecture and MRI imaging and this study gives a way to catching transient miniaturized scale basic and mechanical aggravations of bone in vivo. The importance of these researches and techniques in osteoporotic analysis has also been discussed. Since these analyses help to understand the current condition of bones based on aggregated sum densities of cortical and trabecular bones since this disease affects the bone density directly. This analysis also helps to predict the risk of fractures. Ongoing information demonstrates that mechanical parameters got from micro-MR imaging-based micro–limited component investigation at goals feasible in vivo associate well with those acquired by methods for the reference standard, thin-area small scale CT [66]. The studies included in this literature review describe different algorithms for feature extraction and determination of parameters related to bone structure. This literature review is also helpful for finding out the most robust technique of computerized computation or image analysis for trabecular imaging.
Funding Statement: The authors received no specific funding for this study.
Conflicts of Interest: The authors declare that they have no conflicts of interest to report regarding the present study.
References
1. L. Q. Charles, J. F. Magland, C. S. Rajapakse, X. E. Guo, X. H. Zhang . (2008). et al., “Implications of resolution and noise for in vivo micro-MRI of trabecular bone,” Medical Physics, vol. 35, no. 12, pp. 5584–5594.
2. R. Krug, A. J. Burghardt, S. Majumdar and T. M. Link. (2010). “High-resolution imaging techniques for the assessment of osteoporosis,” Clinical Radiology, vol. 48, no. 3, pp. 601–621.
3. S. L. West, C. S. Rajapakse, T. Rayner, R. Miller, M. A. Slinger . (2018). et al., “The reproducibility of measuring trabecular bone parameters using a commercially available high-resolution magnetic resonance imaging approach: A pilot study,” Bone Reports, vol. 8, pp. 180–186.
4. A. Akgundogdu, R. Jennane, G. Aufort, C. L. Benhamou and O. N. Ucan. (2010). “3D image analysis and artificial intelligence for bone disease classification,” Journal of Medical Systems, vol. 34, no. 5, pp. 815–828.
5. A. Bilal, A. Shahzad, L. Farina, E. Parle, L. M. Namara . (2020). et al., “Dielectric characterization of diseased human trabecular bones at microwave frequency,” Medical Engineering & Physics, vol. 78, pp. 21–28.
6. R. Cesar, J. B. Castillero, R. R. Ramos, C. A. M. Pereira, H. Zanin . (2020). et al., “Relating mechanical properties of vertebral trabecular bones to osteoporosis,” Computer Methods in Biomechanics and Biomedical Engineering, vol. 23, no. 2, pp. 54–68.
7. P. M. S. G. Guedes, A. Zamarioli, I. I. Botega, R. A. B. Silva, J. P. M. Issa . (2019). et al., “Undernutrition impairs the quality of growth plate and trabecular and cortical bones in growing rats,” Acta Cirurgica Brasileira, vol. 34, no. 3, pp. 51–63.
8. S. M. L. Restrepo, C. F. R. Gutierrez, H. V. Gómez and M. E. R. García. (2019). “Study of microstructural, structural, mechanical, and vibrational properties of defatted trabecular bovine bones: Natural sponges,” Materials for Biomedical Engineering, pp. 441–485, . [Online]. Available: https://www.sciencedirect.com/science/article/pii/B9780128169018000146.
9. M. F. Martínez, F. J. G. García, Y. G. Sánchez and P. L. Jornet. (2018). “An intelligent system to study the fractal dimension of trabecular bones,” Journal of Intelligent & Fuzzy Systems, vol. 35, no. 4, pp. 4533–4540.
10. M. D. Rodrigo. (2019). “Successful classification of experimental bone surface modifications (BSM) through machine learning algorithms: A solution to the controversial use of BSM in paleoanthropology?,” Archaeological and Anthropological Sciences, vol. 11, no. 6, pp. 2711–2725. [Google Scholar]
11. H. Kalbkhani, M. G. Shayesteh and B. Z. Vargahan. (2013). “Robust algorithm for brain magnetic resonance image (MRI) classification based on GARCH variances series,” Biomedical Signal Processing and Control, vol. 8, no. 6, pp. 909–919. [Google Scholar]
12. M. S. Lew, N. Sebe, C. Djeraba and R. Jain. (2006). “Content-based multimedia information retrieval: State of the art and challenges,” ACM Transactions on Multimedia Computing, Communications, and Applications, vol. 2, no. 1, pp. 1–19. [Google Scholar]
13. T. Baum, Y. Dutsch, D. Muller, R. Monetti, I. Sidorenko . (2012). et al., “Reproducibility of trabecular bone structure measurements of the distal radius at 1.5 and 3.0 T magnetic resonance imaging,” Journal of Computer Assisted Tomography, vol. 36, no. 5, pp. 623–626. [Google Scholar]
14. B. J. Erickson, P. Korfiatis, Z. Akkus and T. L. Kline. (2017). “Machine learning for medical imaging,” Radiographics, vol. 37, no. 2, pp. 505–515. [Google Scholar]
15. M. L. Giger. (2018). “Machine learning in medical imaging,” Journal of the American College of Radiology, vol. 15, no. 3, pp. 512–520. [Google Scholar]
16. M. N. Wernick, Y. Yang, J. G. Brankov, G. Yourganov and S. C. Strother. (2010). “Machine learning in medical imaging,” IEEE Signal Processing Magazine, vol. 27, no. 4, pp. 25–38. [Google Scholar]
17. M. J. Willemink, W. A. Koszek, C. Hardell, J. Wu, D. Fleischmann . (2020). et al., “Preparing medical imaging data for machine learning,” Radiology, vol. 295, no. 1, pp. 4–15. [Google Scholar]
18. L. O. Rayner, J. Dunnmon, G. Carneiro and C. Ré. (2020). “Hidden stratification causes clinically meaningful failures in machine learning for medical imaging,” in Proc. of the ACM Conf. on Health, Inference, and Learning, Toronto Ontario Canada, pp. 151–159. [Google Scholar]
19. G. Currie, K. E. Hawk, E. Rohren, A. Vial and R. Klein. (2019). “Machine learning and deep learning in medical imaging: Intelligent imaging,” Journal of Medical Imaging and Radiation Sciences, vol. 50, no. 4, pp. 477–487. [Google Scholar]
20. D. C. Newitt, B. V. Rietbergen and S. Majumdar. (2002). “Processing and analysis of in vivo high-resolution MR images of trabecular bone for longitudinal studies: Reproducibility of structural measures and micro-finite element analysis derived mechanical properties,” Osteoporosis International, vol. 13, no. 4, pp. 278–287. [Google Scholar]
21. T. Tahir, G. Rasool and C. Gencel. (2016). “A systematic literature review on software measurement programs,” Information and Software Technology, vol. 73, pp. 101–121. [Google Scholar]
22. M. B. Huber, S. L. Lancianese, M. B. Nagarajan, I. Z. Ikpot, A. L. Lerner . (2011). et al., “Prediction of biomechanical properties of trabecular bone in MR images with geometric features and support vector regression,” IEEE Transactions on Biomedical Engineering, vol. 58, no. 6, pp. 1820–1826. [Google Scholar]
23. C. C. Yang, M. B. Nagarajan, M. B. Huber, J. C. Gamio, J. S. Bauer . (2014). et al., “Improving bone strength prediction in human proximal femur specimens through geometrical characterization of trabecular bone microarchitecture and support vector regression,” Journal of Electronic Imaging, vol. 23, no. 1, pp. 13013. [Google Scholar]
24. T. Baum, M. Kutscher, D. Muller, C. Rath, F. Eckstein . (2013). et al., “Cortical and trabecular bone structure analysis at the distal radius prediction of biomechanical strength by DXA and MRI,” Journal of Bone and Mineral Metabolism, vol. 31, no. 2, pp. 212–221. [Google Scholar]
25. C. T. Wu, H. T. Chang, C. Y. Wu, S. W. Chen, S. Y. Huang . (2020). et al., “Machine learning recommends affordable new Ti alloy with bone-like modulus,” Materials Today, vol. 34, pp. 41–50. [Google Scholar]
26. G. Chang, A. H. Cho, H. Rusinek, S. Honig, A. Mikheev . (2015). et al., “Measurement reproducibility of magnetic resonance imaging-based finite element analysis of proximal femur microarchitecture for in vivo assessment of bone strength,” Magnetic Resonance Materials in Physics, Biology and Medicine, vol. 28, no. 4, pp. 407–412. [Google Scholar]
27. A. Singh, M. K. Dutta, R. Jennane and E. Lespessailles. (2017). “Classification of the trabecular bone structure of osteoporotic patients using machine vision,” Computers in Biology and Medicine, vol. 91, pp. 148–158. [Google Scholar]
28. L. F. P. Nicolielo, J. V. Dessel, G. H. V. Lenthe, I. Lambrichts and R. Jacobs. (2018). “Computer-based automatic classification of trabecular bone pattern can assist radiographic bone quality assessment at dental implant site,” British Journal of Radiology, vol. 91, no. 1092, 20180437. [Google Scholar]
29. D. Shrivastava, S. Sanyal, A. K. Maji and D. Kandar. (2020). “Bone cancer detection using machine learning techniques,” Smart Healthcare for Disease Diagnosis and Prevention, vol. 20, pp. 175–183. [Google Scholar]
30. V. Sapthagirivasan and M. Anburajan. (2013). “Diagnosis of osteoporosis by extraction of trabecular features from hip radiographs using support vector machine: An investigation panorama with DXA,” Computers in Biology and Medicine, vol. 43, no. 11, pp. 1910–1919. [Google Scholar]
31. N. Kim, J. Lee, Y. Song, H. J. Kim, J. S. Yeom . (2012). et al., “Evaluation of MRI resolution affecting trabecular bone parameters: Determination of acceptable resolution,” Magnetic Resonance in Medicine, vol. 67, no. 1, pp. 218–225. [Google Scholar]
32. S. Majumdar, M. Kothari, P. Augat, D. C. Newitt, T. M Link . (1998). et al., “High-resolution magnetic resonance imaging: Three-dimensional trabecular bone architecture and biomechanical properties,” Bone, vol. 22, no. 5, pp. 445–454. [Google Scholar]
33. S. Majumdar, H. K. Genant, S. Grampp, M. D. Jergas, D. C. Newitt . (1994). et al., “Analysis of trabecular bone structure in the distal radius using high-resolution MRI,” European Radiology, vol. 4, no. 6, pp. 517–524.
34. S. Majumdar, H. K. Genant, S. Grampp, D. C. Newitt, V. H. Truong . (1997). et al., “Correlation of trabecular bone structure with age, bone mineral density, and osteoporotic status: in vivo studies in the distal radius using high resolution magnetic resonance imaging,” Journal of Bone and Mineral Research, vol. 12, no. 1, pp. 111–118. [Google Scholar]
35. S. Majumdar, T. M. Link, P. Augat, J. C. Lin, D. Newitt . (1999). et al., “Trabecular bone architecture in the distal radius using magnetic resonance imaging in subjects with fractures of the proximal femur,” Osteoporosis International, vol. 10, no. 3, pp. 231–239. [Google Scholar]
36. M. Petrantonaki, T. Maris and J. Damilakis. (2005). “MRI techniques for the examination of trabecular bone structure,” Current Medical Imaging, vol. 1, no. 1, pp. 35–41. [Google Scholar]
37. P. K. Saha and F. W. Wehrli. (2004). “Measurement of trabecular bone thickness in the limited resolution regime of in vivo MRI by fuzzy distance transform,” IEEE Transactions on Medical Imaging, vol. 23, no. 1, pp. 53–62. [Google Scholar]
38. A. Laib, D. C. Newitt, Y. Lu and S. Majumdar. (2002). “New model-independent measures of trabecular bone structure applied to in vivo high-resolution MR images,” Osteoporosis International, vol. 13, no. 2, pp. 130–136. [Google Scholar]
39. S. Gitto, R. Cuocolo, D. Albano, V. Chianca, C. Messina . (2020). et al., “MRI radiomics-based machine-learning classification of bone chondrosarcoma,” European Journal of Radiology, vol. 128, 109043. [Google Scholar]
40. E. Pinho and C. Costa. (2016). “Extensible architecture for multimodal information retrieval in medical imaging archives,” in 2016 12th Int. Conf. on Signal-Image Technology & Internet-Based Systems (SITISNaples, Italy, pp. 316–322. [Google Scholar]
41. C. S. Rajapakse, M. B. Leonard, Y. A. Bhagat, W. Sun, J. F. Magland . (2012). et al., “Micro-MR imaging-based computational biomechanics demonstrates reduction in cortical and trabecular bone strength after renal transplantation,” Radiology, vol. 262, no. 3, pp. 912–920. [Google Scholar]
42. A. Depeursinge, A. Foncubierta-Rodriguez, D. Van De Ville and H. Müller. (2014). “Three-dimensional solid texture analysis in biomedical imaging: Review and opportunities,” Medical Image Analysis, vol. 18, no. 1, pp. 176–196. [Google Scholar]
43. C. F. Ciuşdel, A. Vizitiu, F. Moldoveanu, C. Suciu and L. M. Itu. (2017). “Towards deep learning based estimation of fracture risk in osteoporosis patients,” in 2017 40th Int. Conf. on Telecommunications and Signal Processing (TSPBarcelona, Spain, pp. 659–665. [Google Scholar]
44. R. Korchiyne, S. M. Farssi, A. Sbihi, R. Touahni and M. T. Alaoui. (2014). “A combined method of fractal and GLCM features for MRI and CT scan images classification,” arXiv Preprint arXiv1409. 4559, Cornell University. [Google Scholar]
45. J. S. Gregory, R. M. Junold, P. E. Undrill and R. M. Aspen. (1999). “Analysis of trabecular bone structure using Fourier transforms and neural networks,” IEEE Transactions on Information Technology in Biomedicine, vol. 3, no. 4, pp. 289–294. [Google Scholar]
46. N. Lazzarini, J. Runhaar, A. C. B. Jensen, C. S. Thudium, B. Zeinstra . (2017). et al., “A machine learning approach for the identification of new biomarkers for knee osteoarthritis development in overweight and obese women,” Osteoarthritis and Cartilage, vol. 25, no. 12, pp. 2014–2021.
47. A. Mobasheri. (2012). “Osteoarthritis year 2012 in review: Biomarkers,” Osteoarthritis and Cartilage, vol. 20, no. 12, pp. 1451–1464.
48. B. Smith. (2018). “Doing a literature review: Releasing the research imagination,” Journal of Perioperative, vol. 28, pp. 318–328.
49. A. K. Petersen. (2012). “How to do a structured literature review in computer science, 1, Ver. 0.1, . [Online]. Available: https://www.researchgate.net/profile/Anders_Kofod-Petersen/publication/265158913.
50. A. Jerebko. (2011). “Automatic bone detection in MRI images,” Google Patents, vol. 7, pp. 730–738.
51. Y. Wang, L. Wang, M. R. Mojarad, S. Moon, F. Shen . (2018). et al., “Clinical information extraction applications: A literature review,” Journal of Biomedical Informatics, vol. 77, pp. 34–49.
52. M. Toumba and N. Skordis. (2010). “Osteoporosis syndrome in thalassaemia major: An overview,” Journal of Osteoporosis, vol. 2010, no. 1, pp. 1–7.
53. D. Tsuji, M. Matsuhiro, H. Suzuki, Y. Kawata, N. Niki . (2018). et al., “Computer aided detection system for Osteoporosis using low dose thoracic 3D CT images,” Medical Imaging 2018: Computer-Aided Diagnosis, vol. 10575, 105753D.
54. Y. T. Chen. (2017). “A novel approach to segmentation and measurement of medical image using level set methods,” Magnetic Resonance Imaging, vol. 39, pp. 175–193.
55. M. C. D. Galiano, M. T. M. Valdivia, A. M. Ráez and L. A. U. López. (2007). “Improving performance of medical images retrieval by combining textual and visual information,” in 2007 Sixth Mexican Int. Conf. on Artificial Intelligence, Special Session (MICAIAguascallentes, Mexico, pp. 185–192. [Google Scholar]
56. Y. X. Yang, M. S. Chong, L. Tay, S. Yew, A. Yeo . (2016). et al., “Automated assessment of thigh composition using machine learning for Dixon magnetic resonance images,” Magnetic Resonance Materials in Physics, Biology and Medicine, vol. 29, no. 5, pp. 723–731. [Google Scholar]
57. J. Ma. (2008). “Dixon techniques for water and fat imaging,” An Official Journal of the International Socciety for Magnetic Resonance in Medicine, vol. 28, no. 3, pp. 543–558. [Google Scholar]
58. T. Neogi, M. A. Bowes, J. Niu, K. M. D. Souza, R. Graham . (2013). et al., “Magnetic resonance imaging-based three-dimensional bone shape of the knee predicts onset of knee osteoarthritis: Data from the Osteoarthritis initiative,” Arthritis & Rheumatism, vol. 65, no. 8, pp. 2048–2058. [Google Scholar]
59. F. Eckstein, F. Cicuttini, J. P. Raynauld, J. C. Waterton and C. Peterfy. (2006). “Magnetic resonance imaging (MRI) of articular cartilage in knee osteoarthritis (OAMorphological assessment,” Osteoarthritis and Cartilage, vol. 14, pp. 46–75.
60. H. K. Genant and J. Y. Jiang. (2006). “Imaging assessment of bone quality in osteoporosis,” Clinical Reviews in Bone and Mineral Metabolism, vol. 4, no. 3, pp. 213–224.
61. M. G. Roberts, J. Graham and H. Devlin. (2013). “Image texture in dental panoramic radiographs as a potential biomarker of osteoporosis,” IEEE Transactions on Biomedical Engineering, vol. 60, no. 9, pp. 2384–2392.
62. M. S. Kavitha, A. Asano, A. Taguchi, T. Kurita and M. Sanada. (2012). “Diagnosis of osteoporosis from dental panoramic radiographs using the support vector machine method in a computer-aided system,” BMC Medical Imaging, vol. 12, no. 1, pp. 1.
63. A. V. Gaidel. (2016). “Matched polynomial features for the analysis of grayscale biomedical images,” Computer Optics, vol. 40, no. 2, pp. 232–239. [Google Scholar]
64. F. W. Wehrli, G. A. Ladinsky, C. Jones, M. Benito, J. Magland . (2008). et al., “In vivo magnetic resonance detects rapid remodeling changes in the topology of the trabecular bone network after menopause and the protective effect of estradiol,” Journal of Bone and Mineral Research, vol. 23, no. 5, pp. 730–740. [Google Scholar]
65. B. R. Gomberg, P. K. Saha, H. K. Song, S. N. Hwang and F. W. Wehrli. (2000). “Topological analysis of trabecular bone MR images,” IEEE Transactions on Medical Imaging, vol. 19, no. 3, pp. 166–174. [Google Scholar]
66. A. L. Adams, H. Fischer, D. L. Kopperdahl, D. C. Lee, D. M. Black . (2018). et al., “Osteoporosis and hip fracture risk from routine computed tomography scans: The fracture, osteoporosis, and CT utilization study (FOCUS),” Journal of Bone and Mineral Research, vol. 33, no. 7, pp. 1291–1301. [Google Scholar]
 | This work is licensed under a Creative Commons Attribution 4.0 International License, which permits unrestricted use, distribution, and reproduction in any medium, provided the original work is properly cited. |