DOI:10.32604/cmc.2021.012393
| Computers, Materials & Continua DOI:10.32604/cmc.2021.012393 | |
| Article |
1College of Management and Economics, Tianjin University, Tianjin, China
2Department of Statistics, Yazd University, Yazd, Iran
3Department of Statistics, Bahauddin Zakariya University, Multan, Pakistan
*Corresponding Author: Zubair Ahmad. Email: z.ferry21@gmail.com
Received: 29 June 2020; Accepted: 14 September 2020
Abstract: In the last couple of years, there Has been an increased interest among the statisticians to define new families of distributions by adding one or more additional parameter(s) to the baseline distribution. In this regard, a number of families have been introduced and studied. One such example is the Marshall-Olkin family of distributions that is one of the most prominent approaches used to generalize the existing distributions. Whenever, we see a new method, the natural questions come in to mind are (i) what are the genesis of the newly proposed method and (ii) how did the proposed method is obtained. No doubt, the Marshall-Olkin family is a very useful method and has attracted the researchers. But, unfortunately, the authors failed to provide the explanation about the genesis of the method that how this family of distributions is obtained. To address this issue, in this article, an attempt Has been made to provide a straight forward computation about the genesis of the Marshall-Olkin family that somehow completes its derivation. The genesis of the Marshall-Olkin family is based on the T-X family approach. Furthermore, we have showed that other extensions of the Marshall-Olkin family can also be obtained via the T-X family method. Finally, a real-life application form insurance science is presented to illustrate the newly proposed extension of the Marshall-Olkin family.
Keywords: Family of distributions; Marshall-Olkin family; T-X family approach; statistical modeling
Statistical distributions are very worthwhile in describing and predicting real-world phenomena. In the recent era, several new statistical distributions have been proposed via extending the classical distributions for modelling data in applied areas, particularly, in the practice of insurance and economics [1–7], engineering [8–10] and biological studies [11–15], among others. However, the traditional distributions are not flexible enough to model real world phenomena of nature. Therefore, it is always of interest to obtain the extended versions of the existing distributions for modeling real life data. This has been done through many different approaches [16,17]. One such approach of generalizing the traditional distributions is the Marshall-Olkin (MO) family approach. The cumulative distribution function (cdf) of the MO family is given by

where  is the cdf of the baseline distribution may depend on the vector parameter
  , and
, and  is an additional parameter. The probability density function (pdf) corresponding to Eq. (1) is

where  .
.
The MO family method has been used extensively to generalize the existing distributions. The MO family of distributions is one of the most prominent approaches used to generalize the existing distributions. But the authors did not provide the genesis and the derivation of the MO family and hence the derivation of the paper is not completed. In this article, an effort has been made to provide the genesis and straight forward computation of the MO family. There may also be other methods through which the MO family can be obtained. However, this article offers the derivation of the MO family via the T-X family approach [18].
This paper is organized as follows: The genesis of the MO family is presented in Section 2. Further developments are discussed in Section 3. A special sub-case of the newly proposed family is presented in Section 4. A real-life application to financial sciences is presented in Section 5. Finally, the paper is concluded in the last section.
2 Genesis of the Marshall-Olkin Family of Distributions
This section offers the derivation of the MO family of distributions via the approach of T-X family. Let  be the pdf of a random variable, say T, where
  for
for  and let
  be a function of cdf of a random variable, say X, depending on the vector parameter
  satisfying the conditions given below:
i) 
ii)  is differentiable and monotonically increasing, and
iii)  as
as  and
and  as
as  .
.
Recently, Alzaatreh et al. [18] defined the cdf of the T-X family of distributions by

where  satisfies the conditions stated above. The pdf corresponding to Eq. (3) is

Using the T-X idea, several new classes of distributions have been introduced in the literature. Let T follows the exponential distribution with  , and then its cdf is given by

If  , then from Eq. (4), we have

The pdf corresponding to Eq. (5) is

If T follows Eq. (6) and setting  in Eq. (3), we have

On solving, we get


The Eq. (7) which is equal to Eq. (1) provides the cdf of the MO family.
3 Other Extensions of the MO Family
Other extensions of the MO family can also be obtained through the T-X approach. For example, the Kumaraswamy version, exponentiated version and alpha power transformed version, etc.
3.1 Exponentiated Version of the MO Family
If  be pdf given by Eq. (6) and letting
  in Eq. (3), we get the exponentiated Marshall-Olkin (EMO) family given by

where a > 0 is an additional shape parameter. The density function corresponding to Eq. (8) can easily be obtained simply by differentiation.
3.2 Kumaraswamy Version of the MO Family
This section offers the derivation of the Kumaraswamy version of the MO family of distributions. If  represent the density function Eq. (6) and letting
  in Eq. (3), we get the Kumaraswamy Marshall-Olkin (Ku-MO) family given by

The density function of the Ku-MO family can be obtained by differentiating Eq. (9).
3.3 Alpha Power Transformed Version of the MO Family
If  follows Eq. (6) and letting
  in Eq. (3), we get the alpha power transformed version of the MO family given by

On differentiating Eq. (10), we get the density function of the alpha power transformed Marshall-Olkin (APTMO) family.
3.4 Exponentiated Version of the Alpha Power Transformed Marshall-Olkin Family
If  follows Eq. (6) and letting
  in Eq. (3), we get the alpha power transformed version of the EMO family given by

4 A Sub-Model Description of the APTMO Family
In this section, we investigate a special sub-case of the APTMO family. The density function corresponding to Eq. (10) is given by

Consider the distribution and density functions of the Weibull random variable given by  , and
, and  where,
  Then, the cdf of the APTMO-Weibull distribution is given by
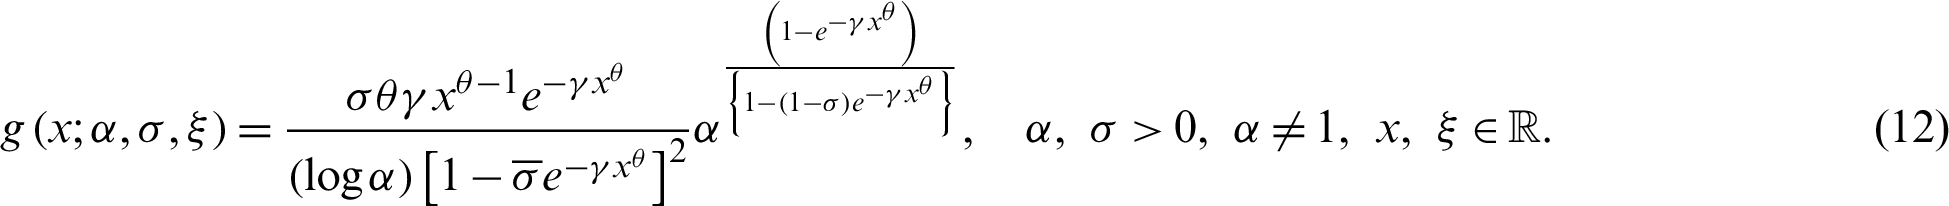

The density function corresponding to Eq. (12) is given by
For (i)  and (ii)
  and different values of
  and
and  , plots for the pdf of the APTMO-Weibull distribution are sketched in Fig. 1.

Figure 1: Density plots of the APTMO-Weibull distribution
In this section, we demonstrate the flexibility of the APTMO-Weibull distribution by using a heavy-tailed insurance claims data. The data set represents the unemployment insurance initial claims per month from 1971 to 2018, and it is available at https://data.worlddatany-govns8z-xewg.
By applying the APTMO-Weibull distribution to this data, we observed that the APTMO-Weibull model can be used quite effectively to provide the best description of the real phenomena of nature. Corresponding to the insurance claims data, the fitted cdf and density plots of the APTMO-Weibull  are presented in Fig. 2. The probability-probability (PP) plot and Kaplan–Meier survival plots are sketched in Fig. 3.

Figure 2: The fitted pdf and cdf of the APTMO-Weibull distribution

Figure 3: The PP plot and Kaplan–Meier survival plots of the APTMO-Weibull distribution
The graphical sketching provided in Fig. 3 indicate that the APTMO-Weibull distribution provides the better fit and could be chosen as an adequate model to analyze the heavy-tailed insurance claims data.
In this article, a straight forward computation of the genesis of the MO family of distributions is provided. It is showed that the MO family of distributions can be obtained via the T-X family approach. It is also showed that the other extensions of the MO family such as the exponentiated version and the Kumaraswamy version can be obtained using the T-X method. Furthermore, a sub-case of the APTMO family is considered and a real data set from the insurance sciences is analyzed. The real-life application show that the newly proposed APTMO-Weibull distribution can be used quite effectively to model data in insurance sciences and other related fields. We hope that the method of genesis provided in this paper will attract the researchers and will use it to obtain the extensions of the other existing family of distributions.
Data Availability: This work is mainly a methodological development and has been applied on secondary data related to the insurance science data, but if required, data will be provided.
Funding Statement: This study is supported by the Department of Statistics, Yazd University, Yazd, Iran.
Conflicts of Interest: The authors declare that they have no conflicts of interest to report regarding the present study.
References
1. A. Asgharzadeh, S. Nadarajah and F. Sharafi. (2017). “Generalized inverse lindley distribution with application to Danish fire insurance data,” Communications in Statistics-Theory and Methods, vol. 46, no. 10, pp. 5001–5021.
2. D. Bhati and S. Ravi. (2018). “On generalized log-moyal distribution: A new heavy tailed size distribution,” Insurance: Mathematics and Economics, vol. 79, pp. 247–259.
3. J. Cheng, Y. Hong and J. Tao. (2016). “How do risk attitudes of clearing firms matter for managing default exposure in futures markets?,” The European Journal of Finance, vol. 22, no. 10, pp. 909–940.
4. R. Kazemi and M. Noorizadeh. (2015). “A comparison between skew-logistic and skew-normal distributions,” MATEMATIKA: Malaysian Journal of Industrial and Applied Mathematics, vol. 31, no. 1, pp. 15– 24.
5. X. Hao and Q. Tang. (2012). “Asymptotic ruin probabilities for a bivariate Lévy-driven risk model with heavy-tailed claims and risky investments,” Journal of Applied Probability, vol. 49, no. 4, pp. 939–953.
6. Z. Ahmad, E. Mahmoudi, S. Dey and S. K. Khosa. (2020). “Modeling vehicle insurance loss data using a new member of TX family of distributions,” Journal of Statistical Theory and Applications, vol. 19, no. 2, pp. 133–147.
7. Z. Ahmad, E. Mahmoudi, G. G. Hamedani and O. Kharazmi. (2020). “New methods to define heavy-tailed distributions with applications to insurance data,” Journal of Taibah University for Science, vol. 14, no. 1, pp. 359–382.
8. Q. Liao, Z. Ahmad, E. Mahmoudi and G. G. Hamedani. (2020). “A new flexible bathtub-shaped modification of the Weibull model: Properties and applications,” Mathematical Problems in Engineering, vol. 2020, pp. 1–11.
9. X. Huo, S. K. Khosa, Z. Ahmad, Z. Almaspoor, M. Ilyas et al. (2020). , “A new lifetime exponential-X family of distributions with applications to reliability data,” Mathematical Problems in Engineering, vol. 2020, no. 2, pp. 1–6.
10. A. J. Almalki and J. Yuan. (2013). “A new modified Weibull distribution,” Reliability Engineering & System Safety, vol. 111, pp. 164–170. [Google Scholar]
11. C. Z. Zhu, H. N. Ting, K. H. Ng and T. A. Ong. (2019). “A review on the accuracy of bladder cancer detection methods,” Journal of Cancer, vol. 10, no. 17, pp. 4038–4044. [Google Scholar]
12. E. H. A. Rady, W. A. Hassanein and T. A. Elhaddad. (2016). “The power Lomax distribution with an application to bladder cancer data,” Springer Plus, vol. 5, no. 1, pp. 18–38. [Google Scholar]
13. H. Aghamolaey, A. R. Baghestani and F. Zayeri. (2017). “Application of the Weibull distribution with a non-constant shape parameter for identifying risk factors in pharyngeal cancer patients,” Asian Pacific Journal of Cancer Prevention, vol. 18, no. 6, pp. 15–37. [Google Scholar]
14. H. P. Zhu, X. Xia, H. Y. Chuan, A. Adnan, S. F. Liu et al. (2011). , “Application of Weibull model for survival of patients with gastric cancer,” BMC Gastroenterology, vol. 11, no. 1, pp. 1–6. [Google Scholar]
15. Y. Liu, M. Ilyas, S. K. Khosa, E. Mahmoudi, Z. Ahmad et al. (2020). , “A flexible reduced logarithmic-X family of distributions with biomedical analysis,” Computational and Mathematical Methods in Medicine, vol. 2020, pp. 1–15. [Google Scholar]
16. M. H. Tahir and G. M. Cordeiro. (2016). “Compounding of distributions: A survey and new generalized classes,” Journal of Statistical Distributions and Applications, vol. 3, no. 1, pp. 1–13. [Google Scholar]
17. Z. Ahmad, G. G. Hamedani and N. S. Butt. (2019). “Recent developments in distribution theory: A brief survey and some new generalized classes of distributions,” Pakistan Journal of Statistics and Operation Research, vol. 15, no. 1, pp. 87–110. [Google Scholar]
18. A. Alzaatreh, C. Lee and F. Famoye. (2013). “A new method for generating families of continuous distributions,” Metron, vol. 71, no. 1, pp. 63–79. [Google Scholar]
 | This work is licensed under a Creative Commons Attribution 4.0 International License, which permits unrestricted use, distribution, and reproduction in any medium, provided the original work is properly cited. |