DOI:10.32604/cmc.2021.014289
| Computers, Materials & Continua DOI:10.32604/cmc.2021.014289 | |
| Article |
Product Spacing of Stress–Strength under Progressive Hybrid Censored for Exponentiated-Gumbel Distribution
1Department of Mathematics and Statistics,King Faisal University, Al-Ahsa, 31982, Saudi Arabia
2Department of Applied Statistics and Insurance,Mansoura University, Mansoura, 35516, Egypt
3Department of Mathematical Statistics,Cairo University, Cairo, 12613, Egypt
4Department of Statistics,Delta University for Science and Technology, Mansoura, 11152, Egypt
*Corresponding Author: Ehab M. Almetwally. Email: ehabxp_2009@hotmail.com
Received: 11 September 2020; Accepted: 15 October 2020
Abstract: Maximum product spacing for stress–strength model based on progressive Type-II hybrid censored samples with different cases has been obtained. This paper deals with estimation of the stress strength reliability model R = P(Y < X) when the stress and strength are two independent exponentiated Gumbel distribution random variables with different shape parameters but having the same scale parameter. The stress–strength reliability model is estimated under progressive Type-II hybrid censoring samples. Two progressive Type-II hybrid censoring schemes were used, Case I: A sample size of stress is the equal sample size of strength, and same time of hybrid censoring, the product of spacing function under progressive Type-II hybrid censoring schemes. Case II: The sample size of stress is a different sample size of strength, in which the life-testing experiment with a progressive censoring scheme is terminated at a random time  . The maximum likelihood estimation and maximum product spacing estimation methods under progressive Type-II hybrid censored samples for the stress strength model have been discussed. A comparison study with classical methods as the maximum likelihood estimation method is discussed. Furthermore, to compare the performance of various cases, Markov chain Monte Carlo simulation is conducted by using iterative procedures as Newton Raphson or conjugate-gradient procedures. Finally, two real datasets are analyzed for illustrative purposes, first data for the breaking strengths of jute fiber, and the second data for the waiting times before the service of the customers of two banks.
Keywords: Exponentiated Gumbel distribution; stress–strength model; progressive Type-II hybrid censoring; maximum product spacing; maximum likelihood
The stress–strength reliability  model is an important application in reliability theory. This model is used in many applications of physics and engineering such as strength failure and system collapse. In electrical and electronic systems
  arise as a measure of system performance. Some Authors had used
  as a general measure of the difference between two populations. Reference [1] used
  as the inequality measure between income distributions. Reference [2] used it to express the evaluation of the area under the receiver operating characteristic (
 ) curve for diagnostic tests with continuous outcomes. For further details and Applications of
  , see [3].
Statistical inference about the reliability model has received great attention in the context of reliability. For 
 is the strength of a system which is subjected to stress
  . The system fails when stress exceeds strength. Therefore, the stress–strength parameter
  measures system reliability. Many authors have used different statistical inference methods to estimate
  when samples drawn from the model are based on simple random samples (SRS). However, in recent years, statistical inferences about
  model based on the Ranked set sample designs (RSS) have been considered by several researches. For example [4] considered estimation of the stress strength reliability model when the stress and strength are independent exponentiated pareto variables and the samples are drawn using median and ranked set sampling methods.
Other researchers considered censored data when estimating  . Reference [5] discussed estimation of the reliability model for exponential populations using order statistics. Reference [6] proposed three estimators when
  and
and  are independent one-parameter exponential random variables. the case when stress and strength variables are independent Burr Type-XII distribution was investigated by Reference [7] when samples drawn using several modifications of ranked set sampling designs (RSS). Furthermore [8] discussed the estimation of the reliability model when
  and
and  independent Lindley populations.
The estimation of  in exponential distributions under censored data has been investigated by Reference [9], and the stress–strength reliability of Weibull and inverse Weibull distributions has been studied under progressively censored data by [10,11]. Reference [12] carried out the estimation of the stress–strength reliability
  based on progressively Type-II censored samples when
  and
and  were two independent two parameter bathtub-shaped lifetime distributions.
Many authors have discussed inference under progressive Type-II hybrid censoring using different lifetime distributions. Reference [13] presented the analysis of the Type-II progressively hybrid censored data of the Weibull distribution. Reference [14] discussed the maximum likelihood estimators and approximate maximum likelihood estimators of the parameters of the Weibull distribution with two different progressively hybrid censoring schemes. Reference [15] discussed the estimation and prediction problems for the Burr Type-III distribution under progressive Type-II hybrid censored data. Reference [16] discussed parameter estimation for the generalized Rayleigh distribution under the adaptive Type-II progressive censoring schemes by using maximum product spacing method. Reference [17] discussed statistical inference for the Gompertz distribution based on generalized progressively hybrid censored data. Reference [18] discussed adaptive Type-II progressive censoring schemes of maximum product spacing for Weibull parameters. Reference [19] discussed classical and Bayesian inferences for the generalized DUS exponential distribution under Type-I progressive hybrid censored data.
Reference [20] introduced progressive Type-II hybrid censoring based on the maximum product spacing method for Power Lomax distribution. Reference [21] obtained inference for the stress strength reliability when X and Y are two independent Weibull distributions under progressively Type-II censored samples. Reference [22] obtained step–stress model with Type-II hybrid censored data from the Kumaraswamy Weibull distribution. Reference [23] considered the reliability analysis problem of a constant-stress life test model based on progressively Type-I hybrid censored data from Weibull distribution. Reference [24] discussed classical and Bayesian estimation procedures for stress–strength reliability parameter for Lomax distribution based on Type-II hybrid censored. Reference [25] discussed point and interval estimate of the stress–strength parameter, from both MLE and Bayesian under the Type-II hybrid progressive censoring scheme. Based on the observed sample  from a progressive Type-II hybrid censoring scheme, the MPS under progressive Type-II hybrid censoring scheme will be introduced depending on [26–29,16].
The two cases of the Type-II progressive hybrid censoring scheme are cases I ( ) and case II (
 ). If
). If  , the progressive censoring sample
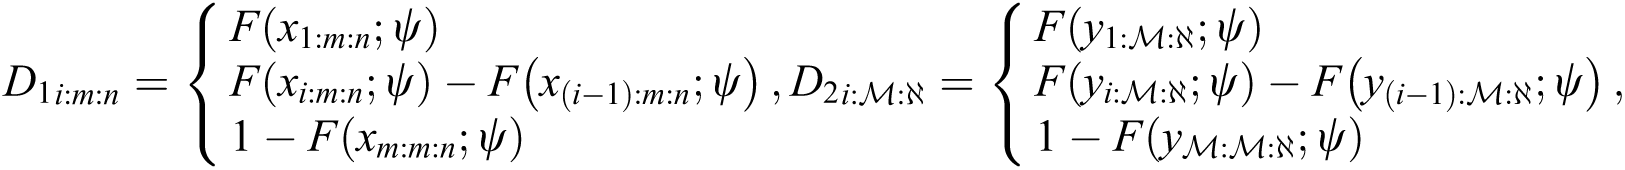
  , is described by [20]. Eq. (1) is referred as MPS under Type-II progressive hybrid censoring scheme in general form as follows:
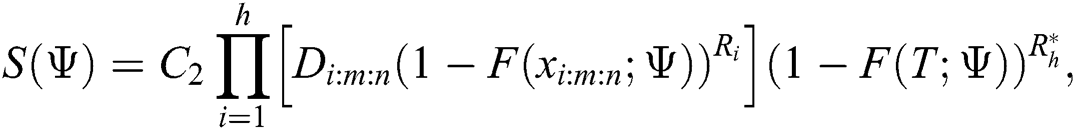
where 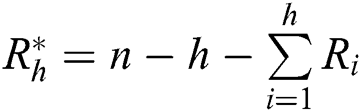 ,
,  is constant not depend on parameters.
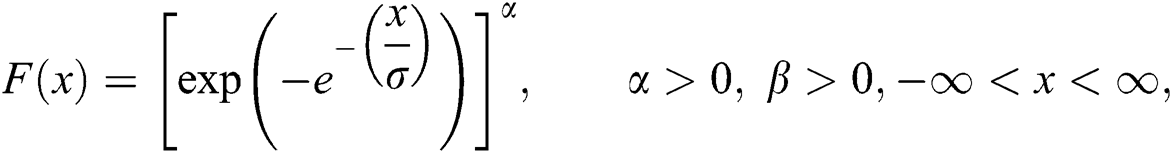
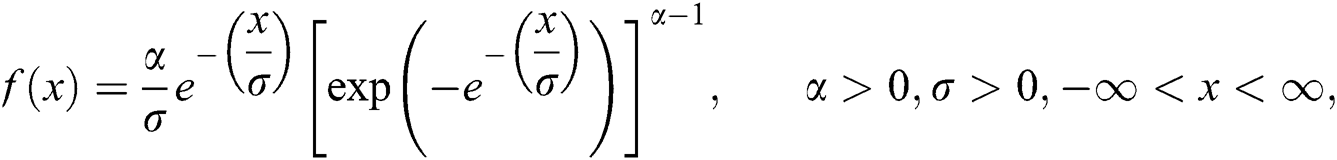
In this paper, estimation of the traditional stress–strength model  under progressive Type-II hybrid censoring schemes when
  and
and  are exponentiated Gumble (EG) random variables with cumulative distribution (cdf), probability density function (pdf) and quantile function respectively is investigated.
and
Maximum product of spacing (MPS) and maximum likelihood (MLE) estimation methods are used to estimate  and estimator’s performances and efficiencies are investigated through a Monte Carlo simulation study and a real data application will be used for illustrative purposes. Finally, the paper is concluded.
Let  and
and  be two independent random variables with the same scale parameter
  and
and  is the stress–strength reliability model, then:

The MLE and MPS estimators  and
and  of the shape parameters
  and
and  will be obtained to get the estimated model parameters as well as the stress–strength system reliability in case of progressive hybrid censored samples.
If  , the progressive censoring sample
  , and if
  , the progressive censoring sample
  is described. According [30], the general likelihood function under progressive Type-II hybrid censoring schemes for stress–strength model can be written as:
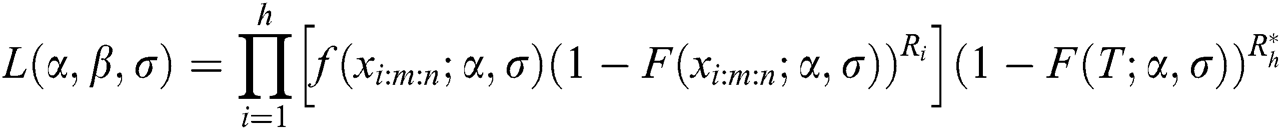
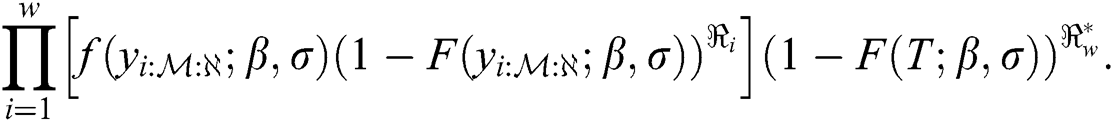
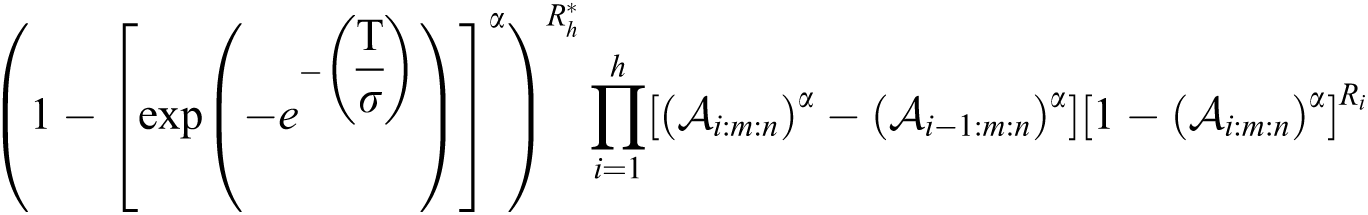
In case of stress and strength sample sizes are equal, and same time of hybrid censoring, the likelihood function of EG distribution under progressive Type-II hybrid censoring schemes for stress–strength model is:
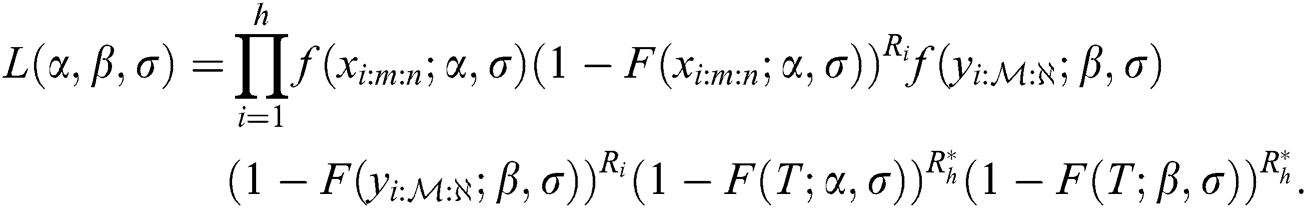
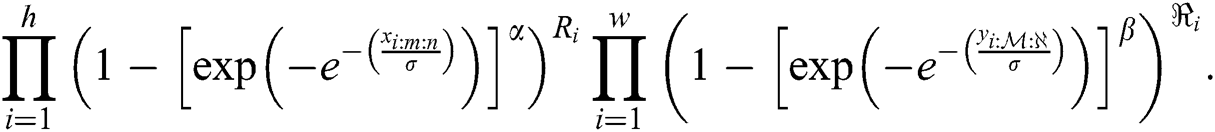
The general likelihood function of the EG distribution under progressive Type-II hybrid censoring schemes for stress–strength model is given as:
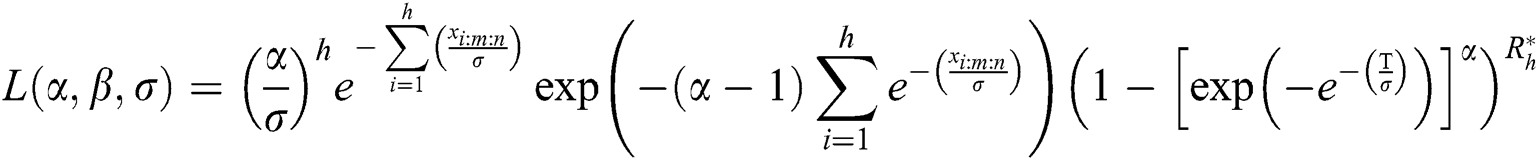
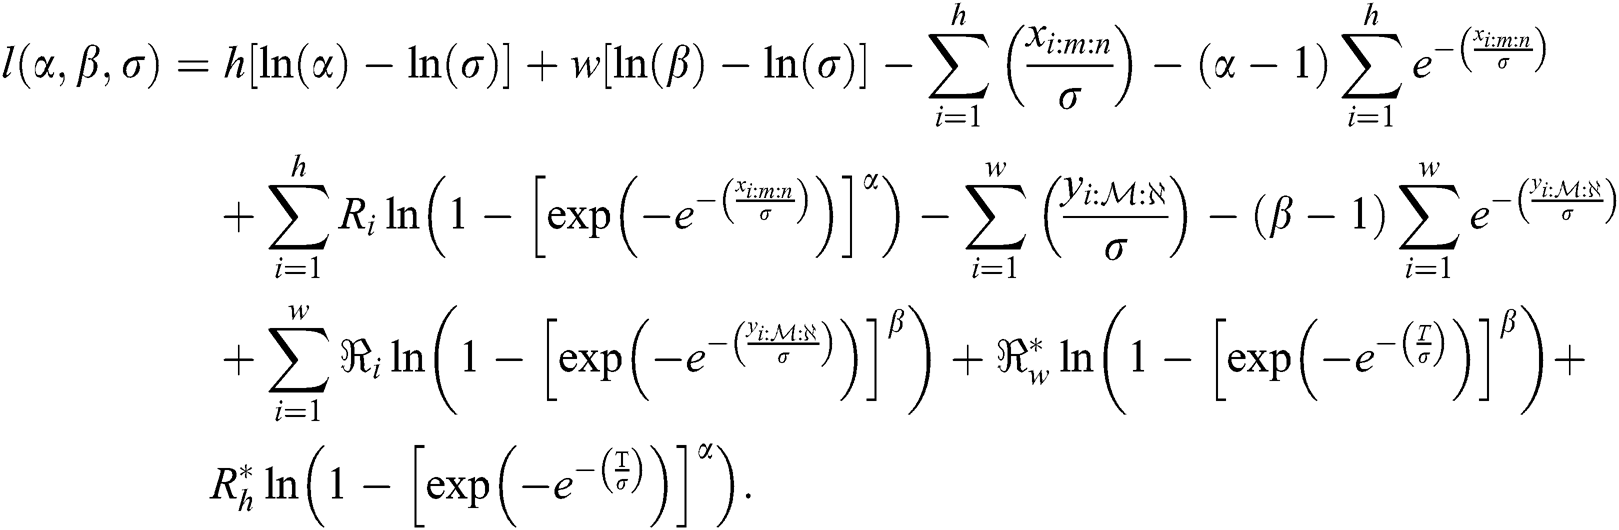
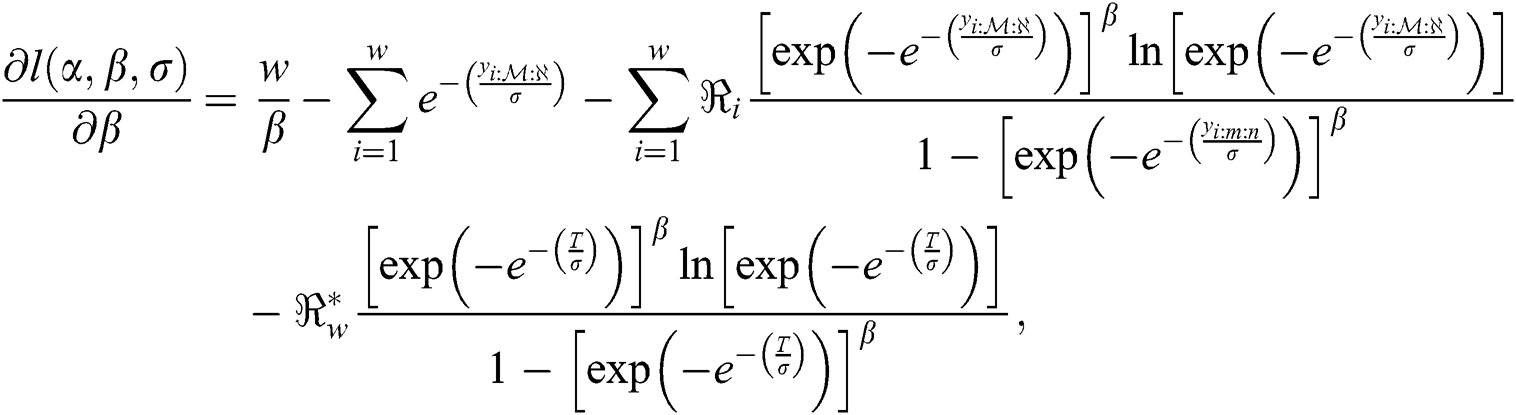
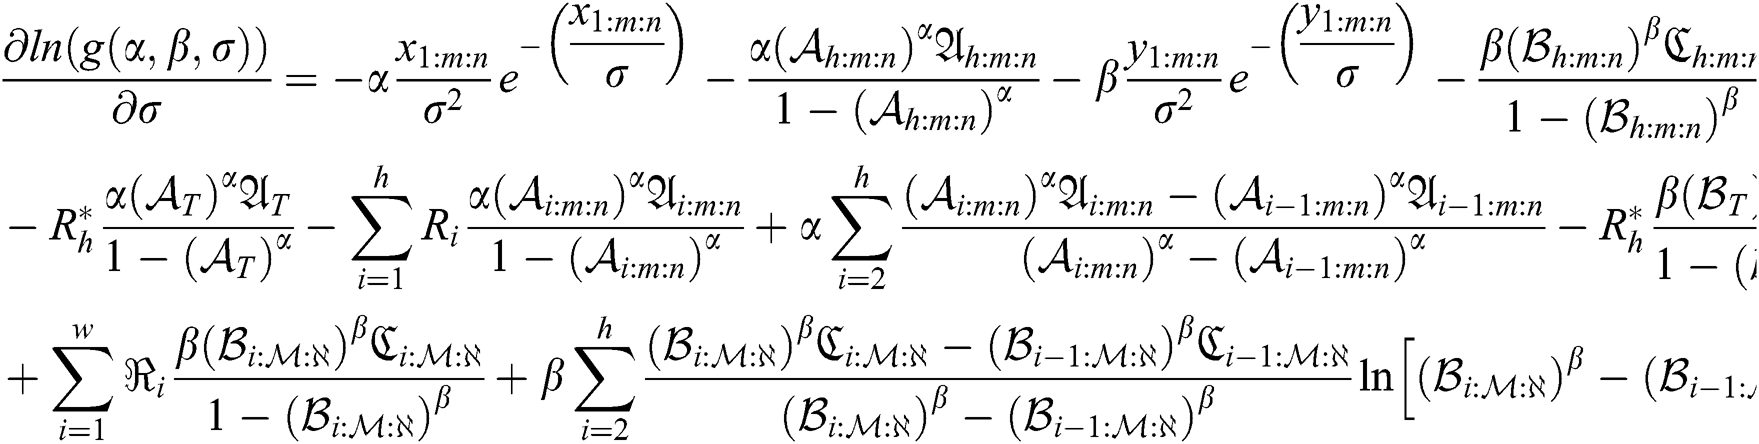
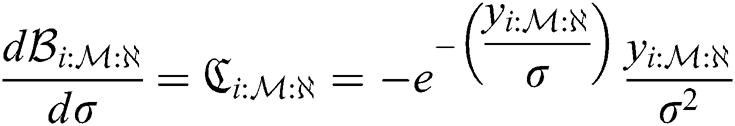
According to Eq. (9), the log-likelihood function of the EG distribution under progressive Type-II hybrid censoring schemes for stress–strength model is given as:
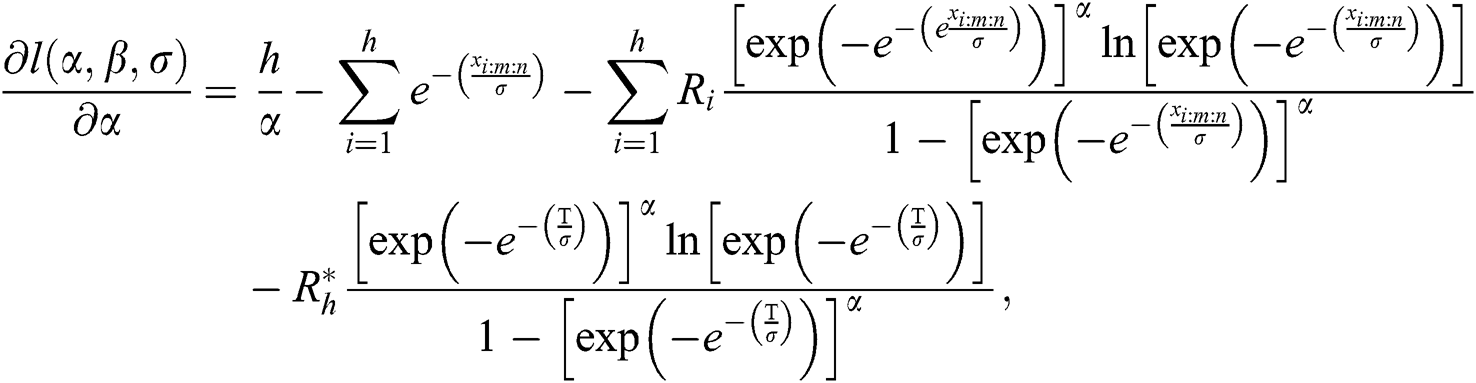
The MLE of  and
and  are obtained by simultaneously solving the following normal equations:
and
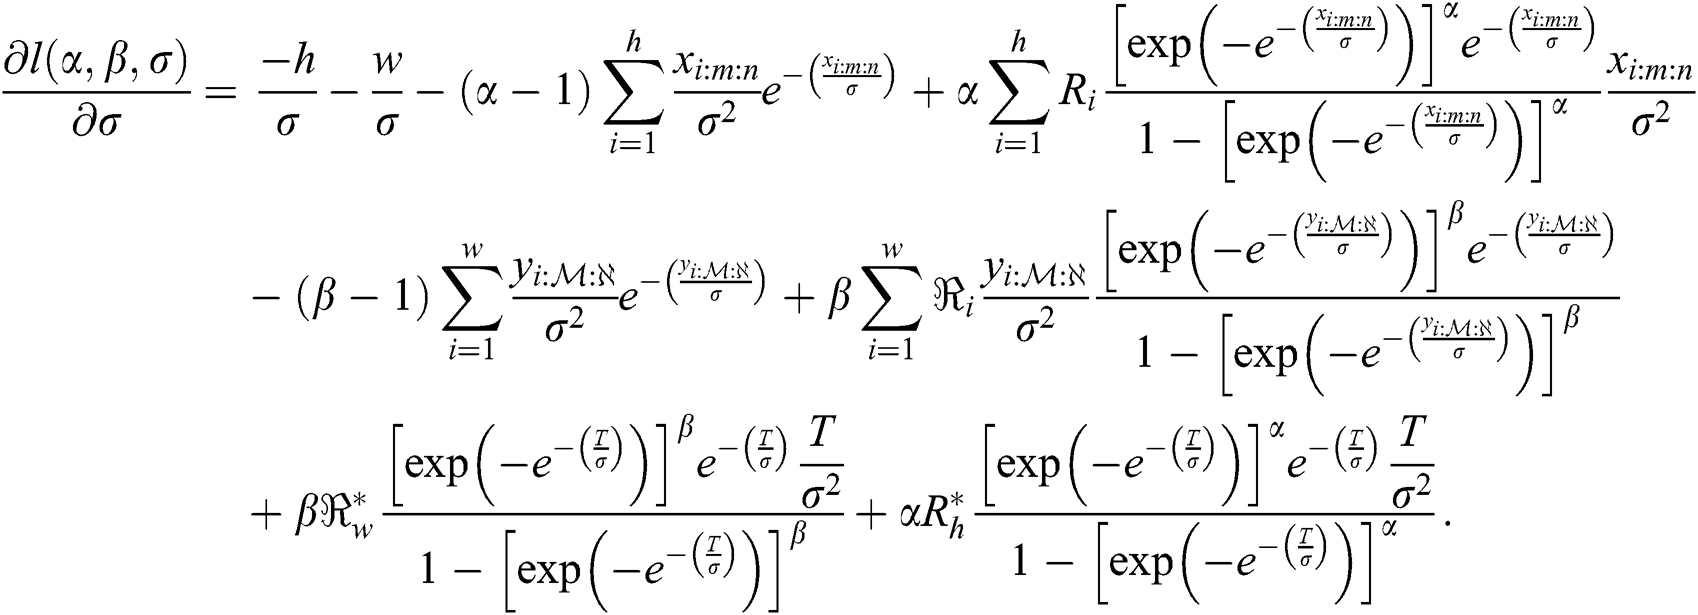
The MLEs  of the model parameters are the solution of non-linear Eqs. (11)–(13) after setting them equal to zero. These equations are very difficult to be solved, so iterative procedures are used as Newton Raphson or conjugate-gradient.
In case of sample size of stress is equal sample size of strength, and same time of hybrid censoring, the product of spacing function under progressive Type-II hybrid censoring schemes for stress–strength model as follows:
where  and
and
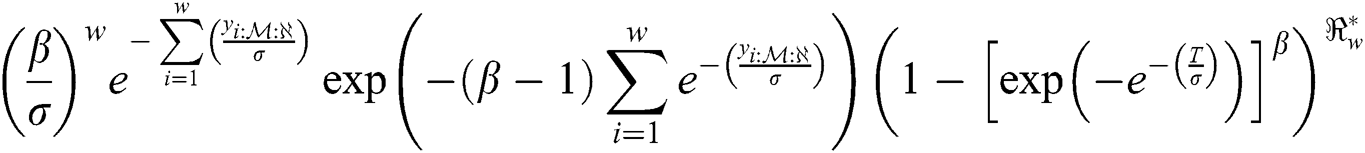
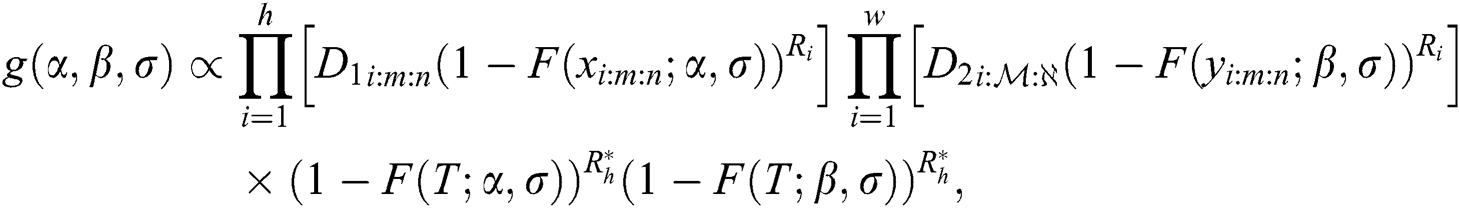
where  is a vector of parameters. The product of spacing function of the EG distribution under progressive Type-II hybrid censoring schemes for stress–strength model is given as:

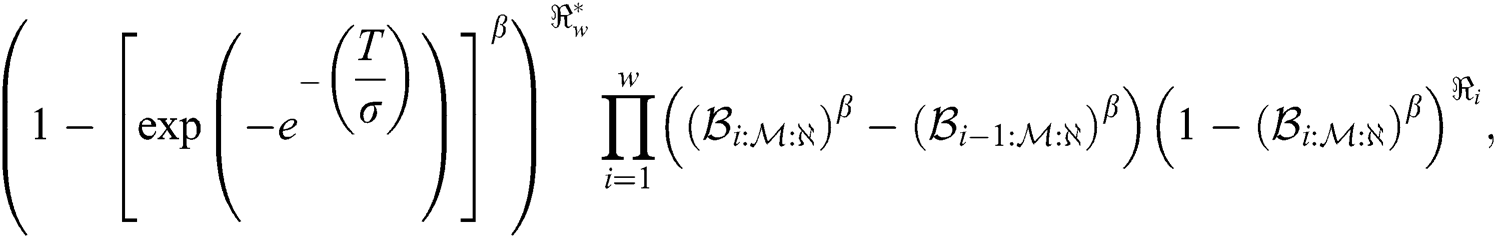
where 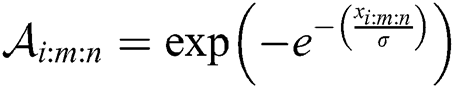 and
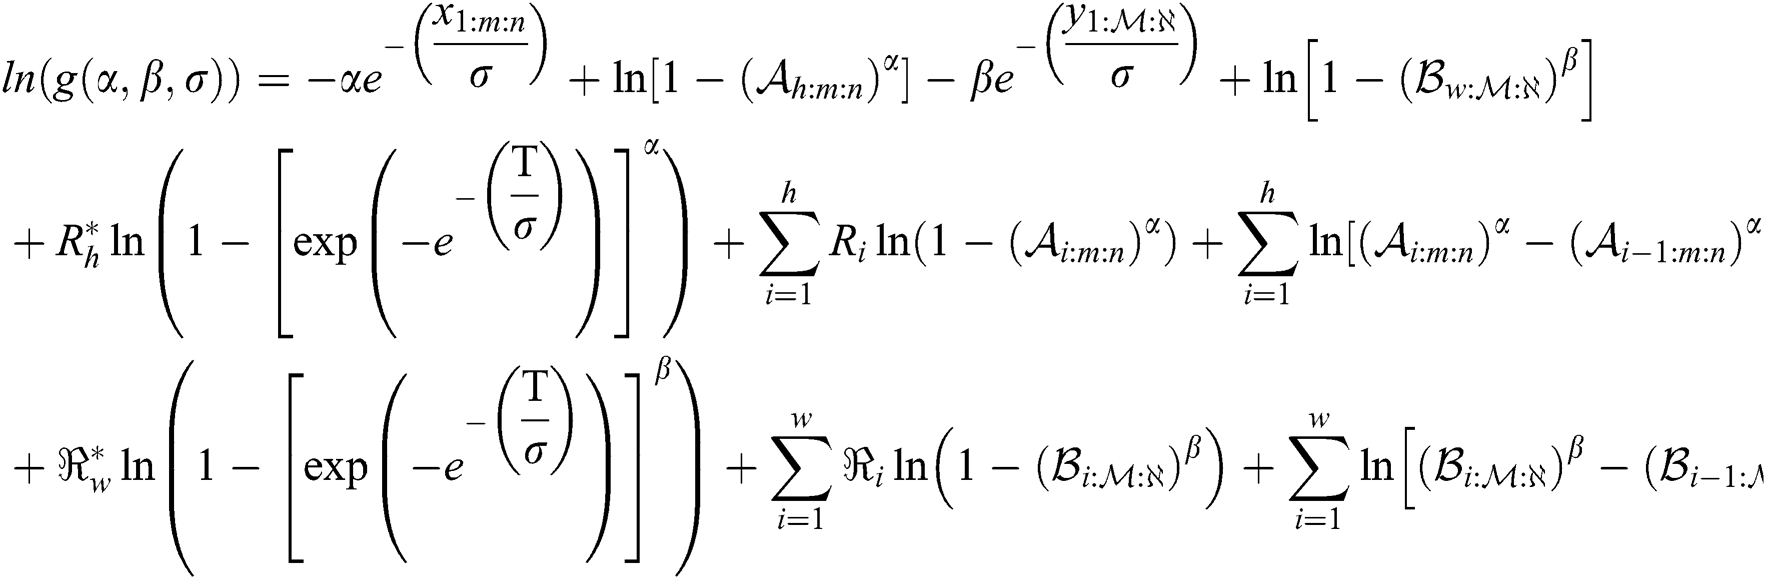
and 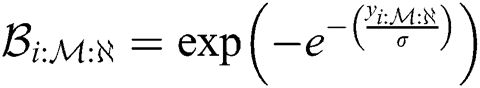 . The log- product of spacing function of the EG distribution under progressive Type-II hybrid censoring schemes for stress–strength model is given as:
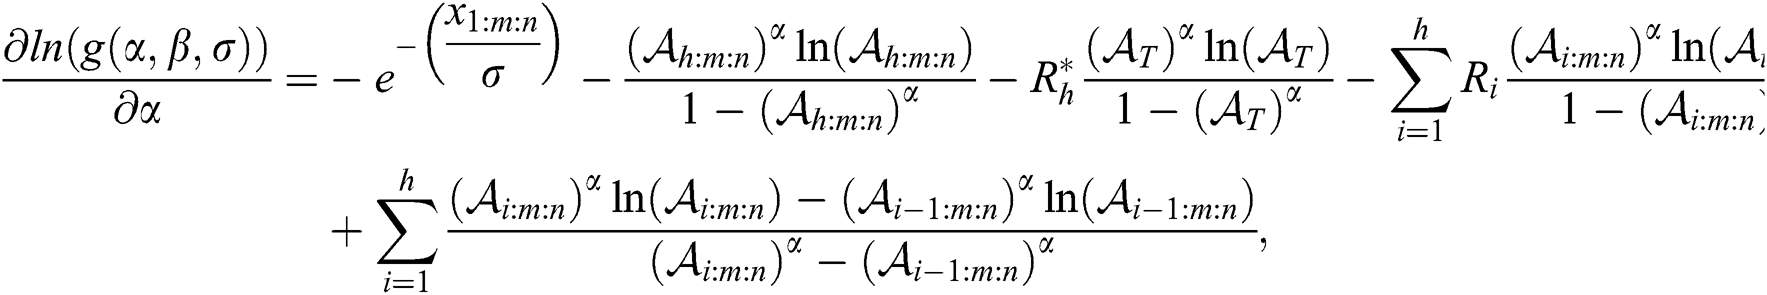
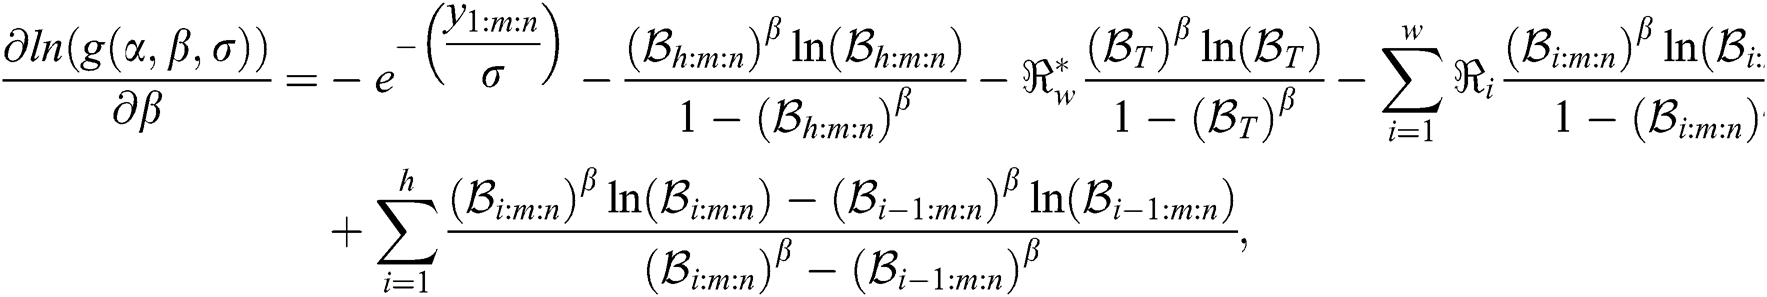
The MPS of  and
and  are obtained by simultaneously solving the following normal equations:
and
where 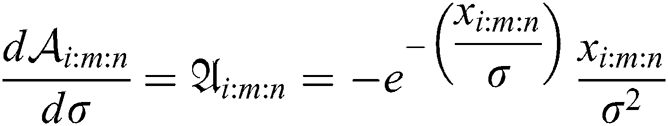 ,
,  , and
, and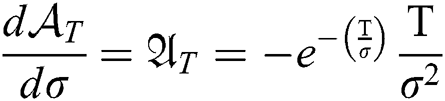 .
.
Again, The MPS  of the model parameters are the solution of those non-linear Eqs. (17)–(19) after setting them equal zero. These equations are very difficult to be solved, so iterative procedures are used as Newton Raphson or conjugate-gradient.
In this section, a Monte-Carlo simulation is done to estimate the parameters of EG distribution under progressive Type-II hybrid censoring schemes for stress–strength model for MLE and MPS methods using R language is described as follows:
Step 1: Generate 10000 random samples of size 30, 50 and 100 from the EG distribution under progressive Type-II hybrid censoring schemes for stress–strength model.
Step 2: Using the quantile 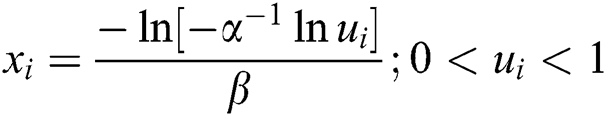 , where
  are distributed as EG for different parameters
  , Three sets of parameters values are selected as are
  ,
,  and is
  .
.
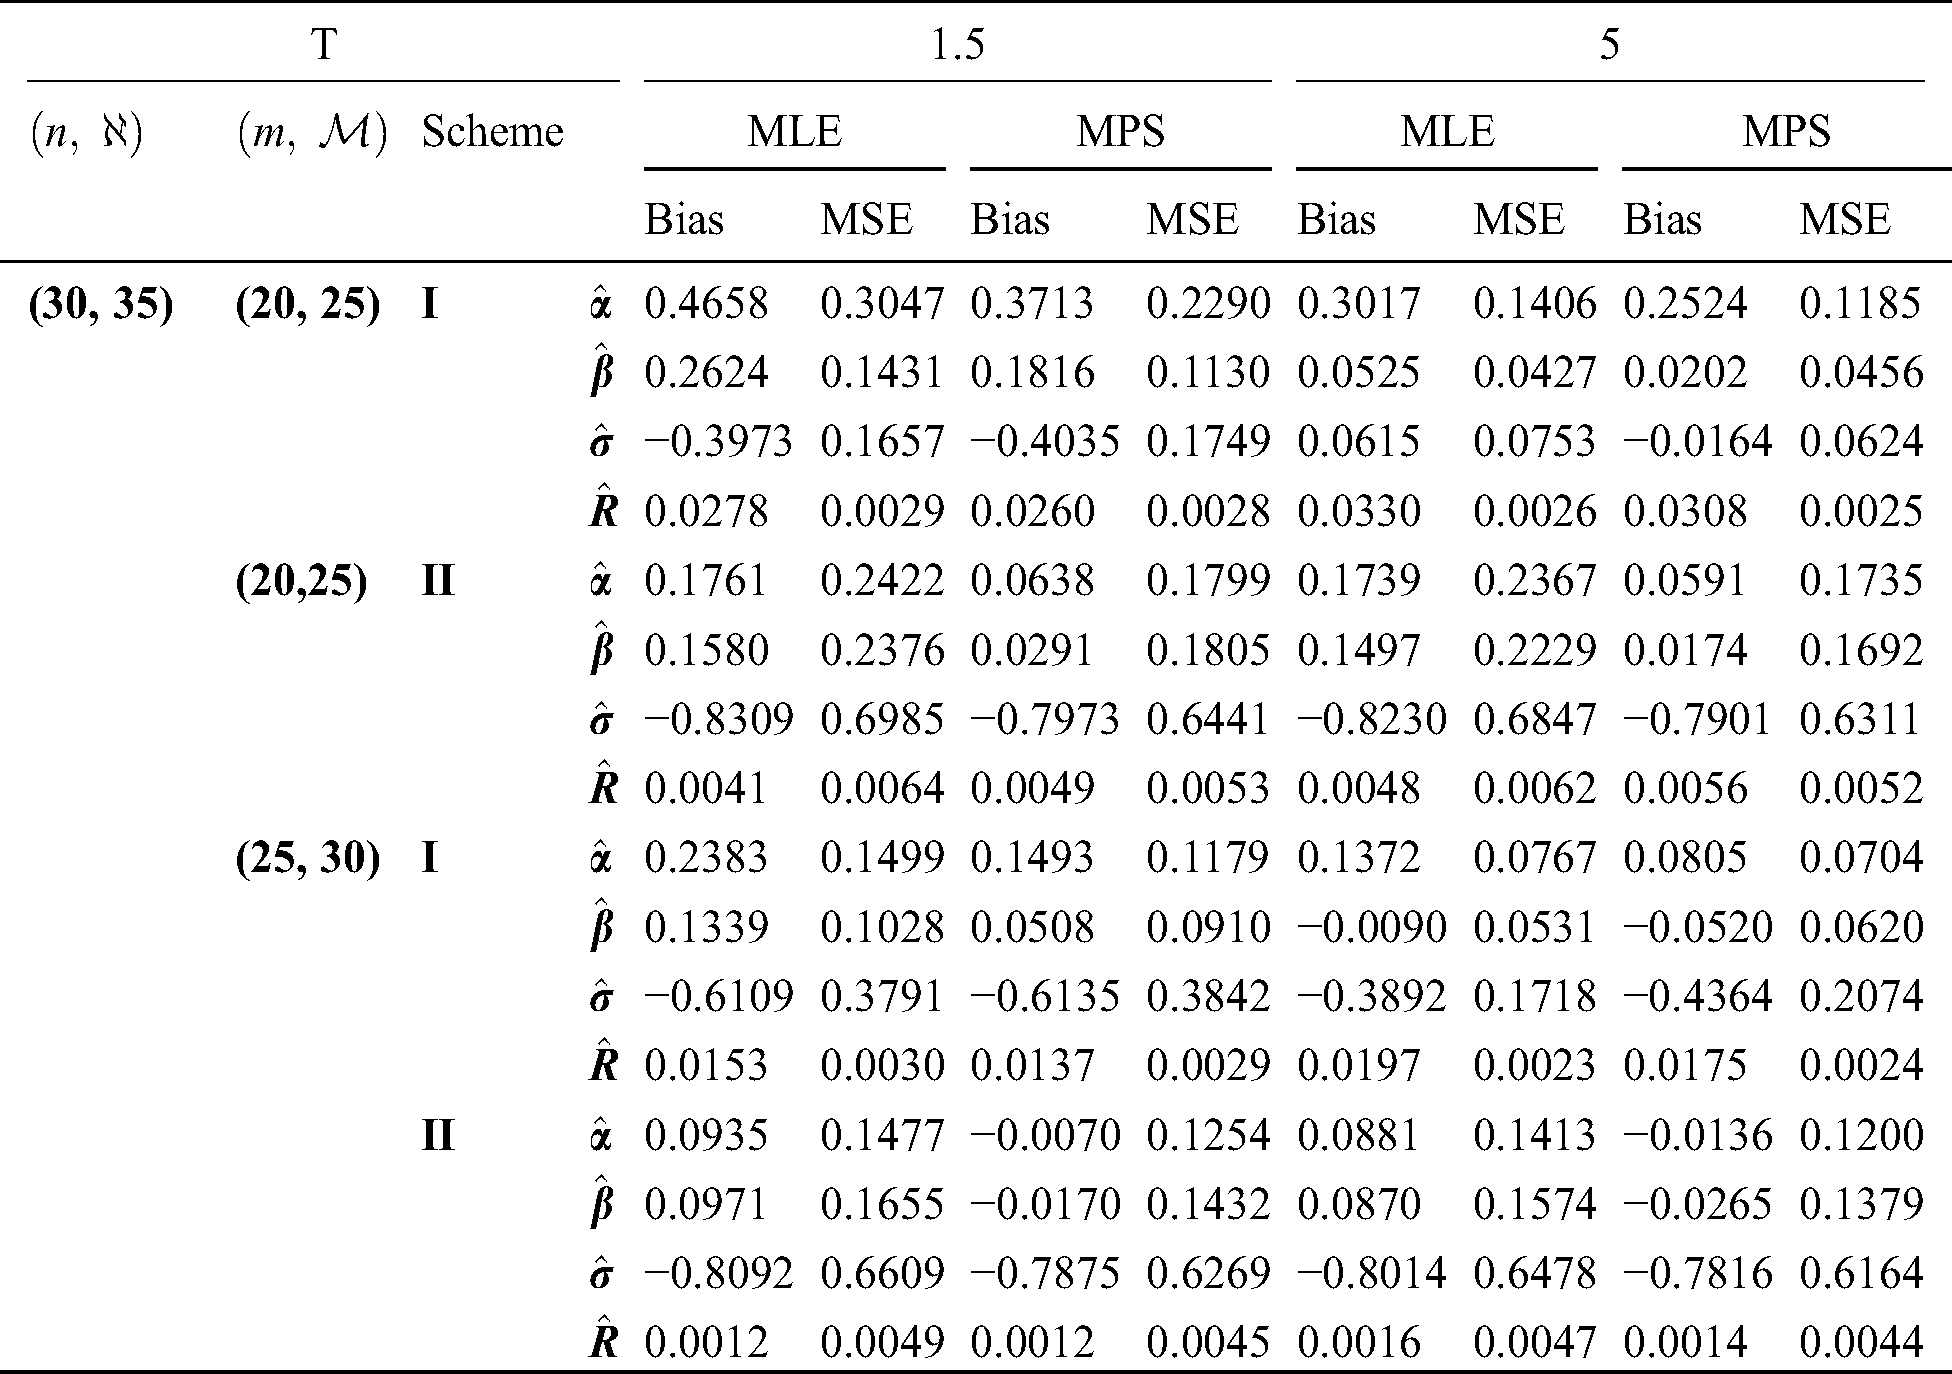
Step 3: In progressive Type-II hybrid censoring schemes for stress–strength model, the effective of sample sizes (failure items) m are selected based on two levels of censoring for all sample size. Selected T are 1.5 and 5 and sets of different samples schemes.
• Scheme 1:  . It is Type-II scheme
• Scheme 2:  .
.
• Case 1: Sample size of stress is equal sample size of strength, and same time of hybrid censoring.
• Case 2: Sample size of stress is different sample size of strength, and same time of hybrid censoring.
Step 4: The MLE and MPS of the model parameters are obtained by solving the non-linear equations based on progressive Type-II hybrid censoring schemes for stress–strength model.
Step 5: The Bias and mean square errors (MSE) of the parameters are obtained as measures of efficiency.
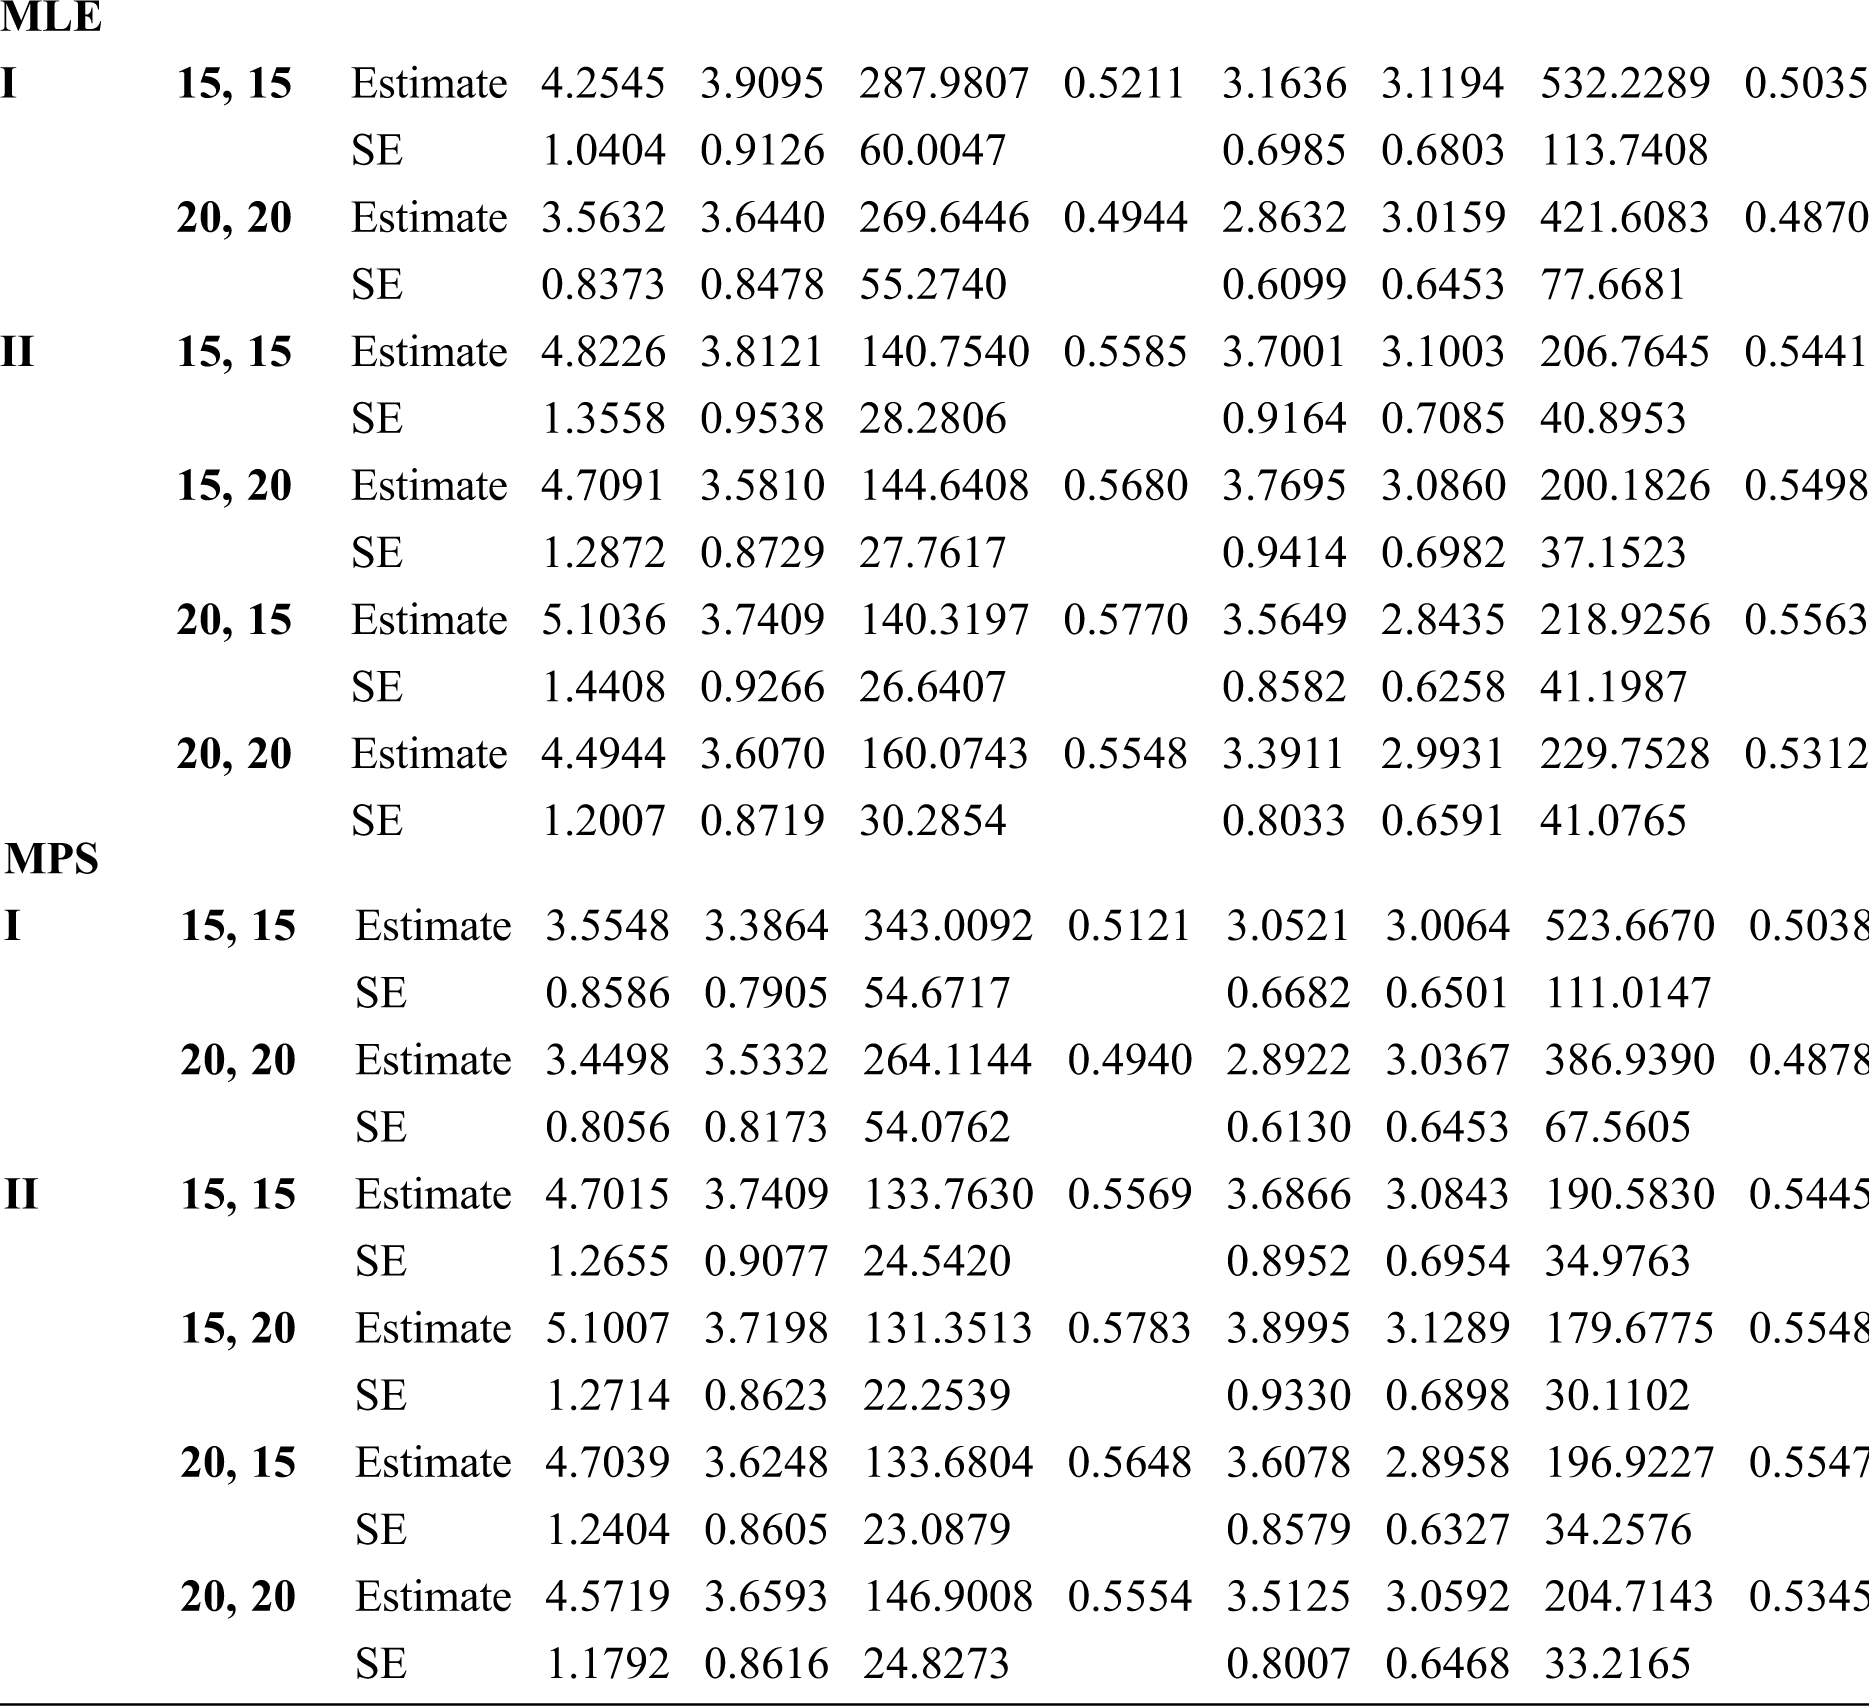
Step 6: The numerical results of parameters estimation of EG distribution under different censoring schemes are listed in Tabs. 1 and 3.
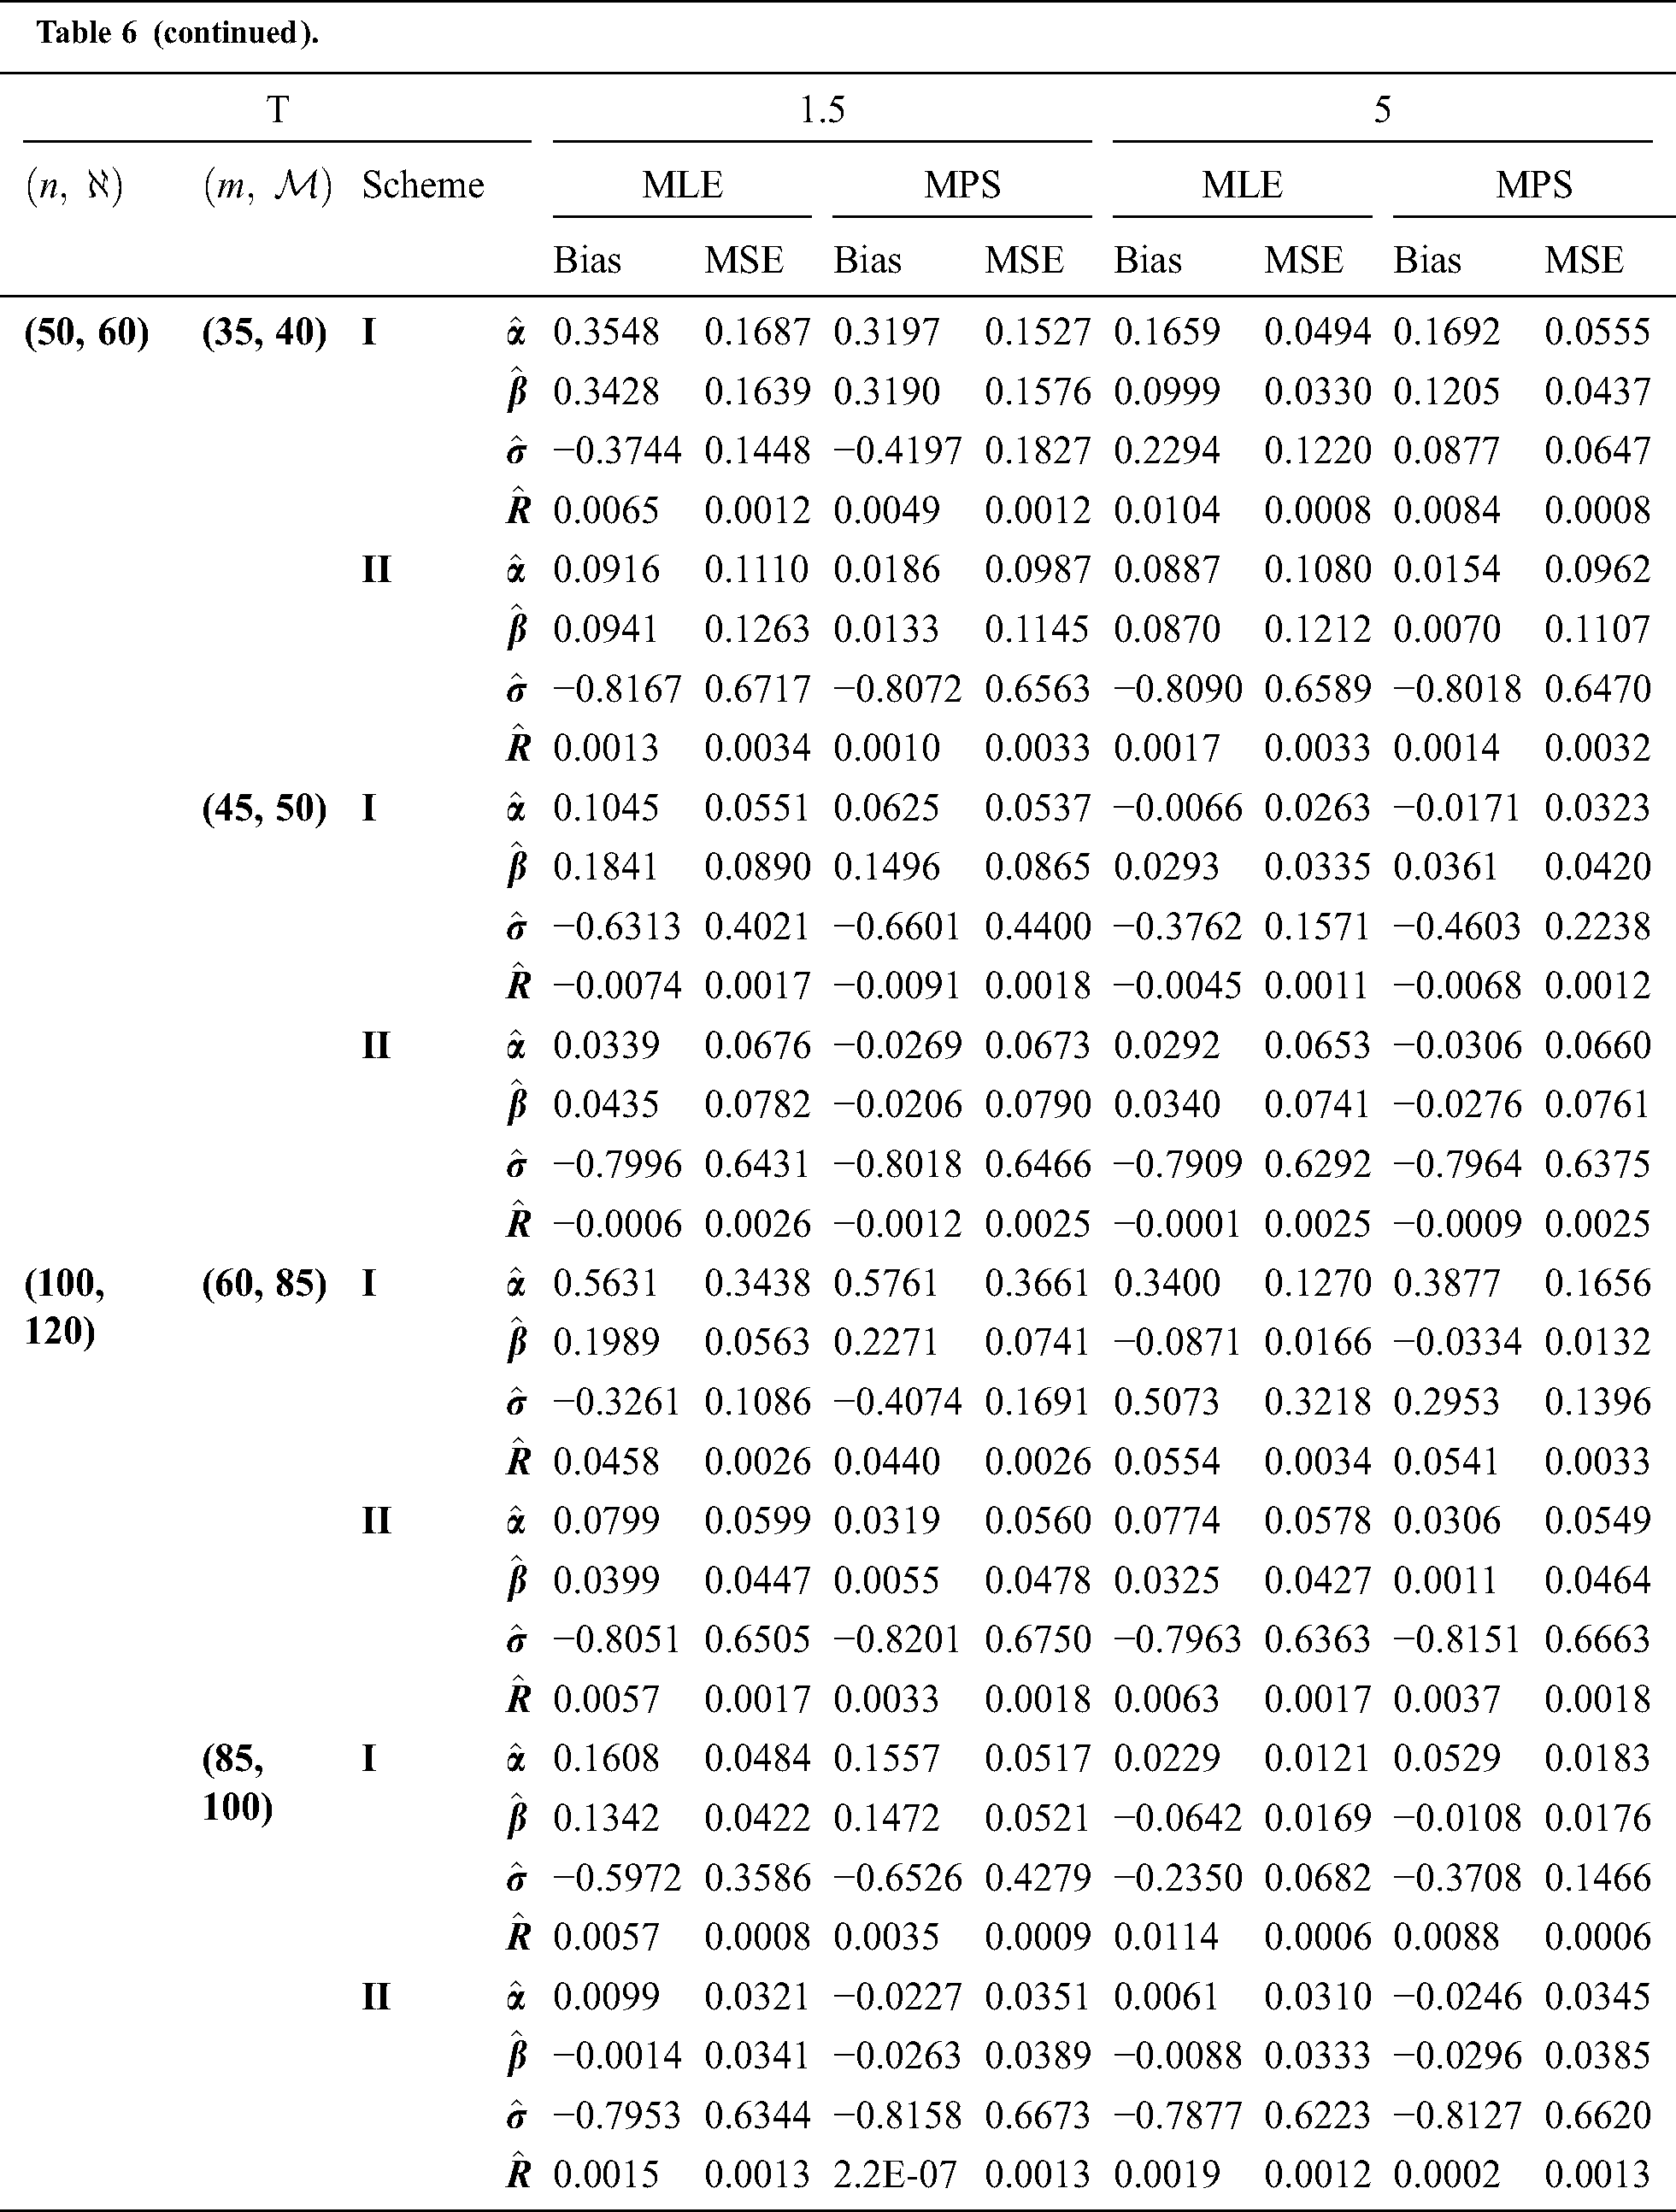
The simulation study showed that the bias and MSE of all estimators for different cases decrease when sample size of stress or/and strength increases. Furthermore, model efficiency increases when the effective sample size of the censored scheme increases. In this study, we noted that scheme I of the progressive Type-II hybrid censoring was found to be superior to scheme II. Moreover, the results showed that efficiency of the MPS estimators are over MLE’s which means that MPS estimation method is good alternative to MLE method.
Table 1: MLE and MPS of EG distribution based on stress–strength model under different censoring schemes, Case 1: 1: 
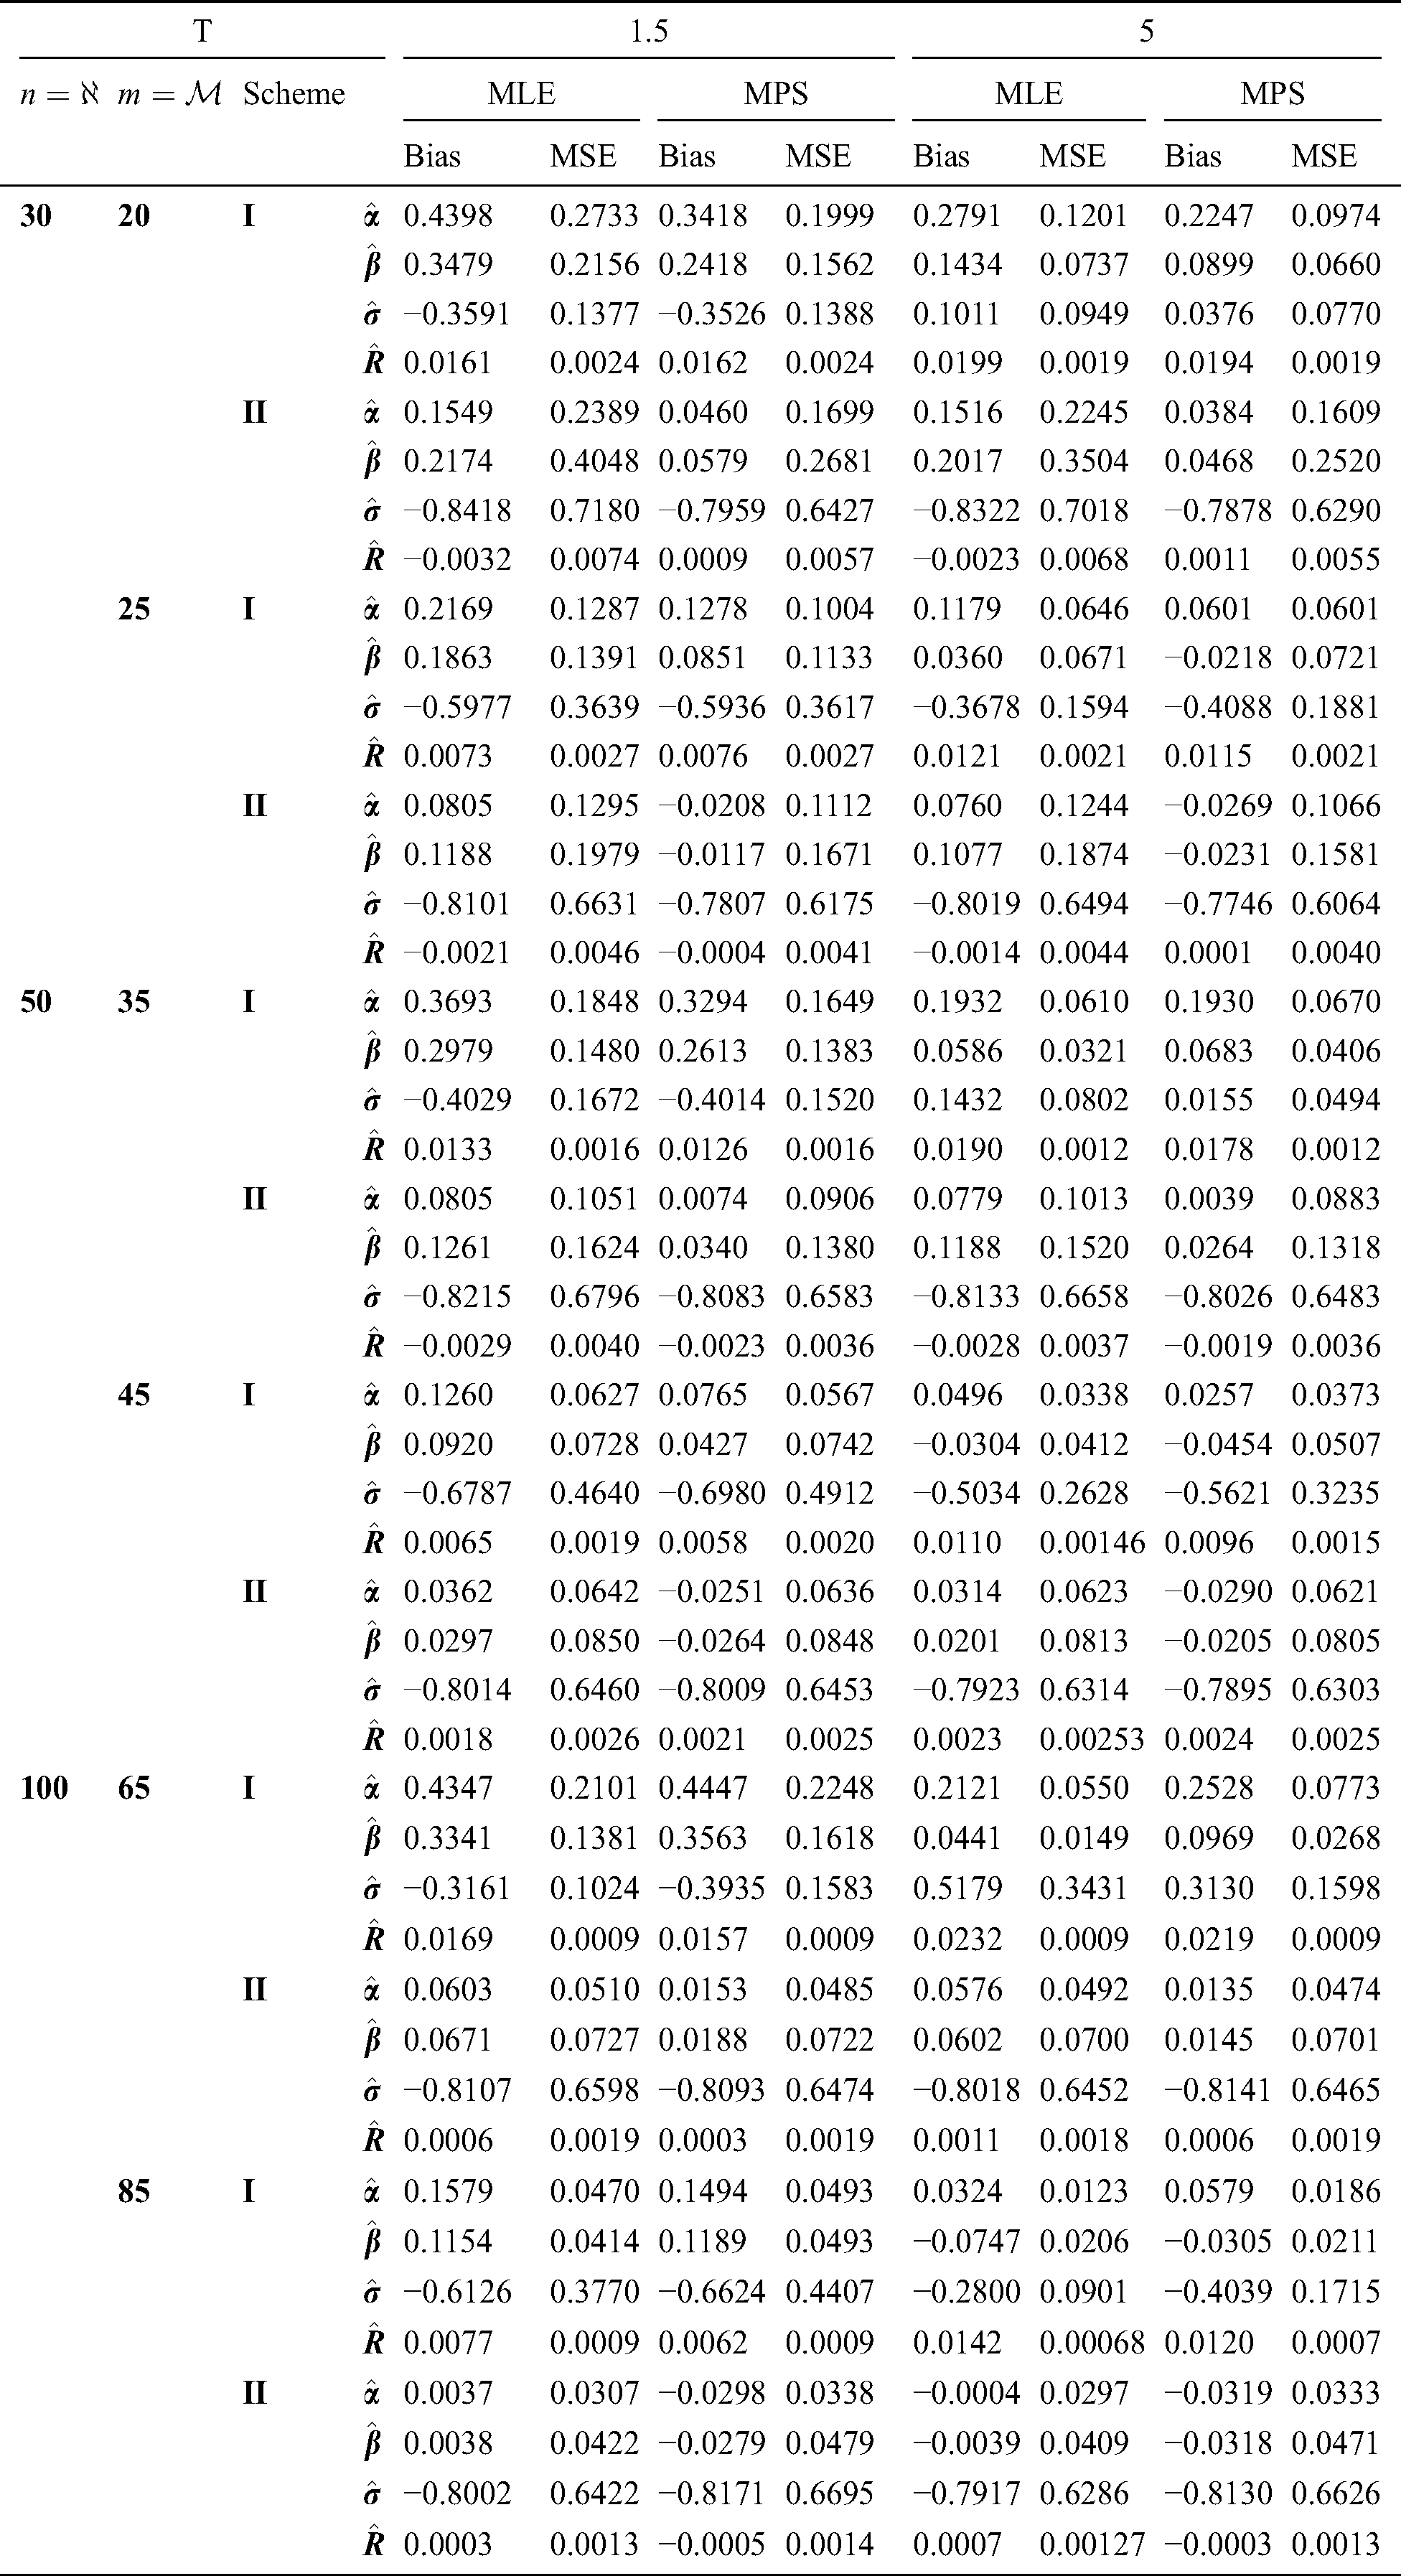
Table 2: MLE and MPS of EG distribution based on stress–strength model under different censoring schemes, Case 1: 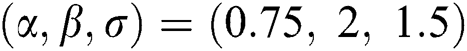
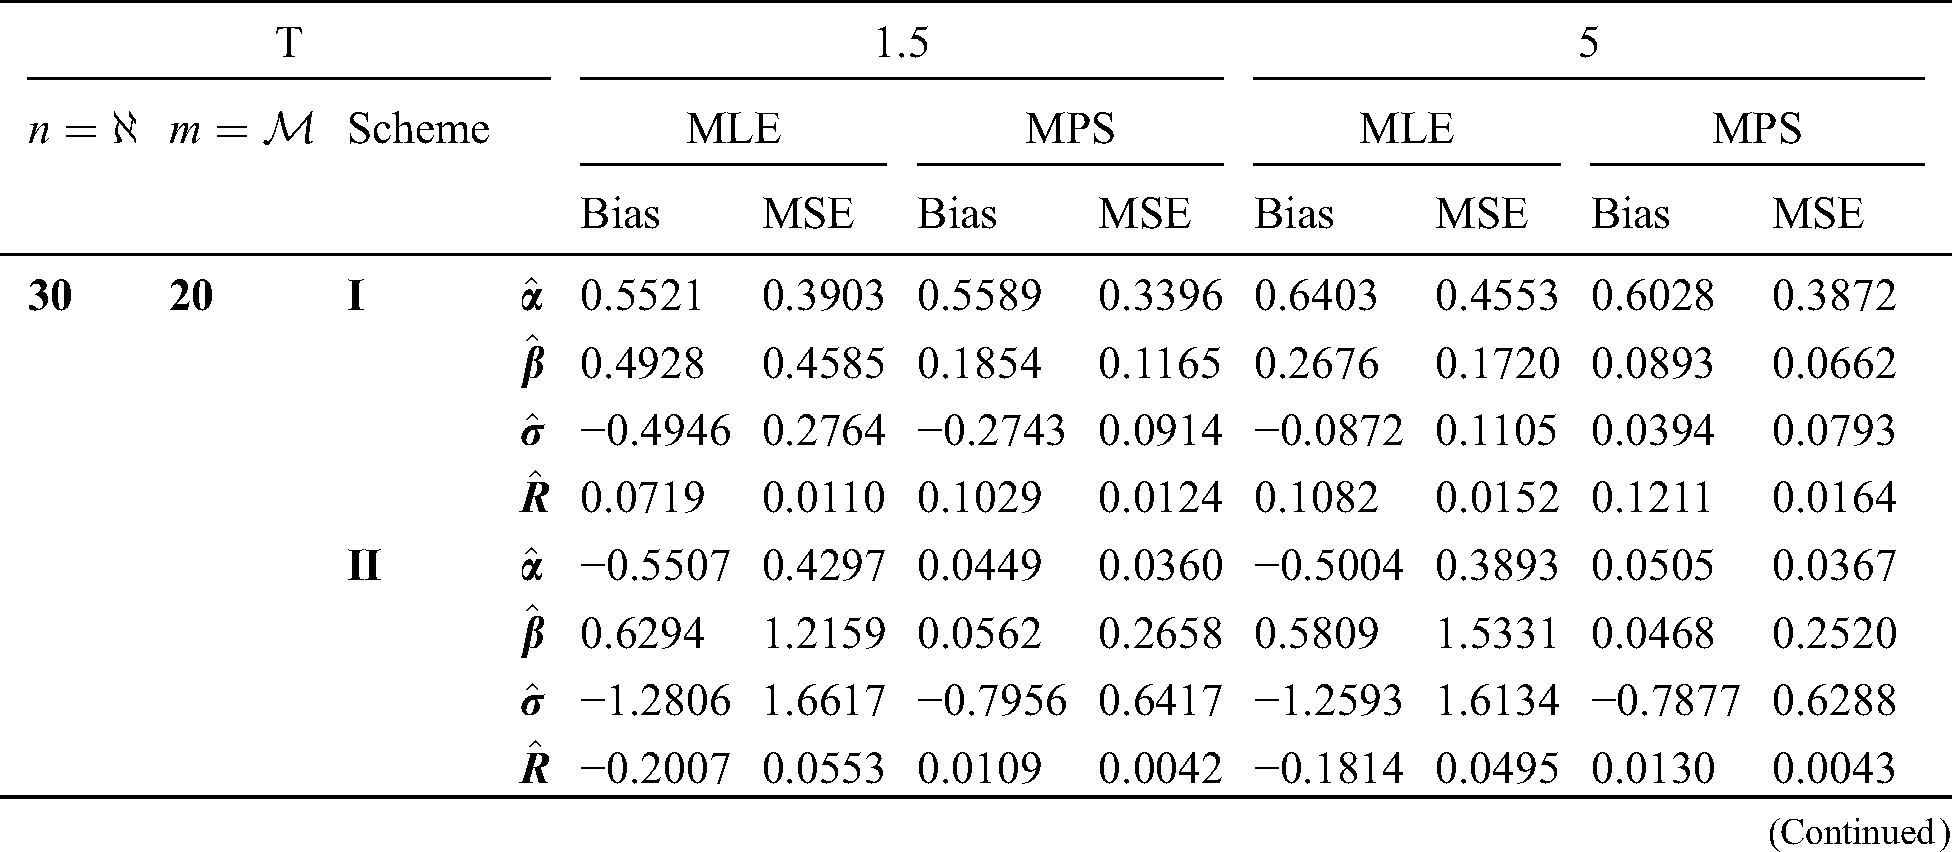
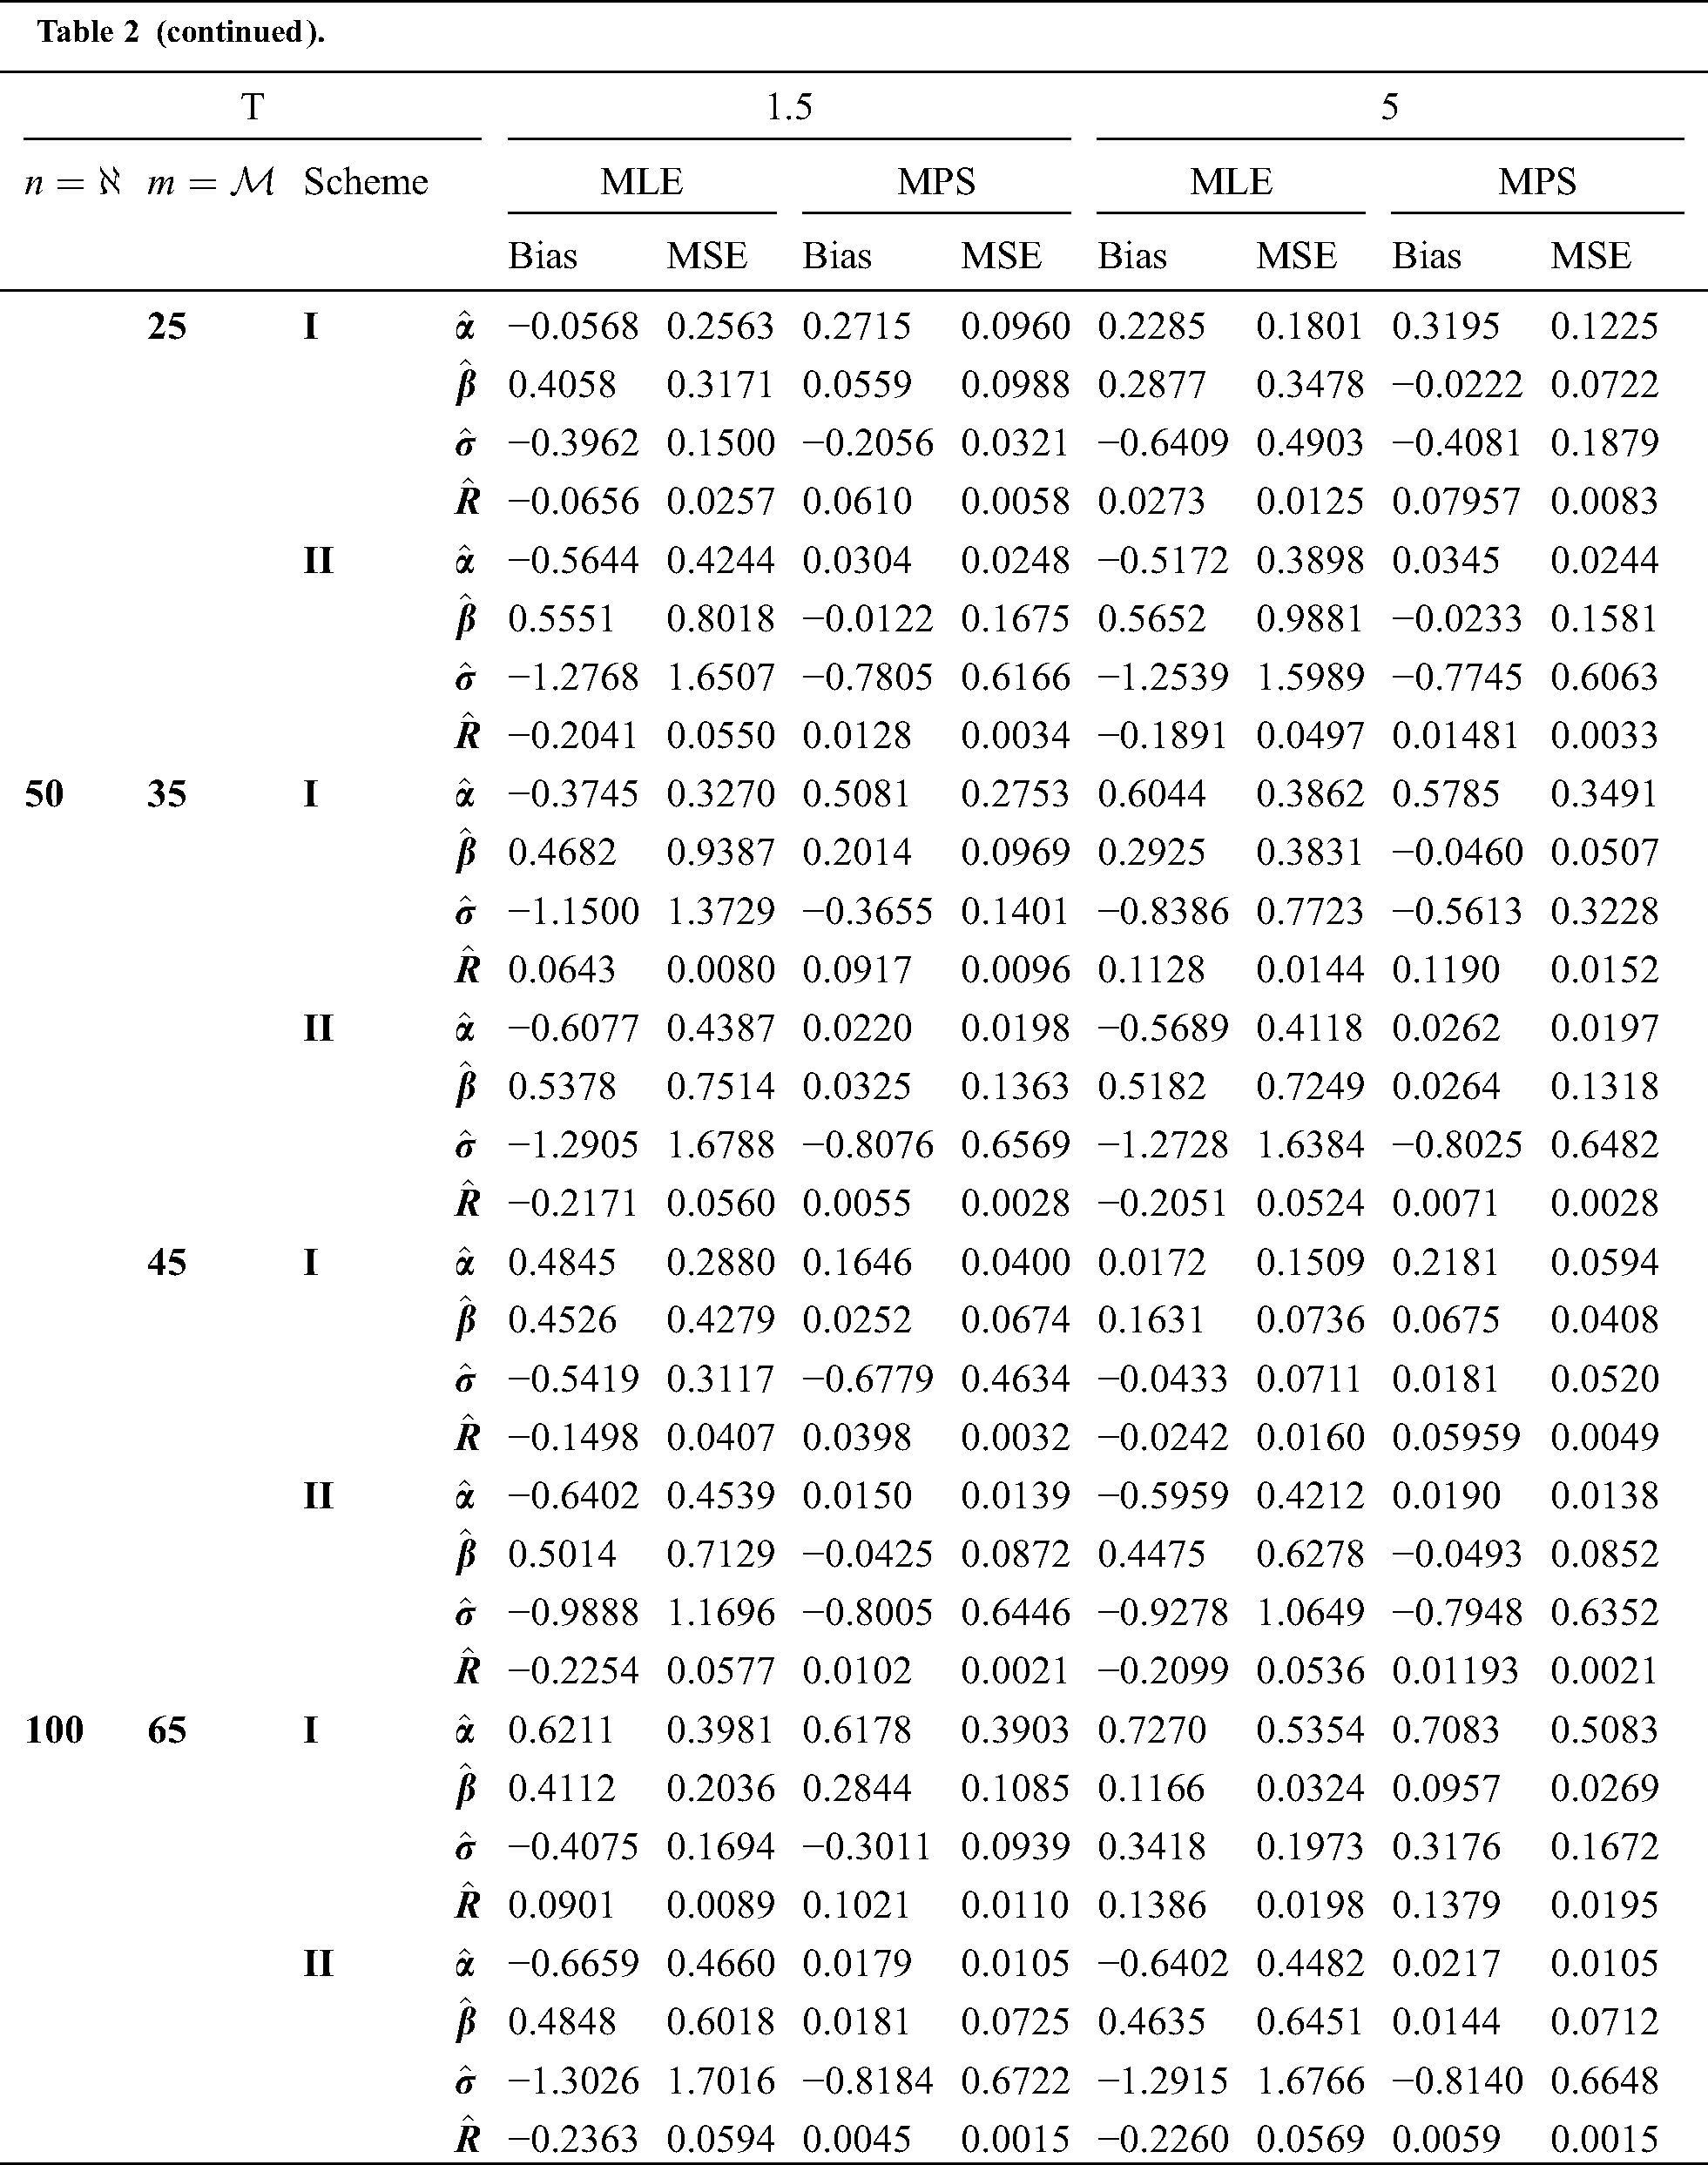
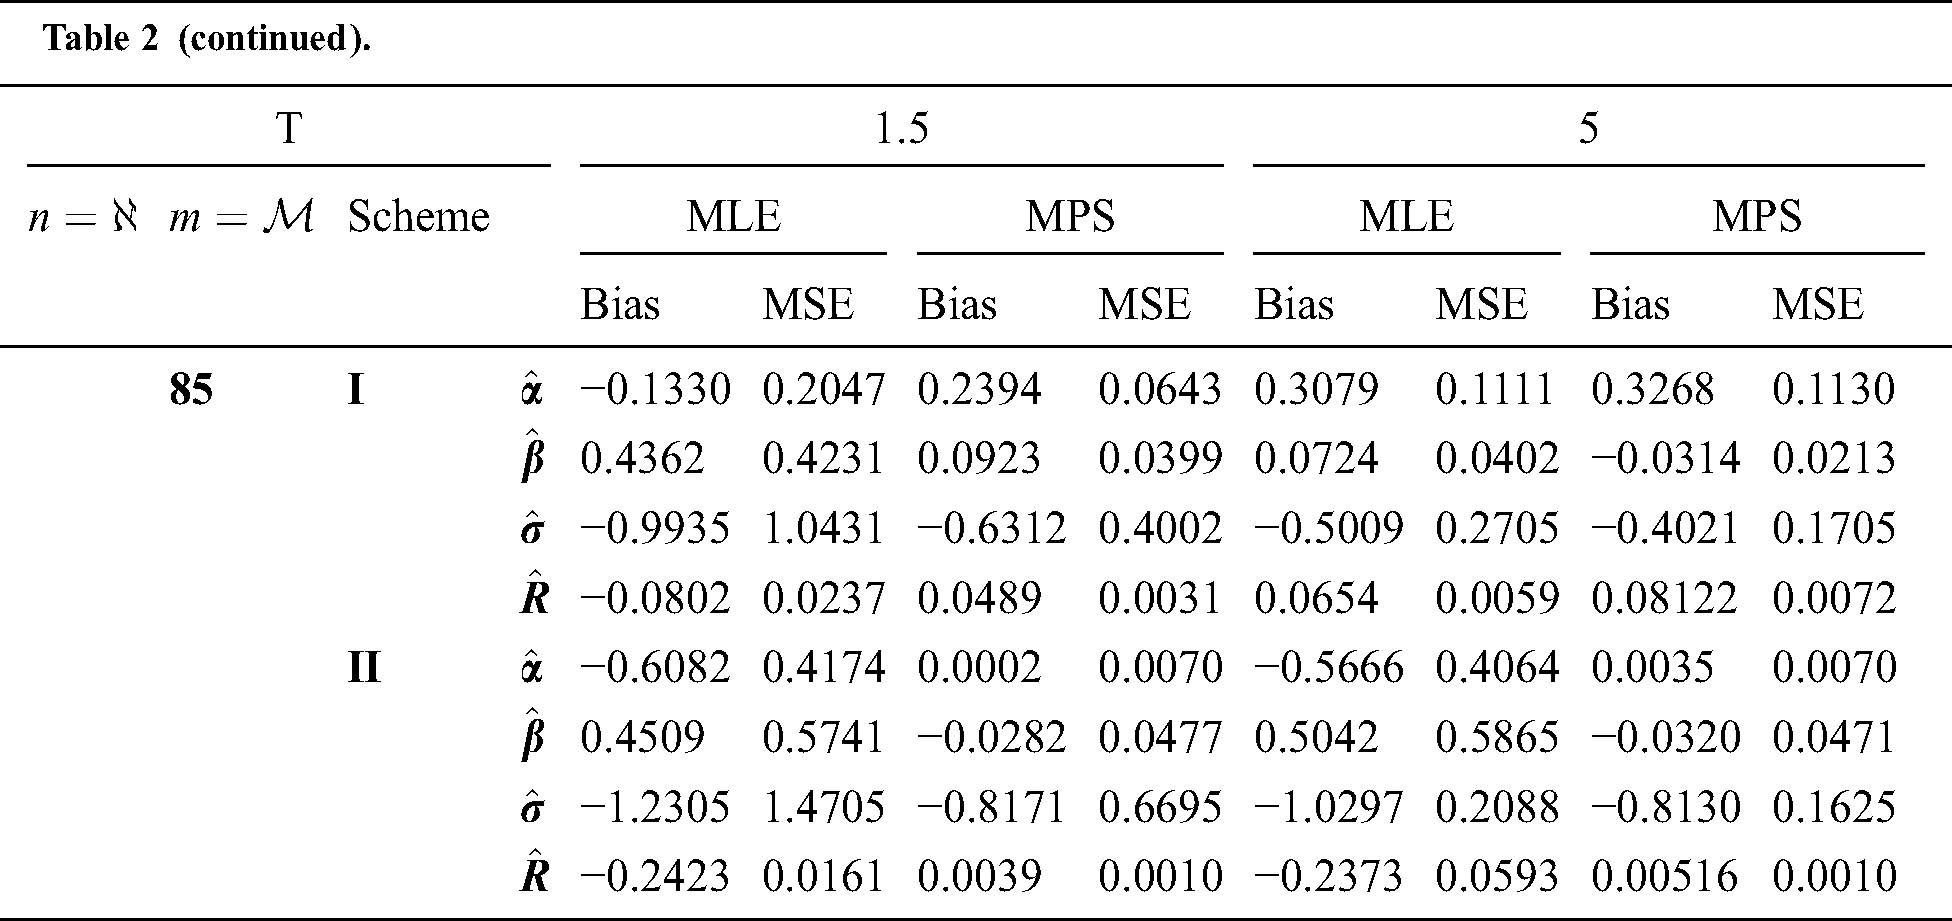
Table 3: MLE and MPS of EG distribution based on stress–strength model under different censoring schemes, Case 1: 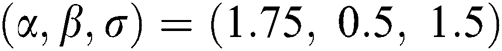
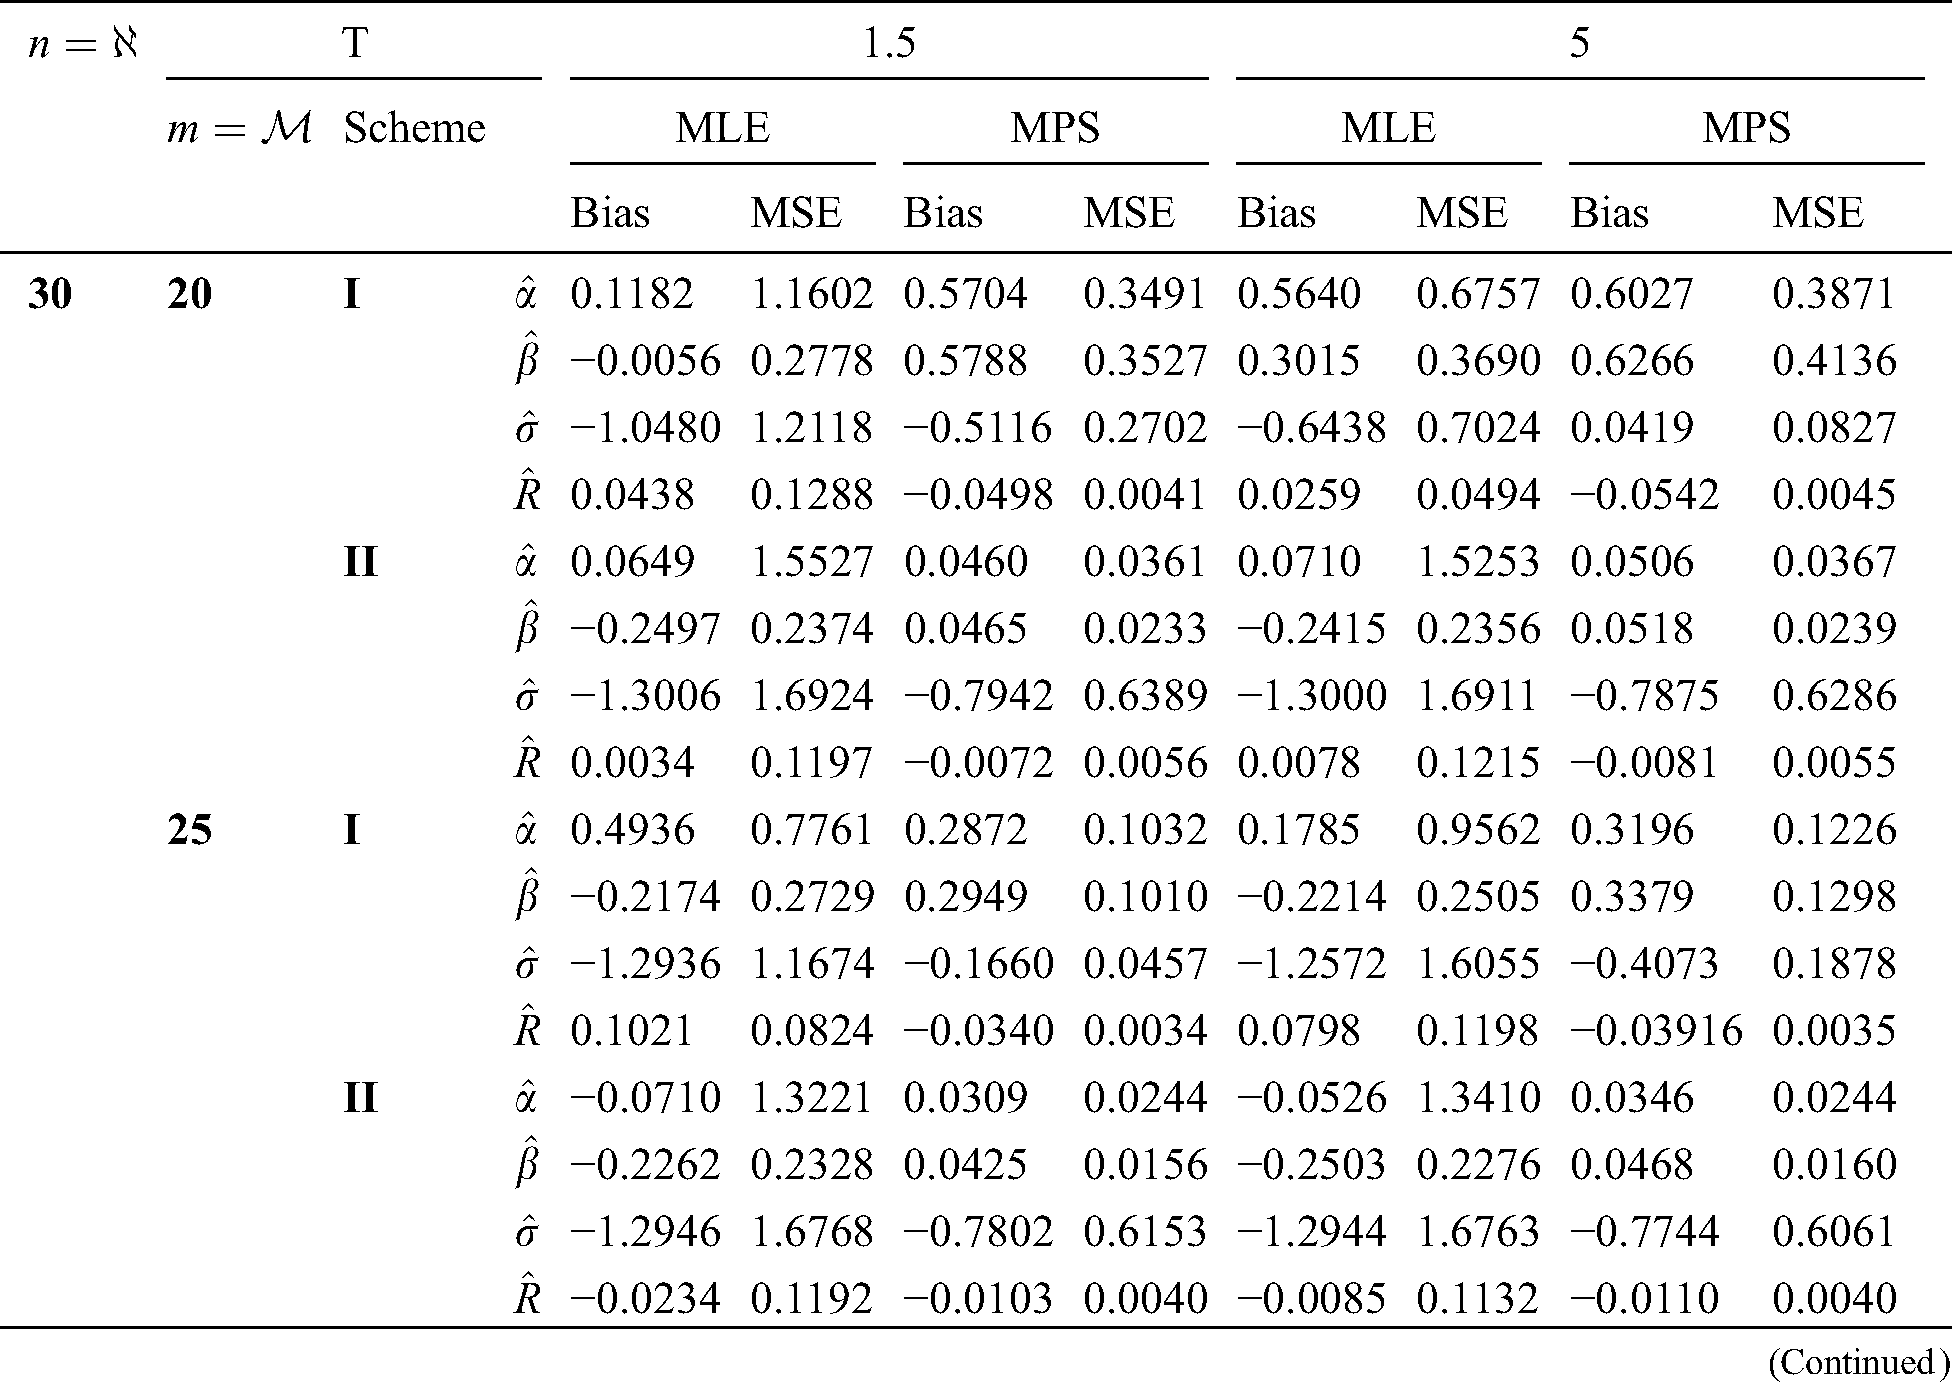
Table 4: MLE and MPS of EG distribution based on stress–strength model under different censoring schemes, Case 2: 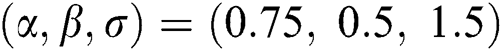
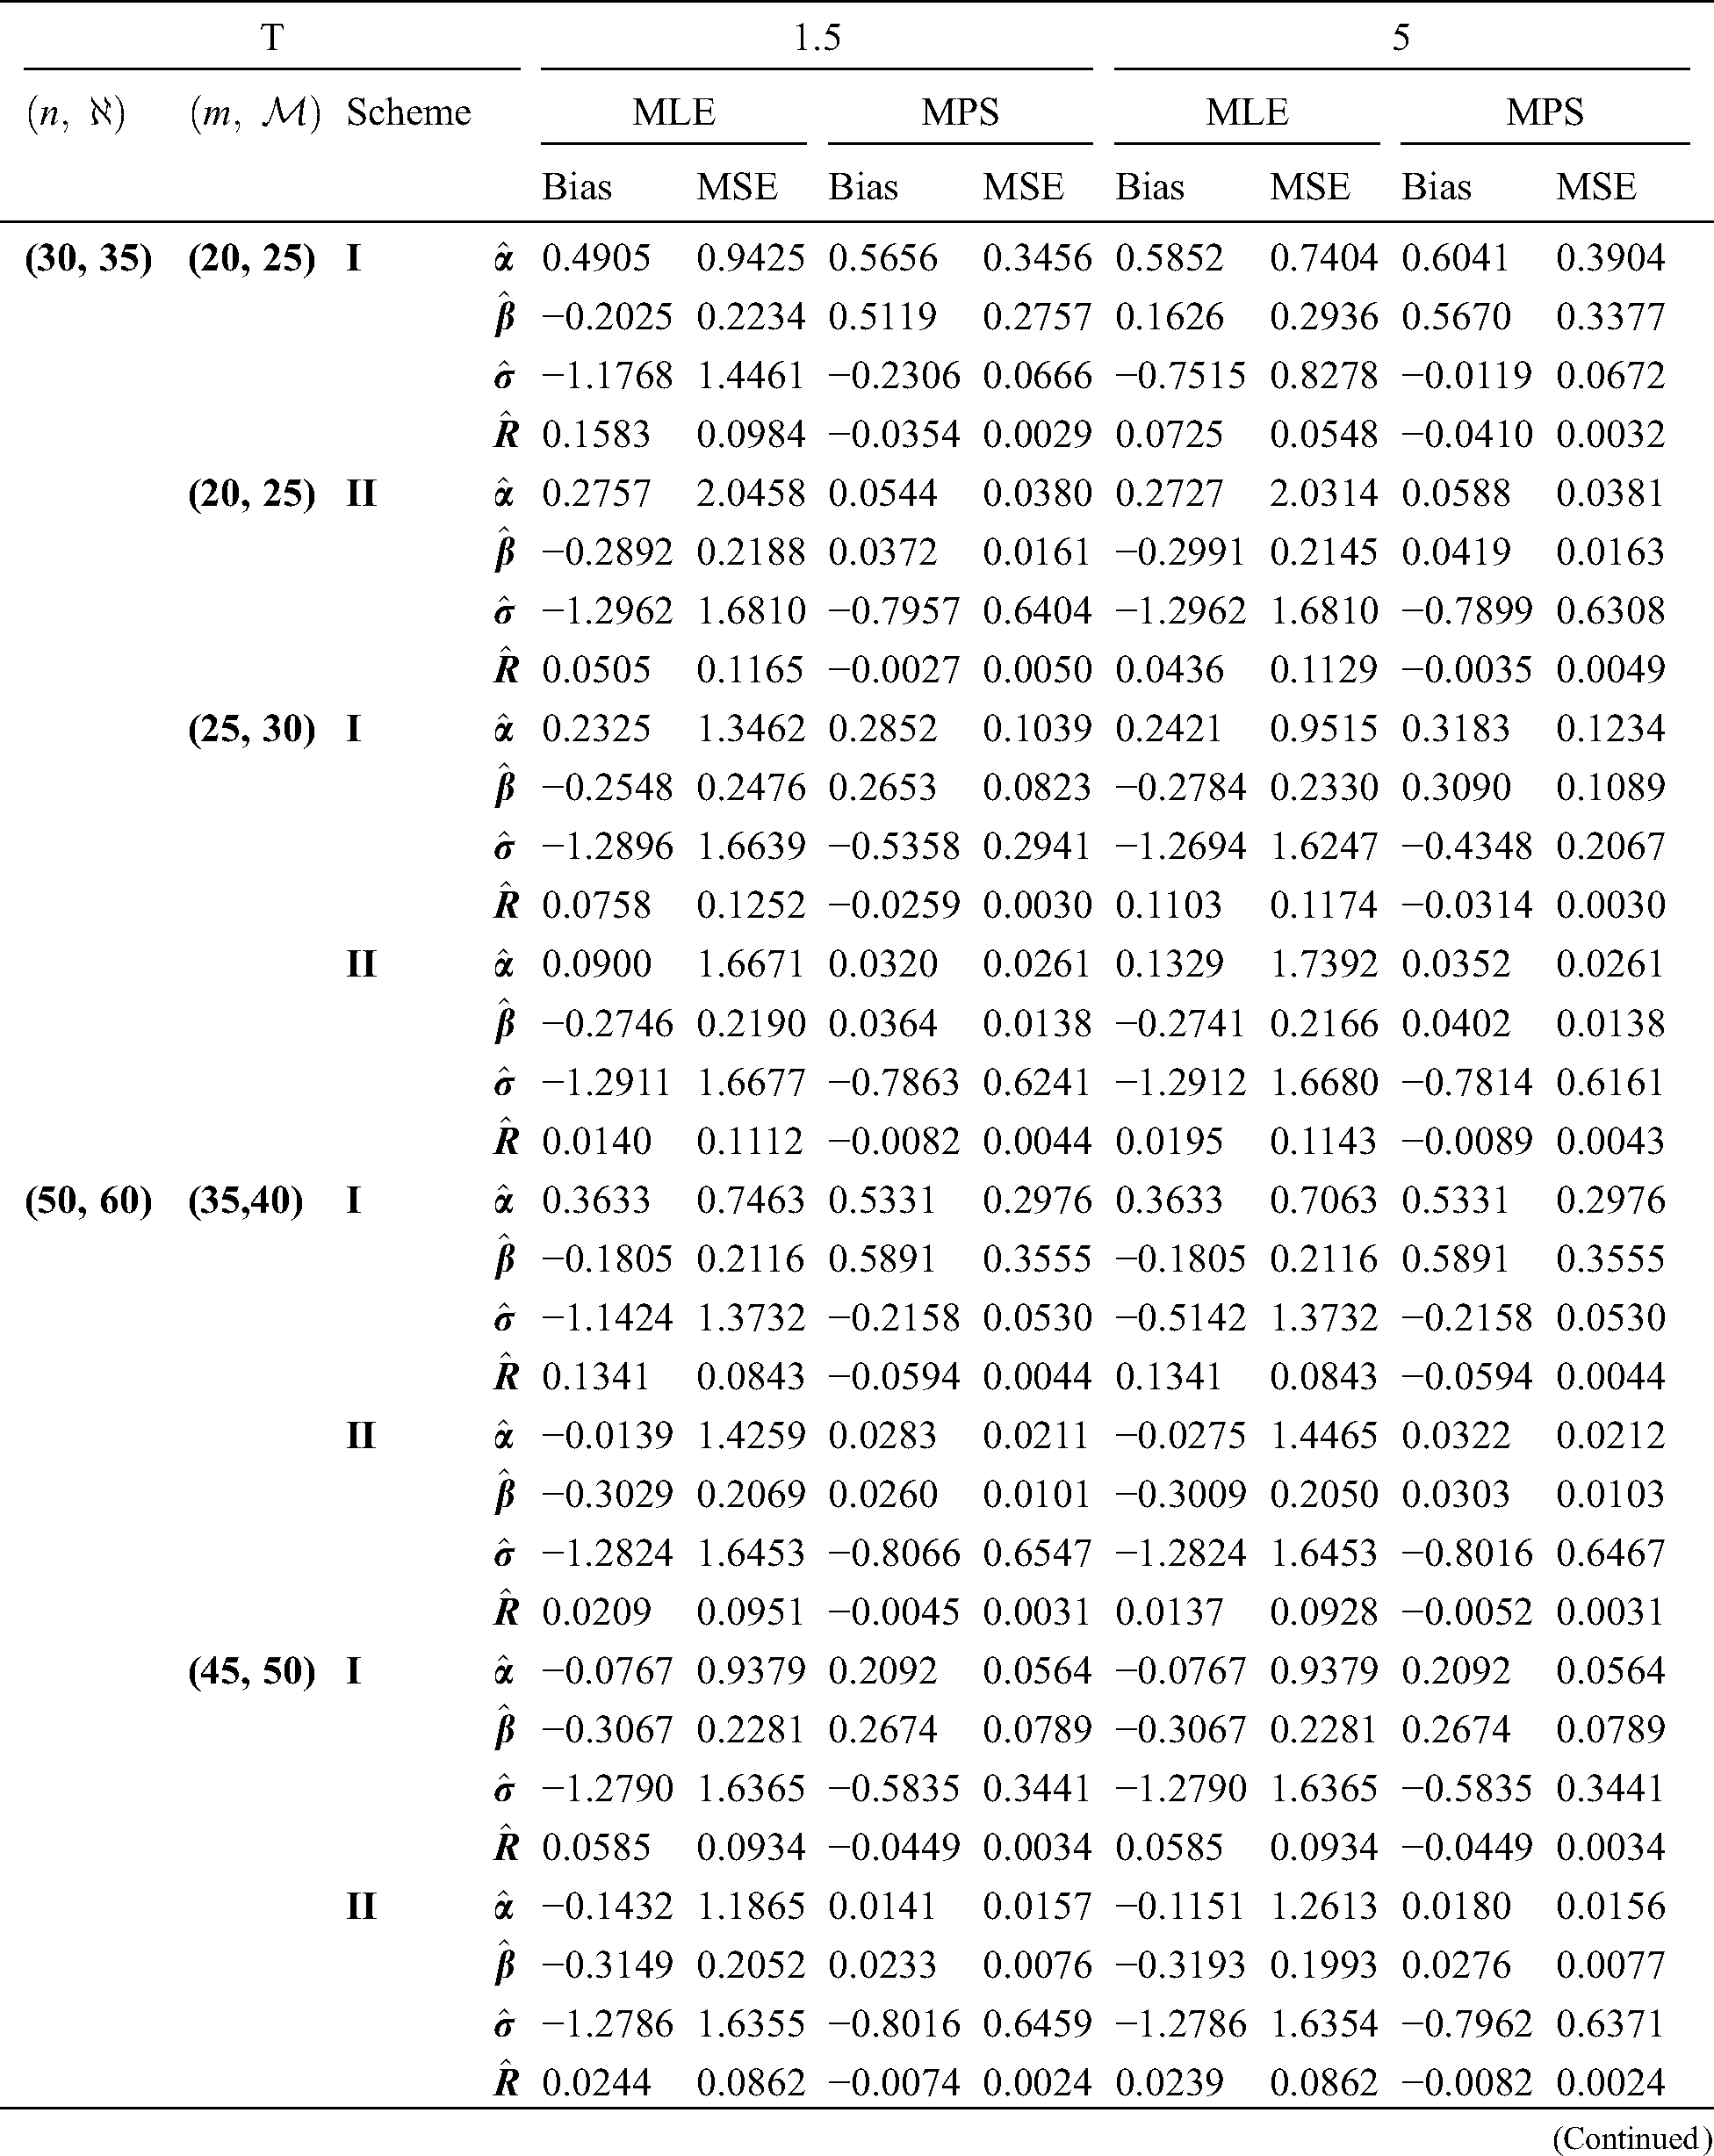
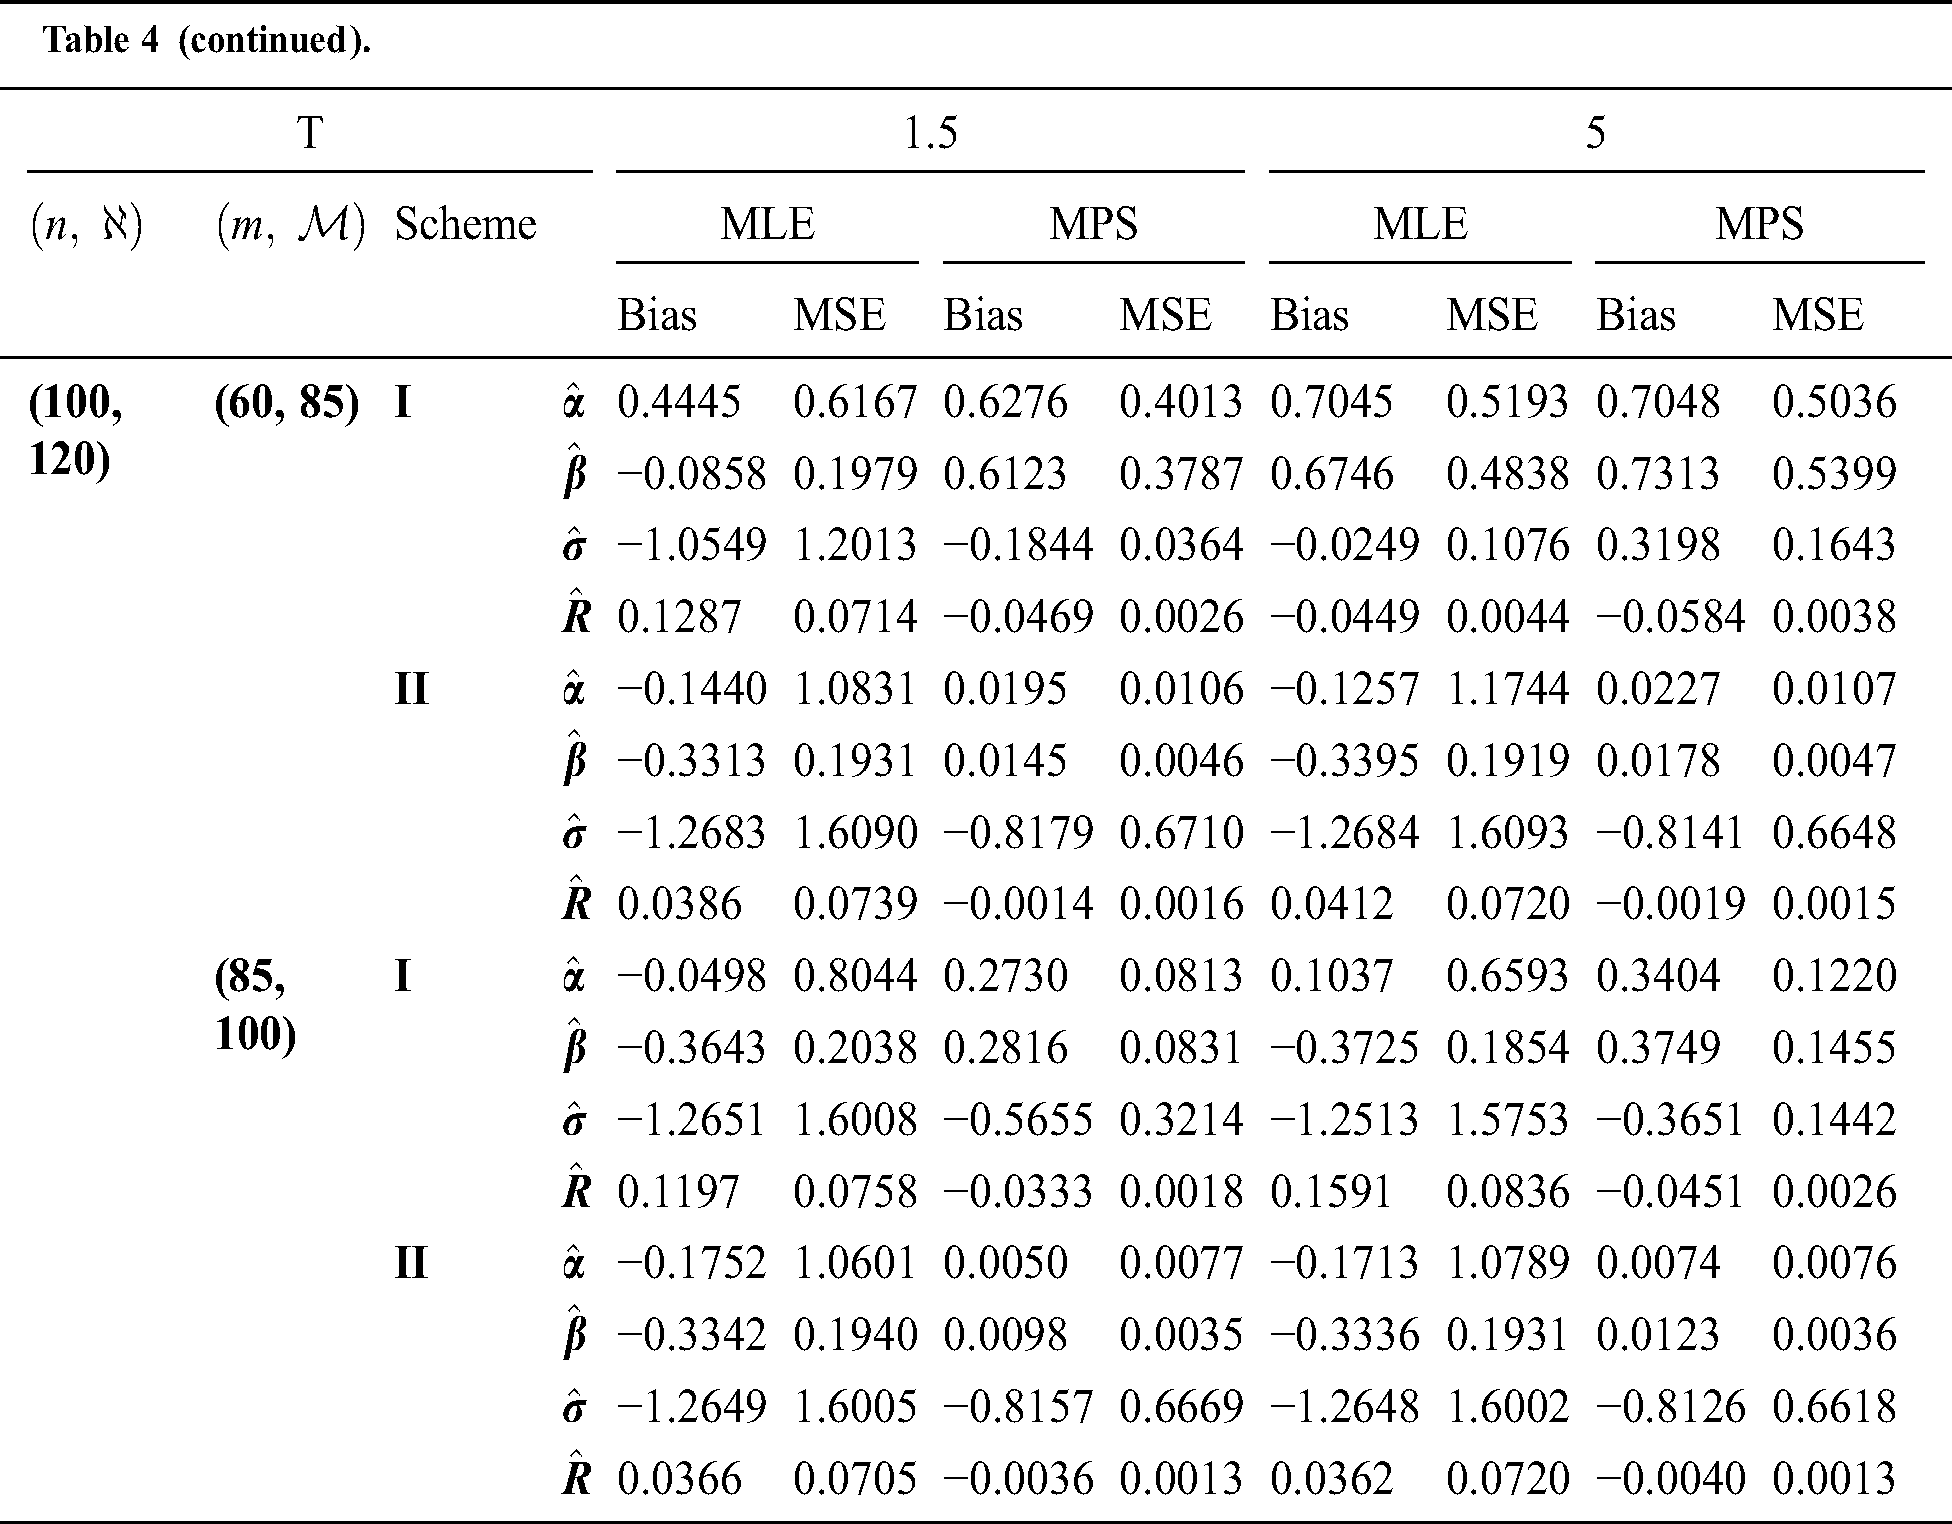
Table 5: MLE and MPS of EG distribution based on stress–strength model under different censoring schemes, Case 2: 
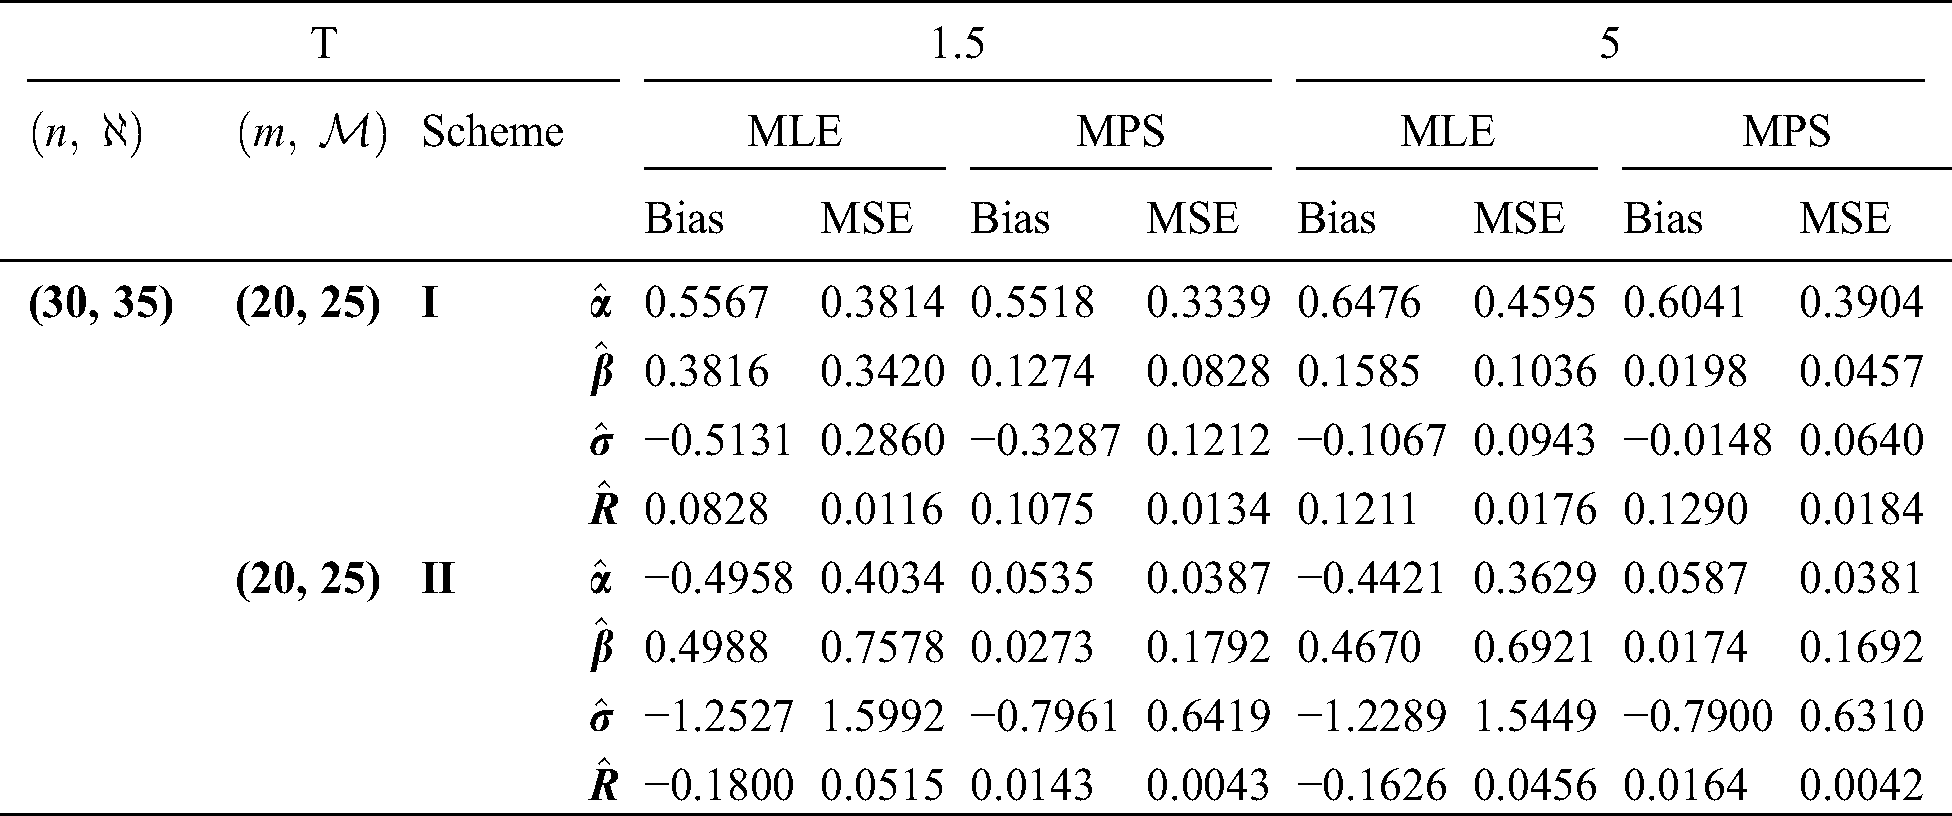
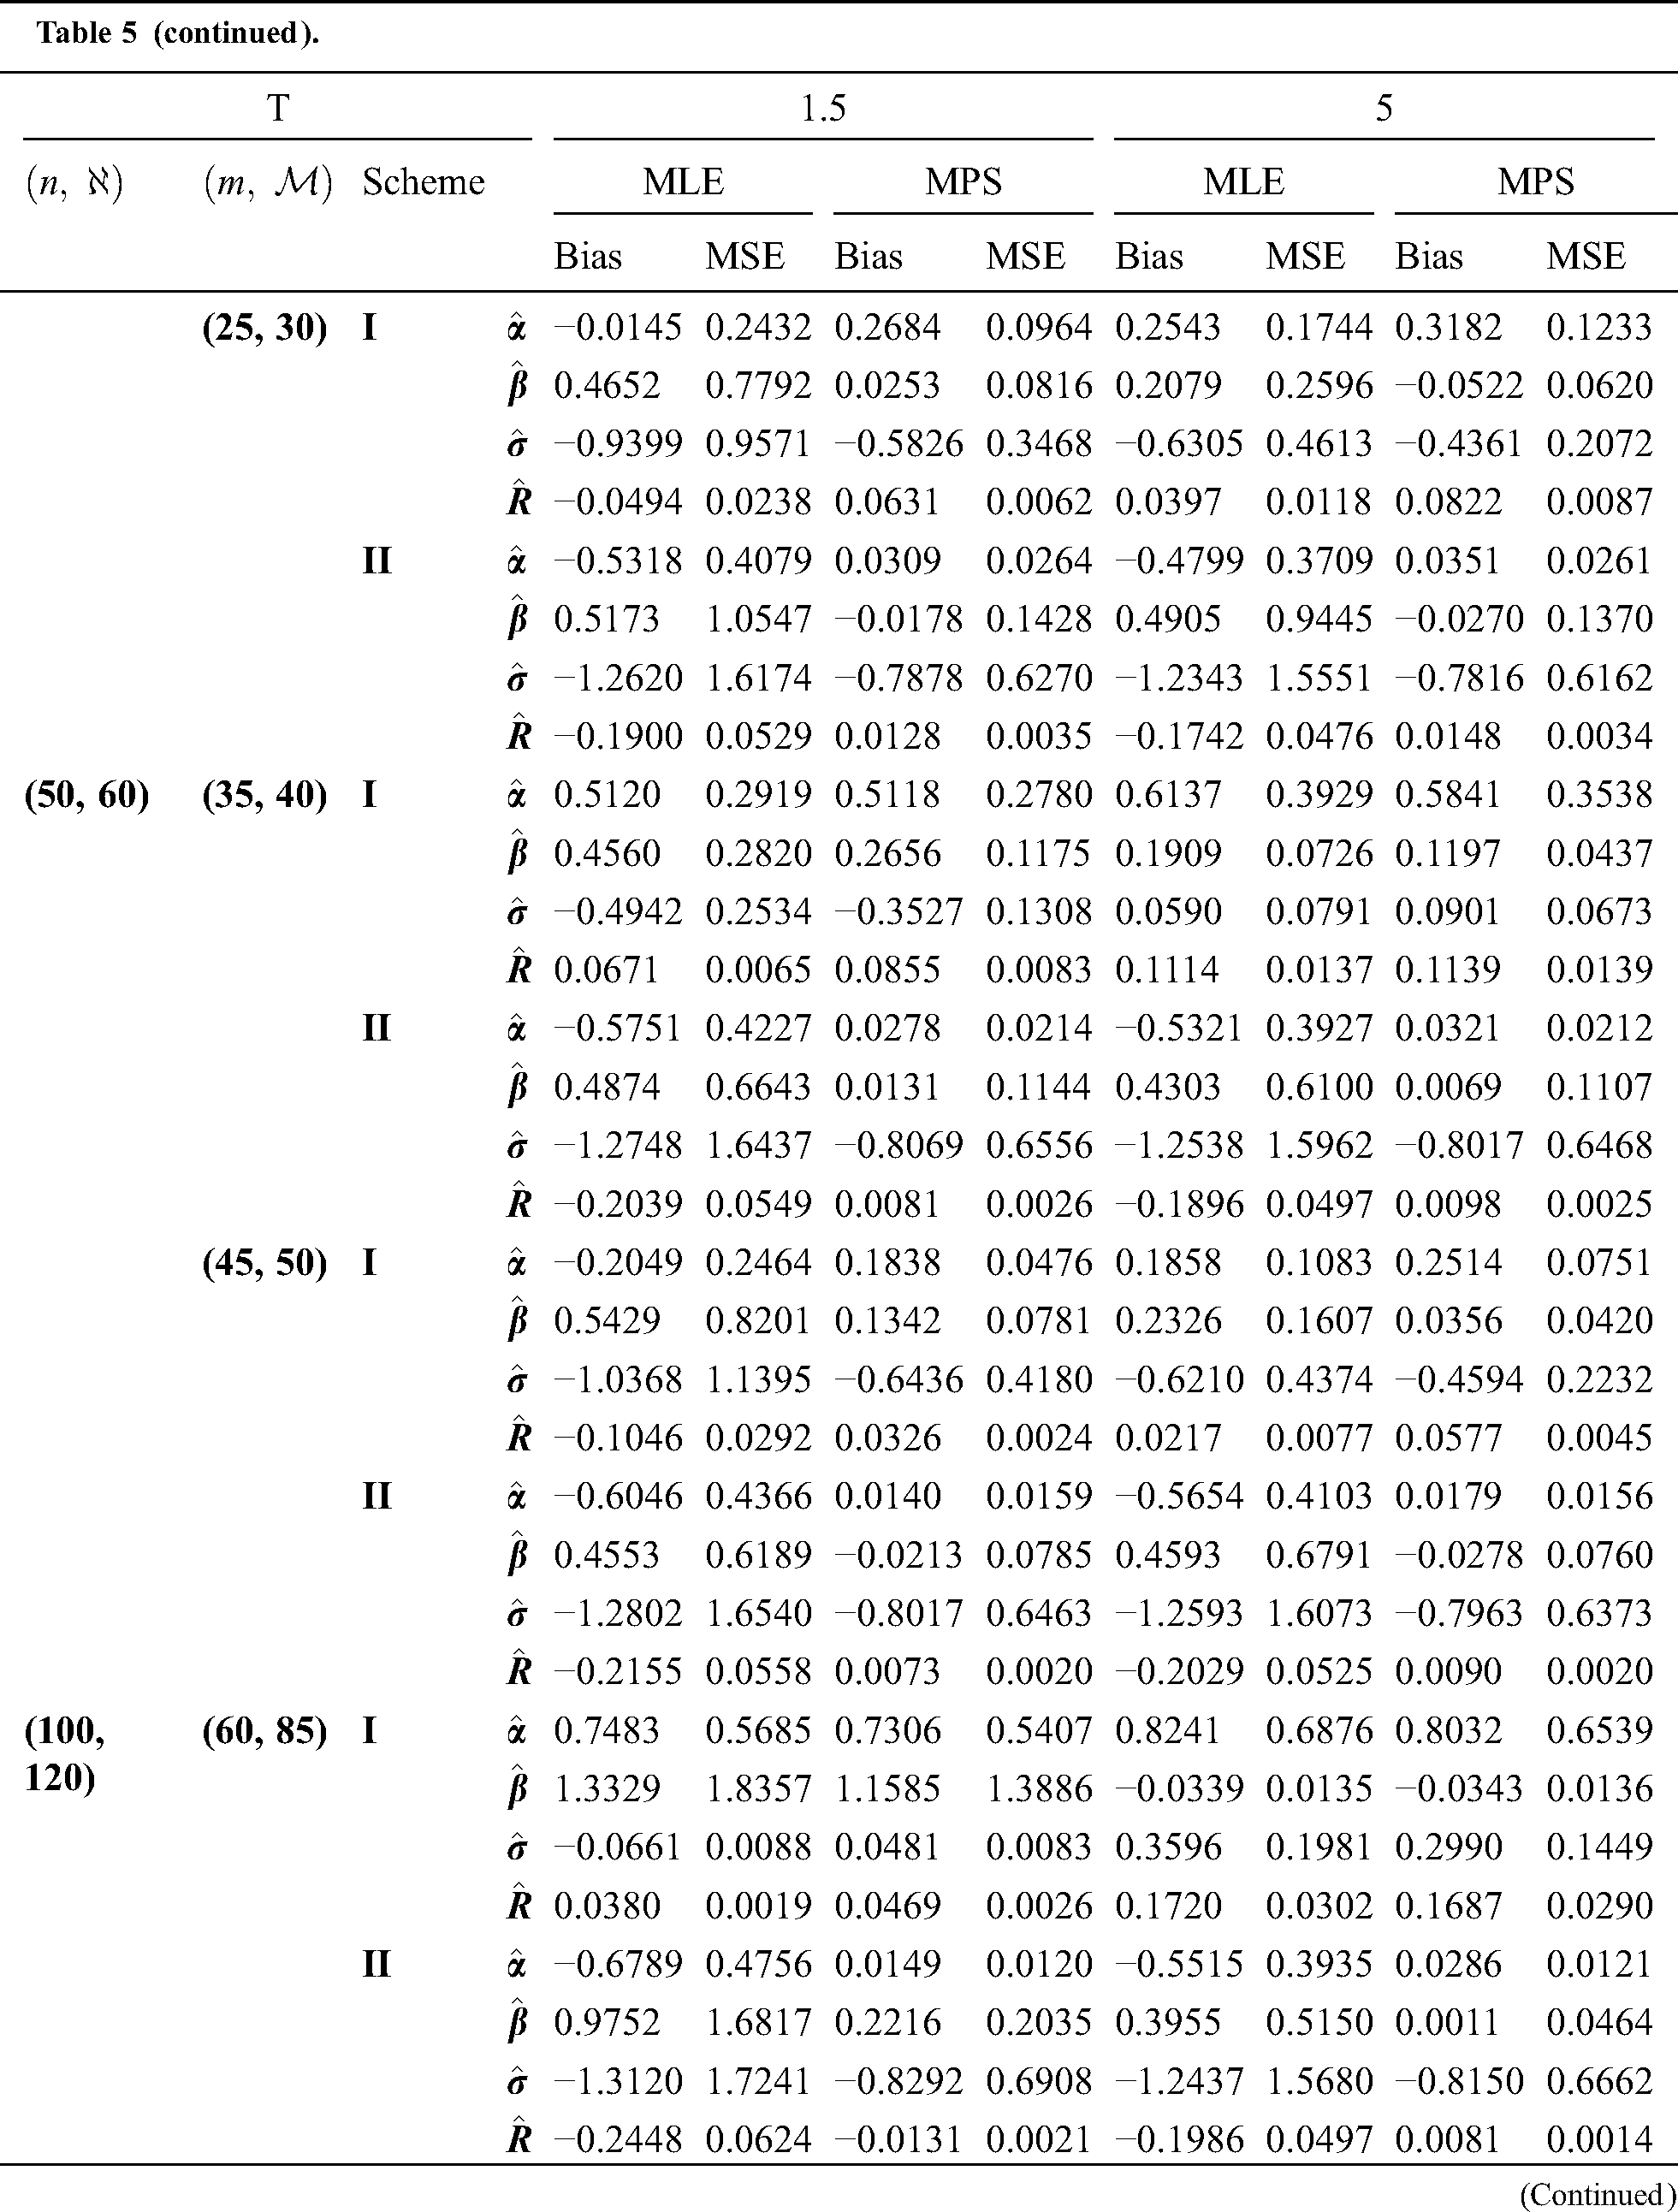
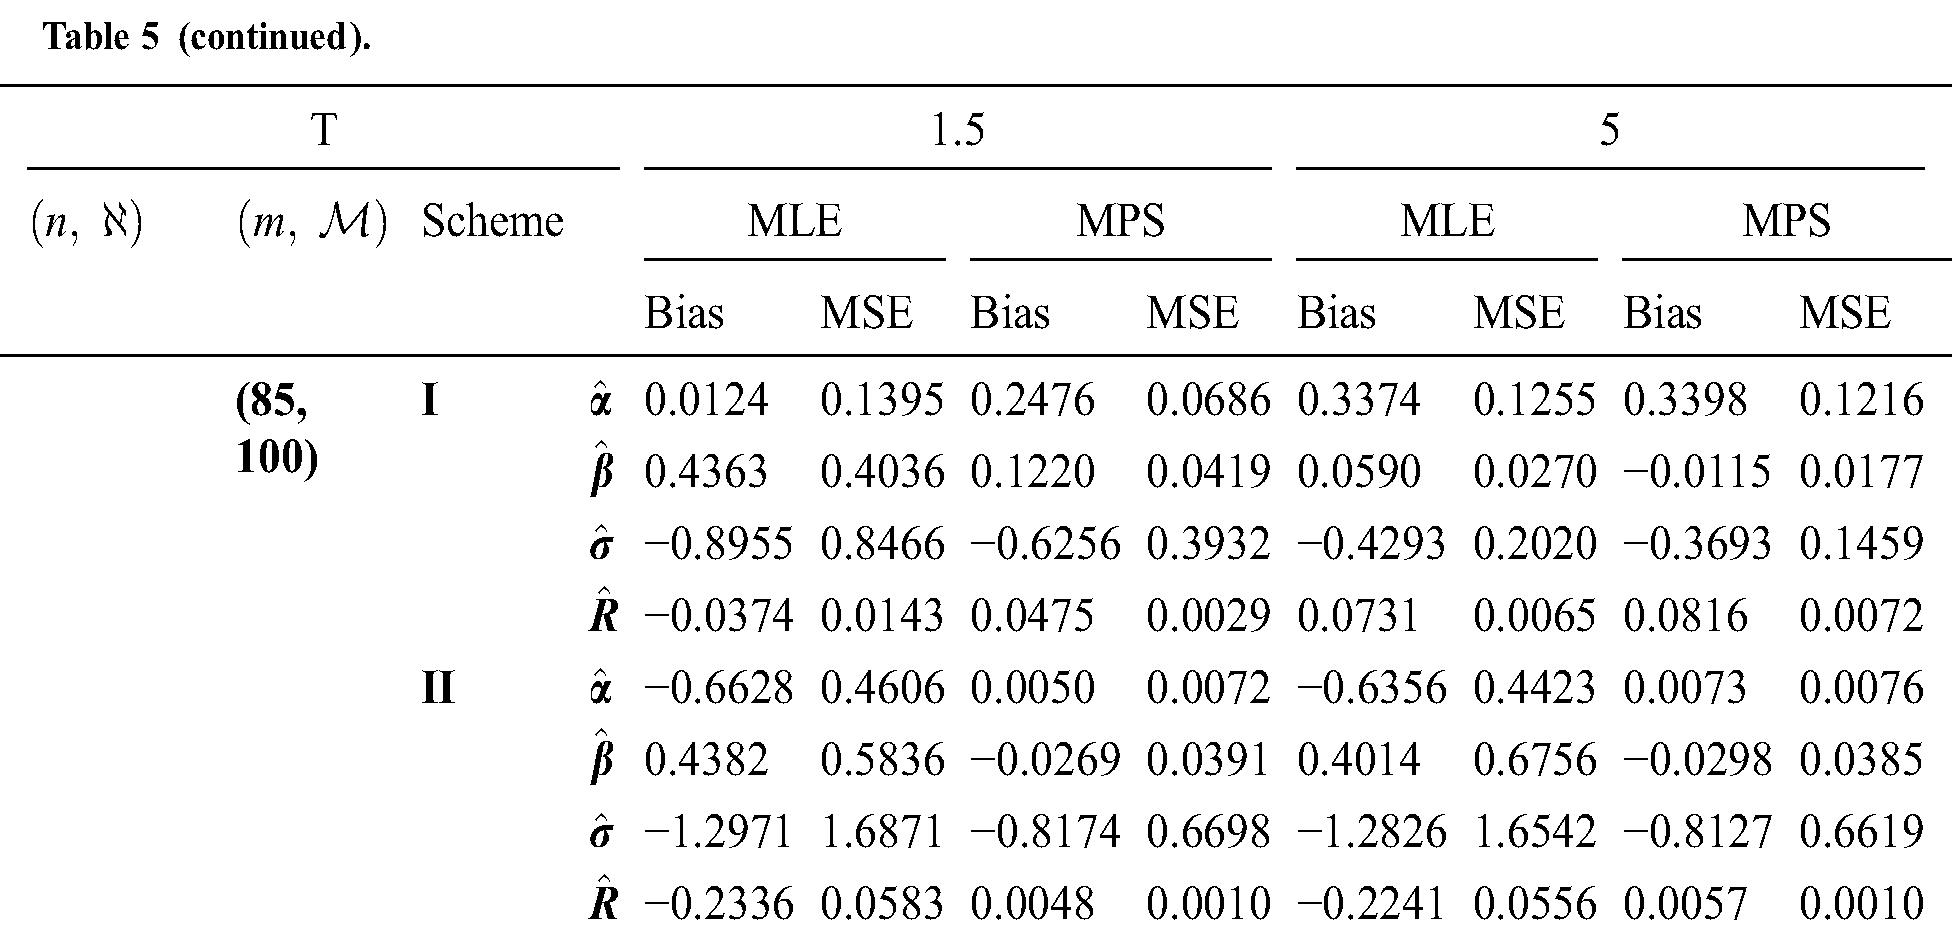
Table 6: MLE and MPS of EG distribution based on stress–strength model under different censoring schemes, Case 2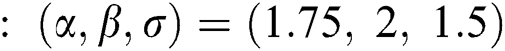
We discuss a stress–strength reliability of EG distribution using real data set to illustrate estimation methods of EG distribution based on stress–strength reliability model provides significant improvements over.
Data Set 1: The real data sets of the waiting times before service of the customers of two banks A and B, respectively have been used. These data sets have been discussed by Reference [31] for estimating the stress–strength reliability in case of the Generalized Lindley distribution.
Data of Bank A: 0.8, 0.8, 1.3, 1.5, 1.8, 1.9, 1.9, 2.1, 2.6, 2.7, 2.9, 3.1, 3.2, 3.3, 3.5, 3.6, 4.0, 4.1, 4.2, 4.2, 4.3, 4.3, 4.4, 4.4, 4.6, 4.7, 4.7, 4.8, 4.9, 4.9, 5.0, 5.3, 5.5, 5.7, 5.7, 6.1, 6.2, 6.2, 6.2, 6.3, 6.7, 6.9, 7.1, 7.1, 7.1, 7.1, 7.4, 7.6, 7.7, 8.0, 8.2, 8.6, 8.6, 8.6, 8.8, 8.8, 8.9, 8.9, 9.5, 9.6, 9.7, 9.8, 10.7, 10.9, 11.0, 11.0, 11.1, 11.2, 11.2, 11.5, 11.9, 12.4, 12.5, 12.9, 13.0, 13.1, 13.3, 13.6, 13.7, 13.9, 14.1, 15.4, 15.4, 17.3, 17.3, 18.1, 18.2, 18.4, 18.9, 19.0, 19.9, 20.6, 21.3, 21.4, 21.9, 23.0, 27.0, 31.6, 33.1, 38.5.
Data of Bank B: 0.1, 0.2, 0.3, 0.7, 0.9, 1.1, 1.2, 1.8, 1.9, 2.0, 2.2, 2.3, 2.3, 2.3, 2.5, 2.6, 2.7, 2.7, 2.9, 3.1, 3.1, 3.2, 3.4, 3.4, 3.5, 3.9, 4.0, 4.2, 4.5, 4.7, 5.3, 5.6, 5.6, 6.2, 6.3, 6.6, 6.8, 7.3, 7.5, 7.7, 7.7, 8.0, 8.0, 8.5, 8.5, 8.7, 9.5, 10.7, 10.9, 11.0, 12.1, 12.3, 12.8, 12.9, 13.2, 13.7, 14.5, 16.0, 16.5, 28.0.
Fig. 1 Shows plots of the fitted pdf, cdf and p-p plot of the EG distribution for these data and the results of MLE estimates of  along with the value of standard error, Kolmogorov–Smirnov and the p-value are confirmed in Tab. 7, while Tab. 8 provides the MLE estimates of R for the Bank data based on stress–strength model under different Censoring Schemes.
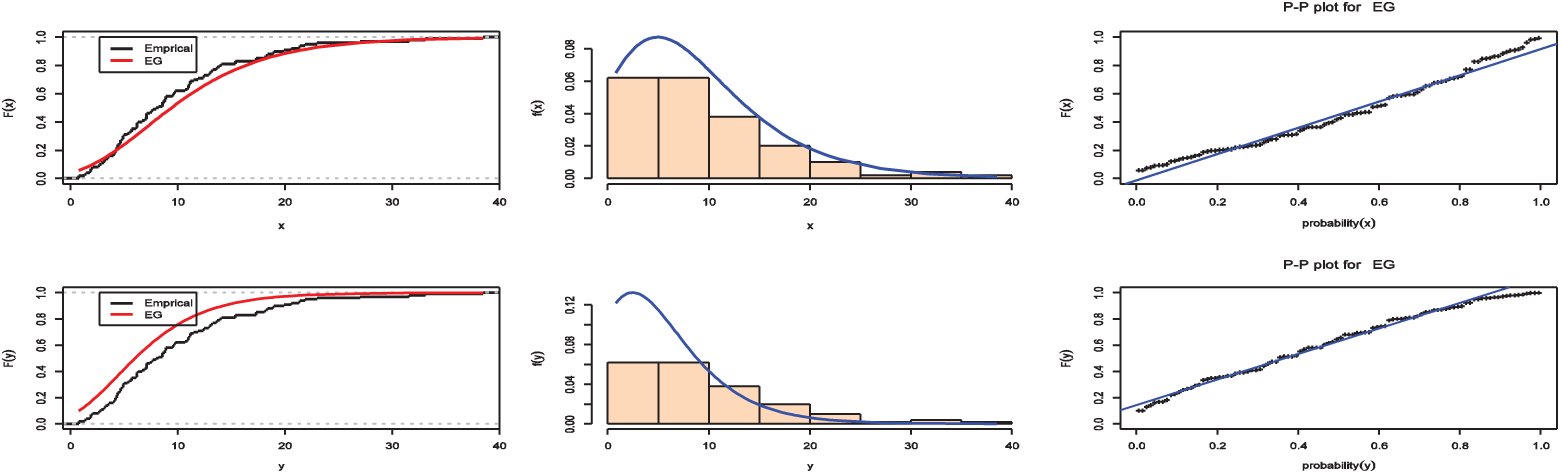
Figure 1: Plots of the fitted pdf, cdf and p-p plot of the EG distribution for banking data
Table 7: Estimate, stander error, Kolmogorov–Smirnov test and reliability for EG distribution for banking data
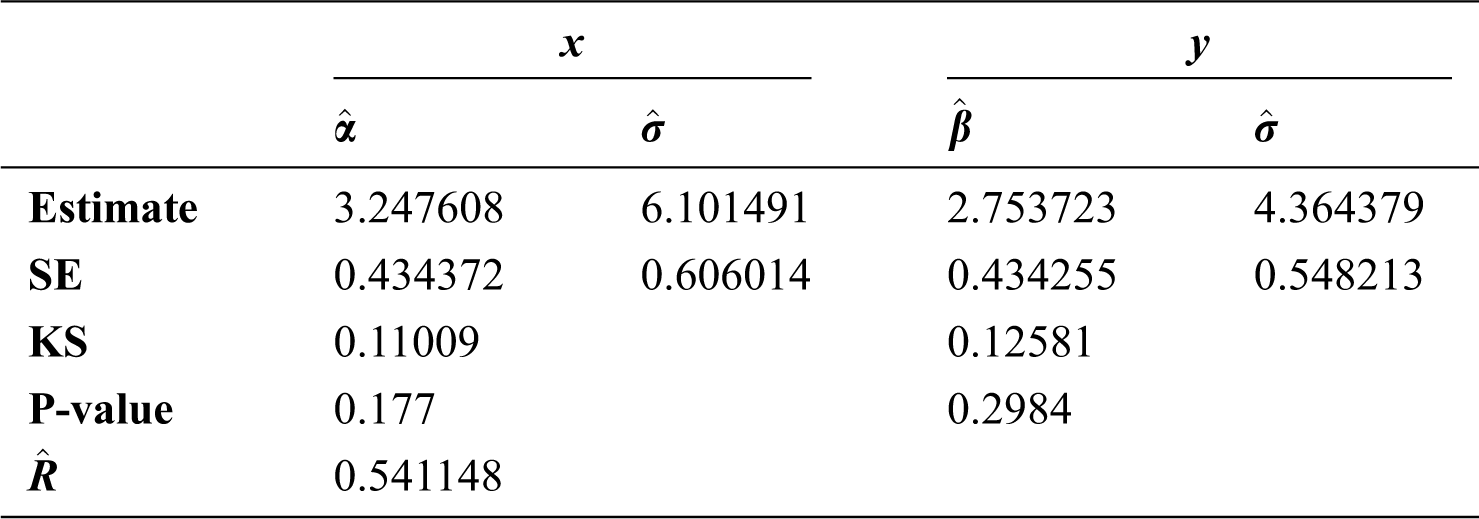
Table 8: MLE of EG distribution based on stress–strength model under different censoring schemes for banking data
For this data, MPS method can’t be used since there are equal observation in the data, so the spacing will be zero and hence the product will also be zero a. Despite the effectiveness of the MPS method, this problem hinders their use in the estimation process (for more information of this method see [16,18,20].
Data Set 2: The analysis of a pair of real data sets is presented for illustrative purposes. These data show the breaking strengths of jute fiber at two different gauge lengths. These two data sets were used by [32] where  is the breaking strength of jute fibre with 10 mm, and
  is the breaking strength of jute fibre with 20 mm. These data sets have been discussed by Reference [33] for estimating the stress–strength reliability under progressive Type-II censoring scheme in case of the exponential distribution.
Breaking strength of jute fibre of gauge length 10 mm are 693.73, 704.66, 323.83, 778.17, 123.06, 637.66, 383.43, 151.48, 108.94, 50.16, 671.49, 183.16, 257.44, 727.23, 291.27, 101.15, 376.42, 163.40, 141.38, 700.74, 262.90, 353.24, 422.11, 43.93,590.48, 212.13, 303.90, 506.60, 530.55, 177.25.
Breaking strength of jute fibre of gauge length 20 mm are 71.46, 419.02, 284.64, 585.57, 456.60, 113.85, 187.85, 688.16, 662.66, 45.58, 578.62, 756.70, 594.29, 166.49, 99.72, 707.36, 765.14, 187.13, 145.96, 350.70, 547.44, 116.99, 375.81, 581.60, 119.86, 48.01, 200.16, 36.75, 244.53, 83.55.
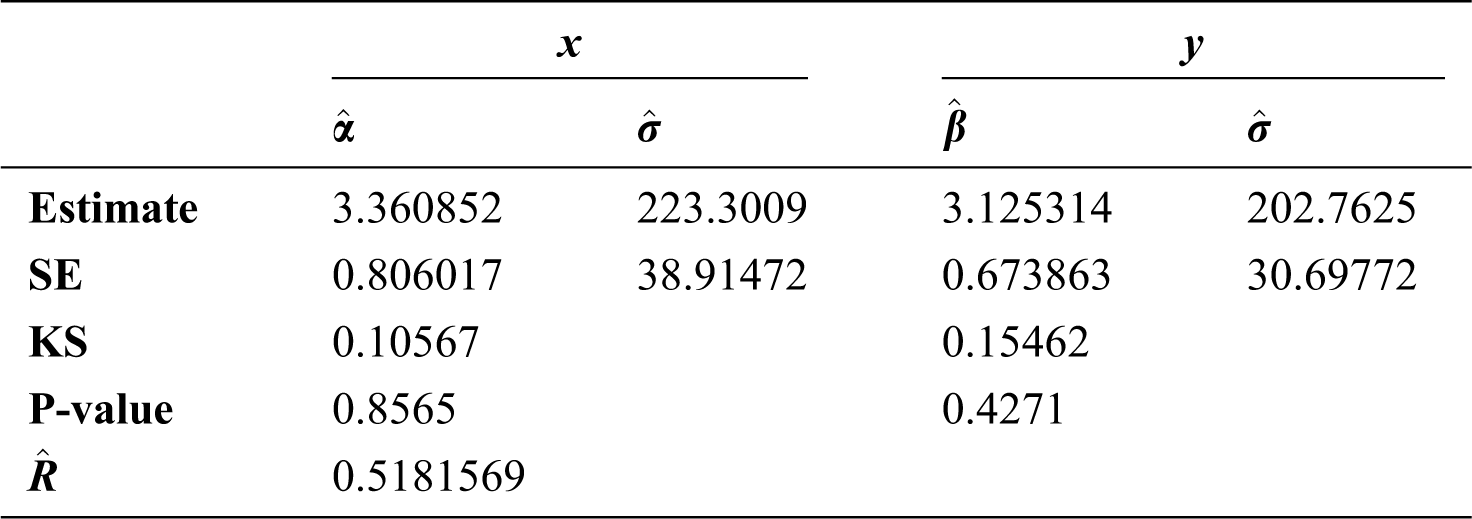
The fitted pdf, cdf and p-p plot of the EG distribution for the breaking strengths of jute fiber are presented in Fig. 2, while the results of MLE estimates of two variables along with the value of standard error, Kolmogorov-Smirnov and the p-value are given in Tabs. 9, 10 provide the MLE and MPS estimates of R for the breaking strength of jute fibre.
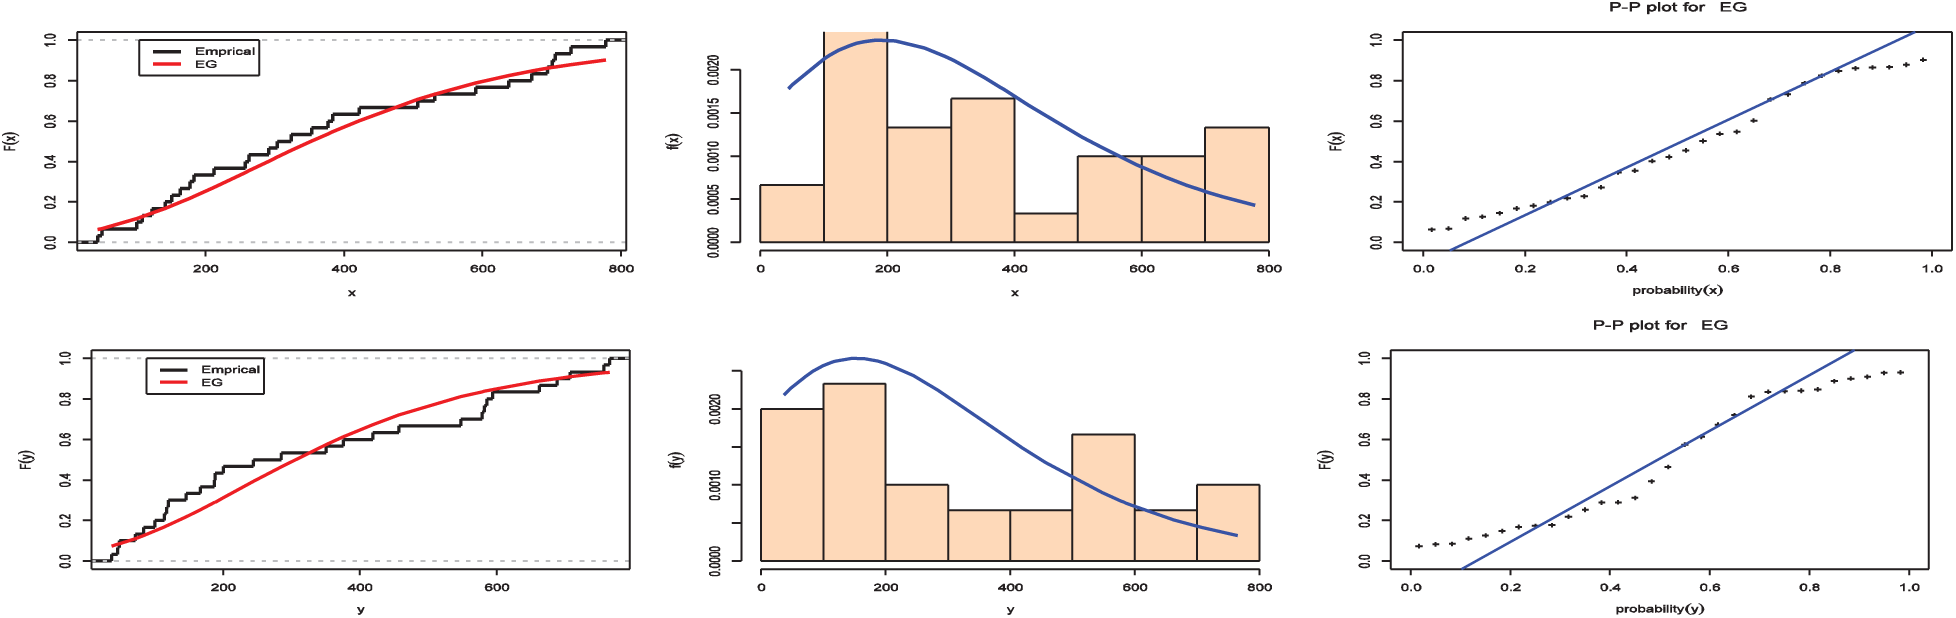
Figure 2: Plots of the fitted pdf, cdf and p-p plot of the EG distribution for fibre data
Table 9: Estimate, stander error, Kolmogorov–Smirnov test and reliability for EG distribution for fibre data
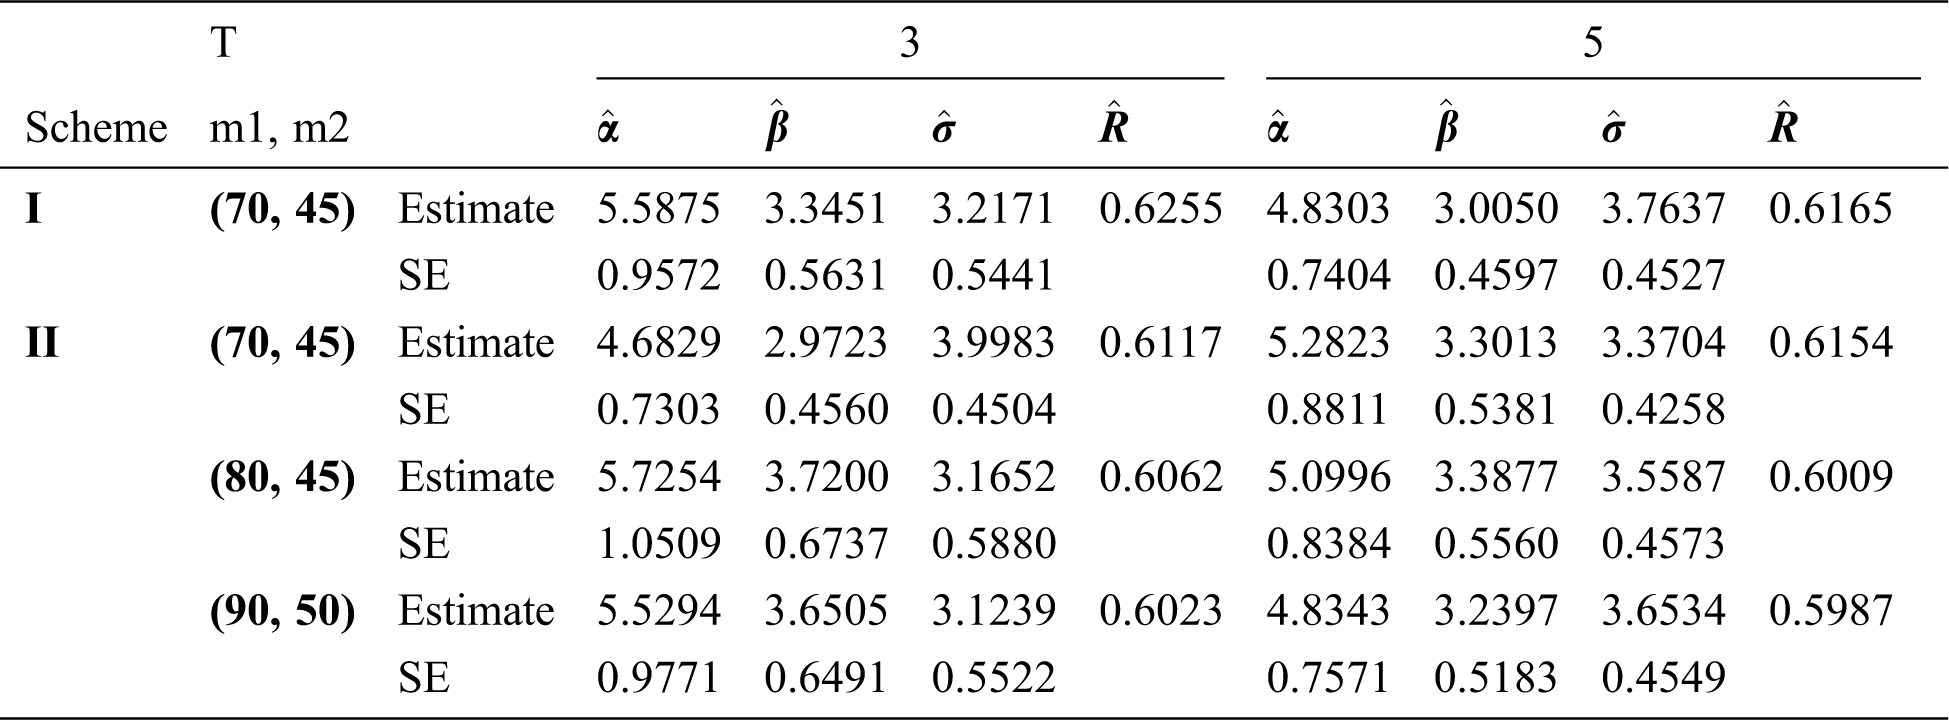
From these two applications we observe that the standard error (SE) of most estimators in decreases as the sample’s sizes increase and that MPS estimators are mostly have lower SE than MLE estimators. Moreover, the progressive Type-II censoring Scheme I provide estimators with lower SE that those estimators under Scheme II. To more applications of progressive Type-II censoring scheme see [34].
Table 10: MLE and MPS of EG distribution based on stress–strength model under different censoring schemes for fibre data
In this paper, the MPS method was introduced as an alternative estimation method for the estimation of stress–strength model of EG distribution under progressive Type-II hybrid censoring scheme. Two different schemes of progressive Type-II hybrid censoring were proposed and used to estimate the reliability parameter using MPS and MLE methods. Because the MLE and MPS cannot be obtained in a closed form for EG distribution to estimate parameters, iterative procedures as conjugate-gradient are done by using R program. The MPS method can be used as an alternative method for the MLE method. In the case of EG distribution based on the stress–strength model under the progressive Type-II hybrid censoring scheme, the estimators based on the MPS method are better than the estimators based on the MLE. We can conclude that the MPS method is a good alternative method to the usual MLE method when progressive hybrid censoring schemes are used.
Funding Statement: The author(s) received no specific funding for this study.
Conflicts of Interest: The authors declare that they have no conflicts of interest to report regarding the present study.
1. C. Dagum. (1980). “Inequality measures between income distributions with applications,” Econometrica, vol. 48, no. 7, pp. 1791–1803. [Google Scholar]
2. G. Adimari and M. Chiogna. (2006). “Partially parametric interval estimation of pr{Y > X},” Computational Statistics & Data Analysis, vol. 51, no. 3, pp. 1875–1891. [Google Scholar]
3. S. Kotz, Y. Lumelskii and M. Pensky. (2003). “The stress–strength model and its generalizations: Theory and applications,” World Scientific. New York. [Google Scholar]
4. A. I. Al-Omari, I. M. Almanjahie, A. S. Hassan and H. F. Nagy. (2020). “Estimation of the stress strength reliability for exponentiated Pareto distribution using median and ranked set sampling methods,” Computers Materials & Continua, vol. 64, no. 2, pp. 835–857. [Google Scholar]
5. S. Sengupta and S. Mukhuti. (2008). “Unbiased estimation of P (X > Y) for exponential populations using order statistics with application in ranked set sampling,” Communications in Statistics—Theory and Methods, vol. 37, no. 6, pp. 898–916. [Google Scholar]
6. H. A. Muttlak, W. A. Abu-Dayyeh, M. F. Saleh and E. Al-Sawi. (2010). “Estimating P (Y < X) using ranked set sampling in case of the exponential distribution,” Communications in Statistics—Theory and Methods, vol. 39, no. 10, pp. 1855–1868. [Google Scholar]
7. A. S. Hassan, M. S. Assar and M. Yahya. (2015). “Estimation of P[Y < X] for Burr type XII distribution under several modifications for ranked set sampling,” Australian Journal of Basic and Applied Sciences, vol. 9, no. 1, pp. 124–140. [Google Scholar]
8. F. G. Akgüla, S. Acıtaş and B. Şenoğluc. (2018). “Inferences on stress–strength reliability based on ranked set sampling data in case of Lindley distribution,” Journal of Statistical Computation and Simulation, vol. 88, no. 15, pp. 3018–3032. [Google Scholar]
9. B. Saraçoğlu, I. Kinaci and D. Kundu. (2012). “On estimation of R = P (Y < X) for exponential distribution under progressive type-II censoring,” Journal of Statistical Computation and Simulation, vol. 82, no. 5, pp. 729–744. [Google Scholar]
10. R. Valiollahi and M. Z. Raqab. (2011). “Stress–strength reliability of Weibull distribution based on progressively censored samples,” Statistics and Operations Research Transactions, vol. 35, no. 2, pp. 103–124. [Google Scholar]
11. A. S. Yadav, S. K. Singh and U. Singh. (2018). “Estimation of stress–strength reliability for inverse Weibull distribution under progressive type-II censoring scheme,” Journal of Industrial and Production Engineering, vol. 35, no. 1, pp. 48–55. [Google Scholar]
12. S. Shoaee and E. Khorram. (2015). “Stress–strength reliability of a two-parameter Bathtub-shaped lifetime distribution based on progressively censored samples,” Communications in Statistics–Theory and Methods, vol. 44, no. 24, pp. 5306–5328. [Google Scholar]
13. D. Kundu, A. Joarder and H. Krishna. (2009). “On type-II progressively hybrid censoring,” Journal of Modern Applied Statistical Methods, vol. 8, no. 2, pp. 534–546. [Google Scholar]
14. C. T. Lin, K. T. H. Ng and P. S. Chan. (2009). “Statistical inference of type-II progressively hybrid censored data with Weibull lifetimes,” Communications in Statistics—Theory and Methods, vol. 38, no. 10, pp. 1710–1729. [Google Scholar]
15. F. V. Gamchi, O. G. Alma and R. A. Belaghi. (2019). “Classical and Bayesian inference for Burr type-III distribution based on progressive type-II hybrid censored data,” Mathematical Sciences, vol. 13, no. 2, pp. 79–95. [Google Scholar]
16. E. M. Almetwally, H. M. Almongy and E. A. Elsherbieny. (2019). “Adaptive type-II progressive censoring schemes based on maximum product spacing with application of generalized Rayleigh distribution,” Journal of Data Science, vol. 17, no. 4, pp. 802–831. [Google Scholar]
17. M. M. El-Din, M. Nagy and M. H. Abu-Moussa. (2019). “Estimation and prediction for Gompertz distribution under the generalized progressive hybrid censored data,” Annals of Data Science, vol. 6, no. 4, pp. 673–705. [Google Scholar]
18. E. M. Almetwally, H. M. Almongy, M. K. Rastogi and M. Ibrahim. (2020). “Maximum product spacing estimation of Weibull distribution under adaptive type-II progressive censoring schemes,” Annals of Data Science, vol. 7, no. 2, pp. 257–279. [Google Scholar]
19. T. Goyal, P. K. Rai and S. K. Maurya. (2020). “Bayesian estimation for GDUS exponential distribution under type-I progressive hybrid censoring,” Annals of Data Science, vol. 7, no. 2, pp. 307–345. [Google Scholar]
20. E. A. El-Sherpieny, E. M. Almetwally and H. Z. Muhammed. (2020). “Progressive type-II hybrid censored schemes based on maximum product spacing with application to power Lomax distribution,” Physica A: Statistical Mechanics and its Applications, vol. 553, no. 1, pp. 124251. [Google Scholar]
21. A. Asgharzadeh, R. Valiollahi and M. Z. Raqab. (2011). “Stress–strength reliability of Weibull distribution based on progressively censored samples,” SORT, vol. 35, no. 2, pp. 103–124. [Google Scholar]
22. R. E. Ibrahim and H. E. Semary. (2020). “Statistical inference for a simple step–stress model with type-II hybrid censored data from the Kumaraswamy Weibull distribution,” Journal of Data Science, vol. 18, no. 1, pp. 132–147. [Google Scholar]
23. A. A. Ismail. (2019). “Statistical analysis of type-I progressively hybrid censored data under constant-stress life testing model,” Physica A: Statistical Mechanics and Its Applications, vol. 520, no. 1, pp. 138–150. [Google Scholar]
24. A. S. Yadav, S. K. Singh and U. Singh. (2019). “Bayesian estimation of stress–strength reliability for Lomax distribution under type-II hybrid censored data using asymmetric loss function,” Life Cycle Reliability and Safety Engineering, vol. 8, no. 3, pp. 257–267. [Google Scholar]
25. S. Nadarajah. (2006). “The exponentiated Gumbel distribution with climate application,” Environmetrics, vol. 17, no. 1, pp. 13–23. [Google Scholar]
26. R. C. H. Cheng and N. A. K. Amin. (1983). “Estimating parameters in continuous univariate distributions with a shifted origin,” Journal of the Royal Statistical Society: Series B (Methodological), vol. 45, no. 3, pp. 394–403. [Google Scholar]
27. H. K. T. Ng, L. Luo, Y. Hu and F. Duan. (2012). “Parameter estimation of three-parameter Weibull distribution based on progressively type-II censored samples,” Journal of Statistical Computation and Simulation, vol. 82, no. 11, pp. 1661–1678.
28. D. Kundu and A. Joarder. (2006). “Analysis of type-II progressively hybrid censored data,” Computational Statistics & Data Analysis, vol. 50, no. 10, pp. 2509–2528.
29. R. Alshenawy. (2020). “A new one parameter distribution: Properties and estimation with applications to complete and type-II censored data,” Journal of Taibah University for Science, vol. 14, no. 1, pp. 11–18. [Google Scholar]
30. A. Kohansal and S. Nadarajah. (2019). “Stress–strength parameter estimation based on type-II hybrid progressive censored samples for a Kumaraswamy distribution,” IEEE Transactions on Reliability, vol. 68, no. 4, pp. 1296–1310. [Google Scholar]
31. S. K. Singh, U. Singh and V. K. Sharma. (2014). “Estimation on system reliability in generalized Lindley stress–strength model,” Journal of Statistics Applications & Probability, vol. 3, no. 1, pp. 61. [Google Scholar]
32. Z. P. Xia, J. Y. Yu, L. D. Cheng, L. F. Liu and W. M. Wang. (2009). “Study on the breaking strength of jute fibres using modified Weibull distribution, composites part A,” Applied Science and Manufacturing, vol. 40, no. 1, pp. 54–59. [Google Scholar]
33. B. Saraçoğlu, I. kinaki and D. Kundu. (2012). “On estimation of R = P (Y < X) for exponential distribution under progressive type-II censoring,” Journal of Statistical Computation and Simulation, vol. 82, no. 5, pp. 729–744. [Google Scholar]
34. R. Alshenawy, A. Al-Alwan, E. M. Almetwally, A. Z. Afify and H. M. Almongy. (2020). “Progressive type-II censoring schemes of extended odd Weibull exponential distribution with applications in medicine and engineering,” Mathematics, vol. 8, no. 10, pp. 1679. [Google Scholar]
 | This work is licensed under a Creative Commons Attribution 4.0 International License, which permits unrestricted use, distribution, and reproduction in any medium, provided the original work is properly cited. |