DOI:10.32604/cmc.2021.014113
| Computers, Materials & Continua DOI:10.32604/cmc.2021.014113 | |
| Article |
Predicting the Type of Crime: Intelligence Gathering and Crime Analysis
1Department of Information Technology, College of Computer, Qassim University, Buraydah, Saudi Arabia
2Department of Computer Science, University of Gujrat, Gujrat, Pakistan
3School of Computer Science, Guanzghou University, Guangzhou, 510006, China
4College of Computer Science and Information Technology, University of Anbar, Ramadi, Iraq
*Corresponding Author: Hafiz Tayyab Rauf. Email: hafiztayyabrauf093@gmail.com
Received: 31 August 2020; Accepted: 05 October 2020
Abstract: Crimes are expected to rise with an increase in population and the rising gap between society’s income levels. Crimes contribute to a significant portion of the socioeconomic loss to any society, not only through its indirect damage to the social fabric and peace but also the more direct negative impacts on the economy, social parameters, and reputation of a nation. Policing and other preventive resources are limited and have to be utilized. The conventional methods are being superseded by more modern approaches of machine learning algorithms capable of making predictions where the relationships between the features and the outcomes are complex. Making it possible for such algorithms to provide indicators of specific areas that may become criminal hot-spots. These predictions can be used by policymakers and police personals alike to make effective and informed strategies that can curtail criminal activities and contribute to the nation’s development. This paper aims to predict factors that most affected crimes in Saudi Arabia by developing a machine learning model to predict an acceptable output value. Our results show that FAMD as features selection methods showed more accuracy on machine learning classifiers than the PCA method. The naïve Bayes classifier performs better than other classifiers on both features selections methods with an accuracy of 97.53% for FAMD, and PCA equals to 97.10%.
Keywords: Prediction; machine learning; crime prevention; naïve bayes; crime prediction; classification algorithms
Criminal activities have been part of human civilization since its inception. The negative impact of the crime-levels on socioeconomic indicators cannot be understated. Although there is a significant correlation between socioeconomic indicators and the crime levels however the flow of causality in a relationship works in a cycle where the socioeconomic indicators add to the crime-level, such as unemployment, per capita GDP, etc., in-turn a criminal is less likely to seek and able to secure a job after being convicted of crime therefore further enhancing the unemployment levels which in turn will lead to more crimes [1]. On the purely economic front, the impacts are more observable as an example we can look at the fact that crime-levels are negatively correlated with the housing prices in communities, research also shows that a decrease in the crime-levels is inversely related to increasing house prices and increased overall economic development of the community affected [2]. It is therefore pivotal for any society to check the spread of crime. To reduce and prevent crimes, it is essential to identify the reasons behind crimes, predict crime-rates, predict hot-spots or places with a likelihood for heinous crimes and prescribe solutions to deal with the same. Crime Analysis, a sub-branch of criminology, studies the behavioral pattern of criminal activities and tries to identify such events’ indicators. The challenge in doing so is the collection and the analysis of such large volumes of data. For example, Syed et al. [3] in their studies state that the United States had 372,392 instances of crime from 2011–2015; the data to analyses become more prominent with the introduction of new features such as weather [4], census [5] which are required to be studied given the dependencies that crime-levels have on them.
The origin and growth of crime-levels are based on several characteristics; these characteristics can be different income groups, different racial backgrounds, age groups, family structure [6], levels of education [7], size of housings, number of employed to unemployed [8], police officers per capita for the region [9], etc.
The availability of crime statistics in the free domain has made it practically possible to use big data and machine learning (ML) techniques for predicting and preventing crime, by supporting the optimal allocation of limited police resources, as knowledge on the likelihood of crime occurrences for a particular area, predicted through a model will help allocate additional police personals to the known crime hot-spots for a particular time and therefore reducing the likelihood of crime occurrences. Although the availability of data in the public domain for analytics has served well of the research purposes, three main obstacles had remained in their practical applicability for the real-world problems.
The conventional approaches using multivariate analyses [7], etc., remained prevalent due to their ease of use, but the levels of accuracy and the sophistication required to map the data successfully to make it useful in the real world in real-time has remained elusive. The more advanced ML implementations have not been explored and implemented to their maximum possible extent, despite their capabilities in modeling datasets with a large number of variables. The studies that implement advanced ML algorithms overlook the importance of feature selection before implementing the same, even though it improves the accuracy in classification tasks to a significant degree [10].
Several research studies show that the criminal world organizes a complex network with its own rules. To make a prediction of crime rate with high accuracy, it is essential to understand the “nature” of a crime. The existing research on the subject illustrates that criminal activities are related to a significant number of factors (features). A number of them take into consideration a variety of individual parameters and show how changes influence crime rates or criminal activities in these parameters. It is observed that the criminal activities are not randomly organized in the cities, they are dependent on the number of factors that contribute towards the existence of a crime hot-spot in a given location, KNN (K-nearest neighbors) has been successfully implemented spatial analysis of cities to map the neighborhoods that are most likely to be troubled by the existence of criminal activities [11], the research does not although uses any sophisticated mechanism to determine the essential features that may contribute towards the increase in the accuracy of the model.
Studies have also illustrated that the crime-levels are significantly correlated to the ambient temperatures, as the increase in temperatures increases the levels of serotonin our bloodstream, which directly increases human to human interaction and increases impulsivity among the populations causing the crime-levels to go up in general [12]. A significant correlation is also unsurprisingly been found with unemployment [8], the study also takes into consideration the seasonality associated with the business cycles, by studying the crime-employment elasticity which explains the findings of some studies that find no or a negative relationship between crime and unemployment, the authors show evidence for the impacts to be significant if the cyclical nature of unemployment is to be taken into consideration and how previous studies that have concluded otherwise have failed to do so.
More recent studies that use more sophisticated machine learning algorithms to map the dataset are free from some of the previous studies’ limitations and biases. A comparison in the capabilities of conventional to the modern algorithm suggests that the Machine learning algorithms can map any given dataset that is diverse, better than its conventional peers [13]; the study compares between the accuracies obtained from a linear regression model, logistic regression model and gradient boosting, unsurprisingly the simple logistic regression model performs the worst out of the given set of models due to its inability to map any non-linear dependencies. However, a possible drawback of the approach can be that the criteria to determine the accuracy can cause the gloomy value predictions from the linear regression model to interfere with the mean absolute loss giving a sense of the model performing better when it is making predictions that carry no practical meaning. Other studies attempt to use a yet wider variety of features to predict the spatial distribution of crime, for example, census data, street lights [5], GDP per capita [14], alcohol consumption [8].
The more recent advancements in the availability of data and the enhancements in the capabilities of the machines to process such massive datasets has given rise to the possibilities of using a new range of features, for example, the usage of CNN (Convolutional neural networks) for processing images and training the models on the same by using not only the census but also the google street view data [4], that seeks to implement the aspect of “broken windows theory” [15]. All the features are concatenated and fed to a deep neural network, which makes the final predictions.
With the onset of these computing capabilities, the models take in a significantly large number of features to make predictions, which in turn helps make the model more receptive and more useful for real-world implementation. However, this introduces two new and different challenges to deal with when implementing models with such a large number of features:
The increase in the number of features causes models to take significantly more computational capabilities than the conventional models, which means more resources and time should be dedicated to the training process. The introduction of variables or features that do not significantly impact the predictions makes models somewhat less efficient than they otherwise would have been in the absence of such redundant features.
To address these problems, it is pivotal to be selective in the selection of features. Most of the studies do not attempt the features selection through any means whatsoever; the ones that do mostly prefer to use conventional techniques like correlation, etc., [13]. To achieve the desired features for a model as these techniques are easy to interpret and implement. However, this approach has its limitations, and there is a need to implement new state of the art techniques to extract and select essential features for any successful implementation of a machine learning algorithm [16] for predicting crime. Hence, our paper aims to study the effects and efficiency of the two techniques that are gaining the most traction, for machine learning-based classification tasks which are:
1) Principal Component Analysis (PCA) [17]
2) Factor Analysis of mixed data (FAMD) [18]
The remaining article is organized as section two express material and methods where results are presented in Section 3. The brief statistical analysis is carried out in Section 4 and the study is concluded in Section 5.
In this research, we consider all types of crimes in Saudi Arabia. We collected events information on all crimes over almost one year, i.e., 2018 using GDELT [19]. It has information about 75,620 crimes that happened in Saudi Arabia with 17 candidate attributes. Then we prepared the dataset in Comma Separated Value (CSV) format. Each crime report includes events that happened in Saudi Arabia with coordinates, time, month, location, and the actor’s nationality.
Several methods are used in the related work for data preprocessing [20,21]. In the first step, the data is refined. Certain features could not be treated promptly since they had a high percentage of missing values or was in the form of categories. Fig. 1 shows the process needs to analyze and predict the crimes. While the crime data is potentially very important features, but they were unreliable as they consist of many missing values and may result in a biased outcome. Skewed data also is a problem that widely appears in criminal data. For data points Y1, Y2, …, YN, the formula used for skewness is:
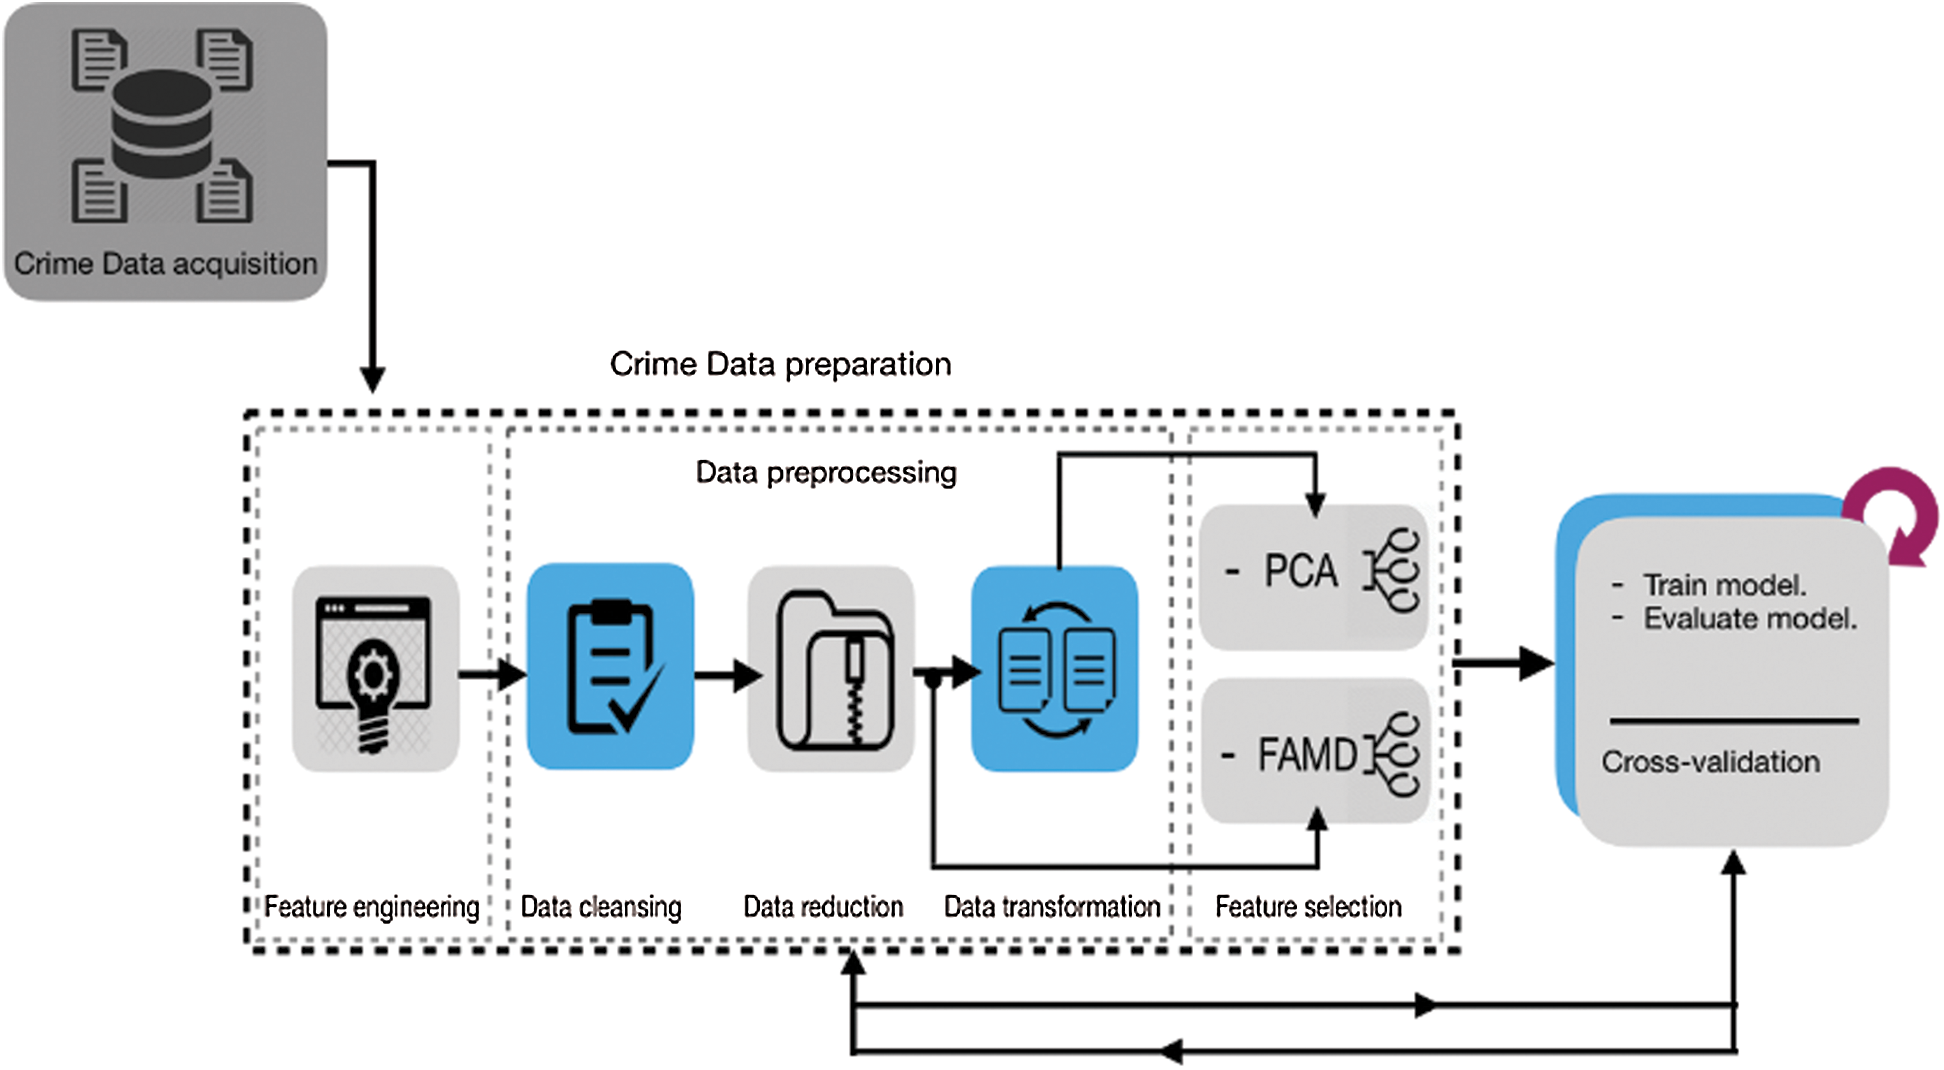
Figure 1: Methodology framework
where  is the mean, N is number of data points, and s is the standard deviation.
The values for skewness between –2 and +2 are considered acceptable for achieving normal univariate distribution. Out of the numeric features, four features were positively skewed—most of the research deal with this by using log-transformation. The goal of log transformation is to make data conform more closely to the normal distribution by decreasing data variability. A Log plus one, which is a variation of log transformation, was performed on the four features to account for zero values in those columns. The skewness significantly reduced after was applied.
Then, the data has to encode the feature where nominal features are encoded into numerical form. For all numeric columns such as ‘Actor1code’, ‘Actor1Geo_CountryCode’, ‘ActionGeo_FeatureID’, the data was standardized to conform to a Gaussian distribution with μ = 0 and σ = 1. Rescaling was performed using a z-score. Formally, the z-score formula is given as
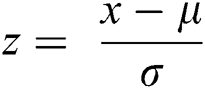
where  is the mean, and
  is the standard deviation.
PCA and FAMD are two-dimensionality reduction algorithms to extract the patterns of characteristics in the data. Figs. 2 and 3 compare and visualize the correlation of features between the two techniques. The predicted average value is applied to the graph in both figures using a red dash line. Characteristics above the red dash line illustrate the most correlated features that we pick out of the given pool to build the model. The primary difference between these two is that PCA acts as quantitative variables where FAMD can be shown as a mixed between quantitative and qualitative variables.
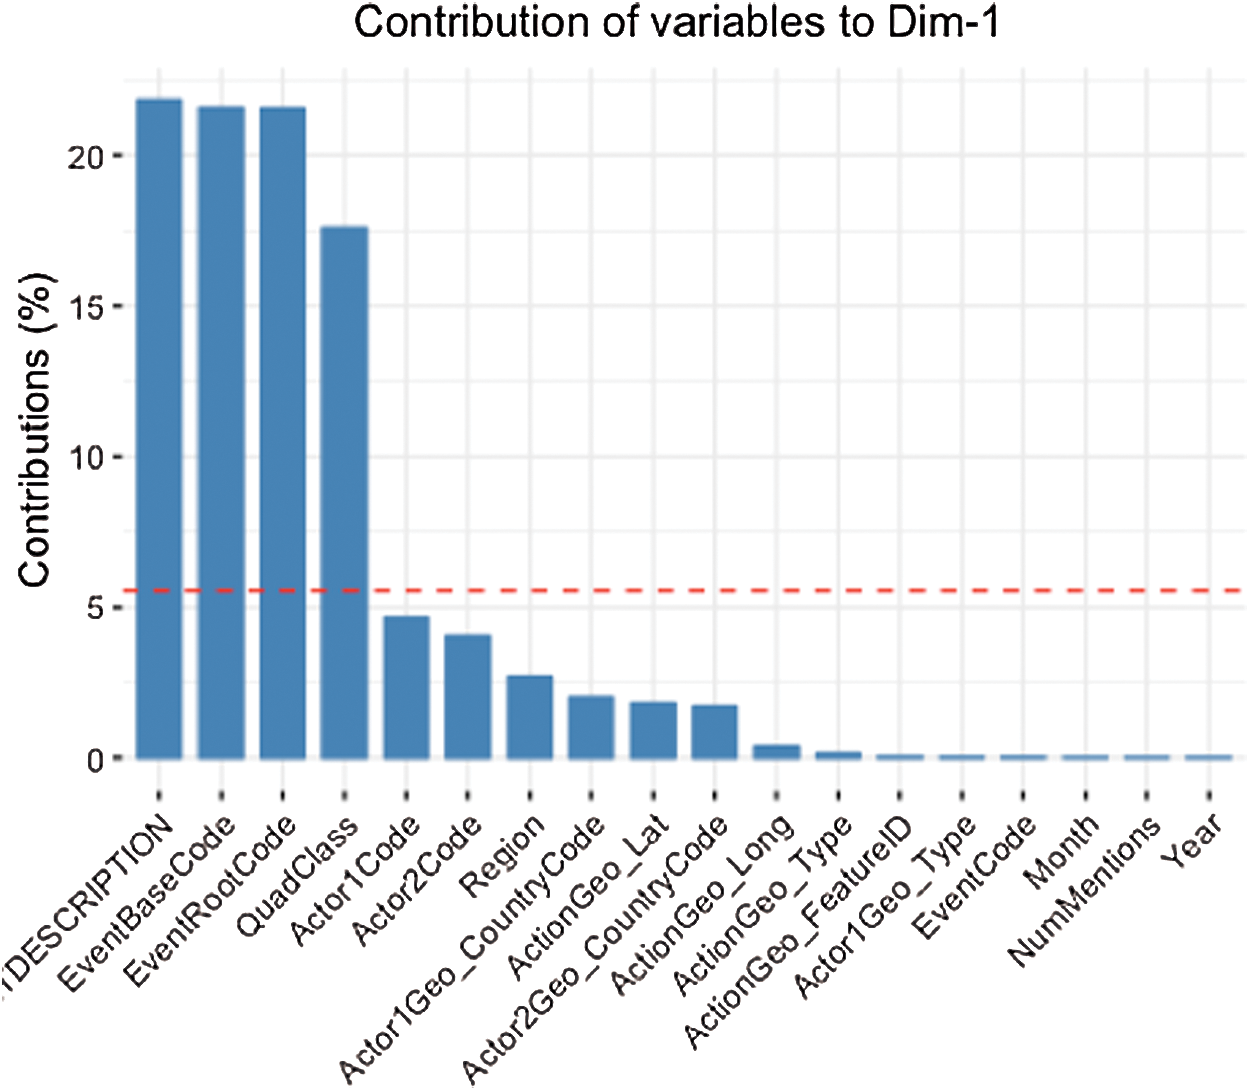
Figure 2: Features selection by PCA DIM
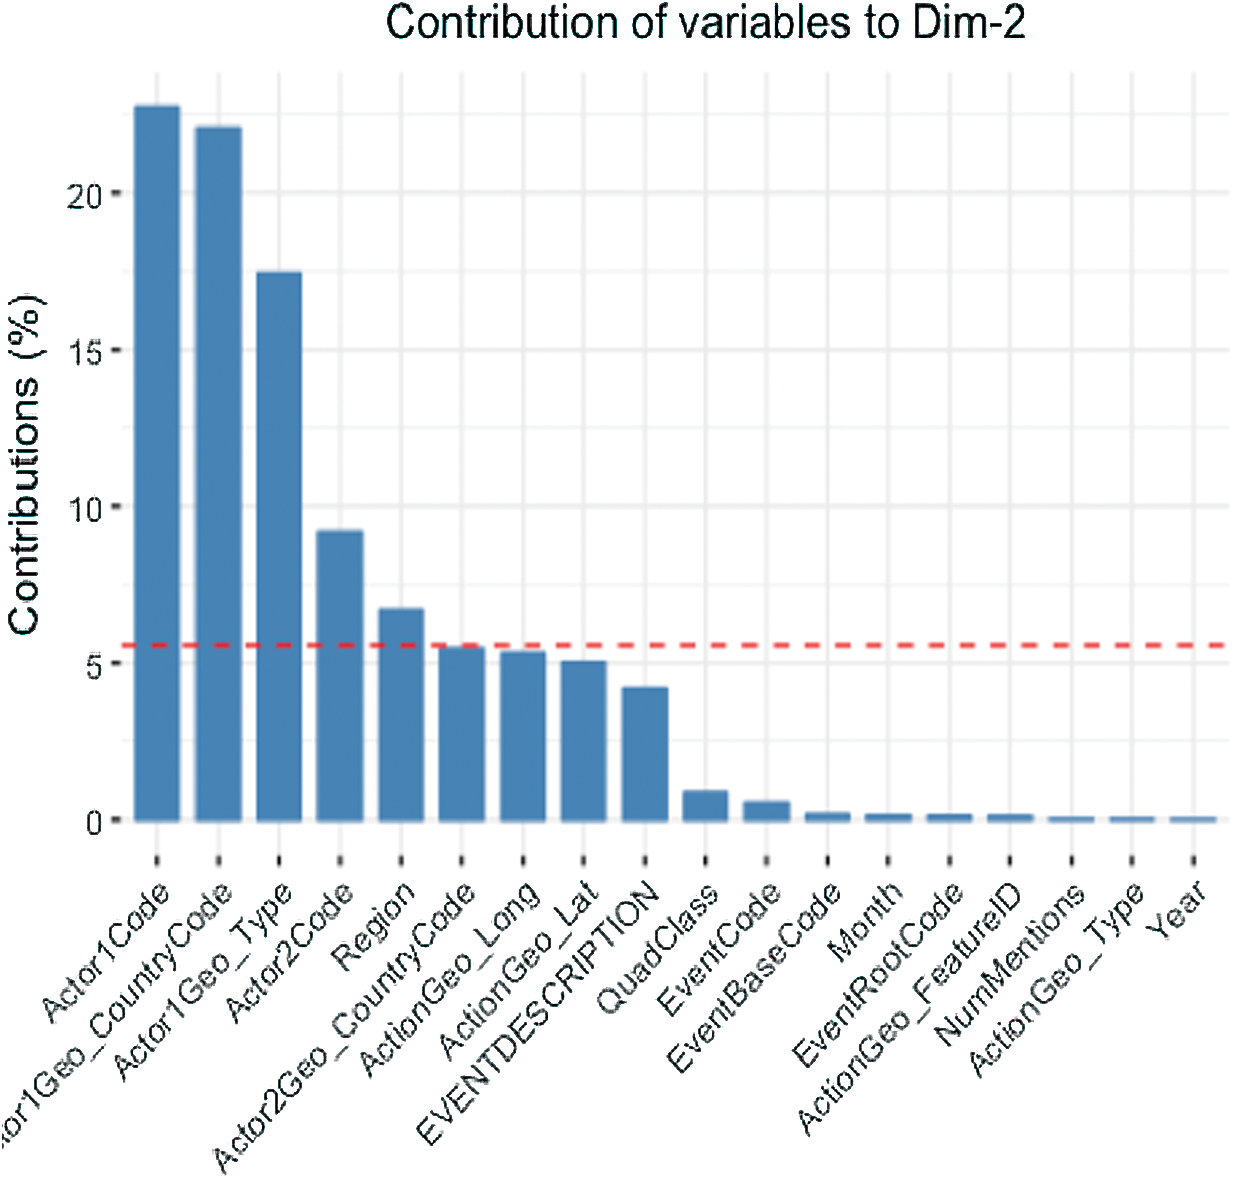
Figure 3: Features selection by FAMD DIM
3.1 Experimental Evaluation: Events Prediction
PCA and FAMD are two techniques to analyze and understand the attributes to reduce the dimensionality of a dataset without information loss. Thus, we adopted these two techniques to find the label’s most related attributes (EventCode). Tab. 1 provides all attributes resulted by implementing the PCA and FAMD.
Table 1: Candidate attributes with PCA and FAMD techniques

Specific classification techniques have been selected, as shown in Tab. 2 that is based upon their outstanding contributions to the machine learning community [8–10]. Tab. 2 consists of the selected classification techniques with their accuracy. Naïve Bayes obtained a high classification result in both dimensionality techniques (PCA and FAMD) which are 97.10% and 97.53% respectively compared among the techniques considered in Tab. 2.
Table 2: Performance metrics for readmission prediction

We analyze the performance of the two-dimensionality techniques with the best practice machine learning algorithms [22–24] who’s used the same dataset. Tab. 2 represents the performance of each algorithm type and comparison between attributes which is selected by PCA or FAMD. We found the accuracy was higher with FAMD for all classifier types. The reason for the FAMD has higher accuracy since it is used to explain the covariance between variables while the PCA explain the variance between variables. Because our experiment centers on calculating the correlation between variables and which variable is more related to the target label, we use FAMD instead of the variance, which is used to spread of the dataset by using one dimension. Also, the experiments show significant improvements in deep learning algorithms moving from PCA to FAMD.
From the results of our experiments, it is cleared that the Naive Bayes achieves a result of accuracy 97 for both techniques, which is higher than others. The reason is that Naive Bayes is insensitive or not depends on the dependence between features. Moreover, it excludes the attributes with missing values. On the other hand, the KNN classifier has a lower than Naive Bayes accuracy with PCA 90.35% while in FAMD is 95.03%. This shows how the KNN is sensitive to irrelevant variables and data size.
Furthermore, Naïve Bayes, Random forest, and KNN using the FAMD technique generally perform comparably in practice to determine criminal activities with some advantages to Naïve Bayes. Furthermore, Decision trees present a low correlation coefficient compare with other algorithms as branches of the decision trees are more rigid. It provides precise outcomes in case of test-dataset follows the pattern modeled.
However, data visualization helps in the analysis of the data set so that section 4 analyzes crime rate per the region over time, which includes occupying territory, fight, expel or deport, conventional and unconventional violence, etc. We also implemented the total event count, weekly event count, by considering population, male population, smokers, education, and unemployment as a prominent leading factor.
4 Crime Scenario: Statistical Analysis
This section provides a general picture of crime trends in Saudi Arabia. It introduces statistics on crime and studies its variation with other statistics to discover possible relationships. Hence, we try to identify the areas more prone to crime and predict the reasons for their high rate in criminal activities. Therefore, creating crime scenarios may help prevent crimes and discover relationships and trends, show up which areas are safe or dangerous in Saudi Arabia, and predict an acceptable output value.
Former Attorney General of New Jersey, Anne Milgram, has clarified in her TED Talk why smart statistics are the key to fighting crime with the help of integrated data for analyzing the criminal justice system. In her TED Talk, Anne Milgram remarks some incredible insights that there was a shortage in data-driven decision-making to use big data analytics and data science instead of yellow post-it notes to prevent crimes. She said: “use of smart data and statistics in making player decisions was good enough for the Oakland A’s, Milgram figured it would be good enough for the legal system.” She created a team of data scientists to fight crimes using a data-based manner with better decision-making. She succeeds in using smart data to reduce murders by 41% and reduced crimes in New Jersey by 26%.
Three regions in Saudi Arabia were identified as the most crime-prone regions, namely; Riyadh (15,037), Makkah (4132), and Jizan (2798). Also, the month of August 2018 has the highest crime rate in the highest crime-prone area, with the capital Riyadh recording 2,300 cases of crime.
In Riyadh, crime was committed three times every 6 hours, representing the highest rate in Saudi Arabia. Another mooted reason why the crime rate might have been higher in Riyadh could be because it is the capital though this assumption was not substantiated. August’s likely reason is the month with the highest crime rate assumes that the Dhul hajj, where Muslims come from all over the world for pilgrimage, starts on August 12. Moreover, the second month (February 2018) was the lowest month to committed crimes and, the sixth month had a lower crime rate than the previous months in all regions.
4.1 Statistical Analysis by Region
Fig. 4 reveals that the whole event of a crime in Riyadh throughout the review is more than every other region put together. This is alarming at 15,037, while the second-highest Makkah is at a distant count of 4,132. One would have expected that Riyadh, as the capital city, would enjoy more security than other regions, but the reverse seems to be true. We realize from this study that the Makkah region, which has the holy mosque, has the second-highest crime rate, which is also in contrast to what we would have thought. More than 61% of the regions had a crime rate of less than 1000 throughout the review period, with most events concentrated in the five major regions, namely Riyadh, Makkah, Jizan, Ash sharqiyah, and Asir.
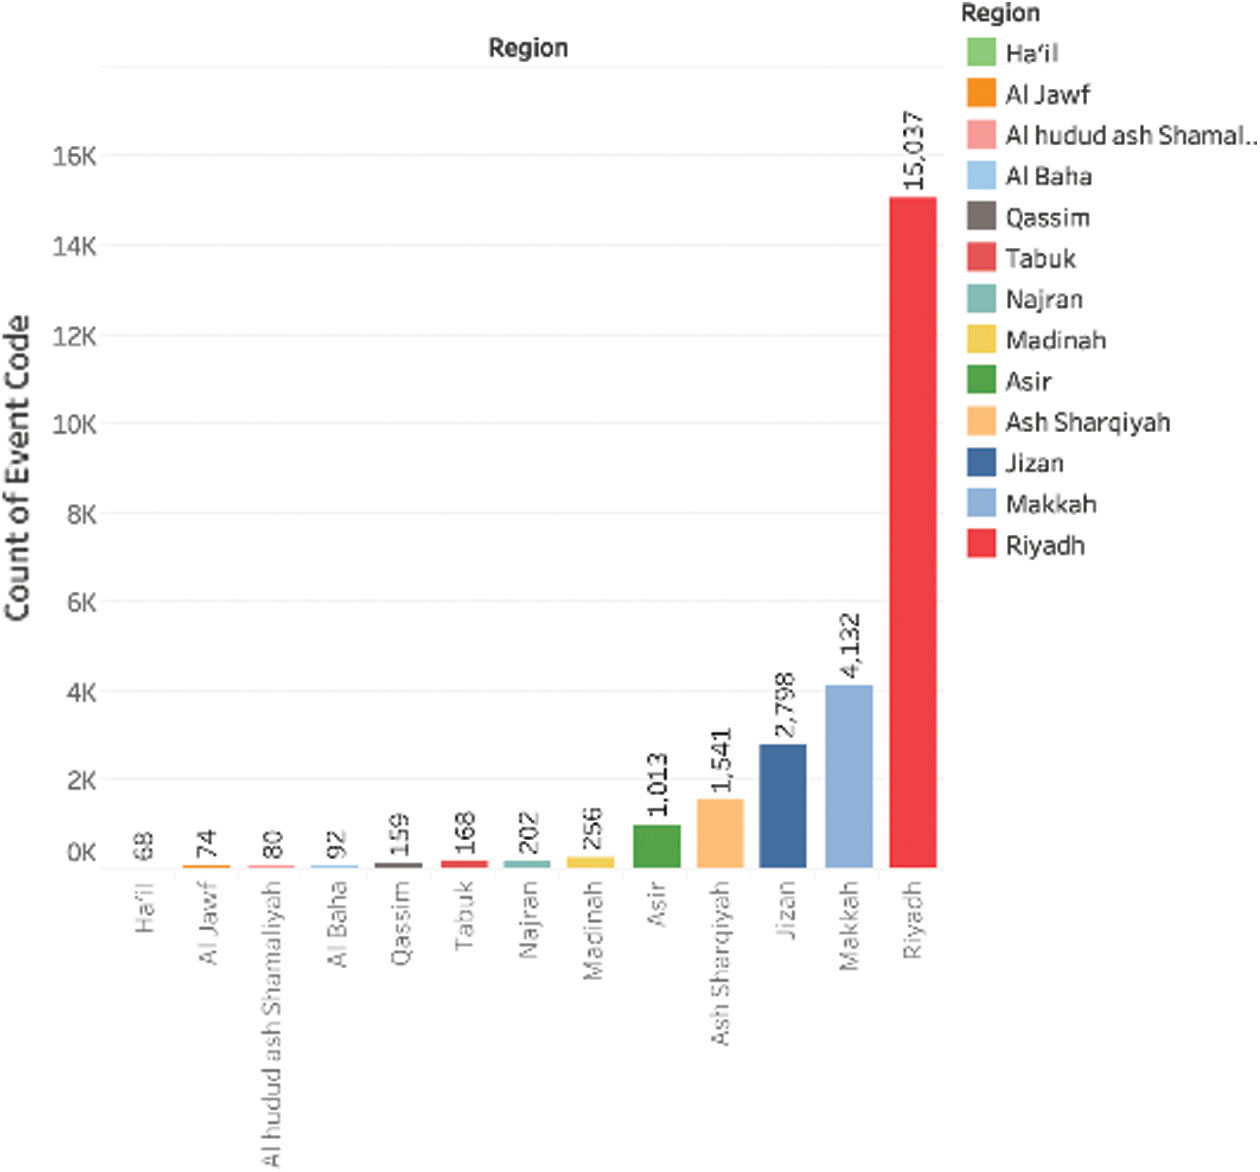
Figure 4: Total crime in each region
The oil-rich region of Ash sharqiyah was the fourth region with the highest crime count while we expect it to usurp Jizan due to it being a boundary region. However, it maintained its fourth position. Tabuk is one of the Military regions and an outsider boundary. The more of military presence, the less crime occurrence which is the reason for lower crime rates.
4.2 Statistical Analysis by Time
In Fig. 5, the events are sequenced from 1st January 2018 to 23rd September 2018. The plot manifests events occurring in each region for the mentioned period. The crime rate in the Riyadh region was the highest throughout the period compared to other regions. We can notice a significant dip in the number of crimes in February 2018 in Riyadh when crime dropped to count of about 1000, the lowest recorded for Riyadh in the period. It was a decrease of almost 44%. We can see two jumps in the graph in Riyadh’s number, occurring in March 2018 (an increase of 120%) and August 2018 (an increase of 92%). The month of August 2018 also saw the highest recorded crime in Riyadh within the period, 2300. Makkah had the second-highest crime for all the months except April 2018. Crime count in Makkah ranged between almost 300 in February 2018 to almost 800 in August 2018.
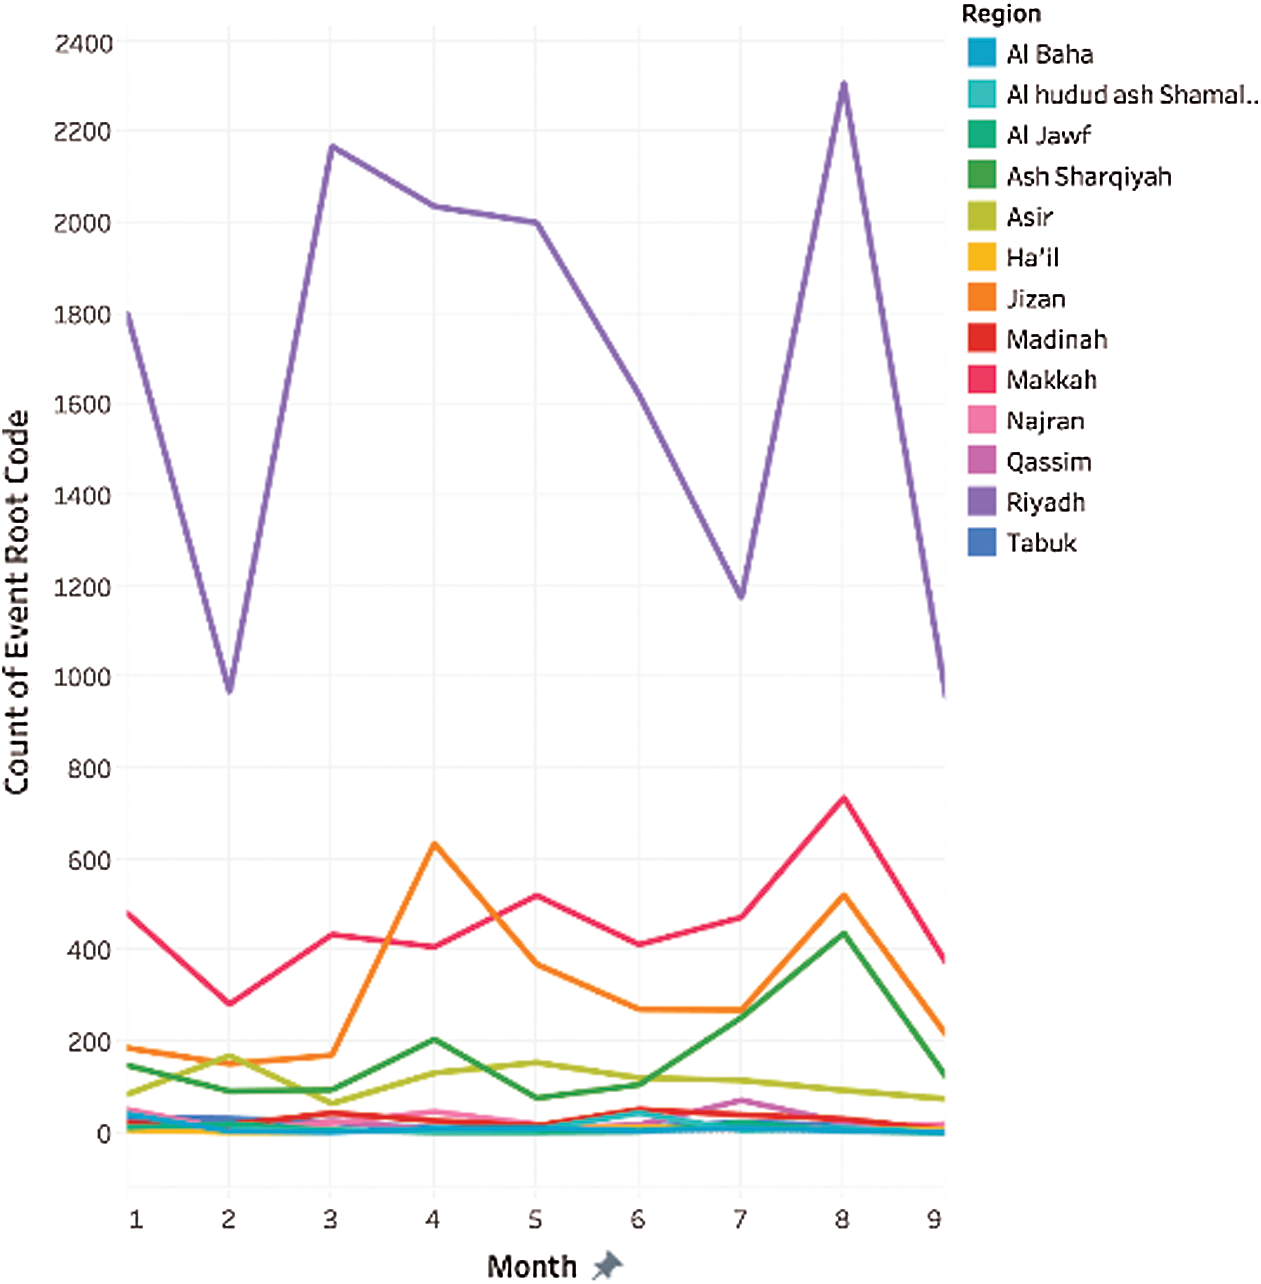
Figure 5: Crime rate per region over time
Jizan had the third-highest crime rate for almost all the months ranging from almost 150 in February 2018 to 700 in April 2018. It climbed to the region’s position with the second-highest crime rate in April 2018, overtaking Makkah. We can see that February 2018 has the lowest crime rate in Riyadh, Makkah, Jizan, and Ash Sharqiyah. The highest number of crimes in Riyadh, Makkah, and Ash Sharqiyah occurred in August 2018; April 2018 recorded the highest number of crimes in Jizan.
4.3 Classification by Event Code
Fig. 6 confers the distribution of different crime types recorded in the top three regions of the crime rate. The most frequent crime in Riyadh is described by “Use the conventional military force.” That is followed by “Arrest, detain, or charge with legal action,” “Fight with artillery or tanks,” and “Employ aerial weapons.”
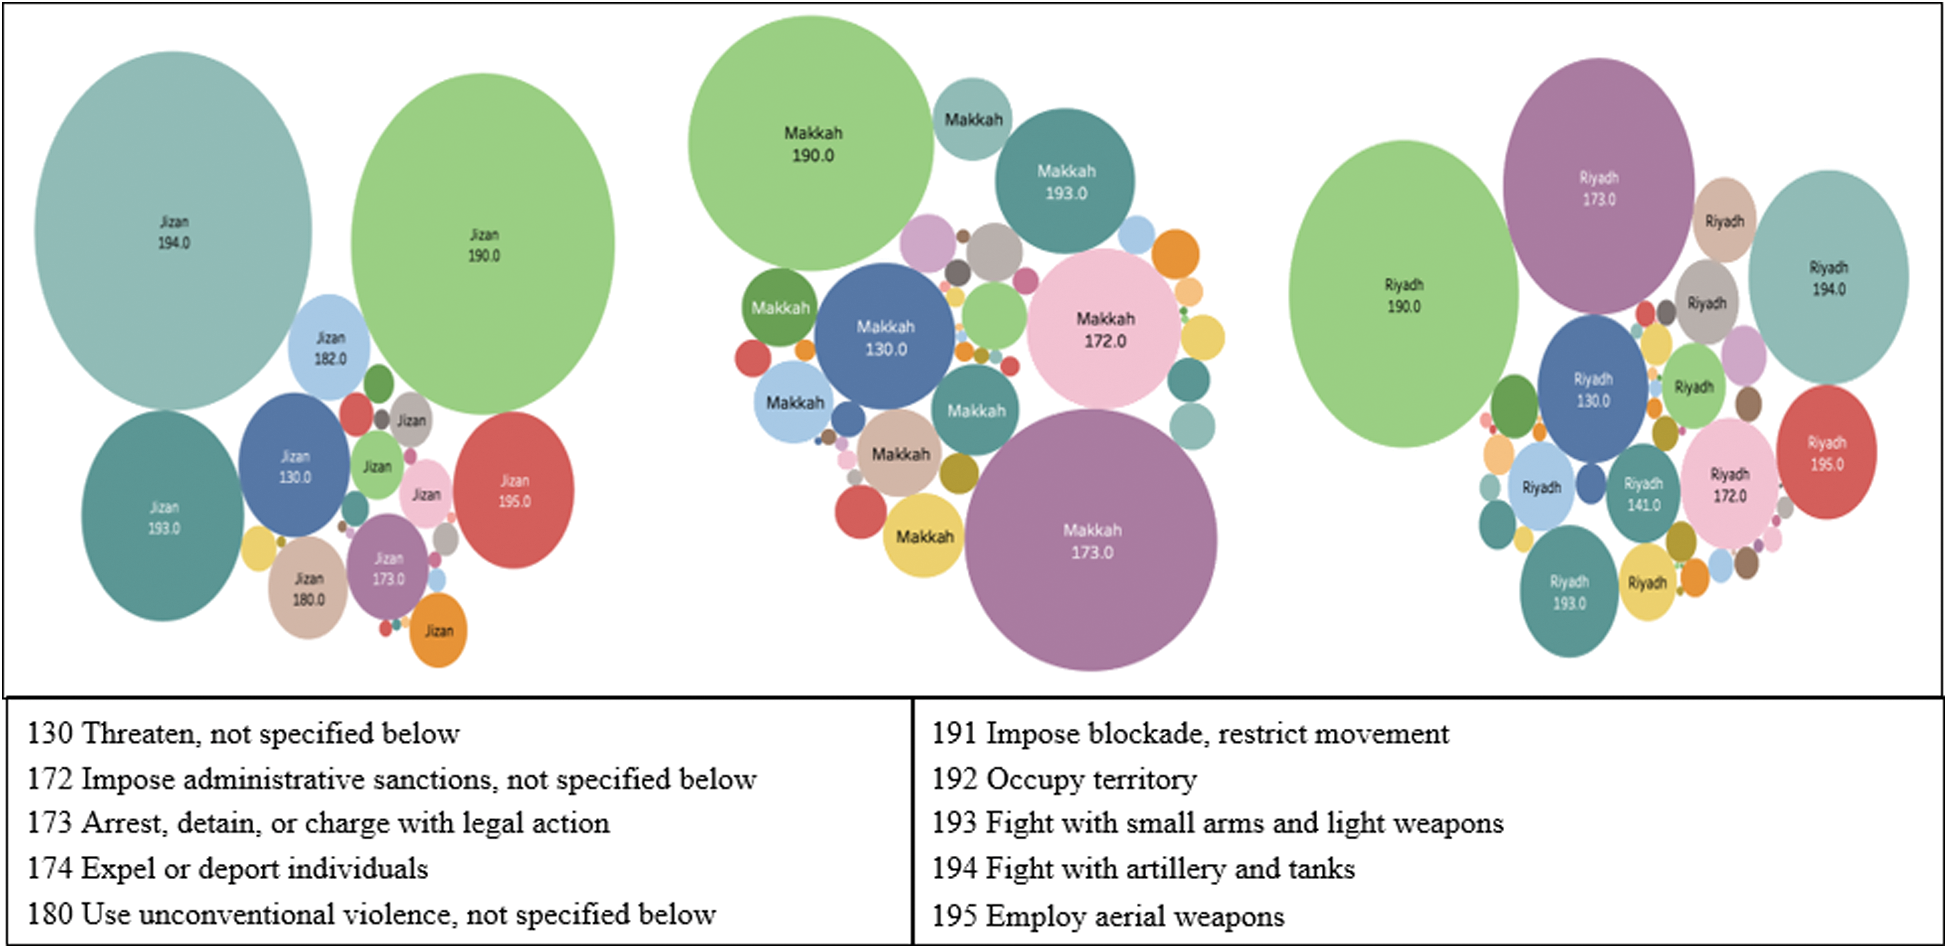
Figure 6: Event rate per the 3 top regions
The two most predominantly occurring crimes in Makkah are “Use the conventional military force” and “Arrest, detain, or charge with legal action.” Other frequently occurring crimes include “Fight with small arms and light weapons,” “Impose administrative sanctions,” and “Threaten.” The two most frequent crimes in Jizan are “Use the conventional military force” and “Fight with artillery or tanks.” Other significant crimes include “Fight with small arms and light weapons,” “Employ aerial weapons,” and “Threaten”.
4.4 Classification over Time for Each Region
Region: Riyadh: Fig. 7 shows the top 4 crimes by frequency in Riyadh across the period. In August 2018, there is a sharp increase in “Arrest, detain or charge with legal action. “There is a drop-in crime rate across all the four types of crime in February 2018 and July 2018. There is a jump in crime rates in August 2018 across all four types of crimes. “Threaten not specified” is consistently the lowest across all months.
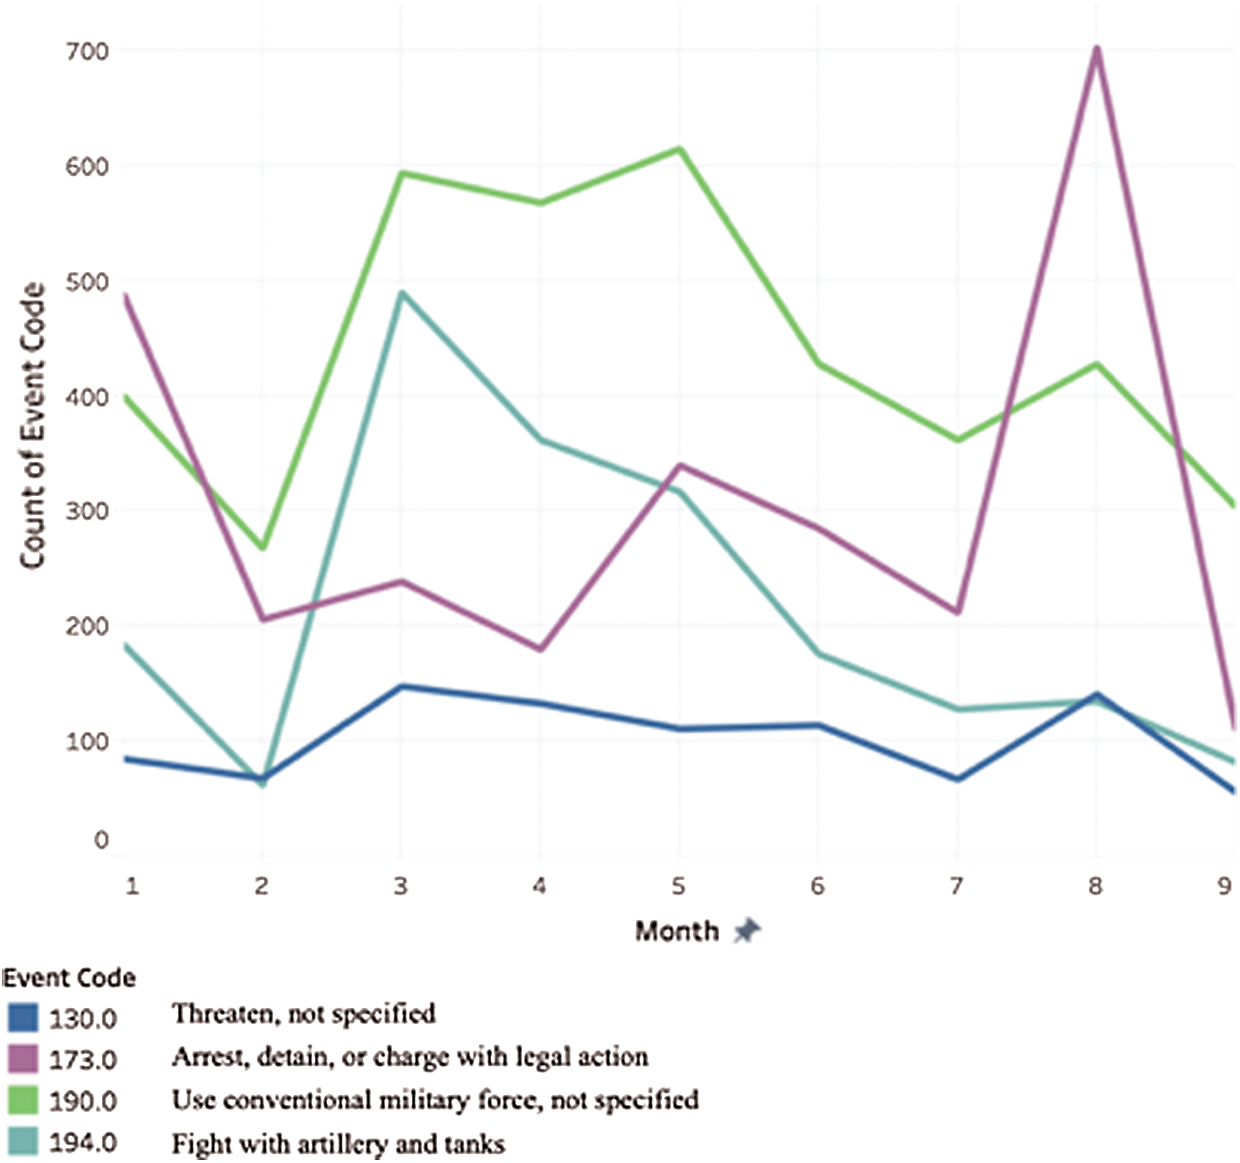
Figure 7: Total event count for Riyadh over months
Region: Makkah: “Arrest detain or charge with legal action” and “Use of conventional military force” are consistently higher than “Impose administrative sanctions” and “Threaten, not specified.” The highest crime rate in any month for a particular type in Makkah is “Use of conventional Military force” in July 2018 with a count of almost 190, while the second highest is “Arrest, detain, or charge with legal action” in August 2018 with a count of almost 170 as shown in Fig. 8.
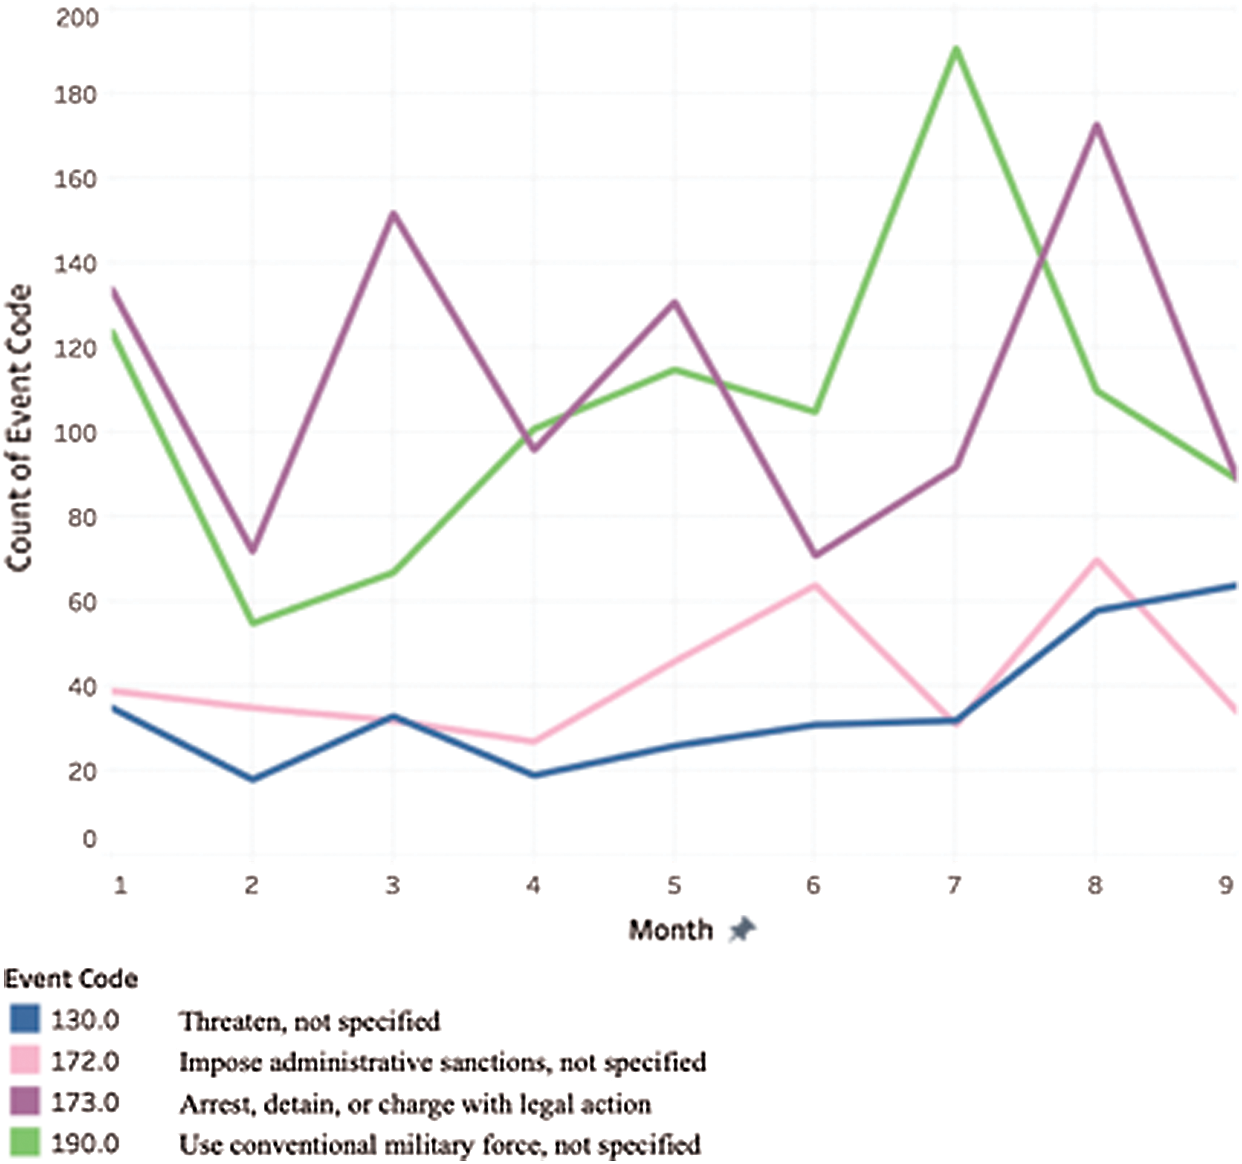
Figure 8: Total event count for Makkah over months
Region: Jizan: At the start of the period, in January 2018, all the crime event counts are between 20 to 70, as shown in Fig. 9. In April 2018, there is an increase across all the types, with “Fight with artillery and tanks” and “Use the conventional military force,” increasing by almost 200% and 500%, respectively. There is a second spike in crime rates in August 2018.
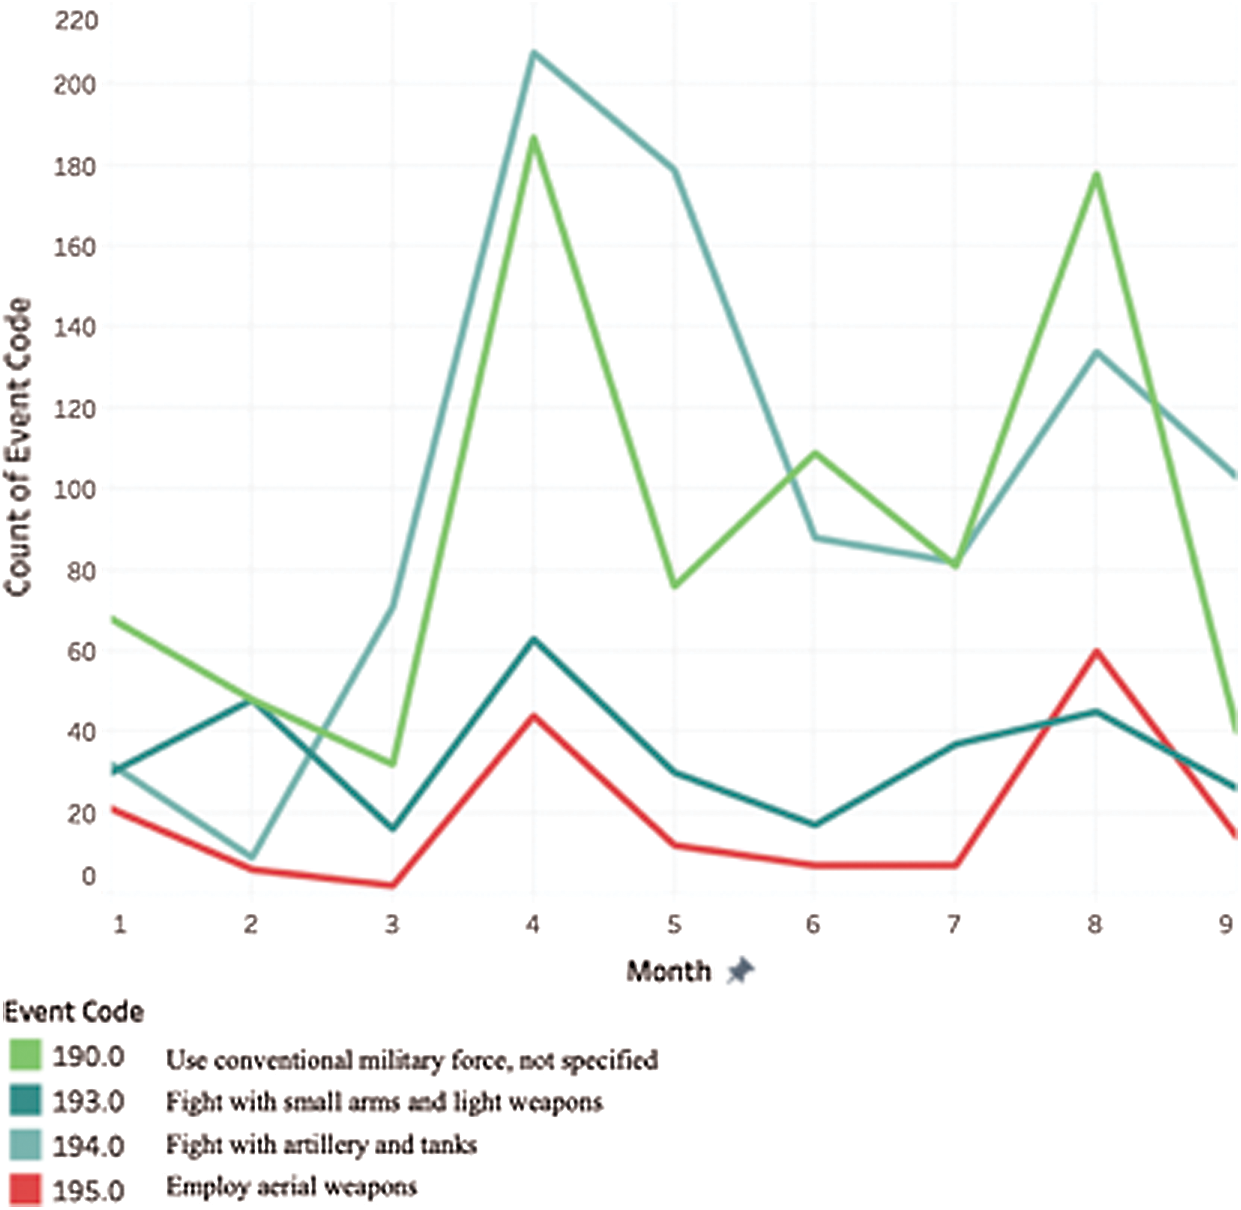
Figure 9: Total event count for Jizan over months
4.5 Classification Per Actor 1 over Time for the Top Regions
In Fig. 10, Saudi Arabia (SA), Yamen (YM), and Iran (IR) were the top actor 1, affecting Riyadh, Makkah, and Jizan’s overall months. So, SA was affecting itself more than any other actor, by a considerable margin. While YM was the second and IR was the least among the three. The second month shows a decrease in count across all the actors. The count increases in August 2018, for all the actors with count for SA in 2394, an increase of 90% over the previous month.
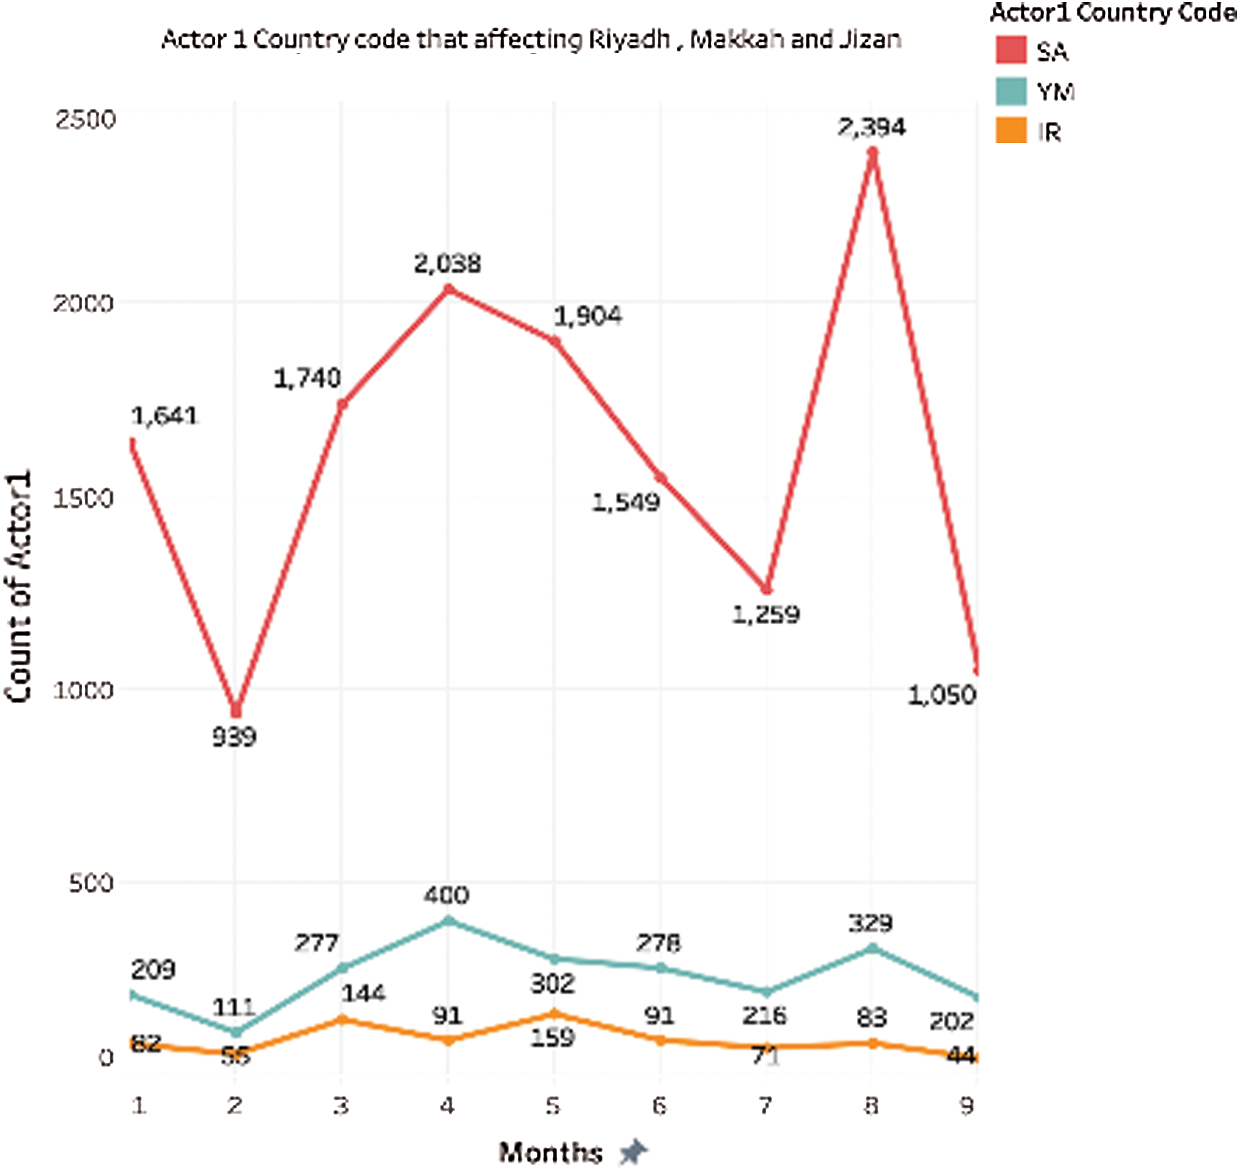
Figure 10: Total count of actor 1 over months
4.6 Classification Per Actor 2 over Time for the Top Regions
In Fig. 11, Saudi Arabia (SA), Yamen (YM), and Iran (IR) were also the top actor 2, affecting Riyadh, Makkah, and Jizan’s overall months. The count for SA was consistently higher than YM and IR. While YM was the second, IR was the least among the three consistently. The second month shows a decrease in count across all the actors. The count increases in August 2018, for all the actors with count for SA at 2121, an increase of 79% over the previous month.
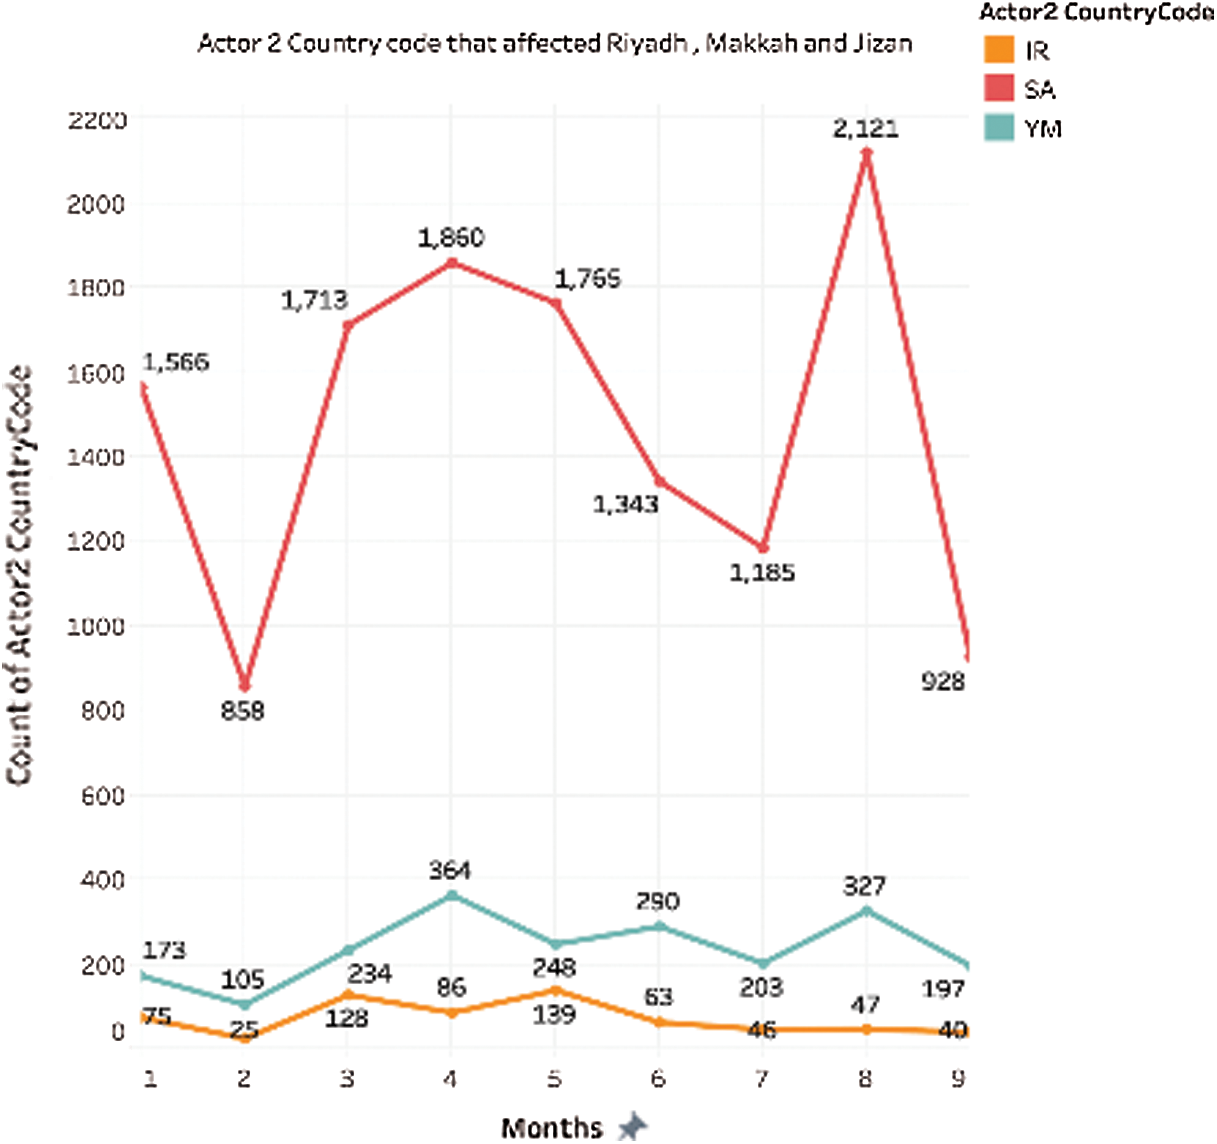
Figure 11: Total count of actor 2 over months
4.7 Classification Actor 1 Per Region
Fig. 12 shows the count by Actor 1 in Riyadh, Makkah, and Jizan. The count by Saudi Arabia is highest across Riyadh, Makkah, and Jizan, with the highest count of 10,185 in Riyadh. The lowest count is by IR in Makkah, with a count of just 87.
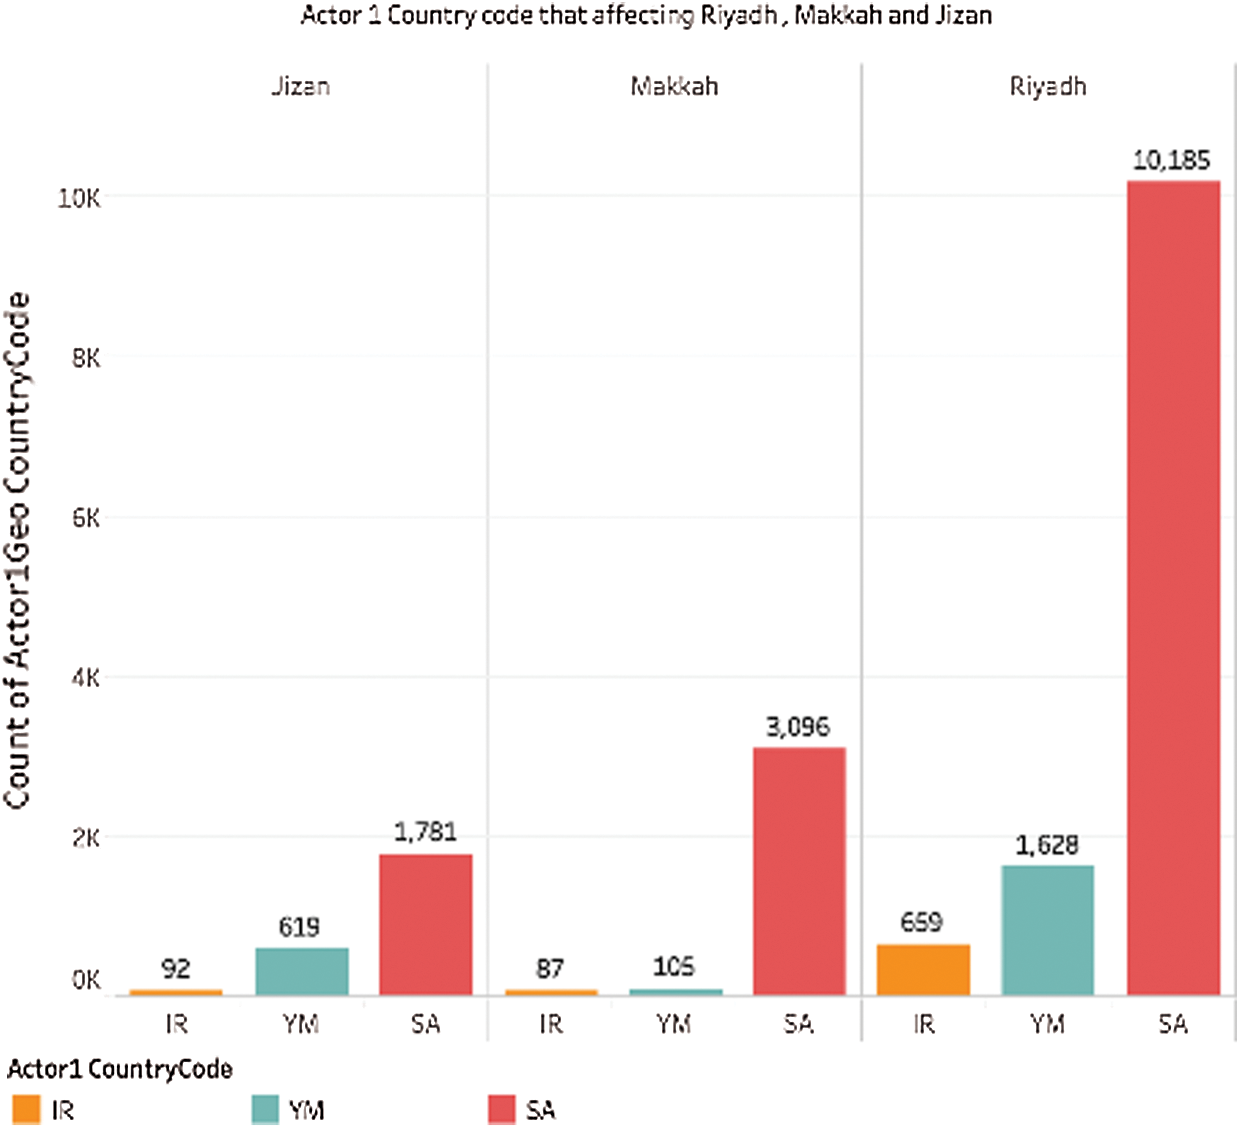
Figure 12: Actor 1 country code per region
4.8 Classification Actor 2 Per Region
Fig. 13 shows the count by Actor 2 in Riyadh, Makkah, and Jizan. Again, the count by Saudi Arabia is highest across Riyadh, Makkah, and Jizan, with the highest count of 9,394 in Riyadh, 2565 in Makkah, and 1855 in Jizan. The lowest count is by IR in Jizan, with a count of 62.
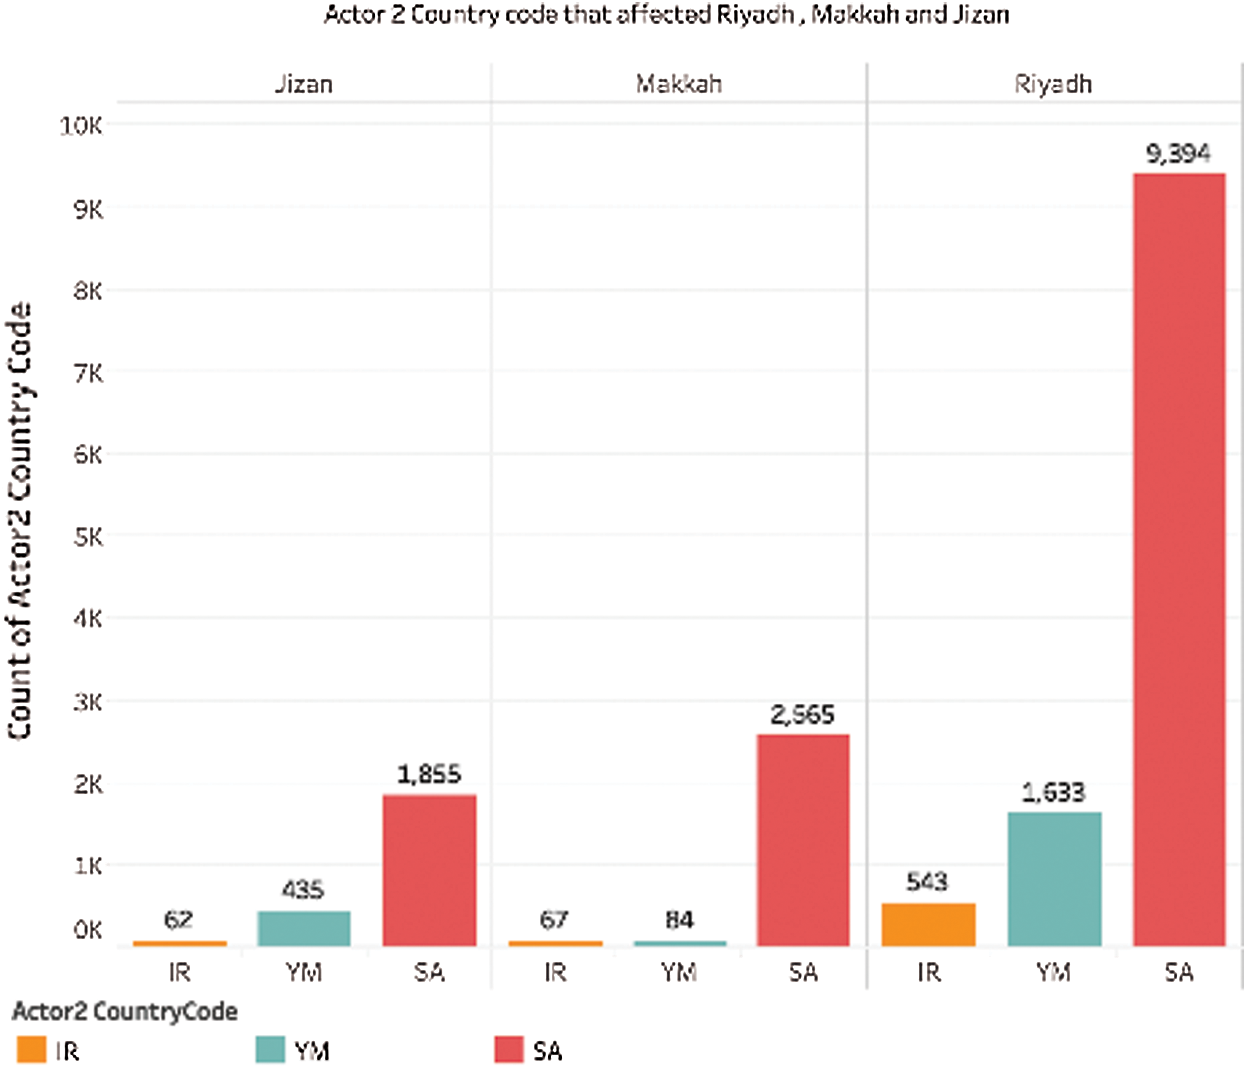
Figure 13: Actor 2 country code per region
4.9 Classification Weekly Count of the Top 3 Crime Types Per Regions
Region: Riyadh: In Fig. 14, “Coerce” acquired the highest rate per weekly count in the eighth month, and its increased triple of the previous month. Also, we can observe the three crime types got their lower weekly count in the second month. “Fight (Use of conventional military force)” was consistently high from March 2018 to May 2018, ranging between 15 and 16, while “Fight (Fight with artillery and tanks)” decreased steadily from March 2018 onward.
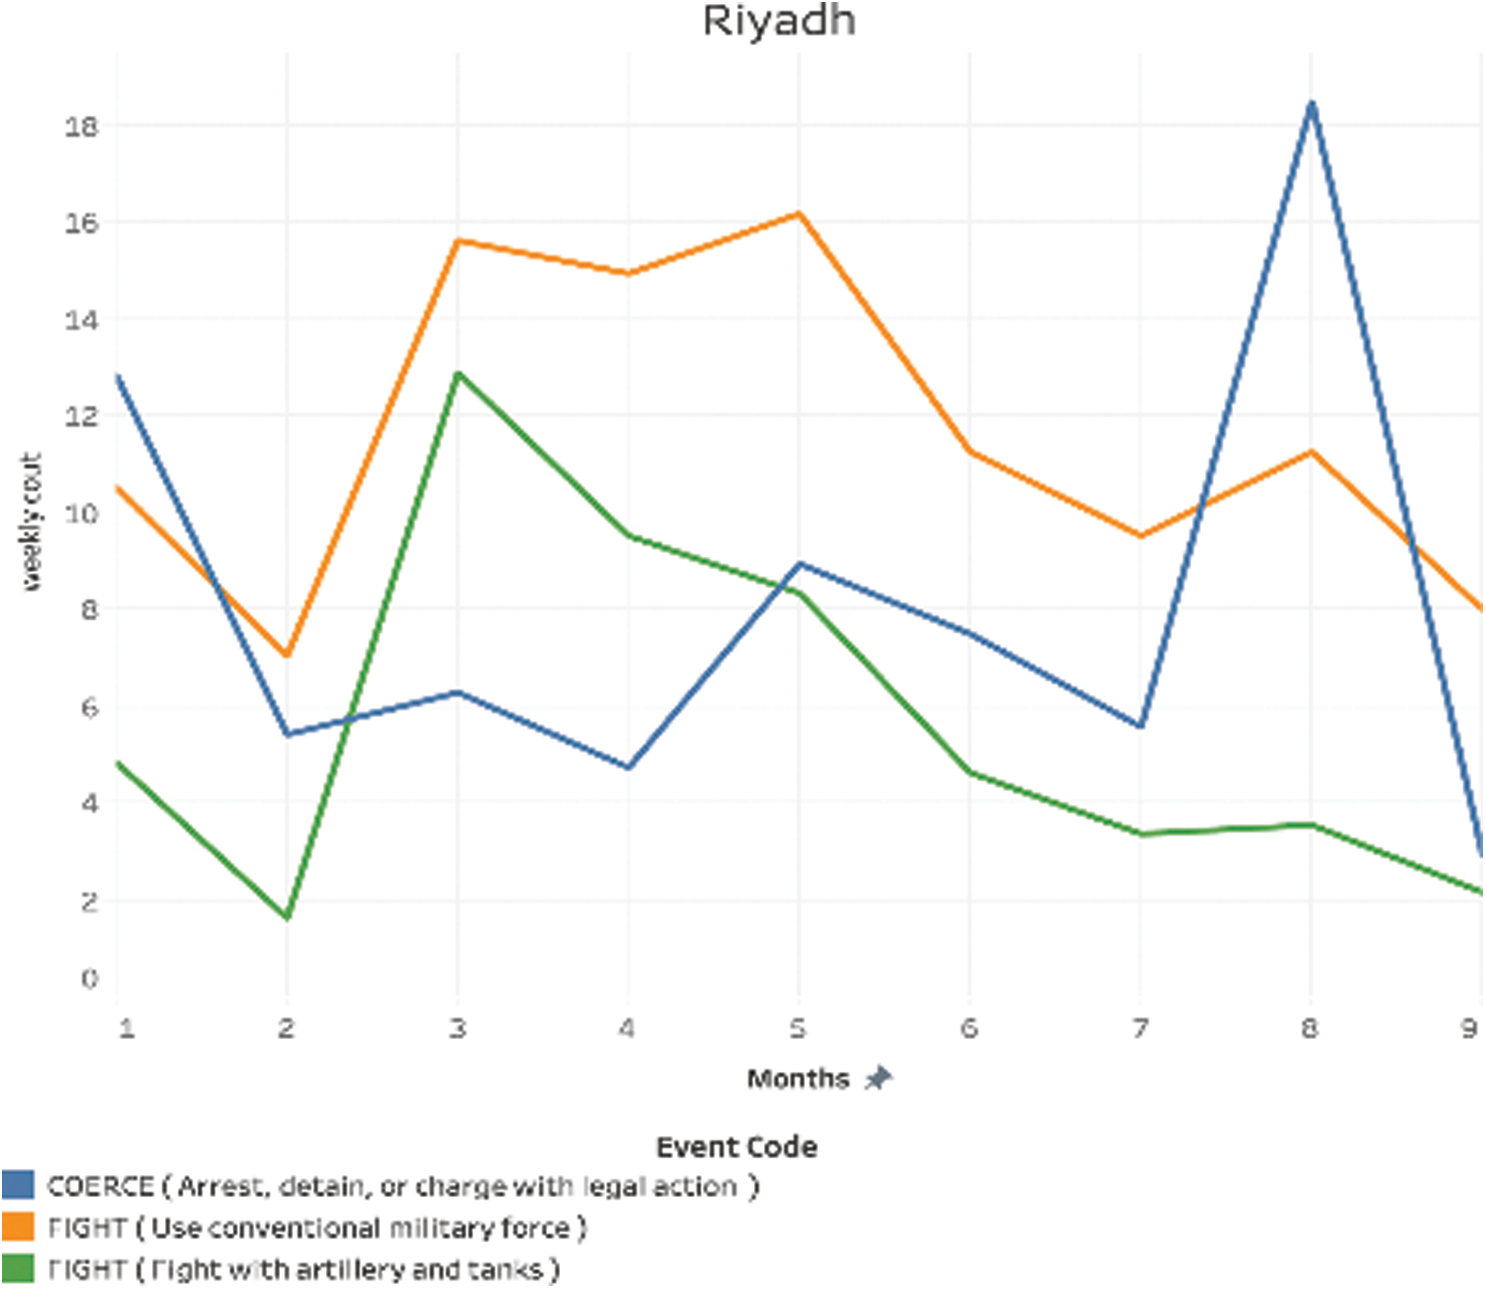
Figure 14: Weekly count over time for Riyadh
Region: Makkah: As shown in Fig. 15, “Fight” had the highest weekly count amongst the three for any month, in July 2018. “Coerce (Arrest, detain, or charge with legal actions)” reached its highest count in August 2018. “Coerce (Impose administrative sanctions)” was consistently low with a count between 1 and 2.
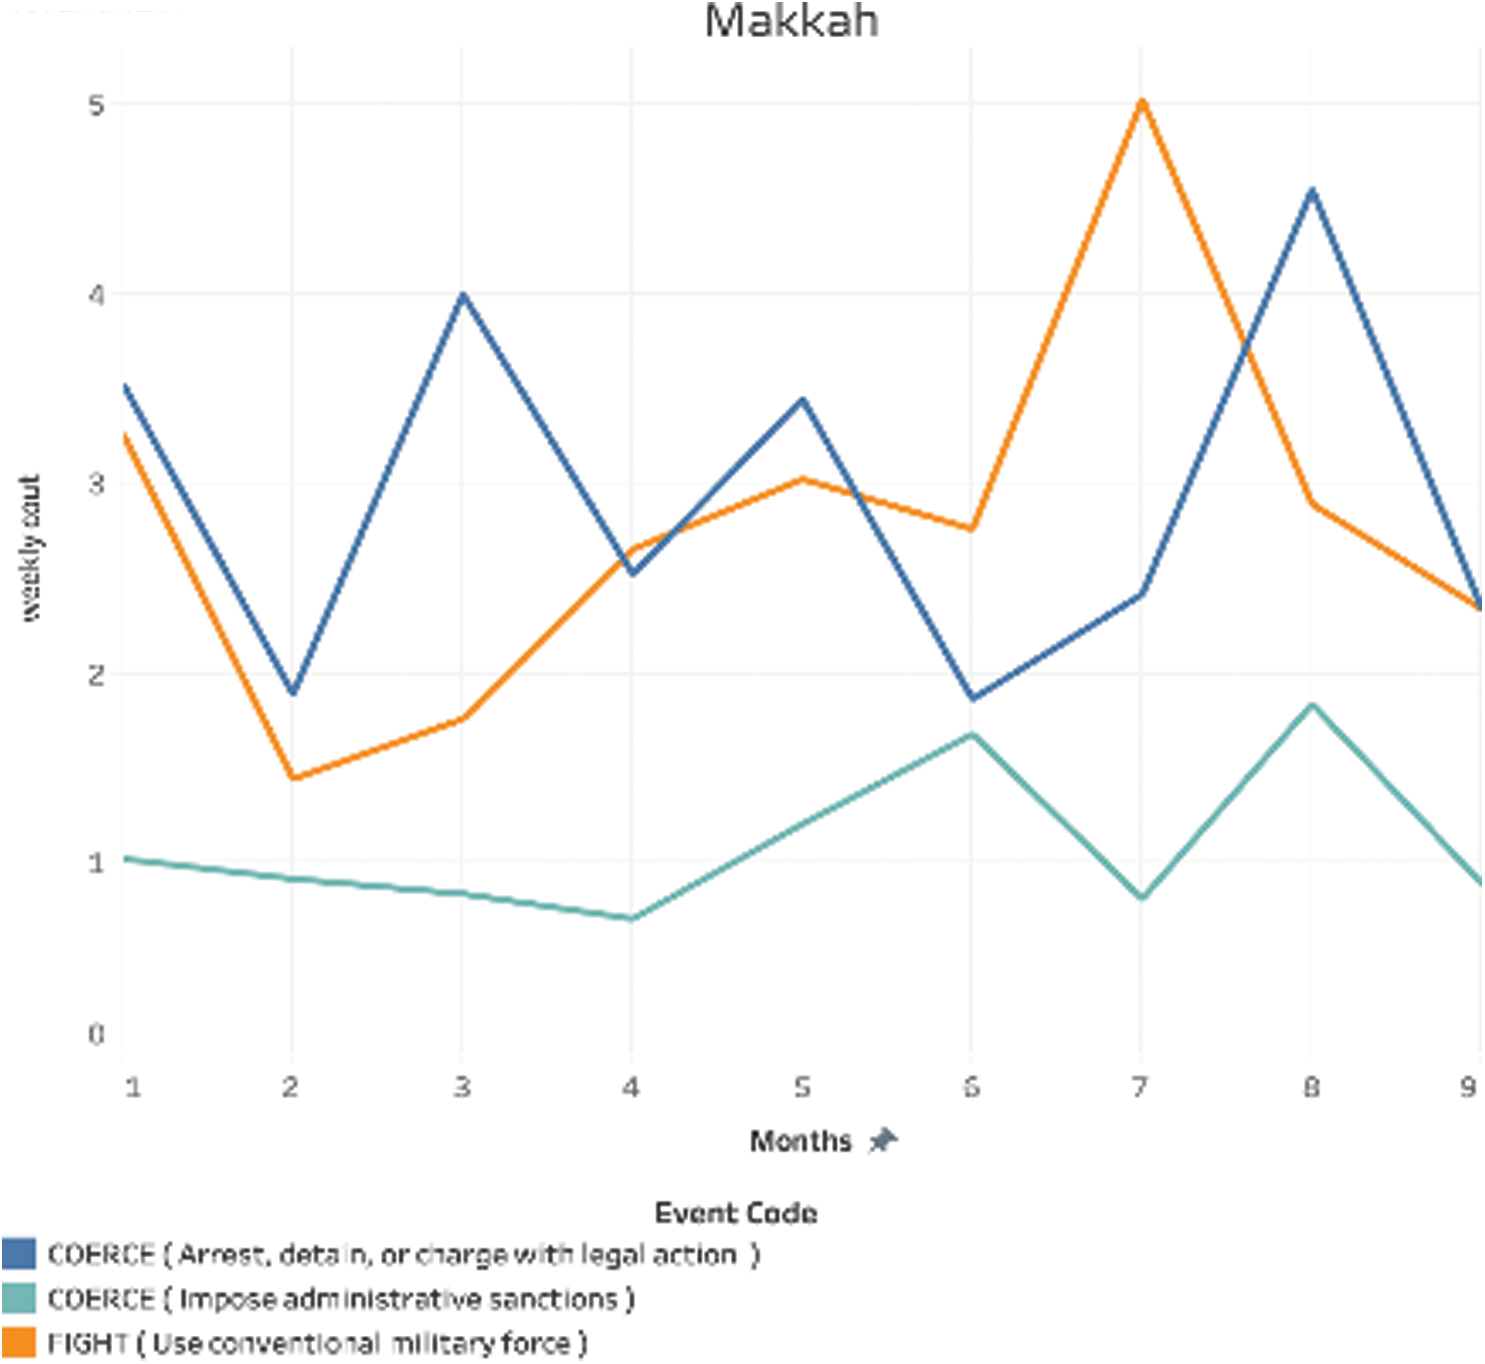
Figure 15: Weekly count over time for Makkah
Region: Jizan: Fig. 16 shows that all the three types of crimes had the highest count in April 2018, with “Fight (Fight with artillery and tanks)” being the highest amongst the three with a count of almost 6. The crime rate for “Fight (Fight with small arms and light weapons)” was always below 2 per week.
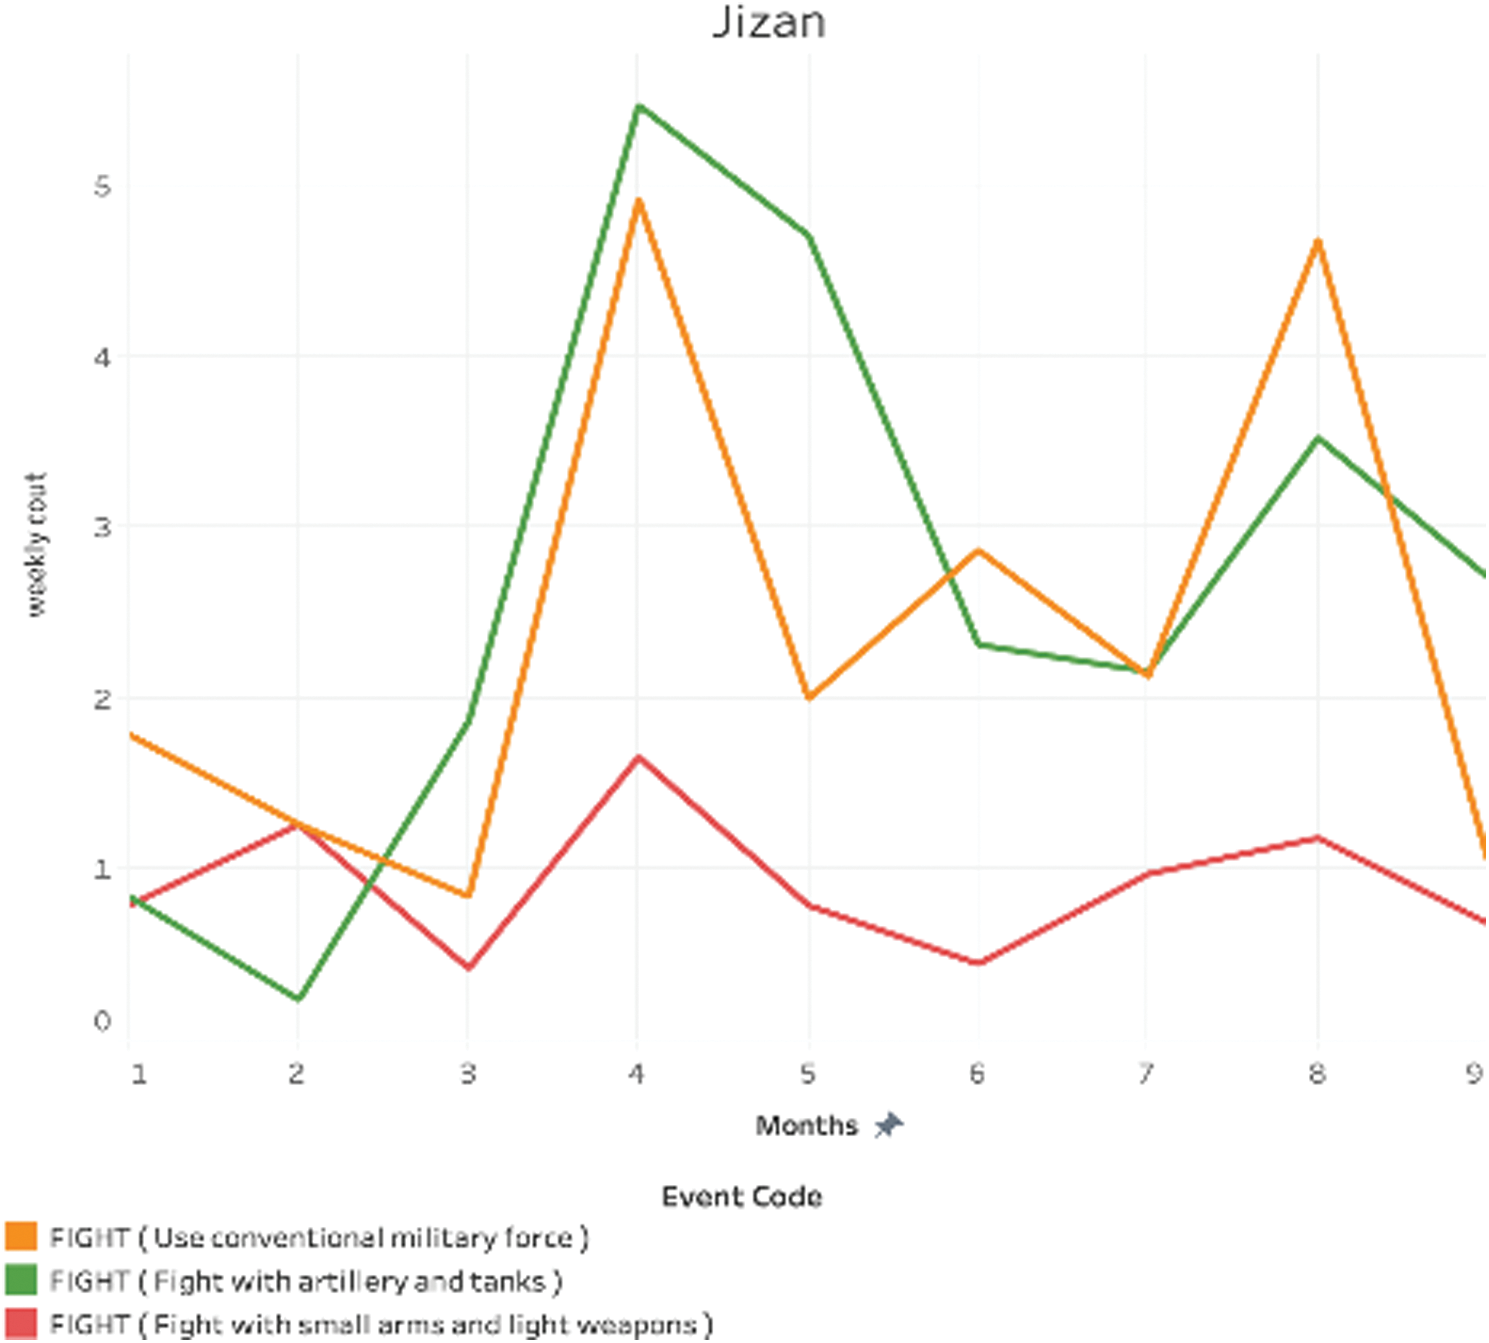
Figure 16: Weekly count over time for Jizan
4.10 Weekly Count of the Common Crime Type Over Months
Fig. 17 shows the weekly counts for “Fight (use conventional military force)” over the months. Riyadh has the highest rate per weekly count of the crime. It spikes up with an increase of 120% and 100% in March 2018 and August 2018. The count for all three regions also increases in August, reaching the highest within the regions. Jizan consistently has the least frequency of crimes for all the months except for April 2018.
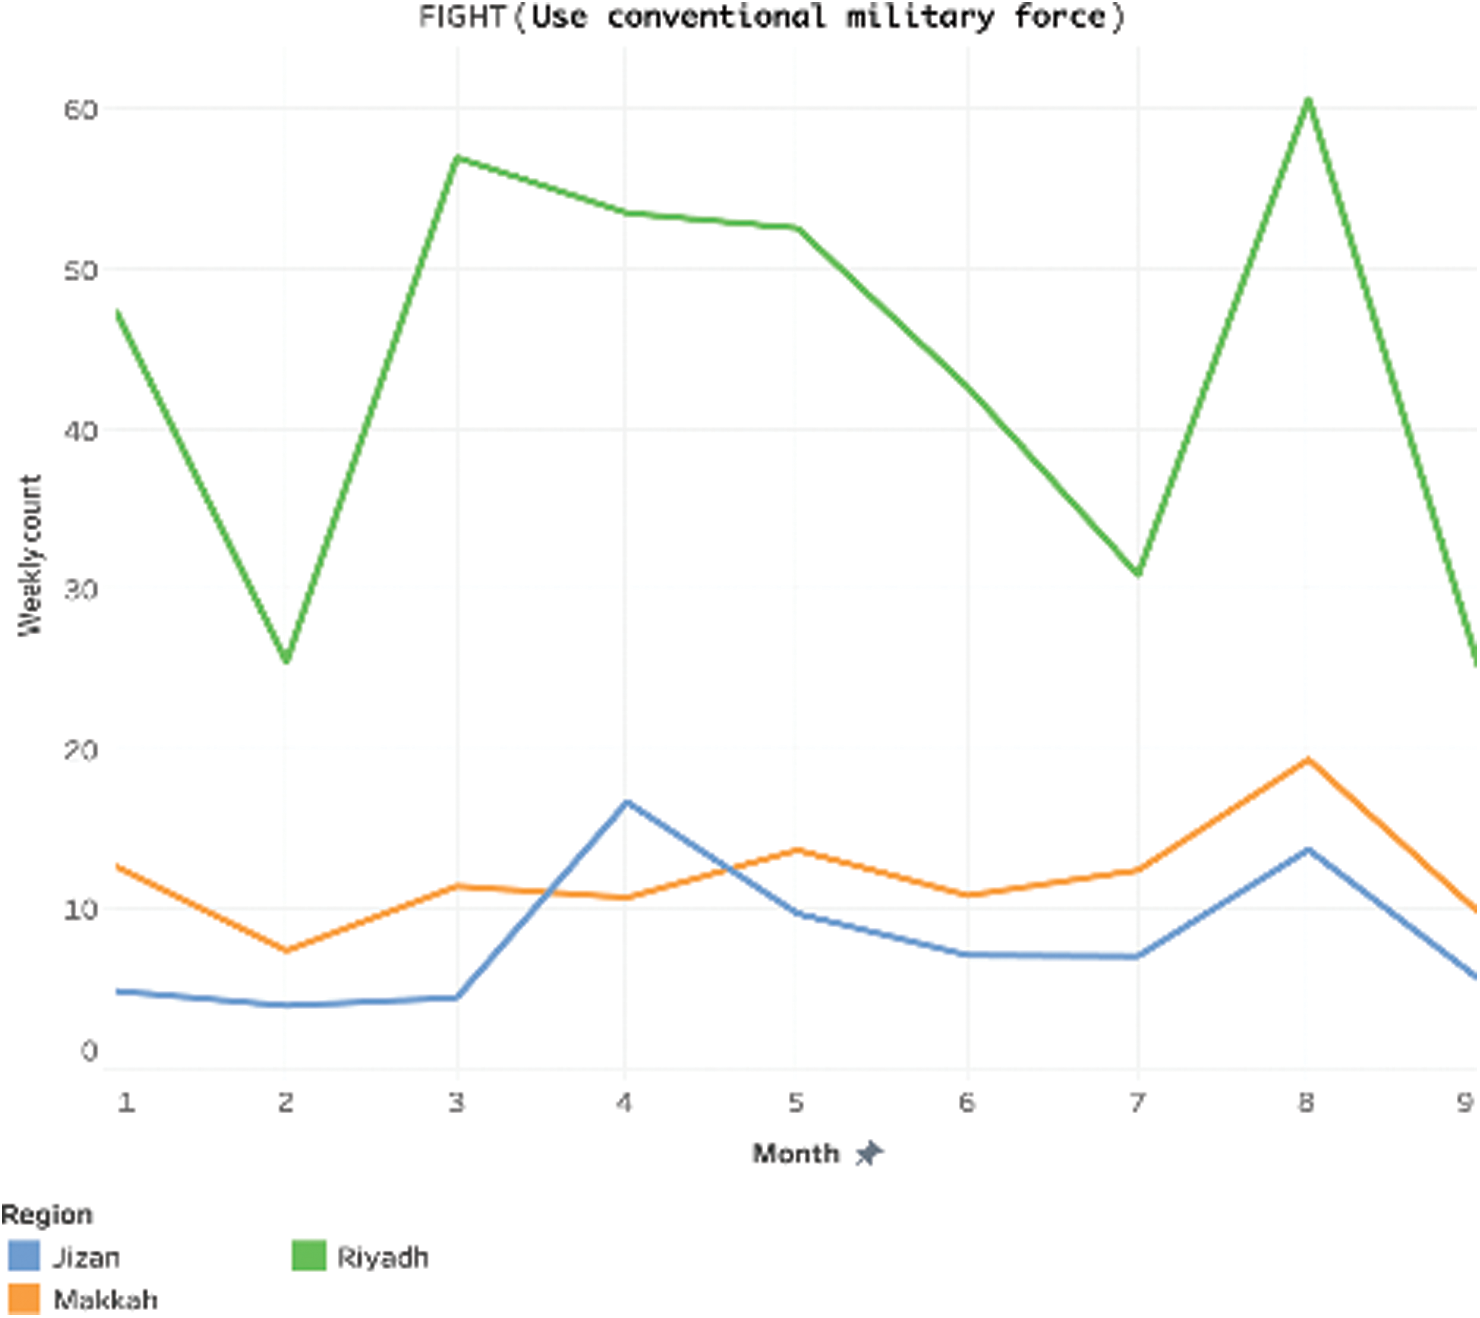
Figure 17: Fight use conventional military force, not specified
4.11 Classification of Total Count Per Region
Fig. 18 shows the rate of the crime “Fight (Use of conventional military force)” for August 2018, when the count was highest. The crime rate of the event is shown per month, week, and day for each region. Riyadh has the highest daily crime percentage of 13.8. Jizan records a much lower daily crime rate of 5,7 while Makkah is at 3.5. We can see according to Fig. 19, the crime rates every 6 hours in Riyadh are almost 3.45, more than twice the count Jizan and more than thrice the count of Makkah.
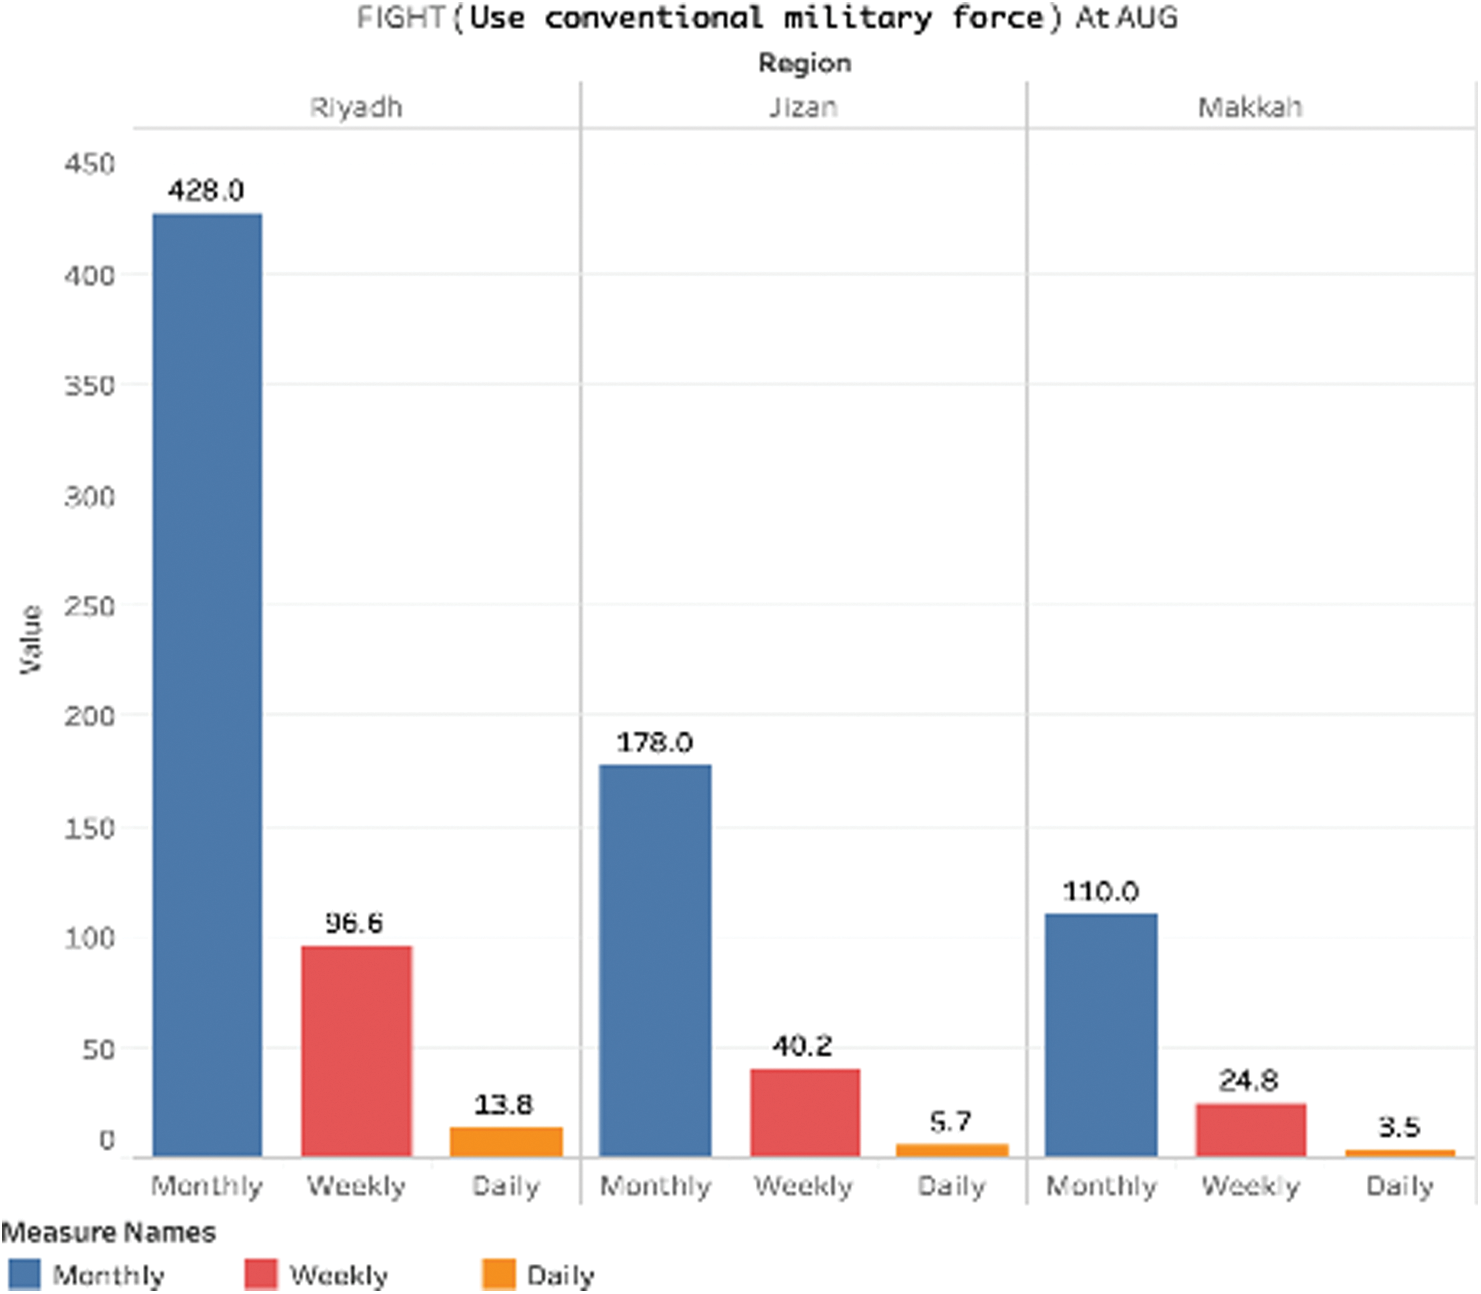
Figure 18: Total event count per region
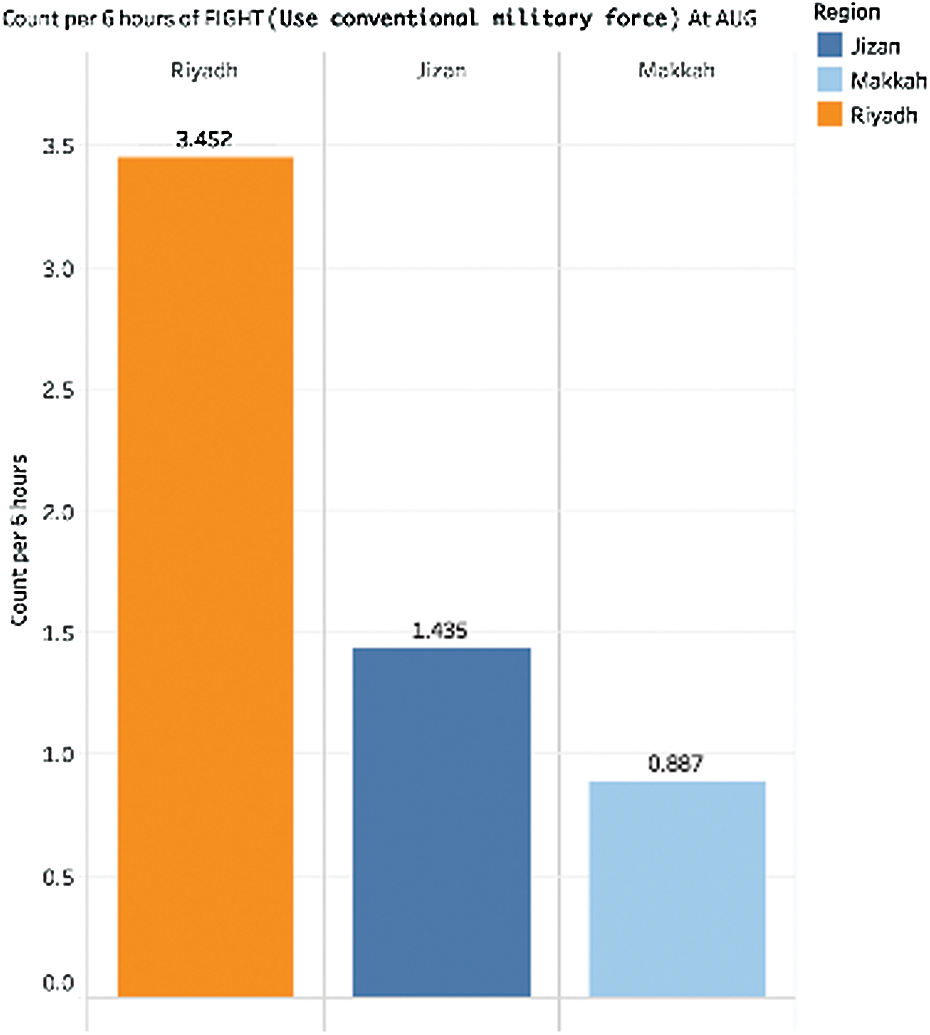
Figure 19: Event count per 6 hours
The high crime rate in August is quite an interesting one. On 12th August, Dhul Hajj month starts. Muslims from around all the world come to do rites of pilgrimage. To examine any possible correlation, we performed statistical analysis with the Ministry of Interior’s online data in their Twitter account, as shown in Figs. 20 and 21.
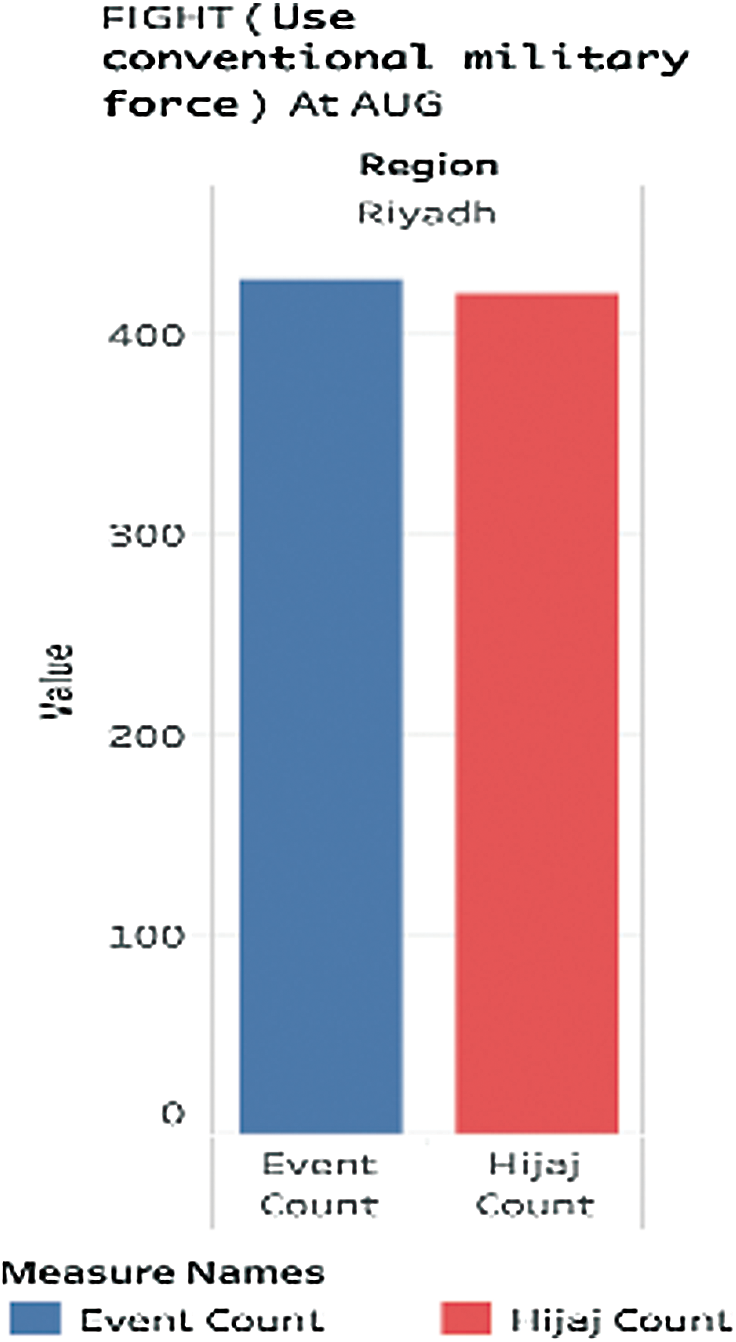
Figure 20: Hajj and total event count at AUG
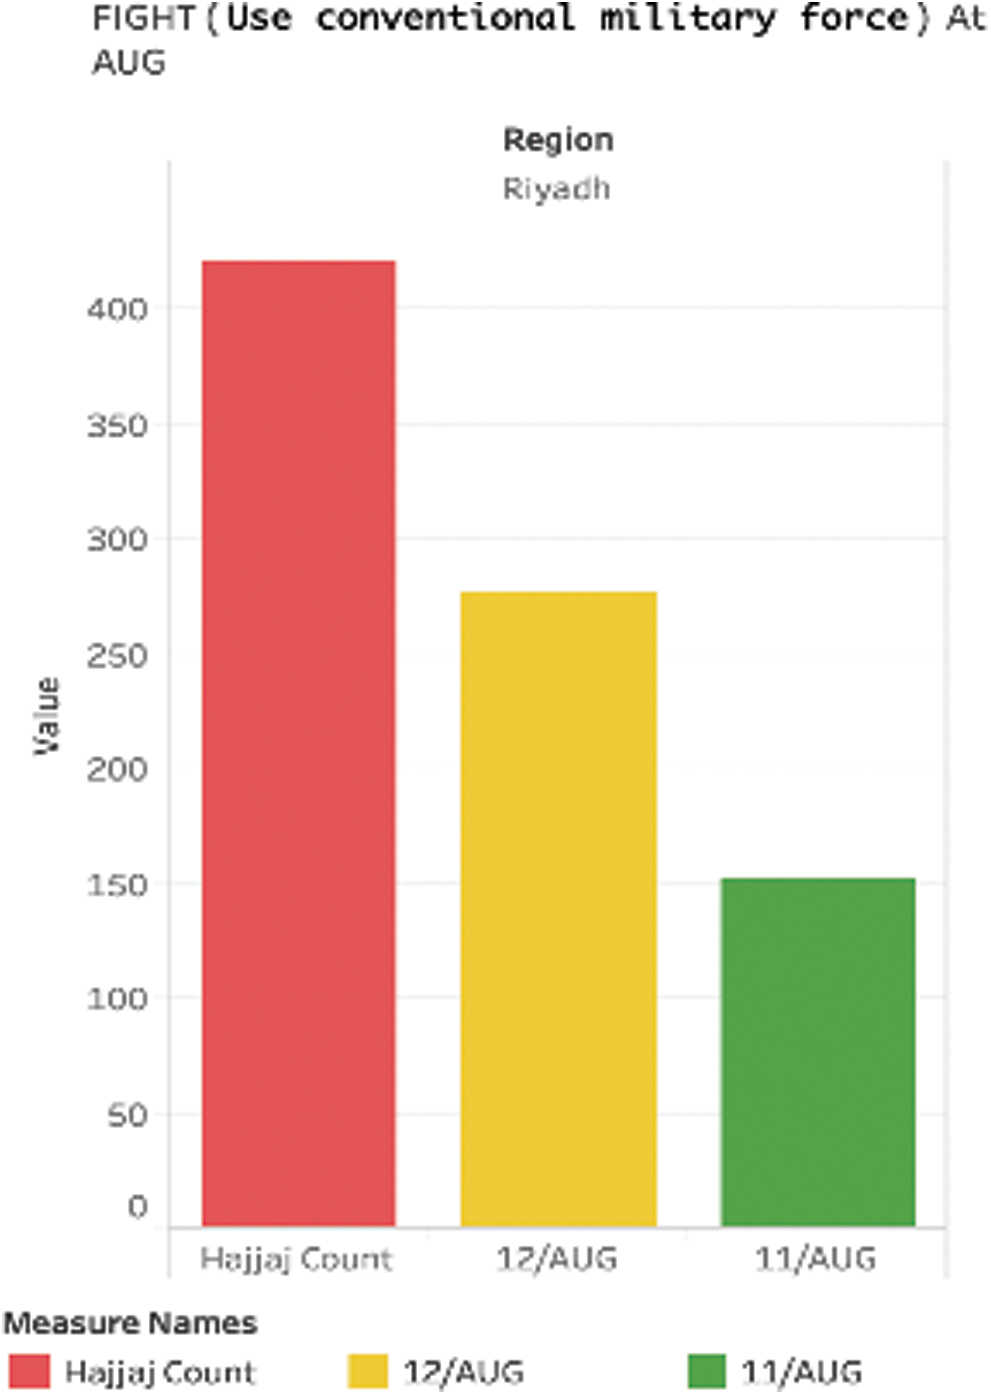
Figure 21: Hajj and event count at AUG
The next Fig. 21 shows the hajj count and the event count from 1st to 11th August, when Dhul hajj has not started, and the event count from 12th to 31st August, the period when Dhul hajj starts as the column shows the period of Dhul Hajj after 12th August shows much higher count. It is difficult to confirm the reason as the number of days between 12th to 31st being double, could also be the factor for the increased count.
Hajj count came from Jeddah Islamic Port and King Abdelaziz airport located in the Makkah region. There were more than 918 thousand hajjes, while the event count was 110 per month. As we can see 11th August acquired 39 event count while 12th August acquired 70–71 count.
4.12 Comparison between Smoker and Crime Rate
Smoking still a big issue worldwide and a significant public health problem. Does smoking influence the psychological and mental state leading to committing crimes? We can see from Fig. 22 that Jizan has a much lower smokers’ rate than Riyadh or Makkah. Thus, smokers’ rate and crime rate may be related, as the crime rate in Jizan also lower than Makkah and Riyadh.
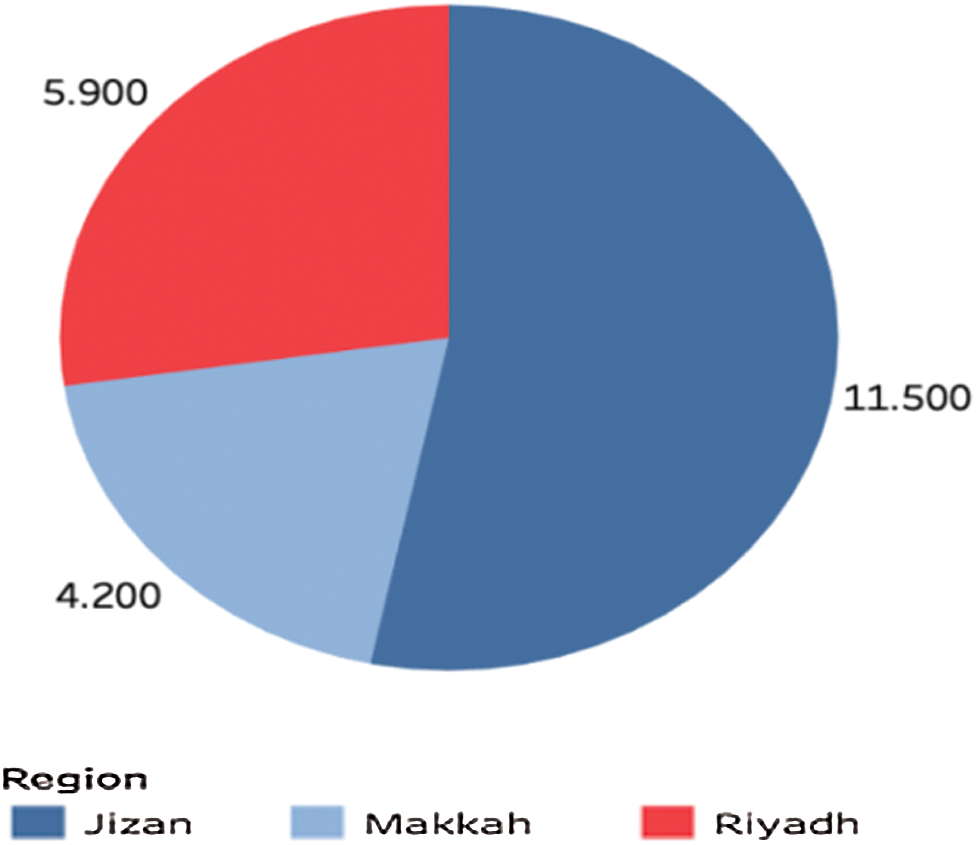
Figure 22: Unemployment rate per region
4.13 Comparison between Unemployment and Crime Rate
Fig. 22 from the General Authority for Statistics Labor Market for the Second Quarter of 2018 shows the top 3 regions’ unemployment rate. Jizan has the highest unemployment. Comparing with Fig. 23 showing the crime rate for the top three regions, we cannot conclusively say anything about the correlation between crime rate and unemployment.
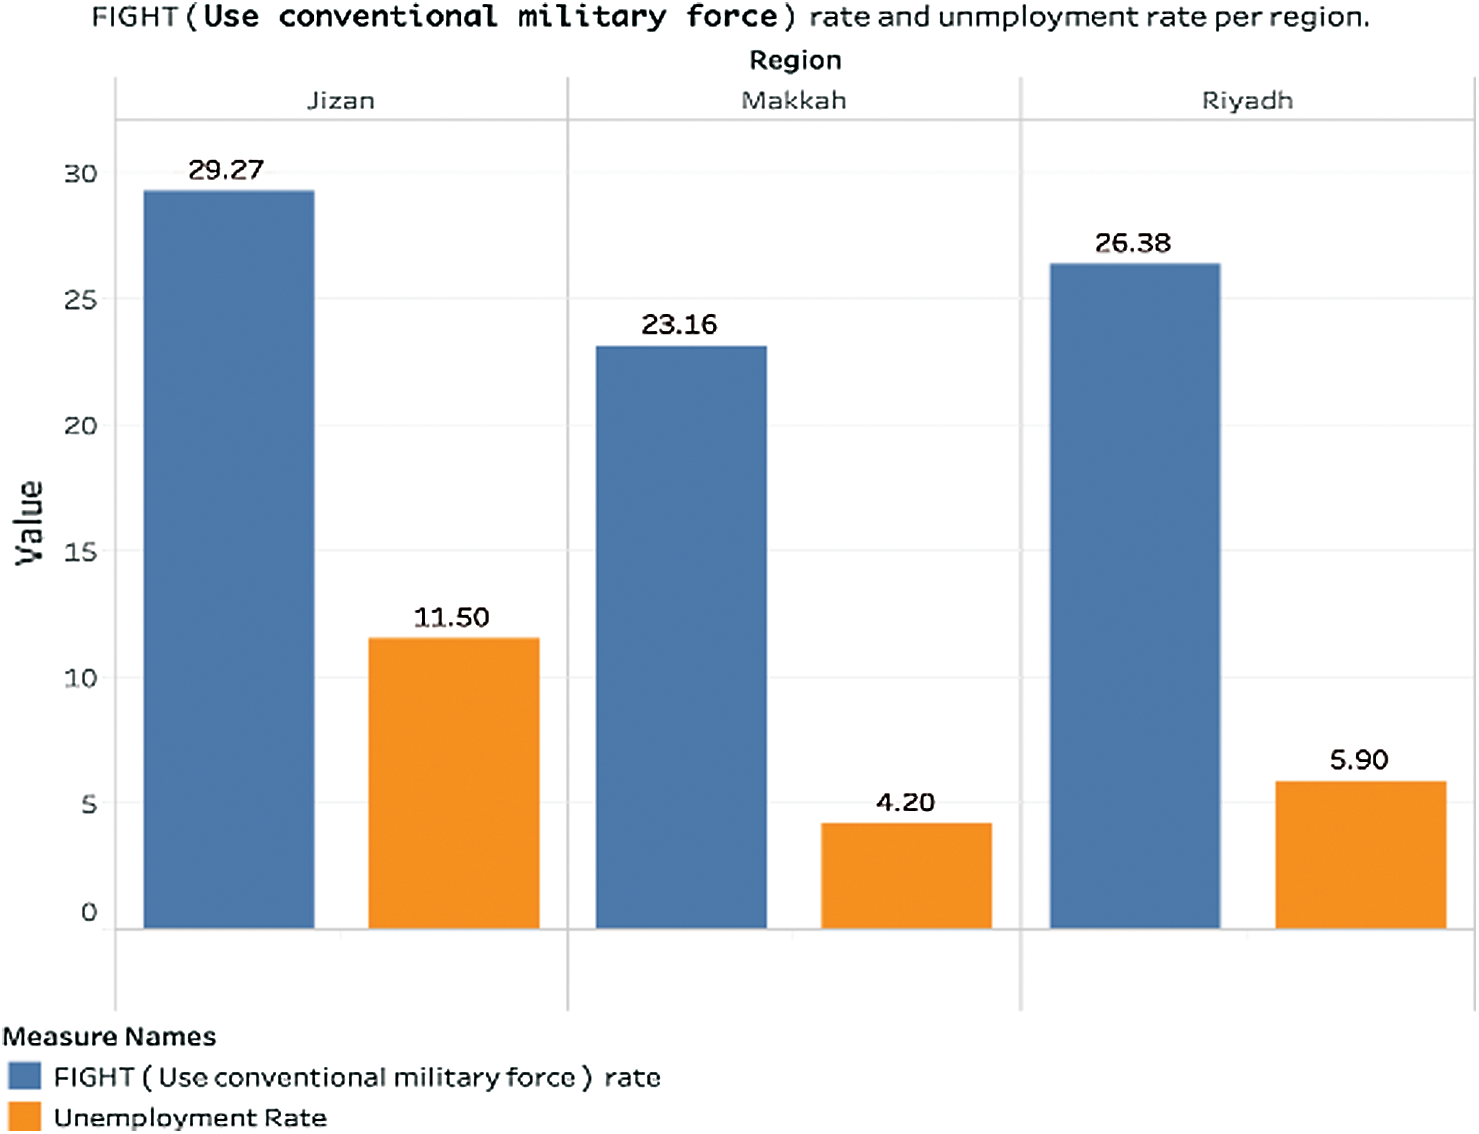
Figure 23: Unemployment and crime rate per region
4.14 Weather Status and Crime Rate
The weather could also be an influential factor in adding to crime rates. It provides temperatures in a given area and time. Figs. 24–26 shows the temperatures for each region. Therefore, we can say that crimes are often reduced in low temperatures and rainy areas. Additionally, high temperatures may affect criminal behavior, which leads to a higher crime rate.
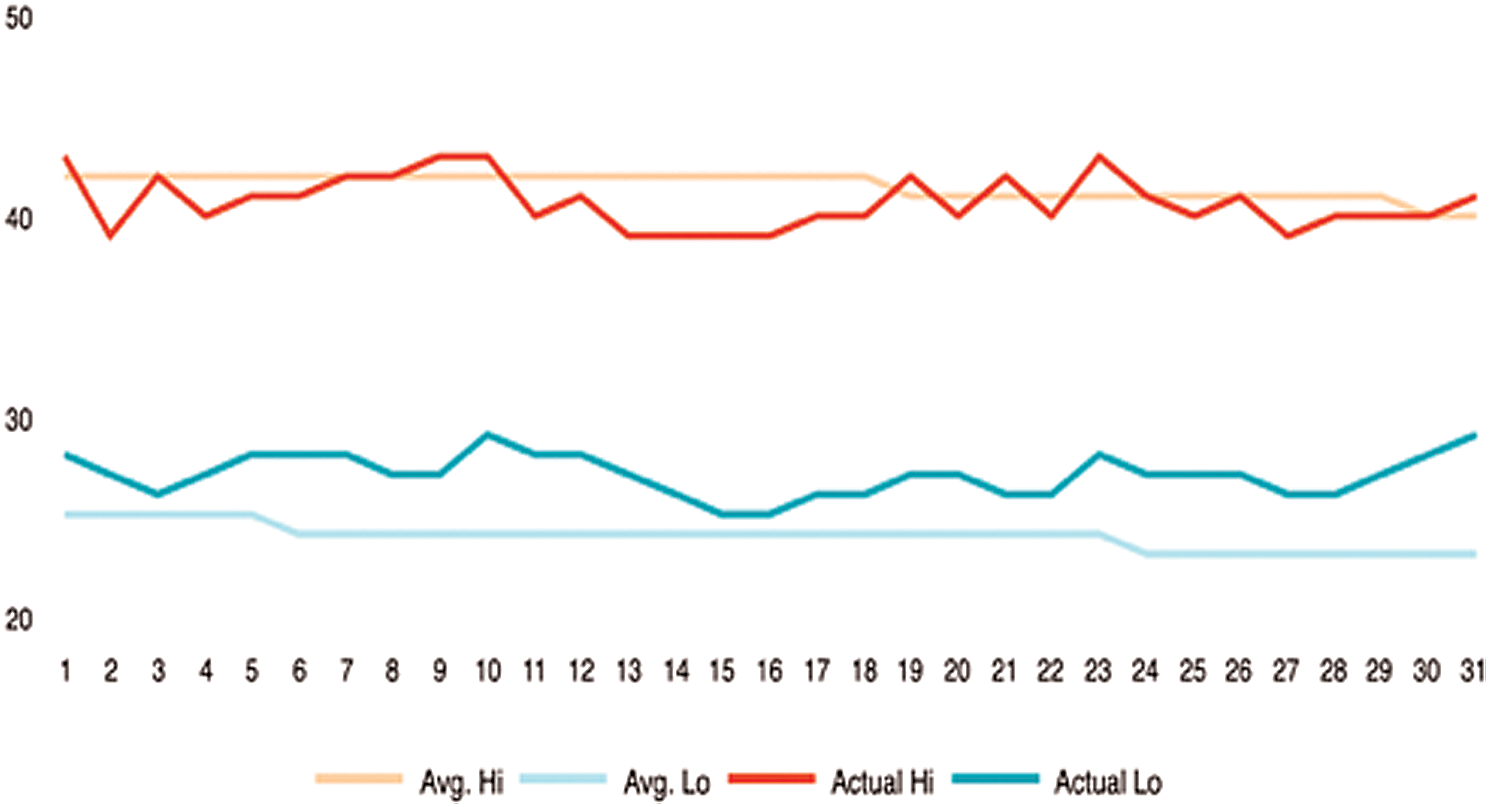
Figure 24: Weather status in Riyadh
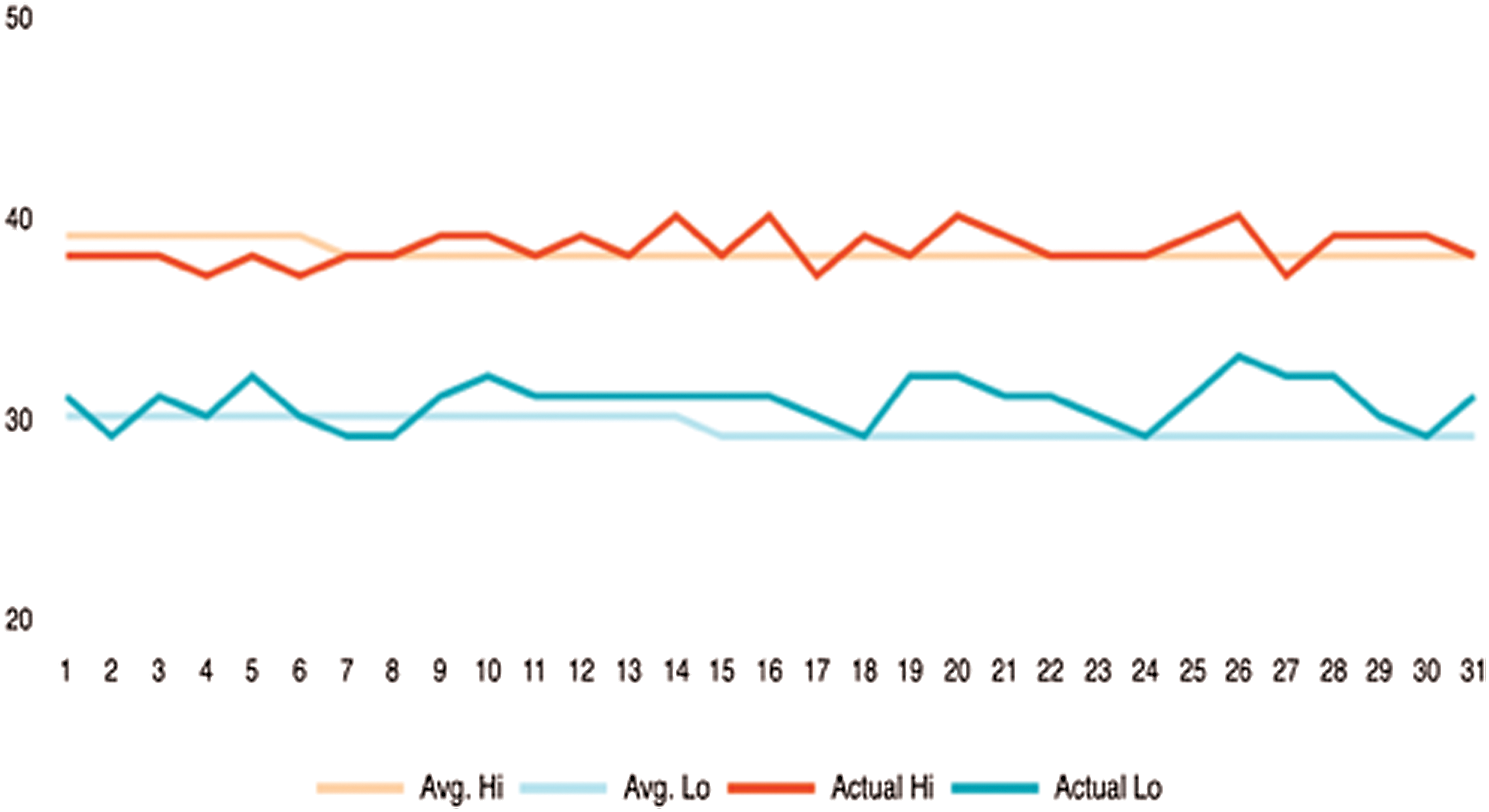
Figure 25: Weather status in Makka
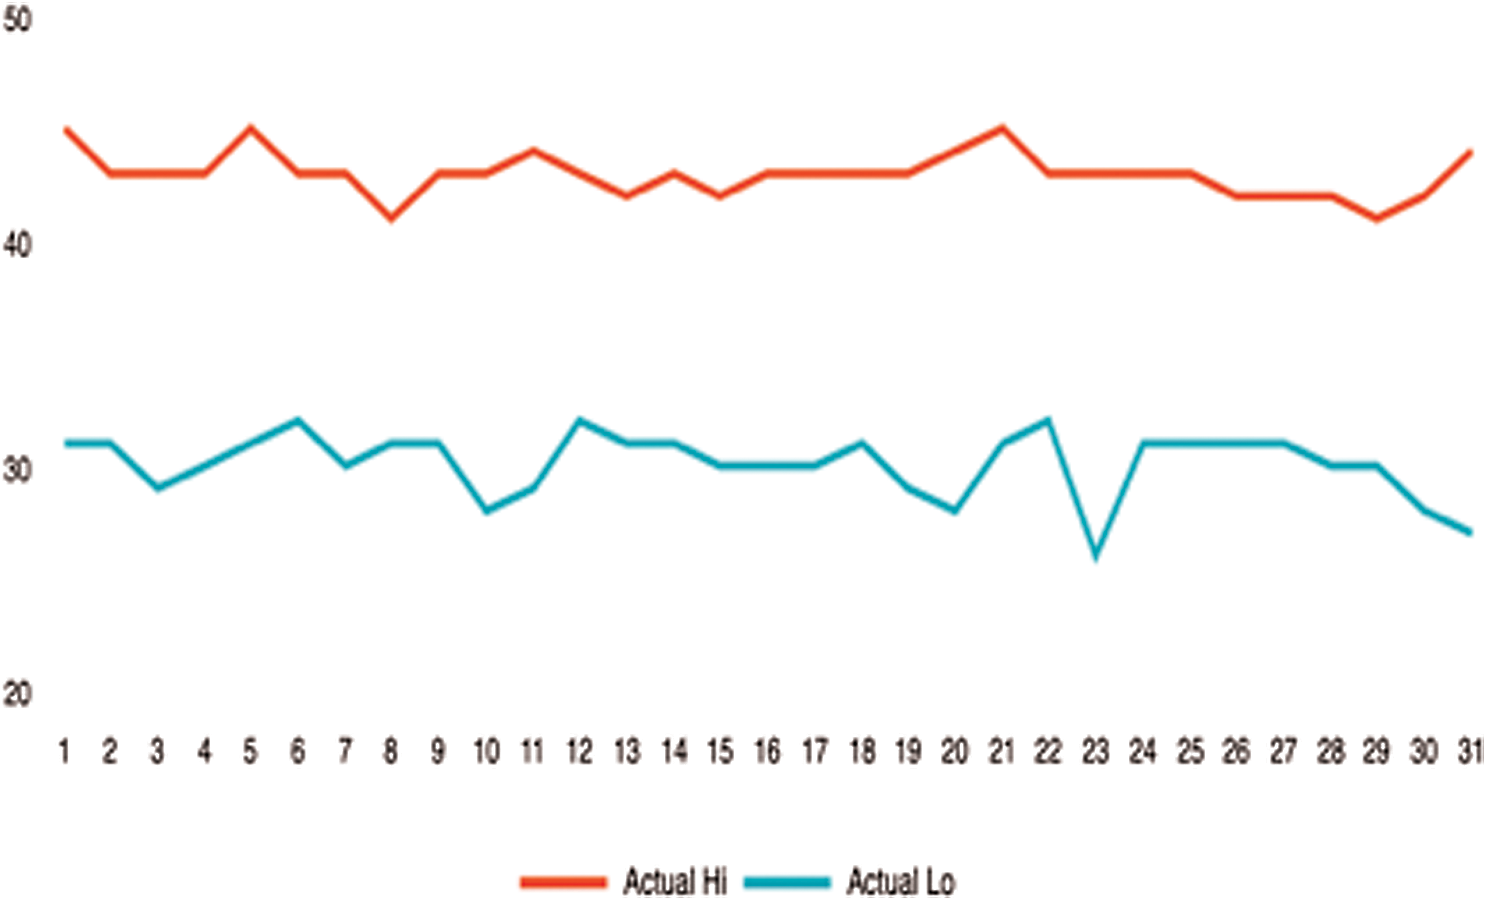
Figure 26: Weather status in Jizan
This section introduced statistics on crime and studied its variation with other statistics to discover possible relationships. As we explain in this chapter, the crime rate is significantly higher in Riyadh than in most other regions. We also analyzed that there is a significant increase in crime in August 2018, as compared to other months. We also saw that crimes related to “Use of conventional military force” and “Arrest, detain or charge with legal action” had a higher frequency than other crimes. We also say that SA’s count rate as both actor one and actor 2 was higher than in other countries. There was also a significantly high count between Yamen and Saudi Arabia as actors. We also found that the crime rate was reduced with an increase in literacy rate across the three regions of Riyadh, Jizan, and Makkah.
In this paper, we investigated the influencing factors that impact crime rates in Saudi Arabia. We observed that both months and regions of Saudi Arabia had most of the events that occurred. The dataset that we extracted has been pre-processed and prepared to be ready for machine learning. Many machine learning classifiers algorithms have been used and training and measure each’s accuracy; then, we apply some techniques to improve it. We conclude that the Naive Bays is the most suitable for crime classification experiments, and the deep learning needs to have much more data set to give better classifier and high accuracy.
It seems impossible to predict crime, but it can be prevented if the time in which crime happens is known. Our research can be improved in different ways. In the future, we plan to use it with a risk terrain modeling technique to enhance crime prediction. Besides, planning to expand the experience to become not locally and collecting much more crimes dataset from Arabic Gulf countries with more features like education, populations, and the weather. Then, analyzing those data to make a prediction of which areas are most at risk and which are safer. Moreover, many advanced machine learning algorithms will be implemented, such as Artificial Neural Network and Deep Learning, to achieve a more balanced approach towards criminal activities.
Acknowledgement: We would like to thank the Deanship of Scientific Research, Qassim University for funding the publication of this project.
Funding Statement: This research is funded by the Deanship of Scientific Research, Qassim University.
Conflicts of Interest:The authors declare that they have no conflicts of interest to report regarding the present study.
1. A. Chalfin, B. Hansen, J. Lerner and L. Parker. (2019). “Reducing crime through environmental design: Evidence from a randomized experiment of street lighting in New York city,” NBER Working Paper, vol. 25798. [Google Scholar]
2. S. Curtis-Ham, D. K. Walton and D. Walton. (2017). “Mapping crime harm and priority locations in New Zealand: A comparison of spatial analysis methods,” Elsevier, vol. 86, pp. 245–254. [Google Scholar]
3. A. Syed, M. N. Halgamuge, A. Gupta and A. Mohammad. (2016). “A comparative study of classification algorithms using data mining: Crime and accidents in Denver city the USA,” International Journal of Advanced Computer Science and Applications, vol. 7, no. 7, pp. 374–381. [Google Scholar]
4. A. Stec and D. Klabjan, “Forecasting crime with deep learning. arXiv preprint arXiv:1806.01486, 2018. [Google Scholar]
5. Y. Xu, C. Fu, E. Kennedy, S. Jiang and S. Owusu-Agyemang. (2018). “The impact of street lights on spatial-temporal patterns of crime in Detroit, Michigan,” Cities, vol. 79, pp. 45–52. [Google Scholar]
6. S. F. Messner and R. J. Sampson. (1991). “The sex ratio, family disruption, and rates of violent crime: Die paradox of demographic structure,” Social Forces, vol. 69, no. 3, pp. 693. [Google Scholar]
7. A. Tseloni. (2007). “Fear of crime, perceived disorders and property crime: A multivariate analysis at the area level,” Imagination for Crime Prevention: Essays in Honour of Ken Pease, vol. 21, pp. 163. [Google Scholar]
8. S. Raphael and R. Winter-Ebmer. (2001). “Identifying the effect of unemployment on crime,” Journal of Law and Economics, vol. 44, no. 1, pp. 259–283. [Google Scholar]
9. A. Alsaqabi, F. Aldhubayi and S. Albahli. (2019). “Using machine learning for prediction of factors affecting crimes in Saudi Arabia,” in ACM Int. Conf. Proc. Series, Hong Kong, pp. 57–62. [Google Scholar]
10. Y. Luo, B. S. Kristal, C. Schweikert and D. F. Hsu. (2017). “Combining multiple algorithms for portfolio management using combinatorial fusion,” in Proc. of 2017 IEEE 16th Int. Conf. on Cognitive Informatics and Cognitive Computing, New York, pp. 361–366. [Google Scholar]
11. H. K. R. Toppireddy, B. Saini and G. Mahajan. (2018). “Crime prediction & monitoring framework based on spatial analysis,” Procedia Computer Science, vol. 132, pp. 696–705. [Google Scholar]
12. J. Tiihonen, P. Halonen, L. Tiihonen, H. Kautiainen, M. Storvik et al. (2017). , “The association of ambient temperature and violent crime,” Scientific Reports, vol. 7, no. 1, 1235367. [Google Scholar]
13. V. Ingilevich and S. Ivanov. (2018). “Crime rate prediction in the urban environment using social factors,” in Procedia Computer Science, vol. 136, pp. 472–478. [Google Scholar]
14. L. G. A. Alves, H. V. Ribeiro and F. A. Rodrigues. (2018). “Crime prediction through urban metrics and statistical learning,” Physica A: Statistical Mechanics and its Applications, vol. 505, pp. 435–443. [Google Scholar]
15. J. Q. Wilson and G. L. Kelling. (1982). “The Atlantic Online | March 1982 | Broken Windows | James Q. Wilson and George L. Kelling,” [Oline]. Available: illinois-online.org. [Google Scholar]
16. D. Asir, S. Appavu and E. Jebamalar. (2016). “Literature review on feature selection methods for high-dimensional data,” International Journal of Computer Applications, vol. 136, no. 1, pp. 9–17. [Google Scholar]
17. A. Tefas and I. Pitas. (2016). “Principal component analysis,” in Intelligent Systems, London. [Google Scholar]
18. T. D. Savitsky and D. F. McCaffrey. (2014). “Bayesian hierarchical multivariate formulation with factor analysis for nested ordinal data,” Psychometrika, vol. 79, no. 2, pp. 275–302. [Google Scholar]
19. K. Leetaru and P. A. Schrodt. (2013). “GDELT: Global data on events, location and tone, 1979–2012,” in Annual MTG of the Int. Studies Association, San Francisco, pp. 1979–2012. [Google Scholar]
20. M. Arif and G. Wang. (2019). “Fast curvelet transform through genetic algorithm for multimodal medical image fusion,” Soft Computing, vol. 24, no. 3, pp. 1815–1836. [Google Scholar]
21. O. Geman, I. Chiuchisan, I. Ungurean, M. Hagan and M. Arif. (2018). “Ubiquitous healthcare system based on the sensors network and Android internet of things gateway,” in 2018 IEEE SmartWorld, Ubiquitous Intelligence & Computing, Advanced & Trusted Computing, Scalable Computing & Communications, Cloud & Big Data Computing, Internet of People and Smart City Innovation, UK, pp. 1390–1395. [Google Scholar]
22. N. Settouti, M. E. A. Bechar and M. A. Chikh. (2016). “Statistical comparisons of the top 10 algorithms in data mining for classification task,” International Journal of Interactive Multimedia and Artificial Intelligence, vol. 4, no. 1, pp. 46. [Google Scholar]
23. I. T. Joseph and S. I. Thanakumar. (2019). “Survey of data mining algorithm’s for intelligent computing system,” Journal of Trends in Computer Science and Smart technology, vol. 1, no. 1, pp. 14–24.
24. Witten, H. Ian and E. Frank. (2016). Data Mining: Practical Machine Learning Tools and Techniques. Burlington, MA: Morgan Kaufmann. [Google Scholar]
 | This work is licensed under a Creative Commons Attribution 4.0 International License, which permits unrestricted use, distribution, and reproduction in any medium, provided the original work is properly cited. |