DOI:10.32604/cmc.2021.014101
| Computers, Materials & Continua DOI:10.32604/cmc.2021.014101 | |
| Article |
A New Class of L-Moments Based Calibration Variance Estimators
1Department of Mathematics and Statistics, International Islamic University, Islamabad, 46000, Pakistan
2Department of Mathematics and Statistics, PMAS-Arid Agriculture University, Rawalpindi, 46300, Pakistan
3Department of Mathematics, King Khalid University, Abha, 62529, Saudi Arabia
4Statistical Research and Studies Support Unit, King Khalid University, Abha, 62529, Saudi Arabia
5Department of Mathematics, College of Science, Mustansiriyah University, Baghdad, 10011, Iraq
*Corresponding Author: Usman Shahzad. Email: usman.stat@yahoo.com
Received: 31 August 2020; Accepted: 19 October 2020
Abstract: Variance is one of the most important measures of descriptive statistics and commonly used for statistical analysis. The traditional second-order central moment based variance estimation is a widely utilized methodology. However, traditional variance estimator is highly affected in the presence of extreme values. So this paper initially, proposes two classes of calibration estimators based on an adaptation of the estimators recently proposed by Koyuncu and then presents a new class of L-Moments based calibration variance estimators utilizing L-Moments characteristics (L-location, L-scale, L-CV) and auxiliary information. It is demonstrated that the proposed L-Moments based calibration variance estimators are more efficient than adapted ones. Artificial data is considered for assessing the performance of the proposed estimators. We also demonstrated an application related to apple fruit for purposes of the article. Using artificial and real data sets, percentage relative efficiency (PRE) of the proposed class of estimators with respect to adapted ones are calculated. The PRE results indicate to the superiority of the proposed class over adapted ones in the presence of extreme values. In this manner, the proposed class of estimators could be applied over an expansive range of survey sampling whenever auxiliary information is available in the presence of extreme values.
Keywords: L-moments; variance estimation; calibration approach; stratified random sampling
All around, it was considered that the utilization of auxiliary knowledge (information) in the test review (sampling survey) configuration brings about effective estimators of population parameters. The literature on test review portrays an incredible assortment of strategies for utilizing auxiliary information. Ratio technique is the acceptable delineation in this specific situation, see [1–5]. In some cases when some population parameters, as the mean, coefficient of variation, the standard deviation of the auxiliary variable have been known many authors including [6,7] imagined an enormous number of improved estimators for the population mean of the variate of interest. This urge researchers to utilize the characteristics of the auxiliary variable (mean, coefficient of variation, standard deviation, median and quartiles) in order to improve the population variance estimate of the study variable.
Variations are available in our life. For example, a doctor needs a full comprehension of varieties in the level of human circulatory strain, internal heat level, and heartbeat rate for satisfactory medicine. A maker needs steady information on the degree of varieties in individuals’ response to his item to have the option to realize whether to decrease or increment his cost or improve the nature of his item. An agriculturist requests a sufficient comprehension of the varieties in climatic factors particularly all around (or from time to time) to have the option to anticipate when, where, and how to plant his harvest. A lot of circumstances can be experienced where the population variance estimate of the study variable assumes a huge significance. Consequently, different authors, for example, [8,9] have given their consideration to the improved estimation of population variance of the study variable with the utilization of auxiliary information. However, all these quoted estimators based on traditional second-order central moment based variance estimation which is highly affected in presence of extreme values. So, in the current article, we have characterized a class of estimators for the population variance of the study variable based on L-Moments and calibration approach that is less effective to extreme values.
An experimental investigation utilizing apple production data sets was led, and we got good outcomes, numerically. The analysis of apple fruit production has great importance in food sciences. In view of the applications here, this study well provide a significant premise for future food sciences, medical researches, and many engineering applications.
The rest of the article is arranged in the following major sections. In Section 2, we present some classes of calibration based variance estimators according to the traditional second-order central moment. In Section 3, we provide L-Moments characteristics (L-location, L-scale, L-CV) and, propose a new class of calibration based variance estimators under stratified random sampling scheme. Results discussion is documented in Section 4. Finally, some conclusions are given in Section 5.
2 Adapted Classes of Estimators
Consider a finite population  of size N. Suppose
  be the study and auxiliary variables associated with
  . Let
. Let  is stratified into L strata with the hth stratum containing Nh units, where
  , such that
  . A simple random sample (srs) of size nh is drawn without replacement from the hth stratum such that
  . Further,
  are the observed values of Y and X in hth stratum, where
  and
and  . In light of this stratified sampling design, taking motivation from [1], we present the first calibrated class of variance estimators as given below

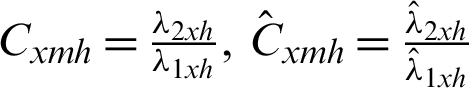
where  is the sample variance of the study variable in hth stratum. Further,
  are calibrated weights that are selected in such a way that the sum of the chi-square type distance measure

is minimum, subject to the calibration constraints


Note that  denoting the traditional stratum weight,
  are the sample and population characteristics of the auxiliary variable in hth stratum and,
  are appropriately selected weights that express the form of the estimator. Some suitable choices for
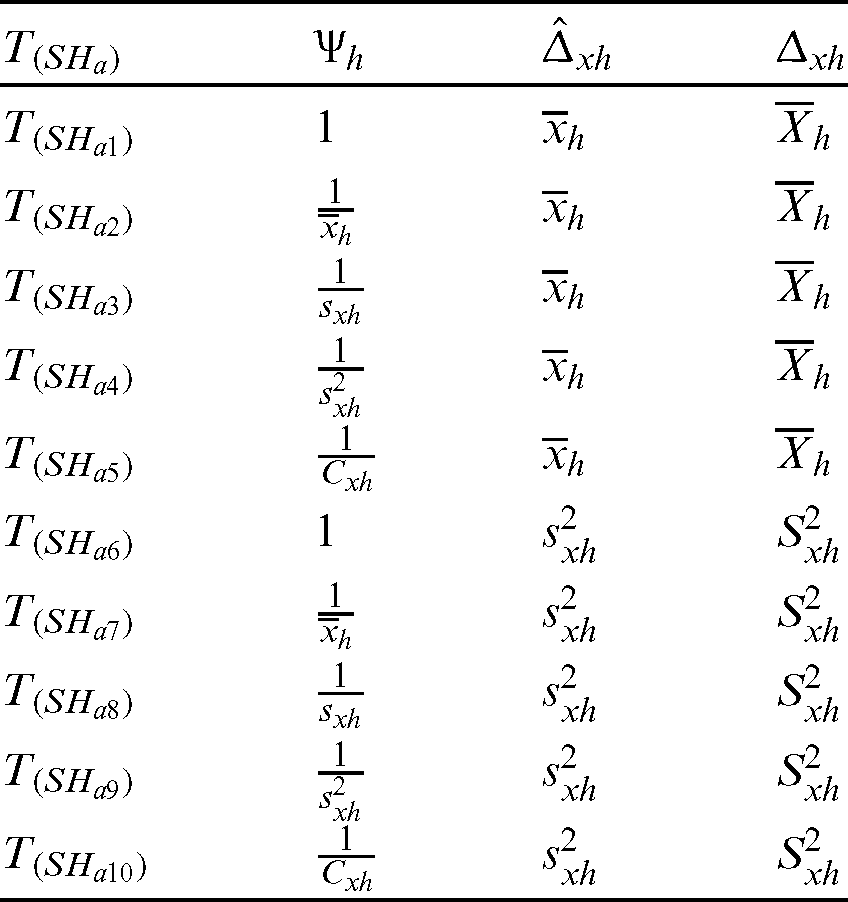
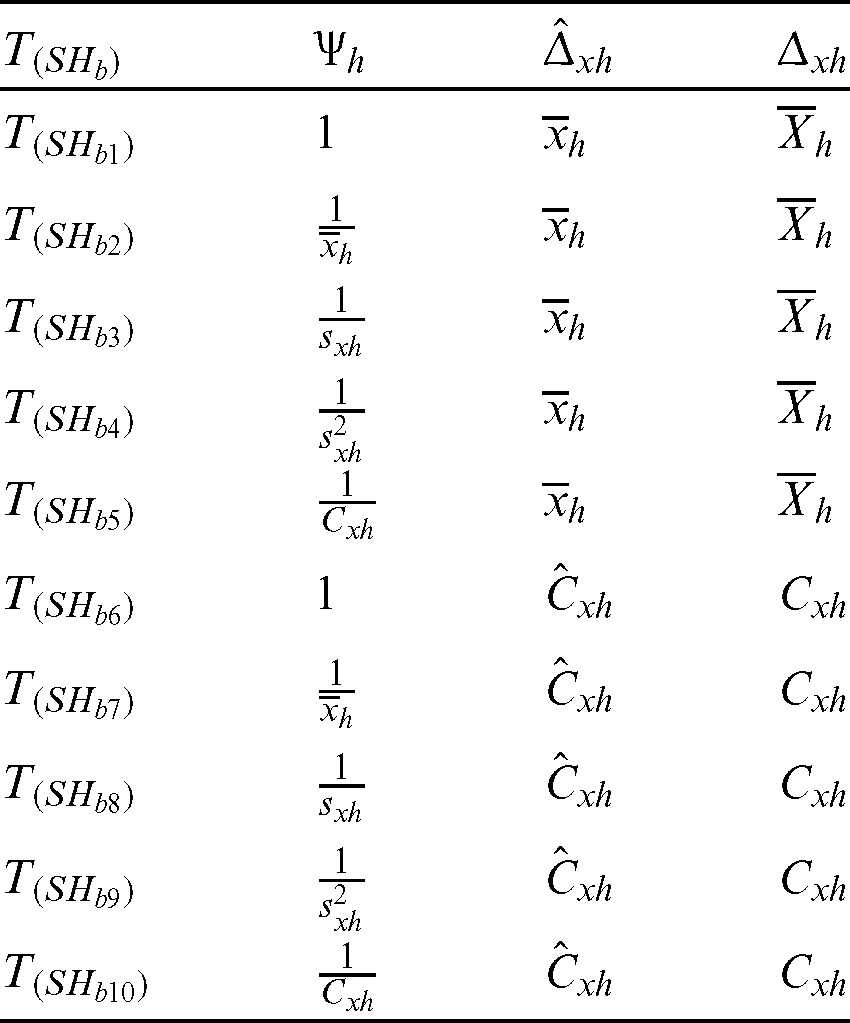
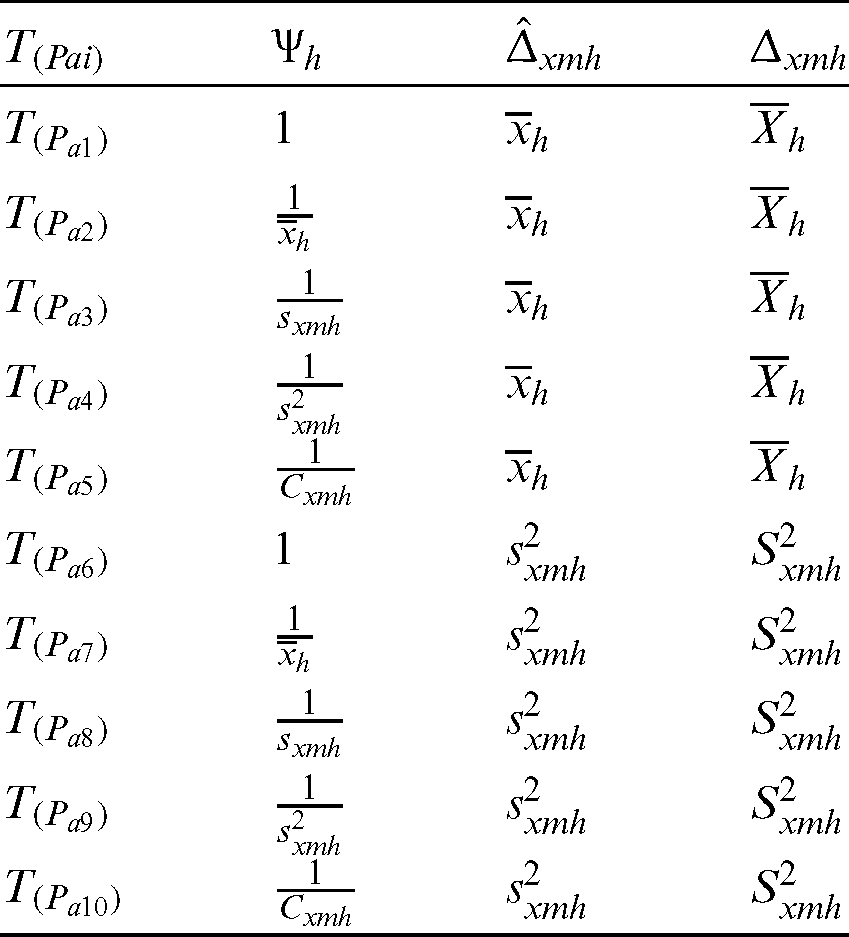
  are provided in Tab. 1.
Table 1: First adapted family of estimators
Minimization of Eq. (2), subject to the calibration constraints set out in Eqs. (3) and (4), the optimum weights shall be calculated by
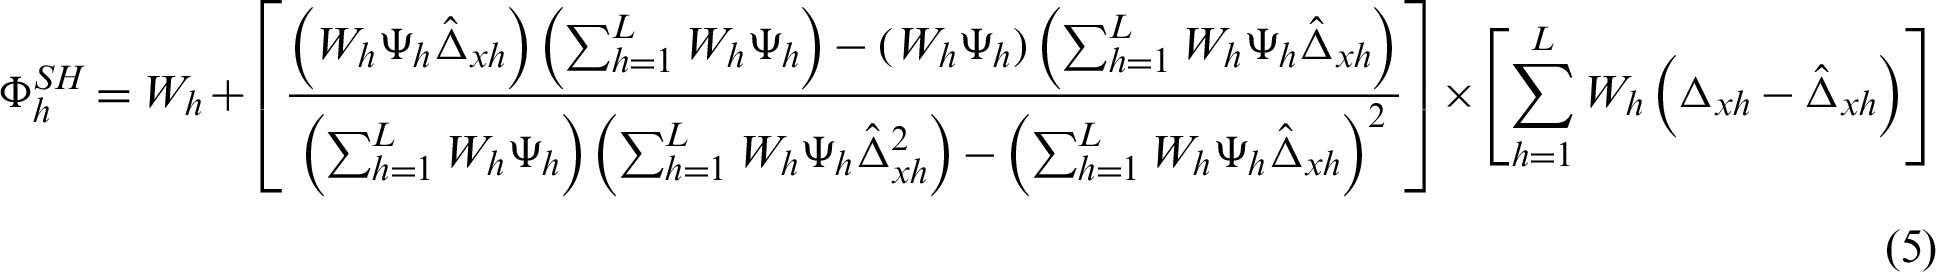
and thus

where

The whole class 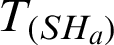 is provided in Tab. 1.
Taking motivation from [10], we adapt the following calibration estimator of the population variance given by

subject to the following constraints


Minimization of Eq. (8), subject to the calibration constraints set out in Eqs. (9) and (10), the optimum weights shall be calculated by

where
and thus

where
The whole class  is provided in Tab. 2.
Table 2: Second adapted family of estimators
3 L-Moments and Propose Class of Estimators
The occurrence of extreme values, for example, in agriculture engineering, hydrology, food sciences. Meteorology and climatology, among others, observed nowadays in various parts of the world may influence adversely on human culture. Therefore, it is essential to appraise the accurate measurements of the numerical data in the presence of extreme values. As we have depicted before that variance is one of the significant measures of data description. Variance estimation dependent on traditional moments which is profoundly influenced by extreme values. Hence, a quantifiable procedure is necessitated that will catch the extreme values in the assessment, however less influenced by their quality. An elective strategy that has the vital ability to settle this issue is the L-Moments. Because L-Moments are more robust than traditional moments in the presence of extreme values [11].
The general form of the population L-Moments for the auxiliary variable with respect to hth stratum are as given below
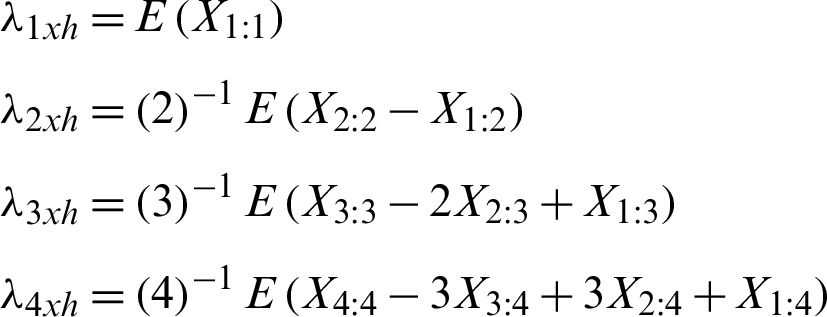
Corresponding to these, we can write the sample based L-Moments such as  ,
,  ,
,  ,
,  , based on sample observations, respectively. Similarly, we can write the general form of the L-Moments for study variable by replacing
  with
with  . For more details regarding L-Moments, interested readers may refer to [12]. Some notations for upcoming proposed work in light of L-Moments with respect to
  stratum are
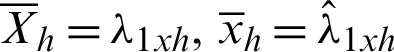 are the population and sample means (L-location) of auxiliary variable based on L-Moments.
 are the population and sample means (L-location) of study variable based on L-Moments.
 are the population and sample variance of auxiliary variable based on L-Moments.
 are the population and sample variance of study variable based on L-Moments.
 are the population and sample standard deviation (L-scale) of auxiliary variable based on L-Moments.
 are the population and sample standard deviation (L-scale) of study variable based on L-Moments.
 are the population and sample coefficient of variation (L-CV) of the auxiliary variable based on L-Moments.
 are the population and sample coefficient of variation (L-CV) of the study variable based on L-Moments.
The calibration estimation is a method of adjusting the original design weights to expand the accuracy of estimates by utilizing auxiliary information. Calibration based estimators utilize calibrated/adjusted weights that are planned to minimize a given measure of distance to the original weights while fulfilling a group of constraints with the auxiliary information. The authors in [13] are pioneer of calibration estimation. After that much of the work has been done in this filed such as [1,10,14]. These results motivated us to define the following calibrated estimator of variance as

where  is the sample variance of the study variable in hth stratum. Further,
  are calibrated weights that are selected in such a way that the sum of the chi-square type distance measure

is minimum, subject to the calibration constraints


Note that  denotes the traditional stratum weight,
  are the sample and population characteristics of the auxiliary variable in
  stratum and,
  are appropriately selected weights that express the form of the estimator. In most situations,
  . Minimization of Eq. (13), subject to the calibration constraints set out in Eqs. (14) and (15), the optimum weights shall be calculated by
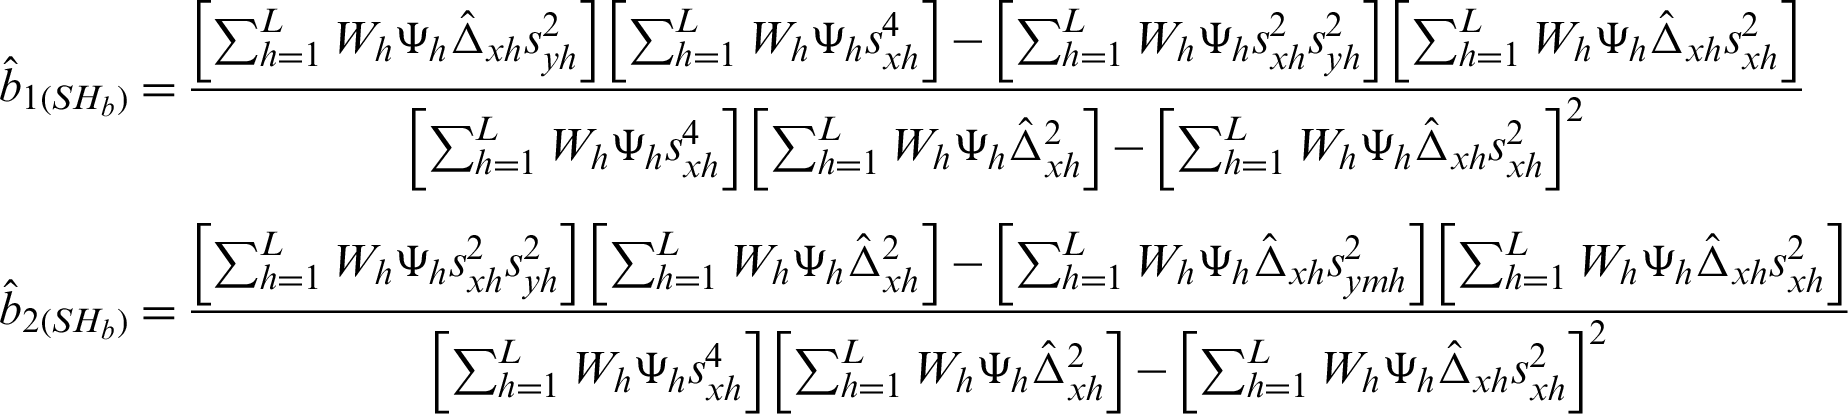
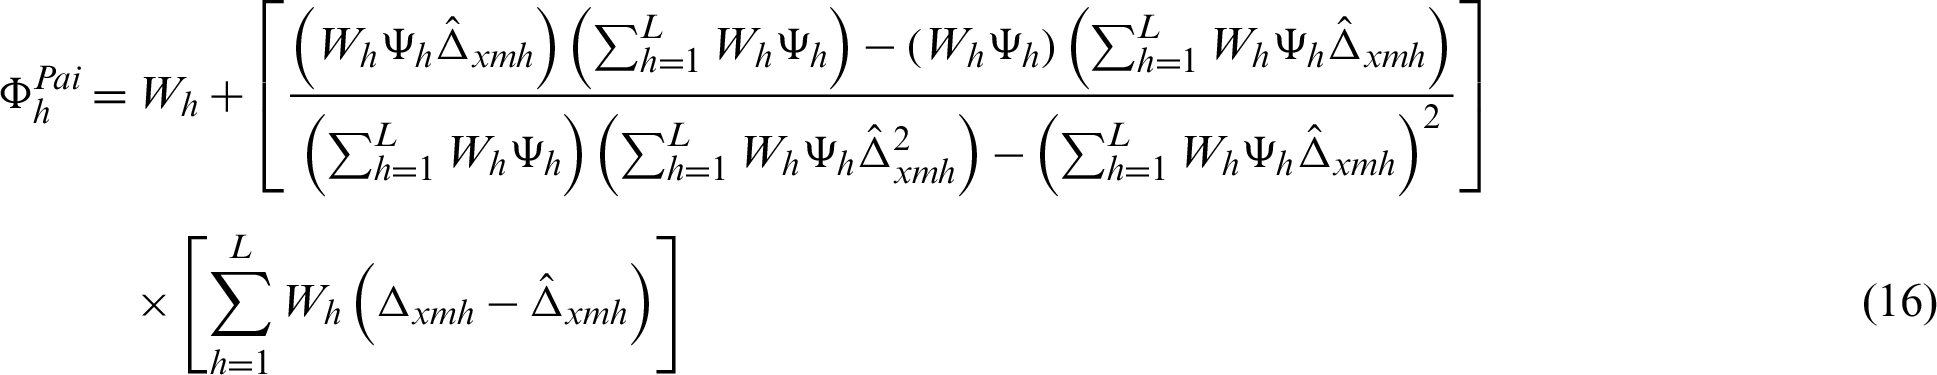
and thus

where

The whole class  is provided in Tab. 3.
Table 3: Propose class of estimators
In this section, the performance of the suggested estimators is investigated through a simulation study.
The simulation design is organized as follows: A random variable Xh and random variable Yh are defined as follows:

where
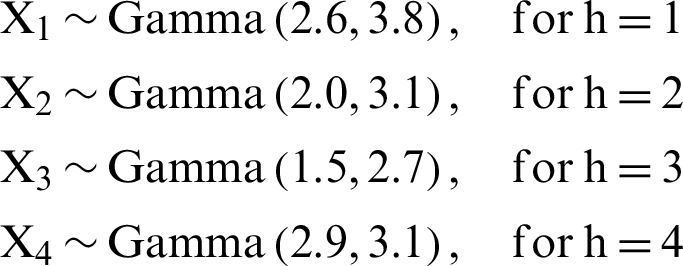
Further, we assume that p = 1.6, v = 5, R = 2 and  has a standard normal distribution in Eq. (19). We consider the population of size
  for hth stratum. The overall sample of size
  is selected for purposes of the article. Using equal allocation of a sample of size 100 is selected from
  stratum. A scatter plot for each stratum is provided (see Figs. 1–4). These figures clearly show the presence of extreme values and hence suitable for our proposed estimators.
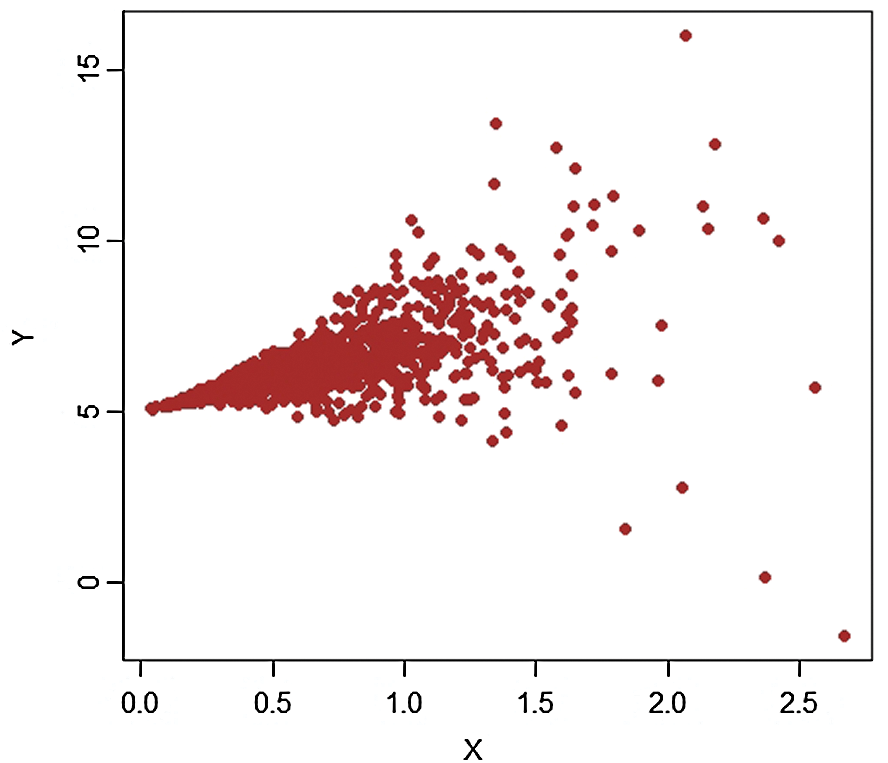
Figure 1: Pop-1, 
Figure 2: Pop-1, 
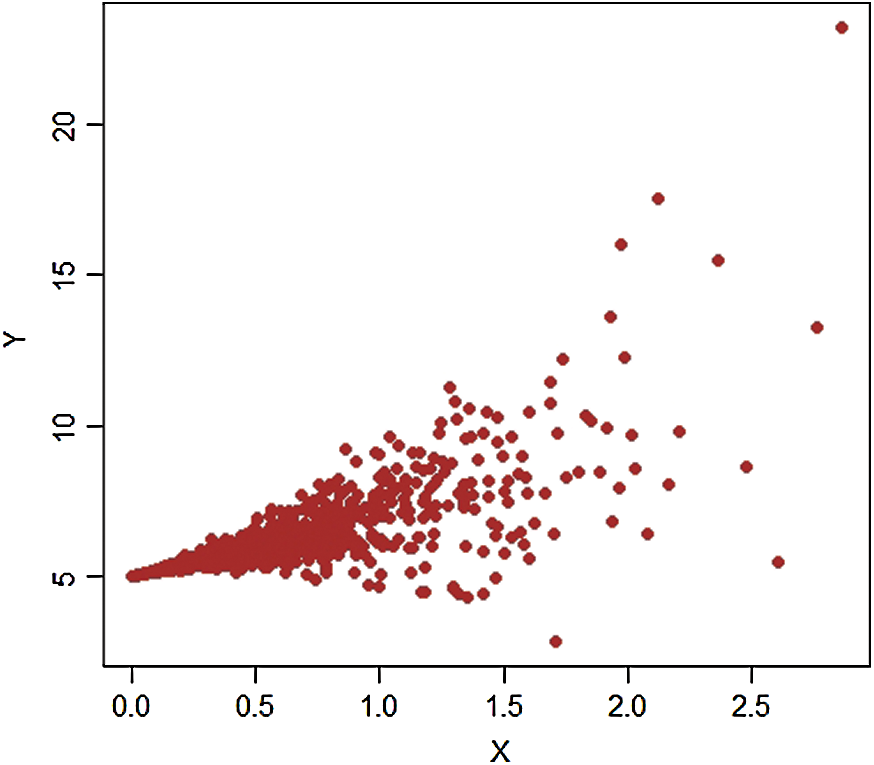
Figure 3: Pop-1, 
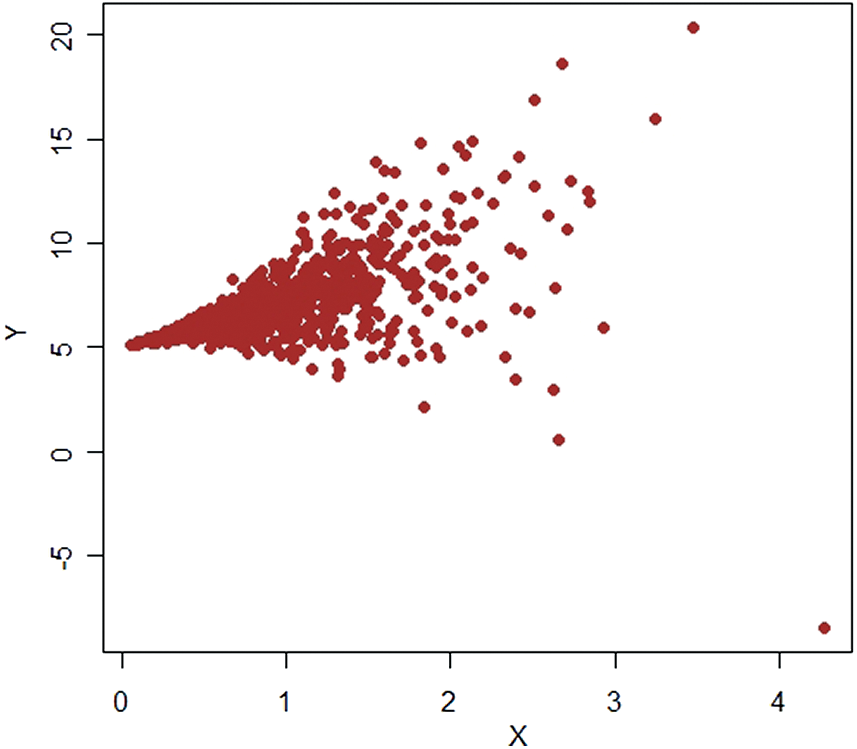
Figure 4: Pop-1, 
The steps of simulation study can be carried out as:
Step-1: A sample of size nh is selected through SRSWOR from the hth stratum.
Step-2: Using Step-1, we find the value of variance estimate (say)  , where
Step-3: The Step-1 and Step-2 are replicated with K = 5000 times. Thus,  are obtained.
Step-4: The mean square error (MSE) of the estimators is computed as 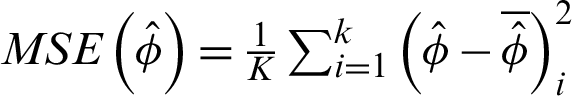 .
.
Step-5: The PRE is computed as  100 and the results are provided in Tabs. 4 and 5.
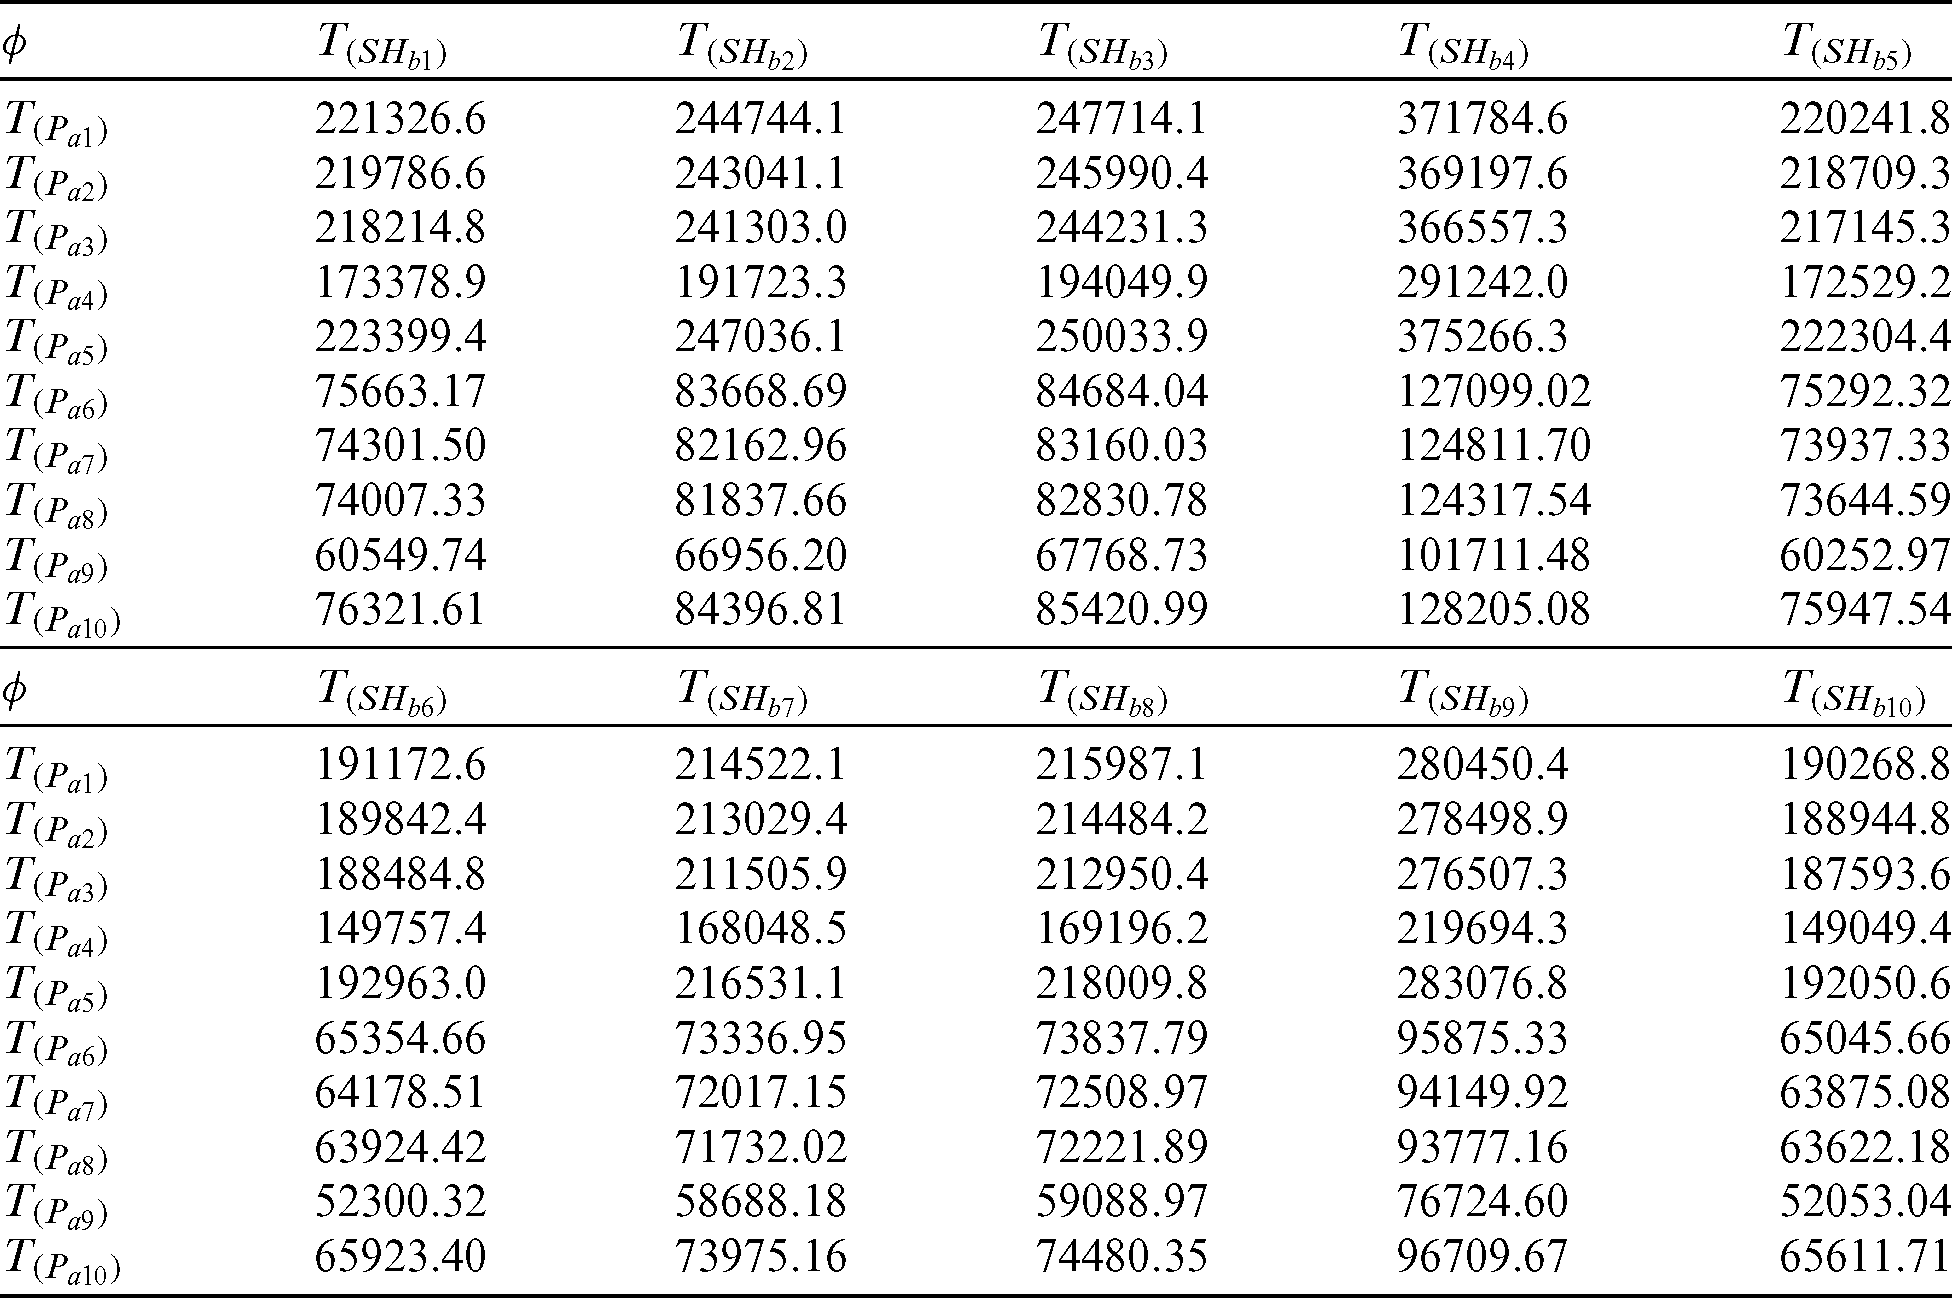
Table 4: PRE of proposed family with respect to  for artificial data
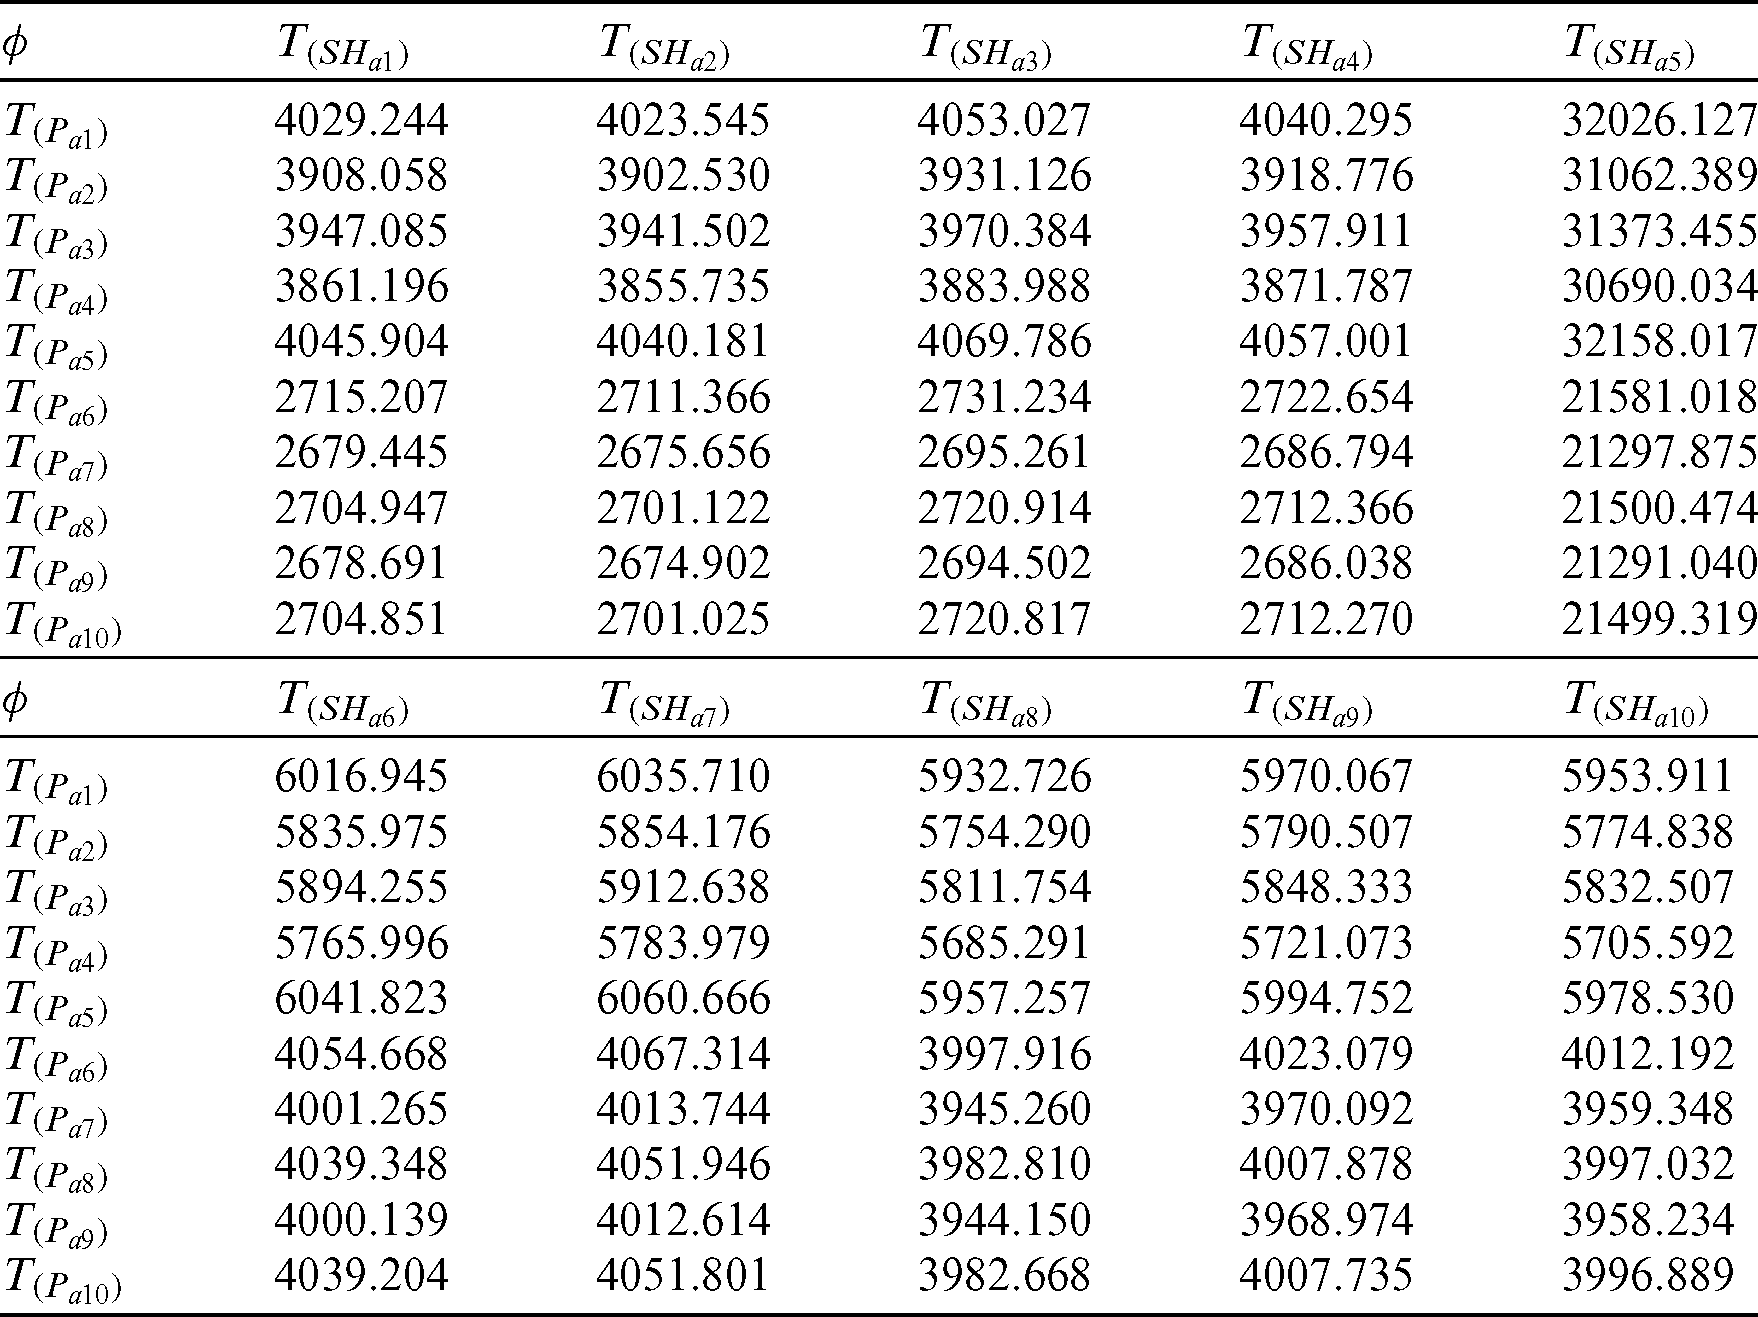
Table 5: PRE of proposed family with respect to  for artificial data
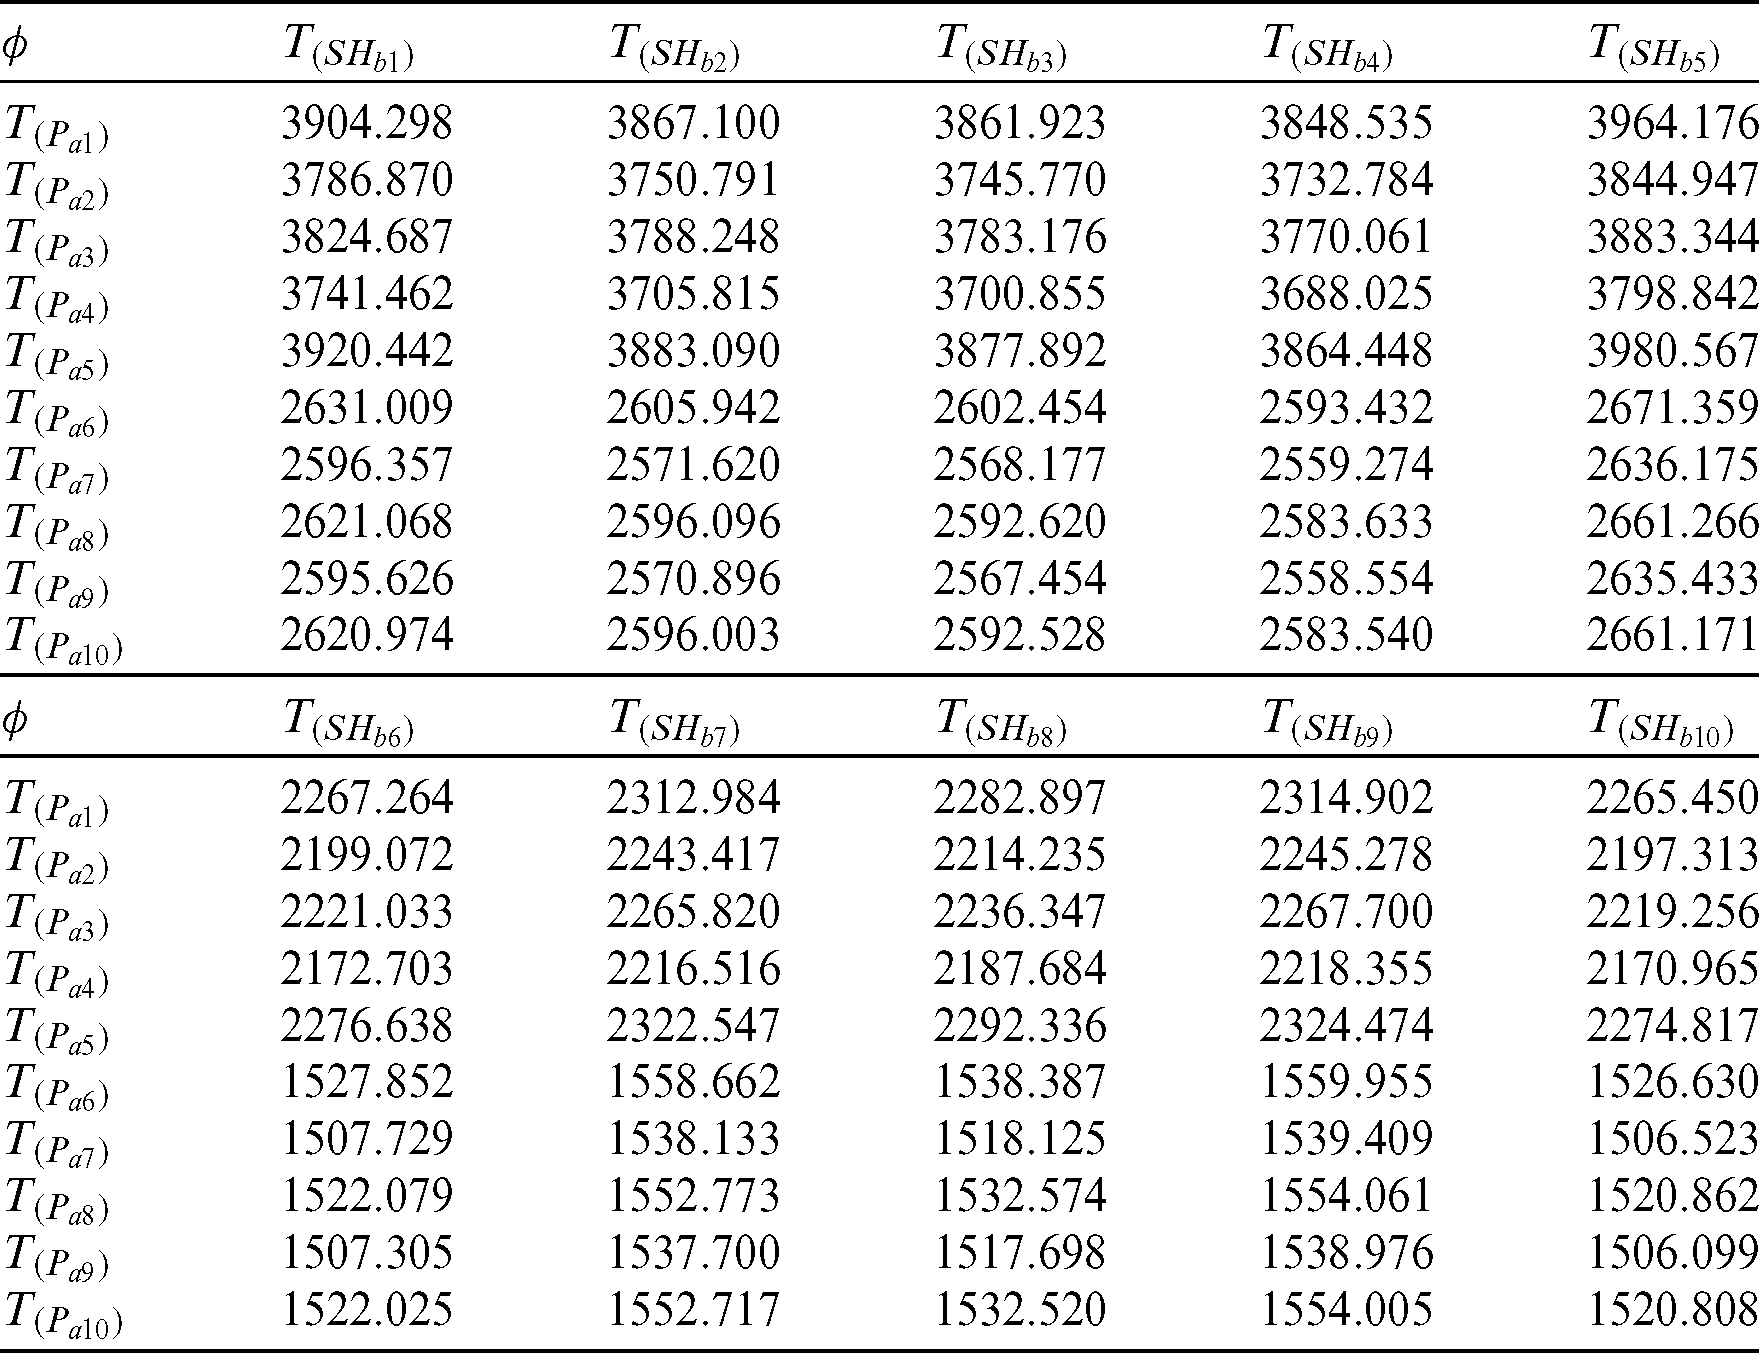
To illustrate the behavior of the proposed estimators in this article, we consider a data set of apple fruit, used by [15], where
 ,
,
 .
.
It is worth mentioning that we consider 477 villages in 4 strata, respectively (like 1: Marmarian, 2: Agean, 3: Mediterranean, and 4: Central Anatolia) in 1999. We draw a scatter plot for each stratum (see Figs. 5–8). The scatter plot of each stratum representing extreme values. Some important characteristics of the data are provided in Tab. 6. The PRE of the estimators is calculated using defined five steps and available in Tabs. 7 and 8.
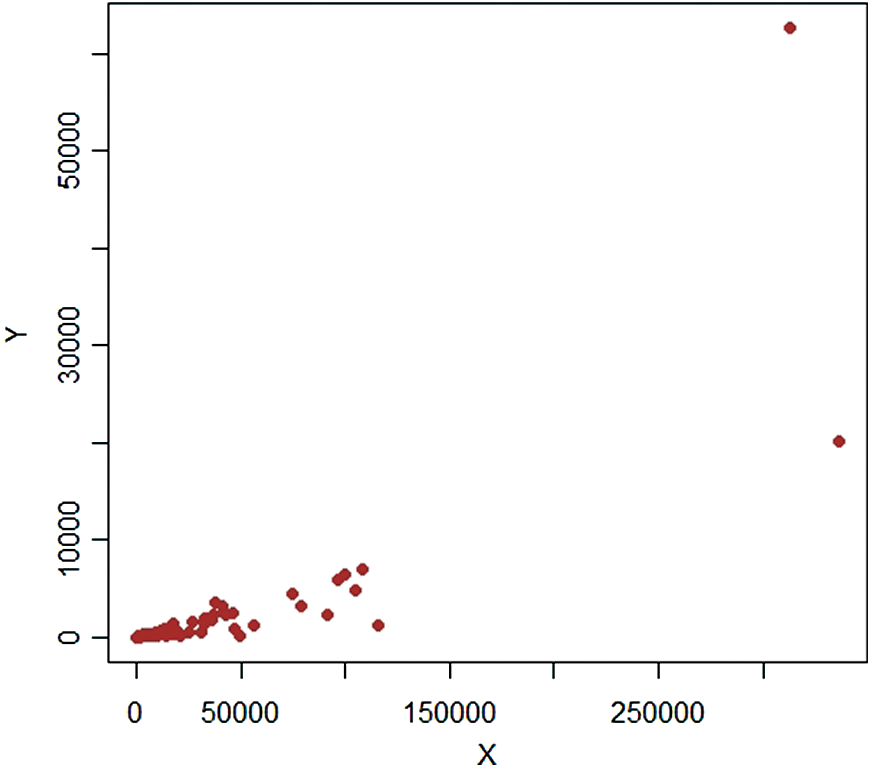
Figure 5: Pop-2, 
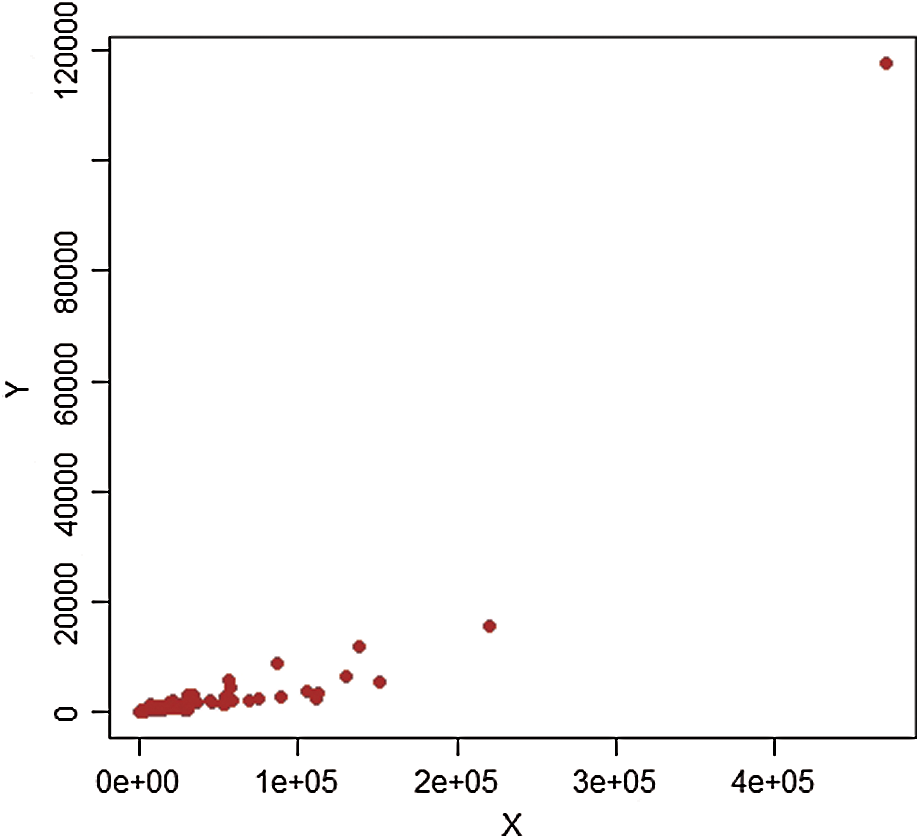
Figure 6: Pop-2, 
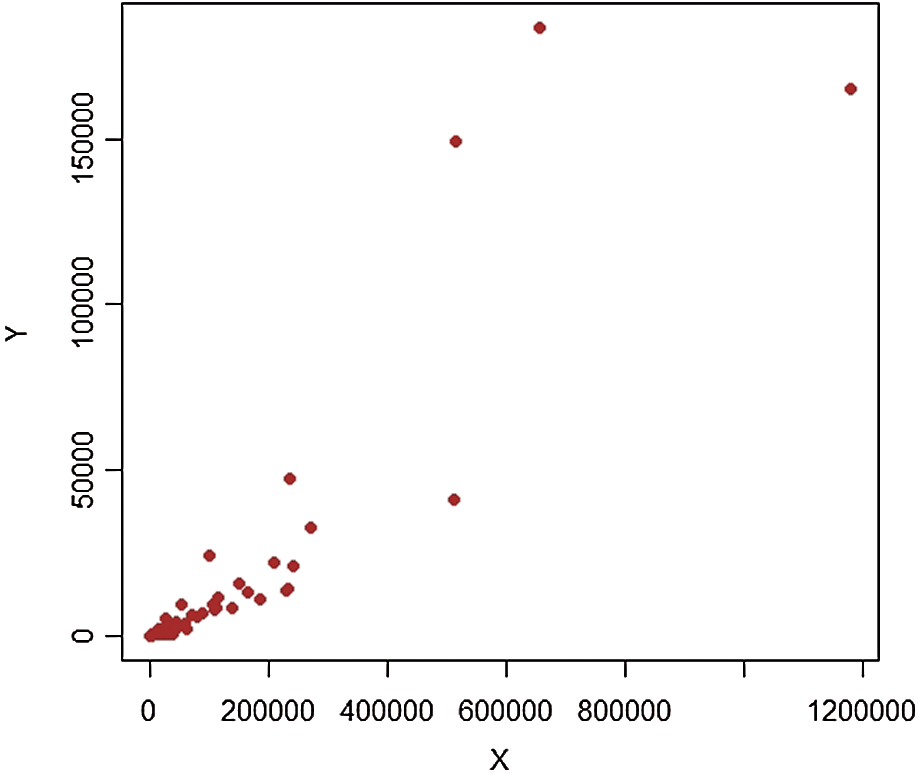
Figure 7: Pop-2, 
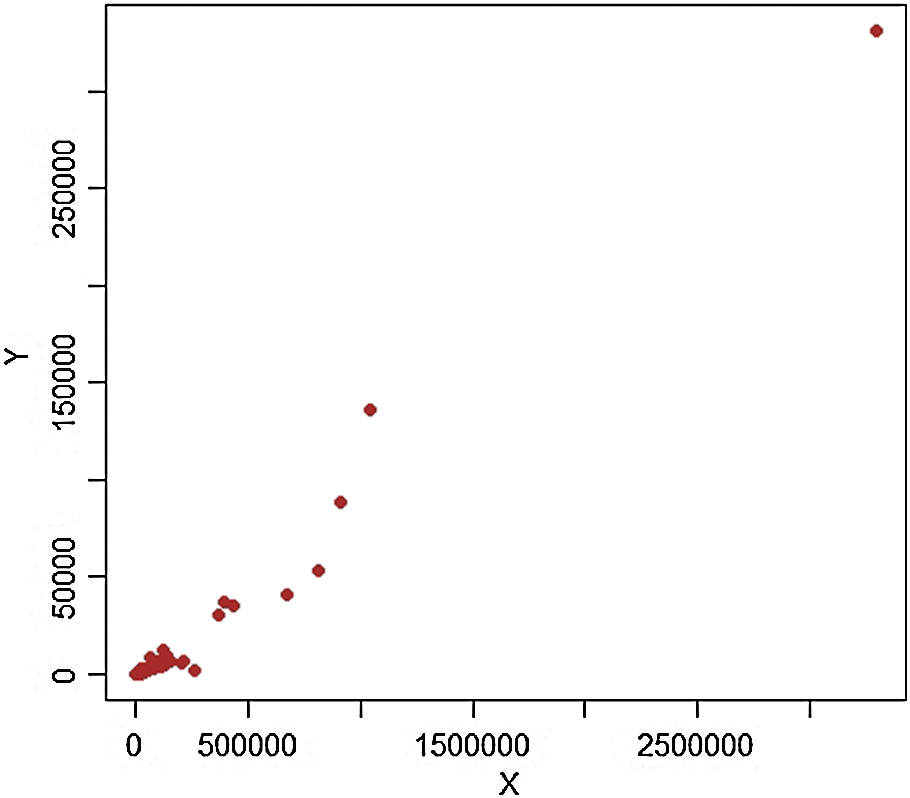
Figure 8: Pop-2, 
Table 6: Characteristics of apple data
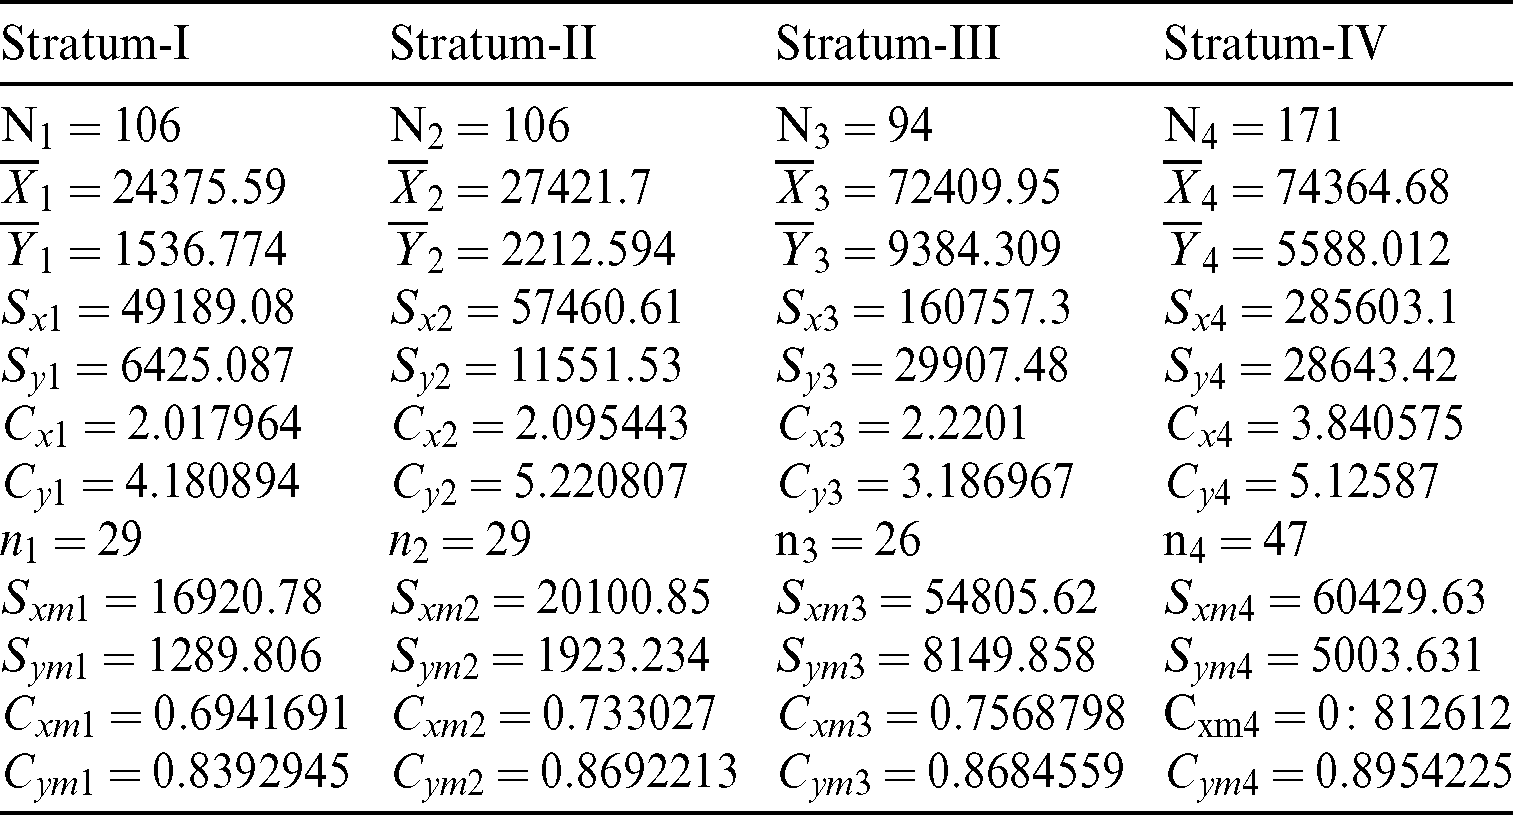
Table 7: PRE of proposed family with respect to  for real life data
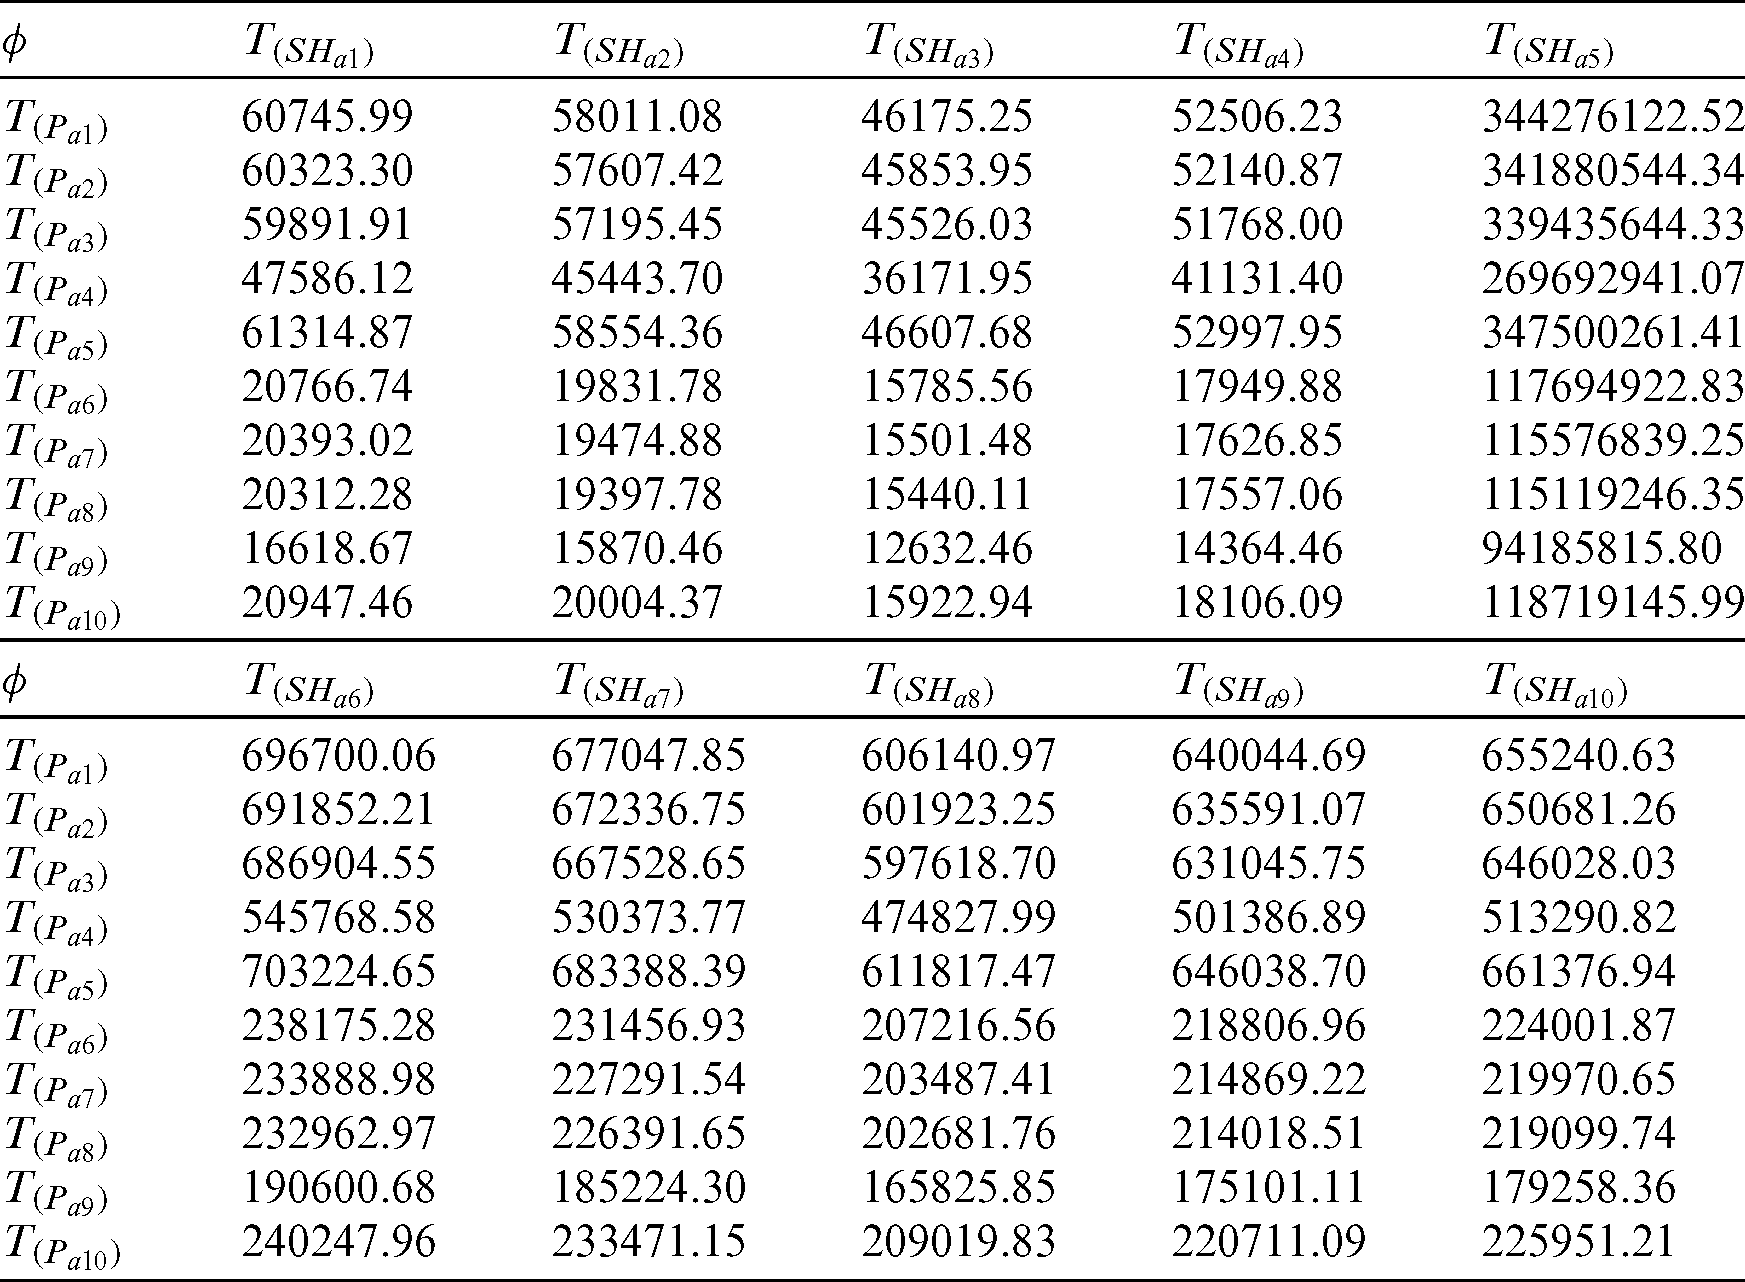
Table 8: PRE of proposed family with respect to  for real life data
However, this investigation can assist with revealing insight into the value of the proposed class. Actually, it gives a reasonable sign that more mind-boggling options than the traditional moments based variance estimators can be helpful when the data is contaminated with extreme values. Because each PRE result of the proposed estimator is greater than 100. Which means that the proposed class beats the adapted ones thoroughly. Based on real and artificial numerical illustration, we feel confident that the same could hold in other contexts of food sciences and agricultural engineering.
Usually, in test reviews, it uses traditional moments-based techniques to obtain improved designs and more accurate estimators. However, in the presence of extreme values, traditional moments-based techniques may provide misleading results. In this paper, a calibration approach is utilized and developed two adapted families of estimators. Then a new class of L-Moments based variance estimators has been proposed which provides a better estimate of variance in the presence of extreme values. The performance of adapted and proposed estimators has been assessed through artificial and apple fruit data set. Based on satisfactory results, we recommend survey practitioners utilize the proposed class of variance estimators in variou environmental researches.
Acknowledgement: The authors are thankful to the reviewers for their valuable suggestions.
Funding Statement: The authors are grateful to the Deanship of Scientific Research at King Khalid University, Kingdom of Saudi Arabia for funding this study through the research groups program under project number R.G.P.2/67/41. Ibrahim Mufrah Almanjahie received the grant.
Conflicts of Interest: The authors declare that they have no conflicts of interest to report regarding the present study.
1 N. Koyuncu. (2018). “Calibration estimator of population mean under stratified ranked set sampling design,” Communications in Statistics-Theory and Methods, vol. 47, no. 23, pp. 5845–5853. [Google Scholar]
2 U. Shahzad, P. F. Perri and M. Hanif. (2019). “A new class of ratio-type estimators for improving mean estimation of nonsensitive and sensitive variables by using supplementary information,” Communications in Statistics–Simulation and Computation, vol. 48, no. 9, pp. 2566–2585.
3 T. Zaman and H. Bulut. (2019). “Modified ratio estimators using robust regression methods,” Communications in Statistics-Theory and Methods, vol. 48, no. 8, pp. 2039–2048.
4 U. Shahzad, N. H. Al-Noor, M. Hanif, I. Sajjad and A. M. Muhammad. (2020). “Imputation based mean estimators in case of missing data utilizing robust regression and variance-covariance matrices,” Communications in Statistics–Simulation and Computation, vol. 3, no. 2, pp. 1–20.
5 M. Subzar, A. I. Al-Omari and A. R. A. Alanzi. (2020). “The robust regression methods for estimating of finite population mean based on SRSWOR in case of outliers,” Computers, Materials & Continua, vol. 65, no. 1, pp. 125–138. [Google Scholar]
6 T. Zaman and E. Toksoy. (2019). “Improvement in estimating the population mean in simple random sampling using information on two auxiliary attributes and numerical application in agricultural engineering,” Fresenius Environmental Bulletin, vol. 28, no. 6, pp. 4584–4590. [Google Scholar]
7 T. Zaman. (2019). “Improvement of modified ratio estimators using robust regression methods,” Applied Mathematics and Computation, vol. 348, pp. 627–631. [Google Scholar]
8 M. Abid, S. Ahmed, M. Tahir, N. Zafar and M. Riaz. (2019). “Improved ratio estimators of variance based on robust measures,” Scientia Iranica, vol. 26, no. 4, pp. 2484–2494. [Google Scholar]
9 F. Naz, M. Abid, T. Nawaz and T. Pang. (2019). “Enhancing the efficiency of the ratio-type estimators of population variance with a blend of information on robust location measures,” Scientia Iranica,. [Google Scholar]
10 D. S. Tracy, S. Singh and R. Arnab. (2003). “Note on calibration in stratified and double sampling,” Survey Methodology, vol. 29, no. 1, pp. 99–104. [Google Scholar]
11 J. R. Hosking. (1990). “L-moments: Analysis and estimation of distributions using linear combinations of order statistics,” Journal of the Royal Statistical Society: Series B(Methodological), vol. 52, no. 1, pp. 105–124. [Google Scholar]
12 J. R. M. Hosking and J. R. Wallis. (2005). “Regional Frequency Analysis: An Approach Based on L-Moments,” New York: Cambridge University Press. [Google Scholar]
13 J. C. Deville and C. E. Srndal. (1992). “Calibration estimators in survey sampling,” Journal of the American statistical Association, vol. 87, no. 418, pp. 376–382. [Google Scholar]
14 E. P. Clement. (2015). “Calibration approach separate ratio estimator for population mean in stratified sampling,” International Journal of Modern Mathematical Sciences, vol. 13, no. 4, pp. 377–384. [Google Scholar]
15 N. Koyuncu and C. Kadilar. (2009). “Ratio and product estimators in stratified random sampling,” Journal of Statistical Planning and Inference, vol. 139, no. 8, pp. 2552–2558. [Google Scholar]
 | This work is licensed under a Creative Commons Attribution 4.0 International License, which permits unrestricted use, distribution, and reproduction in any medium, provided the original work is properly cited. |