DOI:10.32604/cmc.2021.013314
| Computers, Materials & Continua DOI:10.32604/cmc.2021.013314 | |
| Article |
Multi-Level Fusion in Ultrasound for Cancer Detection Based on Uniform LBP Features
1Research Center of Duhok Polytechnic University, Duhok, Kurdistan Region, Iraq
2Presidency of Duhok Polytechnic University Duhok, Kurdistan Region, Iraq
3Center of Scientific Research and Development Nawroz University, Duhok, Kurdistan Region, Iraq
4School of Computing, University Teknologi Malaysia, Johor, Malaysia
*Corresponding Author: Dilovan Assad Zebari. Email: dilovan.majeed@nawroz.edu.krd
Received: 02 August 2020; Accepted: 27 October 2020
Abstract: Collective improvement in the acceptable or desirable accuracy level of breast cancer image-related pattern recognition using various schemes remains challenging. Despite the combination of multiple schemes to achieve superior ultrasound image pattern recognition by reducing the speckle noise, an enhanced technique is not achieved. The purpose of this study is to introduce a features-based fusion scheme based on enhancement uniform-Local Binary Pattern (LBP) and filtered noise reduction. To surmount the above limitations and achieve the aim of the study, a new descriptor that enhances the LBP features based on the new threshold has been proposed. This paper proposes a multi-level fusion scheme for the auto-classification of the static ultrasound images of breast cancer, which was attained in two stages. First, several images were generated from a single image using the pre-processing method. The median and Wiener filters were utilized to lessen the speckle noise and enhance the ultrasound image texture. This strategy allowed the extraction of a powerful feature by reducing the overlap between the benign and malignant image classes. Second, the fusion mechanism allowed the production of diverse features from different filtered images. The feasibility of using the LBP-based texture feature to categorize the ultrasound images was demonstrated. The effectiveness of the proposed scheme is tested on 250 ultrasound images comprising 100 and 150 benign and malignant images, respectively. The proposed method achieved very high accuracy (98%), sensitivity (98%), and specificity (99%). As a result, the fusion process that can help achieve a powerful decision based on different features produced from different filtered images improved the results of the new descriptor of LBP features in terms of accuracy, sensitivity, and specificity.
Keywords: Breast cancer; ultrasound image; local binary pattern; feature extraction; noise reduction filters; fusion
Cancer is considered an evolution and progressive growth of abnormal cells in human’s body. Breast cancer is one of the earliest cancers discovered in the world; its discovery was first documented in 1600 BC in Egypt [1]. Breast cancer is one of the leading causes of cancer-related death among women worldwide [2,3]. Tumors that are non-cancerous are known as benign tumors, whereas cancerous tumors are known as malignant tumors. Malignant tumors may be distributed to distant metastasis or neighboring tissues. Malignant tumors can be distributed to different body parts when cancerous cells enter the lymph system or the blood. A benign tumor, like a malignant tumor, is also caused by uncontrollable cell growth in the breast. Despite that benign and malignant tumors both develop uncontrollably, benign tumor only grows within the breast and does not threaten the lives of women [4].
To assist expert radiologists, many researchers have concentrated on medical image processing. Tumor discovery at an early stage plays a key role in breast cancer diagnosis and remediation. The malignancy of breast cancer should be detected at an early stage to reduce the mortality rate. Several medical imaging approaches have been used to identify breast cancer, such as magnetic resonance imaging (MRI), mammography, and ultrasound [5]. Every expert or radiologist has faced many problems to detect the suspicious region or the cancer because of the massive number of ultrasound images. Moreover, recurrence work has influenced the ultrasound interpretation accuracy. Thus, an efficient automated system that can help radiologists is needed to remarkably reduce their burden. Computer-Aided Diagnosis (CAD) systems are used to help radiologists in detecting breast cancer malignancy [6].
In general, CAD systems consist of several stages. One of the crucial stages to detect the distinction between benign and malignant cases is segmentation. Segmentation is a procedure of differentiating and separating objects of the image. Segmentation can select the meaningful or wanted regions named region of interest (ROI) in images from unwanted regions [3]. Another important and crucial step in CAD is feature extraction, which can help characterize benign and malignant tumors. A huge and complex space of features exists in an image. Thus, using feature extraction and selection stages are important to select the most efficient features. These stages can be used to extract the most relevant feature set that can differentiate between benign and malignant tumors [7]. Moreover, speckle noise and the similarity between the textures of the benign and malignant images are the main challenges of feature extraction, because they reduce the accuracy of the diagnosis by decreasing sensitivity and specificity. The utilization of various approaches of feature extraction, such as intensity-, texture-, and histogram-based methods, has been reported [8].
The available pattern recognition schemes have various limitations in achieving an acceptable/desirable level of accuracy. Over the years, one or more schemes have been fused or combined to collectively improve the recognition accuracy level [9]. The benefits of the fusion are shown in the diverse pattern recognition applications from different disciplines, making this fusion a major research topic in the field of image classification and pattern recognition. Consequently, the present research framework considers fusion as an essential component. In decision-making diagnosis, especially for breast cancer, the fusion is a common clinical practice. Furthermore, the levels of confidence associated with the diagnosis decisions are reflected by assessing the malignancy risk factor. Often, the fusion improves the diagnosis confidence, leading to better and more accurate eventual decisions. Fusion may also create conflicts between the classifiers, leading to an uncertain situation that needs further investigation [10,11]. Based on these abovementioned factors, the fusion scheme has recently been utilized in clinical practice. In addition, various fusion approaches have been successfully implemented for different applications, such as recognition of fingerprints, irises, facial images, and hand geometry.
Generally, fusion consists of four stages, namely, pixel, feature, scores, and decision [12], as presented here. In pixel-level fusion, the pixels of individual source images are fused through some forms of the processing to the source images (for example the edges extraction or texture analysis) into an abstract meta-image before the useful features for image classification are extracted from the meta-image [13]. Feature level fusion combines different feature vectors obtained by the multiple feature extraction algorithms. Often, the feature vectors are concatenated into a single feature vector or some forms of feature aggregations [14]. Score-level fusion combines the classification scores into a final score that further determines the class. Usually, the score level fusion is divided into three categories based on the (a) transformation, (b) classifier, and (c) density [15]. In the decision-level fusion approach, the classification decision outcomes are combined using different classifiers or feature vectors into a final decision [16]. Contributions of this study have been highlighted in the following points:
a) This study aims to propose a new descriptor based on feature-level fusion that can assist in breast cancer abnormality identification. Local Binary Pattern (LBP) technique has been used and enhanced based on the new threshold. Required important information on breast cancer can be identified by using an enhanced LBP descriptor. The proposed contribution can be derived from various concepts. First, the grayscale image is used as an input that can be named as the reference image. Second, the new LBP descriptor is applied to each pixel of the image to generate a fine-textured image as output. Finally, LBP features are put into play by using a new adaptive threshold value. To produce the binary values, a comparison between the adaptive threshold and the neighboring pixels is conducted.
b) Moreover, the extraction of different feature vendors from different image representation domains implies that diagnostic results can be obtained using different schemes that utilize different feature vectors or different classifiers.
c) This common feature of many pattern recognition problems has been exploited to improve the accuracy of recognition and classification by using the concept of fusion at different levels. A main cutting-edge feature of our research framework for breast cancer classification is the investigation of various fusion schemes. Particularly, this paper includes fusion at the feature level prior to classification at the score level (post-classification) and at the decision level (also post-classification).
The rest of this article is organized as follows. Section 2 presents a review of the literature for feature extraction and auto-classification. Section 3 describes the detail of the proposed texture feature extraction and auto-classification mechanisms. Section 4 explains the experimental results.
To differentiate between benign and malignant tumors in ultrasound utilizing CAD systems, features need to be extracted from the suspicious region. Thus, feature extraction is an important stage of CAD systems. The features of ultrasound images of breast cancer can be classified into two types, namely, texture and morphological features. Morphological features concentrate on the local properties of the image’s masses, for example, margin or shape. Moreover, morphological features are efficient for breast cancer identification in ultrasound images by CAD systems. Contours of the tumor are required as a basic knowledge by morphological features, and these contours can be gained by segmenting images [17]. However, the characteristics of tissue scattering can be described by texture features that happen due to mass changes. Texture features can be computed from the ROI utilizing gray-level values. Unlike morphological features, texture features do no need to obtain contours of the tumor accurately. Texture features are effective in differentiating benign from malignant tumors [18]. A seed point of ultrasound images has been detected automatically based on texture features in a previous study [19]. The current work pre-processed the image by using a median filter before extracting features.
After the pre-processing stage, the blocking stage is performed on the image to  blocks. Finally, in each block, texture features are found, and the four neighbors of chosen segments are tested. A previous study [20] calculated the statistical texture features, such as SFM, NGTDM, FOS, GLCM, GLRLM, and GLDS, from the inside and upper side of the lesion to obtain a ratio texture feature. By utilizing the obtained ratio, the breast lesions are classified based on the SVM classifier. A previously described process [21] involved the use of pre-processing, equalization, Wiener, and median filters to reduce noise. Then, the determination of the most concise representation of the lesion contour is done. After detecting the boundary of the object, the most important features are identified according to the morphological characterization of the discovery, thereby producing the input data to the classifier, which is the Multilayer Perceptron Network (MLP). Many techniques have been proposed for the feature extraction task, including histogram–-[22–24], intensity–-[25], and texture-based methods [26–28].
The application of LBP is widespread in many fields, including edge detection and texture recognition. Unlike available texture descriptors, LBP is computationally efficient with resistance to fluctuations of monotonic illumination. Several works have been proposed to refine LBP [29]. Most of the refinements are geared toward yielding more information for discriminative analysis and improving robustness. MRELBP [30] implemented a comparison, in which scholars employed regional image medians instead of raw image intensities; this comparison differs from standard LBP and its various variations. Meanwhile, a previous study [31] performed an analysis of LBP’s scale space and constructed an SSLBP descriptor. A previous study [32] constructed a Multiple Local Pattern descriptor that advances the usage of multiple LBP codes from merely two-valued codes, which yield a higher order of discriminative power. In a previous study [33], Local Vector Quantization Pattern was introduced; it quantifies vectors in place of multiple or binary quantification through computing the discrepancy between the center pixel and its neighborhood pixels. The distinct individual local structural pattern is then subjected to searching for a matching unique codeword index by looking up a pattern codebook that has been trained in an earlier phase. Meanwhile, LBP has also been reapplied to different research domains [34]. To overcome this drawback of LBP, a previous study [35] proposed the completed modeling of Local Binary Pattern (CLBP) technique, which joins three components of the variance vector d P as three descriptors, namely, sign (CLBP_S), magnitude (CLBP_M), and central pixel (CLBP_C) descriptors. In contrast, the CLBP method still has the following two drawbacks. First, the CLBP_M is introduced to supply complementary information to CLBP_S, whereas CLBP_M has a dimensionality that is of the same size as CLBP_S, whose outcome is a sharp increase from (P 2) to (P 2) (P 2) in the histogram size. Second, exploiting complementarity among CLBP_M and CLBP_S is still necessary. In the procedure quantization of the CLBP_M, the majority has been taken by non-uniform pattern; this means CLBP_S can provide only insufficient complementarity. Afterward, to overcome some limitations in the CLBP method, a local descriptor called BRINT has been proposed [36].
The study of [37] introduced another group of features that can be used for separating the malignant scores from the benign scores in relation to the ultrasound (US) images by collecting the textural and sonographic highlights. Next, the segregation capacity of the separated highlights was assessed via SVM with respect to the outcomes acquired from the counterfeit neural system (ANN) and KNN classifiers. The performance evaluation revealed the indispensable nature of the proposed approach for the US PC-supported determination in computer-aided diagnoses (CAD) frameworks for breast disease or a free program, thereby enabling a precise recognition of the favorable strong bosom knobs from the harmful ones. The study of [38] proposed a system to improve the choice combination for uniting the heterogeneous data, such as various modalities, highlighted classifications, or organizations. For the classifier correlation evaluation, two measures were used, namely, the ROC and AUC. Four classifiers, namely, the linear discriminant examination (LDA), ANN, and two variants of the chosen combination method, including the AUC-upgraded DF-A and pAUC-improved DF-P, were used. Despite dedicated effort, the existing issues related to the computer solutions obtained from the developed classifiers have not been resolved.
To resolve these limitations related to the computer solution, a multi-level fusion scheme for the auto-classification of the static ultrasound images of breast cancer has been proposed. First, the speckle noise that affects the texture features is reduced, thereby increasing the overlap between the benign and malignant classes. Second, the decisions from a single feature or combination of different features in one vector that may not be enough to identify the abnormal cases from the normal cases are considered. These two problems are efficiently tackled in the developed auto-classification scheme. Therefore, this study contributes to the classification of breast cancer based on the multi-level fusion to increase the diagnosis accuracy.
In the proposed work, a CAD framework has been proposed for breast cancer detection in ultrasound images. The framework includes segmentation, features extraction, and classification using different levels of fusion, as shown in Fig. 1. Developing the new CAD system starts with a segmentation technique based on a trainable method using machine learning techniques that can precisely localize breast cancer from tissue images. The segmentation procedure is a CAD stage for separating the suspicious regions or objects from the background. Based on the segmentation stage, unwanted regions can be partitioned from the wanted regions, namely, the ROI. This stage is crucial, because it can help in analyzing images easily. Therefore, the automatic segmentation technique of Zeebaree et al. [8] (with two-) that enables accurate segmentation for feature extraction has been used in this paper. In particular, the segmentation technique is based on machine learning and multi-descriptor features, which can capture various levels of information, i.e., intensity, structures, and locations. The main purpose of this method is to extract ROI from ultrasound images. The first phase of the segmentation method aims to detect the tumor and obtain an initial ROI. To achieve this goal, a machine learning technique based on a multi-descriptor (texture feature) is used to enhance the identification of the ROI from the background. The original ultrasound has been used as input to the segmentation method. Afterward, the image has been divided into blocks. Several blocks are selected and labeled as ROI and background. A set of Histogram of Oriented Gradients, 7 moments, and Fractal Dimension texture features have been extracted from each block of ultrasound. Based on the extracted features, the Artificial Neural Network (ANN) classifier has been trained. In the testing stage, the input ultrasound was scanned with a fixed window size to extract different powerful texture features. Thereafter, the extracted features have been fed to the trained method to produce different decisions based on extracted features. To produce a single decision, the majority decision is used to decide whether the block belongs to the ROI or to the background. The ROI obtained from the first phase still suffers from over and under segmentation problems, because the ROI cannot be obtained accurately. Thus, distance transform (DT) and Marker Control (MC) methods have been applied to the second phase. Based on DT and MC, the overlap between ROI and background has been reduced, and the overlapped objects have been identified to reduce the over-segmentation problem. The limitation of the previous method is the under-segmentation problem. The Region Growing (RG) methods have been used in this stage to obtain the accurate segmentation and to avoid the problem of under segmentation. After ROI detection, the feature needs to be extracted from ROI to distinguish between benign and malignant tumors. Thus, the main goal of the work is to propose a new method and describer that can assist in the identification of breast cancer abnormality by using texture features of enhanced LBP descriptor and different levels of fusion. Furthermore, the automatic classification of breast cancer supports the classification accuracy with a level of confidence to address the cases that the machine is not sure about (in terms of the class label); this classification is based on levels of confidence in a classifier and feature-based decision level fusion scheme.
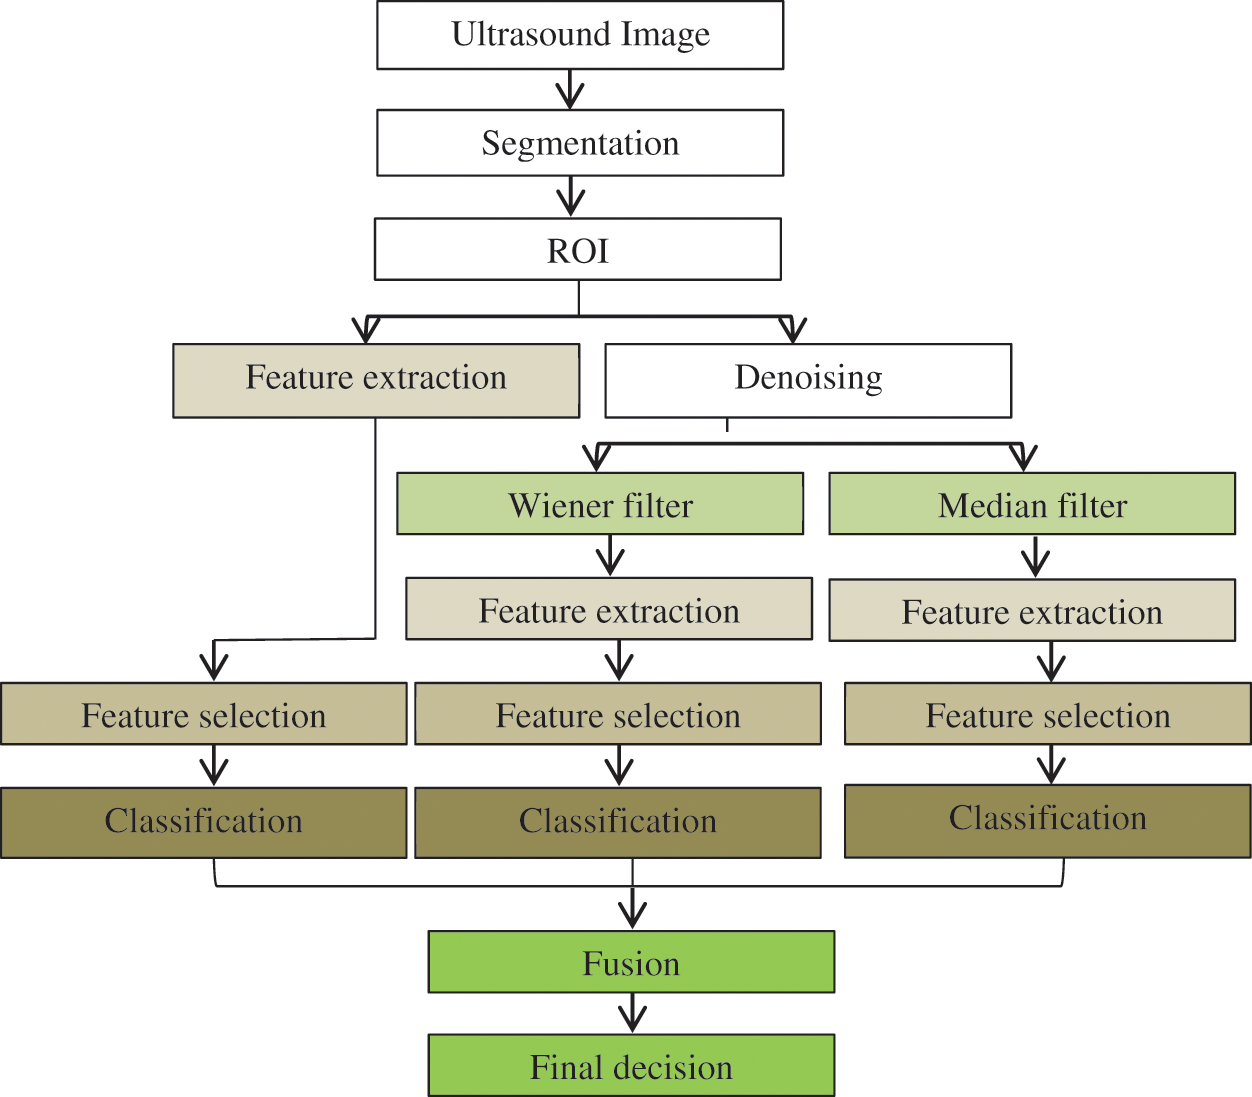
Figure 1: General diagram of the proposed framework
Data collection is among the most important aspects of any research. The researcher has to ensure that the data collected is accurate to maintain the integrity of the research. The type of data used in this research is ultrasound image. Testing the execution of any automated image classification, medical image segmentation, and computer diagnosis approach largely depends on the selection of the datasets of significant ultrasound cases that will be utilized in the test work with suitable assessment conventions. Generally, the classes of breast cancer are available in the sample pictures to enable the making of the decision on the success or failure of the automated pattern recognition. One fundamental aspect is knowing the origin of the dataset; this ensures the validity of the dataset and its relevance to the study. In the experiments, a breast cancer dataset containing 250 images (100 benign and 150 malignant) of ultrasound was used. Some samples of both cases are shown in Fig. 2. The dataset is obtained from a database that is widely used in the literature https://data.mendeley.com/datasets/wmy84gzngw/1.
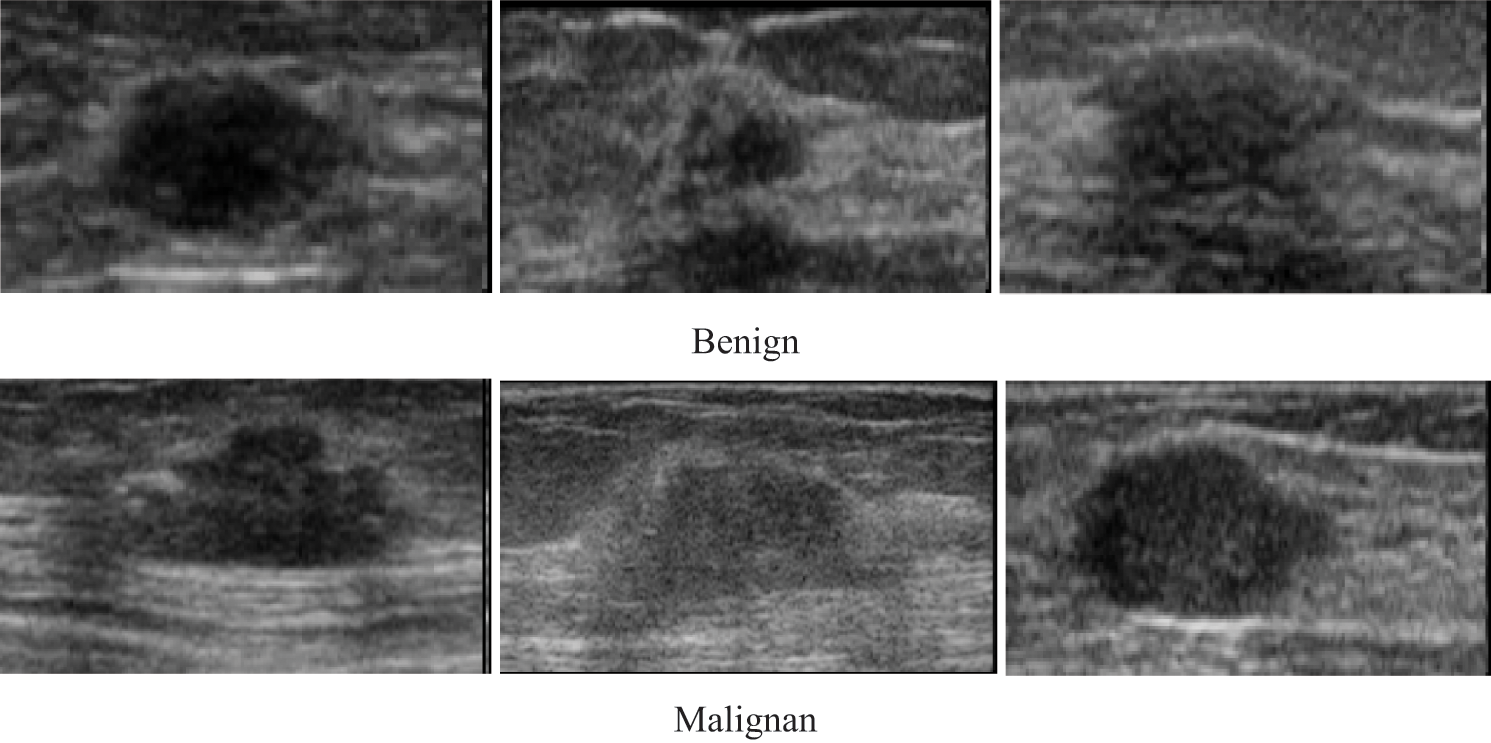
Figure 2: Different ultrasound images of breast cancer
This work focuses on building an effective CAD to identify the malignant risk at an early stage. After extracting accurate ROI from the background based on the segmentation method of Zeebaree et al. [8], features should be extracted from ROI for further processing and diagnosis. Therefore, this section focuses on producing the most effective features that are used as new signs to identify the malignant cases from the benign. Based on our investigations and the existing papers, we found that the texture feature is one of the most effective features that can be used to identify the different abnormal cases from the medical images. In addition, our analysis shows that the LBP features are the best for the ultrasound, because they can capture good information related to the edges of the ROI.

LBP is one of the features used for texture classification. LBP operator refers to a technique that performs image transformation into integer labels or an array of an image, which provides a description of an image’s microscopic appearances. Statistics or labels of the image, typically the histogram, are subsequently employed to conduct a finer image analysis. Most operators have been constructed to deal with monochromatic images. However, scholars have begun extending operators to deal with polychromatic images, volumetric data, and videos [39]. The texture of images can be studied by using the LBP descriptor. Eq. (1) expressed the LBP features mathematically; gc is assumed as a threshold value in substituting the value of any pixel of grayscale image based on the 8-bit binary code. Afterward, the chosen value of the center pixel that is used as the threshold is utilized to label neighboring pixels by checking the variation among the value of grayscale of the chosen threshold and the neighbor’s pixels. This procedure results in a new image based on a new LBP descriptor; this procedure is performed by transforming the binary code to the decimal number that exists at the right of the threshold. The computation starts in the clockwise direction continuously. The function that is utilized as a threshold is (s(x)). Many values that are less than 0 assigned as 0, whereas the values that are greater than 0 are assigned as 1. In the following stage, to produce an LBP image, all zeros and ones of binary code have been changed to decimal values. The process of traditional LBP is presented in Fig. 3.
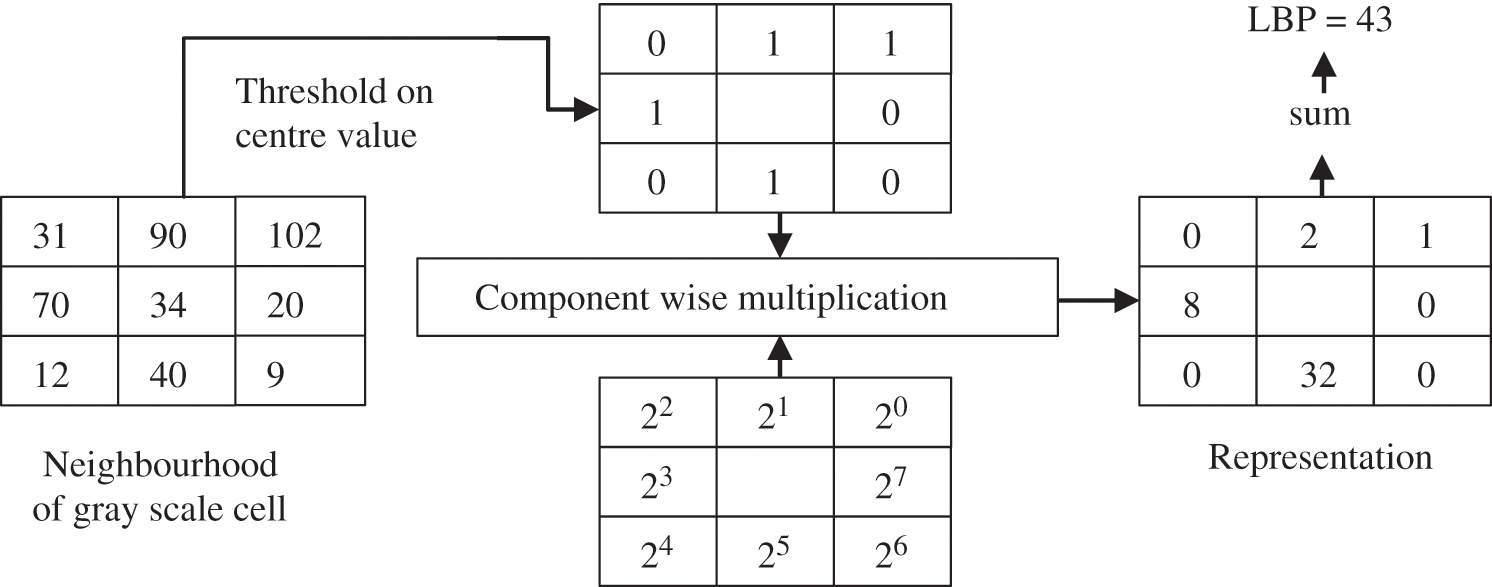
Figure 3: The LBP procedure
The process is based on the number of conversions between zero and one in the patterns; the same aspects of LBP are achieved, which is the main concept of the LBP uniform. The outcome of the traditional LBP classified into two main types of values of LBP. The first type of the LBP uniform contains less than two or two bitwise conversions from one to zero or vice versa, e.g., zero conversions (00000000) and 2 conversions (01111110). The second type of LBP has more than two bitwise conversions, which is named non-uniform LBP, e.g., four conversions (11101101) and six conversions (01011011). Fig. 4 shows that among every uniform pattern and the result label in uniform, LBP has an association. However, non-uniform patterns have been assigned as one label. Thus, the pattern mapping can be done based on the number of distinct outcome labels.
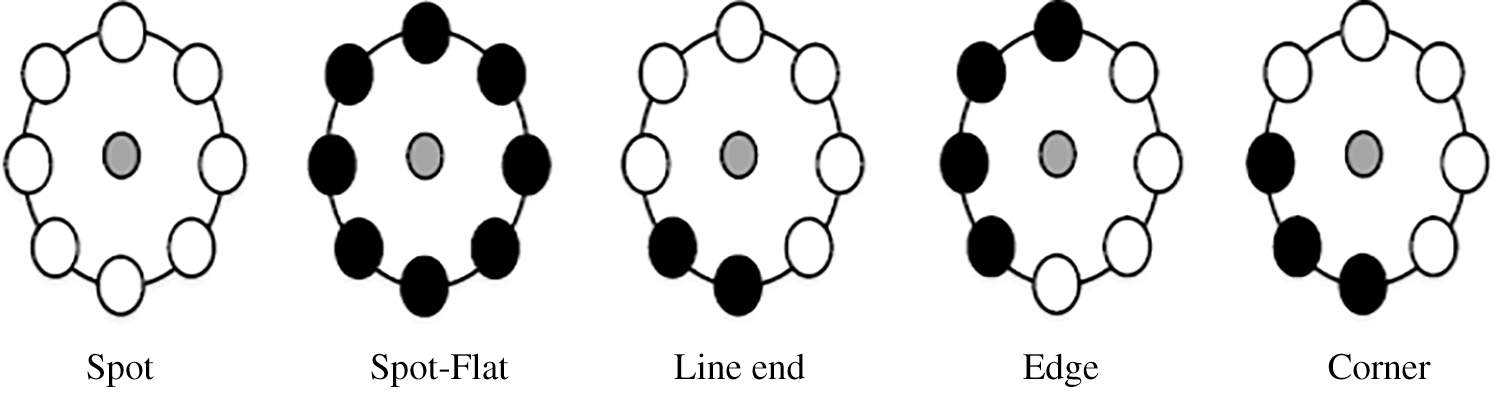
Figure 4: Identified LBP texture primitives
Digital images contain a huge amount of information and data because of the abovementioned fact, efficient processing and analysis need to be utilized in the digital image interpretation. To obtain automatic diagnosis and high-quality features of images that can be models, the pertinent medical information should be extracted effectively. Therefore, to identify the breast cancer malignancy in ultrasound images, this study extracts effective features by enhancing the LBP descriptor based on the threshold. To achieve this goal, we first extracted uniform and non-uniform LBP features from ultrasound images and then fed them to the ANN classifier. Based on our examination, we found that the most remarkable features that can assist in minimizing the overlapping among benign and malignant classes are the features that are produced by LBP uniform. The variation between both LBP uniform and non-uniform is presented in Fig. 5. Thus, this point has motivated us to enhance LBP uniform to obtain more effective features for ultrasound diagnosis. The traditional LBP descriptor [40] is restricted in terms of sensitivity for noise, because of the threshold that can be obtained from the center pixel. Therefore, creating an insensitive threshold for noise and monotonic greyscale conversion invariance is a crucial step. Subsequently, a multi-uniform of the LBP descriptor has been proposed in this study. To produce various features of LBP uniform, a different threshold has been utilized.
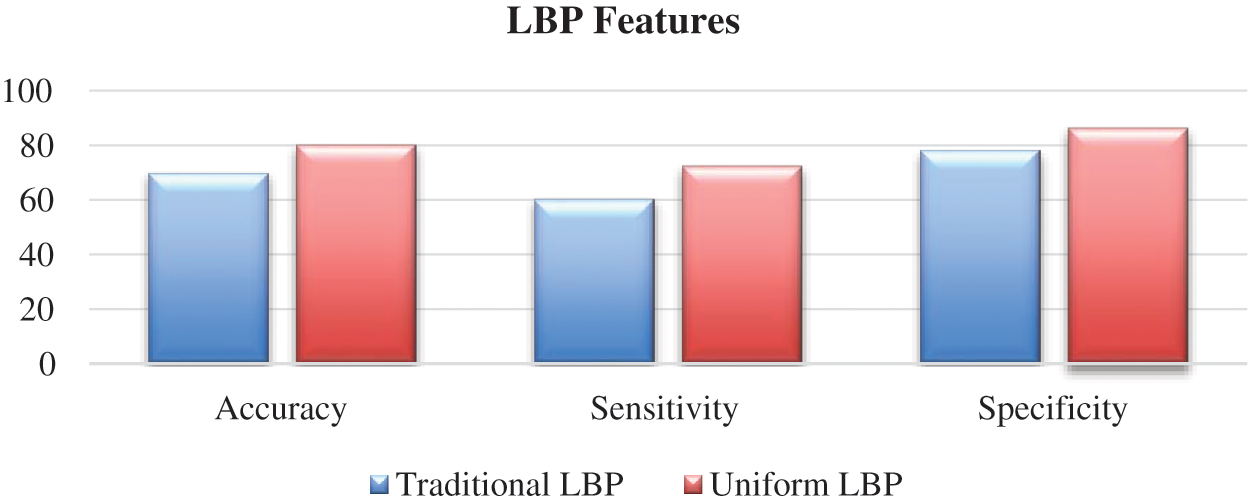
Figure 5: Traditional and uniform LBP features
In the proposed study, four different thresholds are used to identify LBP uniform operators. The traditional threshold is the mean threshold and is utilized to identify the first LBP uniform operator. However, the LBP uniform features that have been identified by the mean threshold are affected by speckle noise. This type of noise is included as a describer because an important image information is sometimes presented by speckle noise. The features of LBP uniform are identified utilizing the value of mean for the eight pixels concerning the center. However, speckle noise does not affect the features that can be identified in this stage. The value of the threshold based on mean has been computed from each ( 3) image cell. Afterward, the mean is utilized as a threshold instead of the many utilized pixel centers, as illustrated in Fig. 6. Furthermore, Eq. (2) has been utilized to calculate all neighboring pixels of gp with another value of threshold that is the mean of the cell -t, these features are called sign-lower code. To calculate the sign-upper code, comparing between all neighboring pixels of gp and the value of the threshold that is the mean of the cell +t, as it is shown in Eq. (3). The process of feature extraction based on different LBP uniform operator is illustrated in Fig. 7.


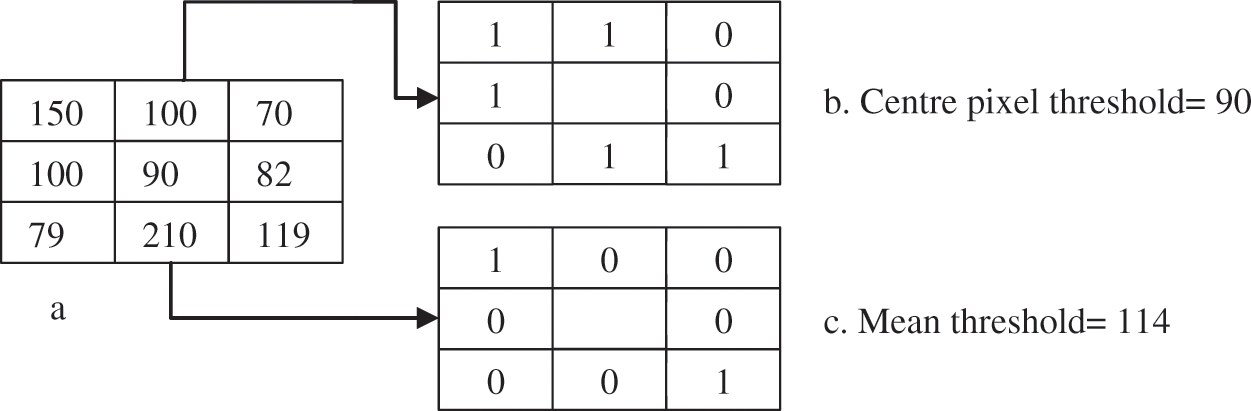
Figure 6: The mean value for the LBP
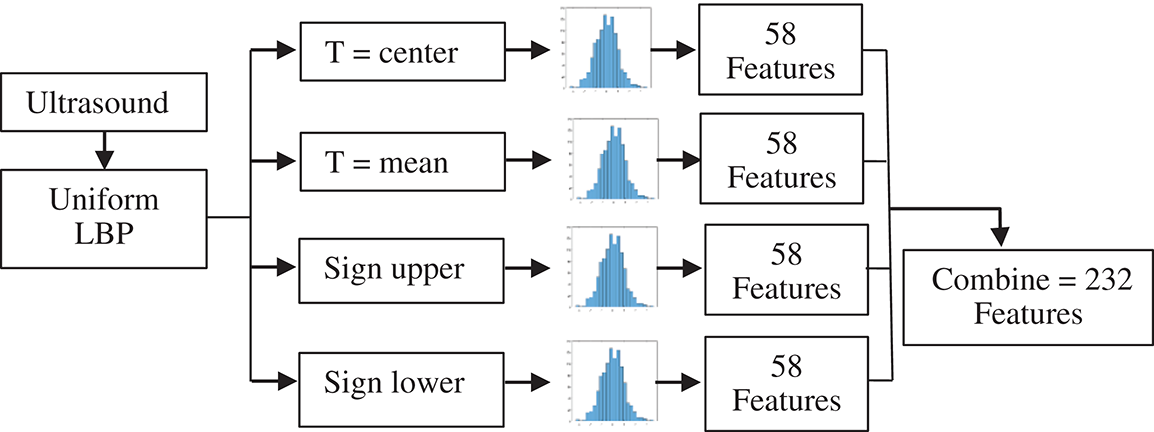
Figure 7: Feature extraction process in ultrasound images by different LBP uniform operator
3.3 Multi-Level Fusion Based on Noise Reduction
The identification of the abnormal breast cancer cases based on the ultrasound images analyses has many limitations due to the presence of speckle noise and artifacts, which in turn increase the overlap and the similarity between the benign and malignant tumor texture features. Consequently, the ability to find a new sign to identify the benign cases from malignant ones is appreciably reduced.
In this study, the shortcomings associated with the existing image analysis schemes have been resolved in two steps. In the first stage, the pre-processing method was used to generate several images from a single image. The median and Wiener filters were used to reduce the speckle noise and improve the textures of the ultrasound images of breast cancer. This procedure allowed the extraction of a powerful feature that significantly reduces overlap between the benign and malignant classes. In the second stage, the fusion was performed to obtain a tangible decision depending on several features fabricated from different filtered images (Fig. 8). Several previous studies were performed to minimize the amount of speckle noise in the ultrasound image without any guarantee of achieving an accurate diagnosis. Considering these facts, the present work enhanced the original image and texture features using the advantages of the median and Wiener filters.
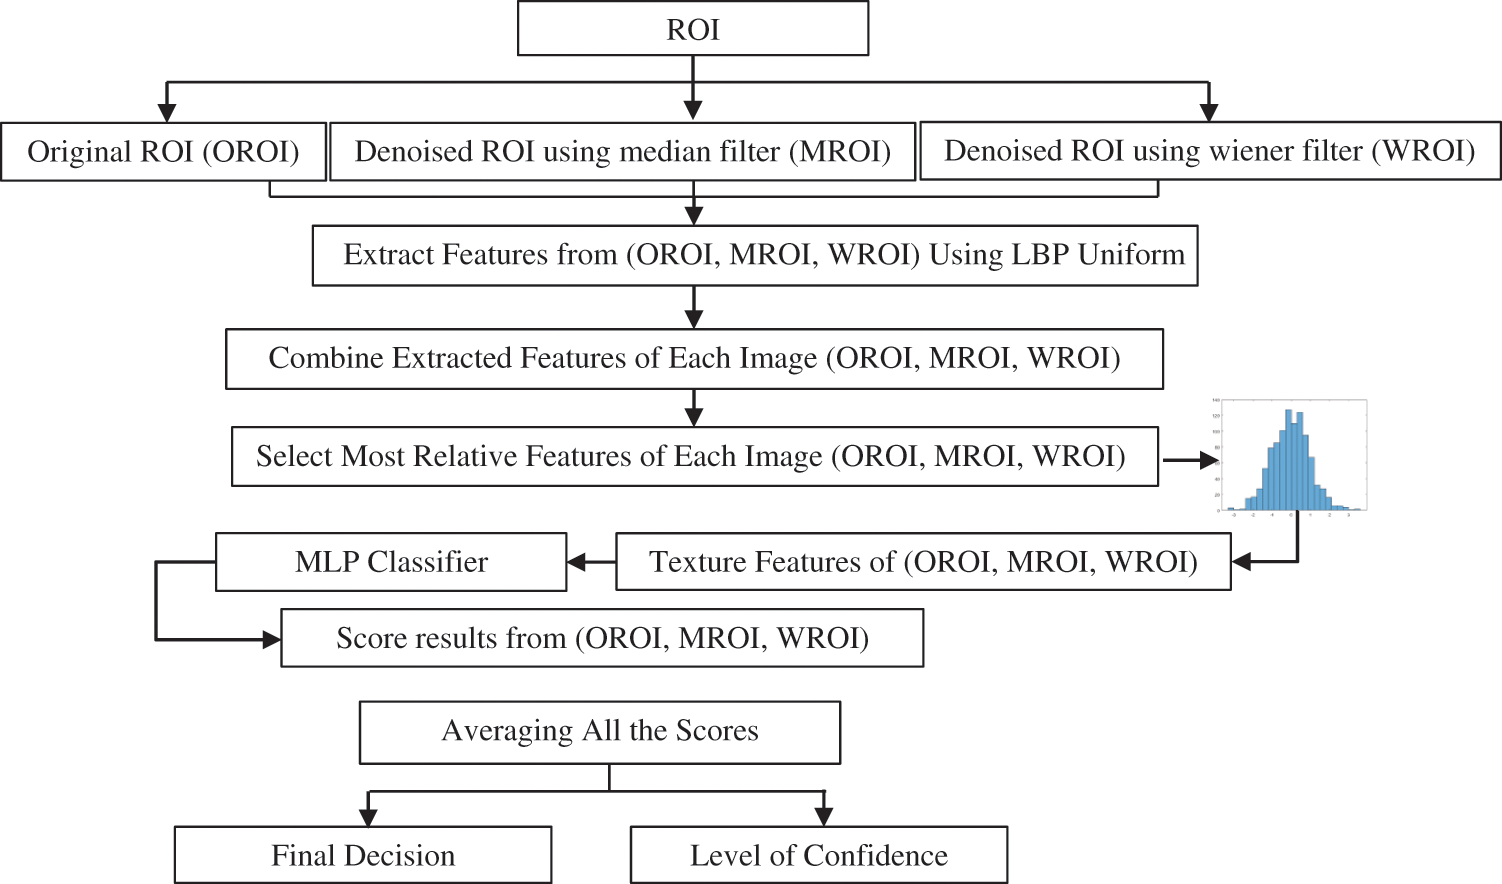
Figure 8: Breast cancer identification based on multi-level fusion
The median filter is a nonlinear type of filter in the spatial domain of an image that can easily suppress the impulsive noise, thereby leading to an accurate recognition of the pattern related to the breast cancer images. An effective pot-filtering technique was used together with median filtering to diminish the speckles. In this filtering technique, the median intensity was applied to a region of suitable size and shape denoted by W_ij (around the pixel (i, j) of interest), which acted as the output pixel value. The existing impulsive artifacts in the pixel were removed using this application, which was below half of the region size ||W_ij||. This technique used an adaptive weighted median filter based on the pixel’s weighting coefficient in the window. Each pixel was affected by the value of the weighting coefficient, which occurred as often as the weight when the median was estimated. Therefore, the method appeared similar to the typical median filter when the weights were identical. Otherwise, for very different weights, the details of the image and its edges changed, decreasing in the median from the center of the window to the outer limits. Overall, the noise was eliminated using this technique. Consequently, the weight choice was achieved through a compromise in noise suppression and image preservation. Furthermore, in the image processing technique, the makeup of an image within the window could enable the algorithm to adapt the weights. Thus, the image characteristics were determined by the local statistical analysis. Fig. 9 shows that this study used the median filters of varying dimensions ( ,
,  ,
,  , and
, and  ). With increasing filter size, the texture became smoother, thereby affecting the texture feature. Eventually, the perfect size was chosen to achieve optimum enhancement in the diagnosis.
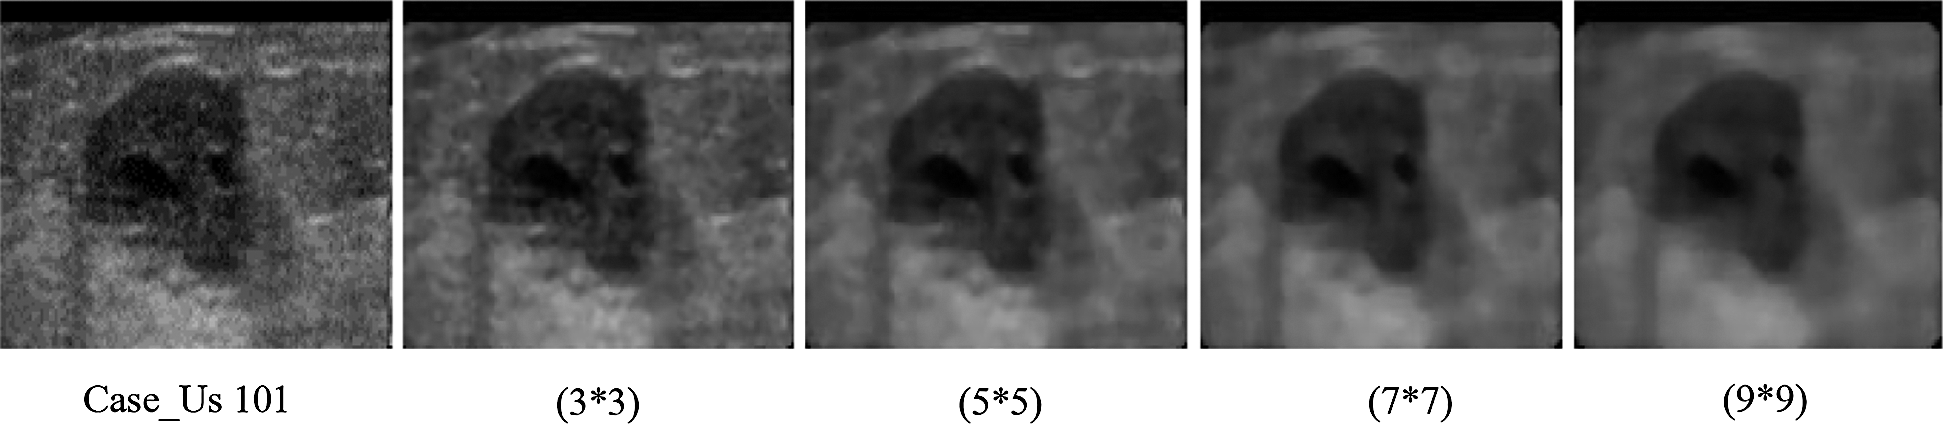
Figure 9: The effect of the median filter on the ultrasound by using different median filter size
The Wiener filter was adaptatively applied to an image that is designed specifically for the local image variance. For a larger variation, the smoothing conducted by the filter was less than the smaller changes. Actually, the outcome of this method was better compared with the linear filters. Unlike the linear filter, this filter used a high frequency to protect the edges and other parts of the images because of its selective nature. Compared with the linear filters, the Wiener filter needs more computational power, and this requirement limits its applications. Therefore, the Wiener filters of different sizes were used in experiments to determine the optimum filter size. Fig. 9 shows that this study used Wiener filters of varying dimensions ( ,
,  ,
,  , and
, and  ). Fig. 10 shows the basic framework of the proposed model that used median and Wiener filters to produce two filtered images. These two images together with the original ones were used as input to the uniform LBP feature. From each image, we extracted
  features, such as
  ,
,  , upper sign, and lower sign. The first level of fusion was performed to combine the features produced from the fourth uniform LBP features that enabled the production on a vector from all features and their use as a powerful feature. Next, these vectors were used to train three models, namely, the original, median, and Wiener images.
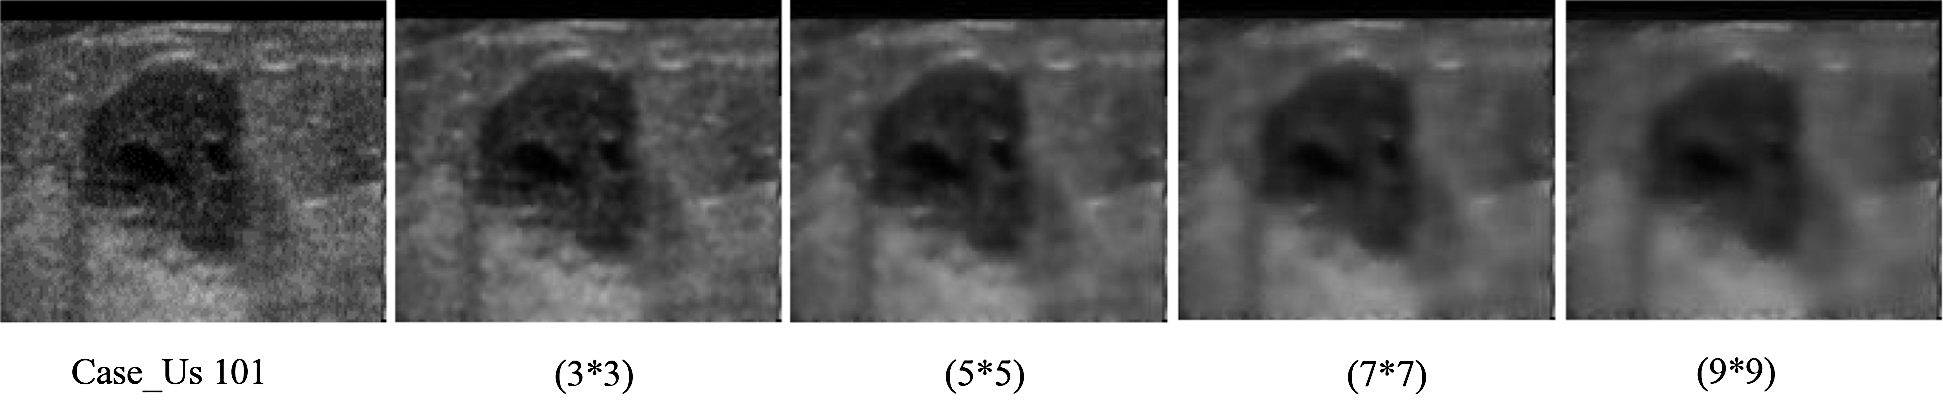
Figure 10: The effect of the wiener filter on ultrasound by using different wiener filter size
In the testing phase, each input image followed the same procedure to reduce the noise and generate three images via the original, median, and Wiener images. This was followed by the feature extraction stage and fusion level to generate one vector of features. Each trained model was used to test the feature. In the final stage of the framework, three decisions and three scores (one from each model) were achieved. The major voting of the three decisions was used with the average scores, and the final decision with the level of the confidence was generated. The author strongly believes that the texture features used to identify the abnormality are not enough to describe the cases. Therefore, combining the texture features with other measurements, i.e., geometry features, would be useful.
Through the use of MLPs, which are neural networks, the problem of pattern detection is solved. The MLP is a feed-forward neural network having several node layers in a directed graph. The MLP is recognized as one of the best methods for identifying the pattern and providing an adaptive learning capability. Additionally, the guide presents the reality that a dual-layer backpropagation network with hidden nodes should be taken by a general estimator. Based on the feature number and group of classification, the sizes of the input layer and output layer will be selected. In this consideration, only the number of neurons is concealed. Also, layers should be known. The basic rule is utilized in choosing parameters of the design to guarantee that the smallest parameters are used to obtain the best possible model. Thus, the network has the lowest complexity. An obstruction of the need for long training is present. In contrast, the potential of the best design can be obtained by comparing the analysis of the whole potential networks and by choosing the network that is most suitable for a specific problem.
A difference in the score-level fusion was observed, because the final decision was made on the basis of each feature component scheme as a voting system instead of using the score for every feature scheme. Thus, the optimum criteria for deciding the final result depended on the group that gained the greatest number of votes. The result was obtained from the majority, because the proposed study focuses on the binary classification and not just the merging of an odd number of feature schemes. The performance evaluation of the proposed pattern recognition scheme or classifier is conducted in terms of some standard measures, in which the overall classification accuracy is checked. The ratio of successful case numbers of the classified test to the whole case numbers of tested classification is represented by accuracy. The formula of the rate of accuracy is calculated, and the obtained parameters of the performance of the evaluation of binary classification are given in four different cases. True Positive (TP) is considered a first case, which means sick cases are detected correctly, whereas the second case was named False Positive (FP), which means sick cases are detected incorrectly. The third case is called True Negative (TN), which means strong cases are detected correctly. Finally, the False Negative (FN) case means healthy cases are detected incorrectly.
The flaws associated with the classification results are due to the failure to identify the forgery or successful identification of the forgery, even when the forgery is absent. The error rate is frequently reflected in the TP, TN, FP, and FN. The following Eqs. (4)–(6) are utilized to compute the accuracy, sensitivity (benign cases), and specificity (malignant cases).


4.1 Performance Evaluation of Uniform LBP Features
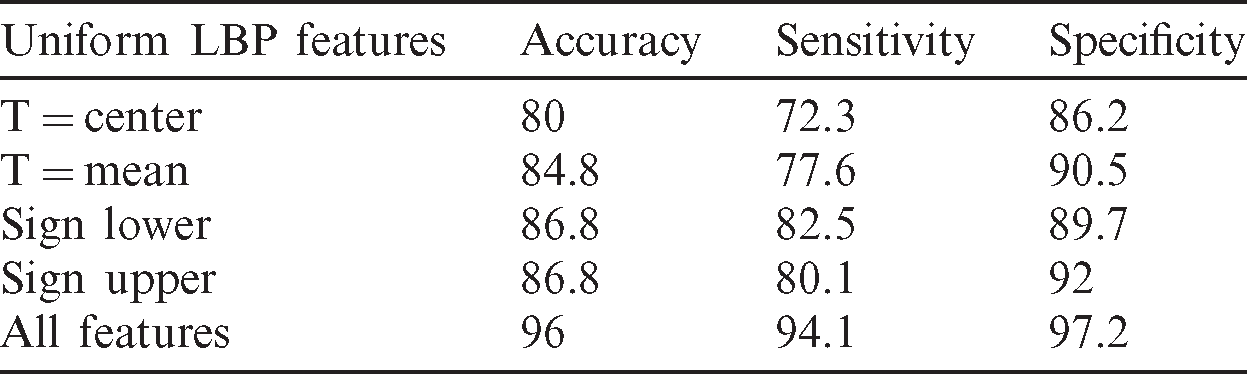
The performance evaluation of the proposed study is made using 250 ultrasounds after the extraction of ROI from the background involving 100 benign and 150 malignant tumors; 65% of images have been used in the training stage. To test the performance of the classification of the obtained results, we figured out some statistical metrics, namely, sensitivity, specificity, and accuracy. The performance evaluation of features of each LBP uniform compared with the combination of all LBP uniform features is illustrated in Tab. 1. Based on the results presented in Tab. 1, the proposed feature extraction model outperformed the traditional methods in terms of results.
Table 1: Performance evaluation of uniform LBP features
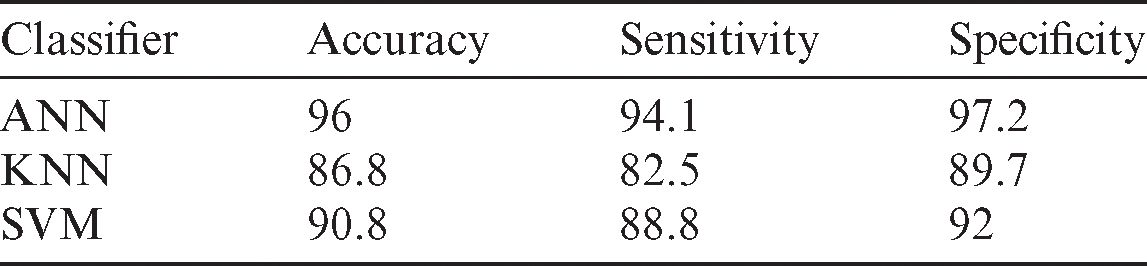
To highlight the effect of the ANN and compare it with SVM and KNN, the best accuracy produced in Tab. 2 was used for all features in Tab. 1. By applying the same procedure, the ANN is found to have produced the best result, as explained in Tab. 2. This table shows that using the KNN classifier is not enough to deal with the high-dimension features, and no real training stage like ANN and SVM exists. Considering these two reasons, the SVM and the ANN produced better results than the SVM. The ANN can produce a good, trainable model by adjusting the weight of the features. Moreover, the SVM can separate the features of the two-class by building a straight line. However, this is not always enough to capture the overlap samples. Tab. 2 illustrates the achieved results based on different classifiers. Obviously, some classifiers obtain better results than other classifiers. Therefore, the classifier that obtained the highest results has been used for classification in the proposed study.
Table 2: Performance evaluation of all features based on different classifiers
4.2 Performance Evaluation of Noise Reduction Method
The primary aim of this study is to develop a trainable model based on the new fusion method for identifying the malignant class breast cancer images from the benign ones. The proposed study was tested on the dataset with 250 images, where different filters were used to produce different images from the original one. Three images were generated, namely, the original, median-filtered, and Wiener-filtered, where each filter had a perimeter related to the mask size. In addition, the proposed filter was tested with different sizes to select the optimum size. Before the fusion technique, the uniform LBP model was applied to the original, median-, and Wiener-filtered images. Tab. 3 displays the test results obtained using the proposed uniform LBP on the median filtered image. The size of the median filter was the affective parameter. The model was tested with four different sizes ( ,
,  ,
,  , and
, and  ), among which the
  sizes produced the optimum outcome despite the changes in the uniform LBP type. The filter with a small size of
  revealed low accuracy because of the lower amount of data processing and insufficient reduction of the speckle noise in the image, which led to the loss much texture information. However, at a large filter size of
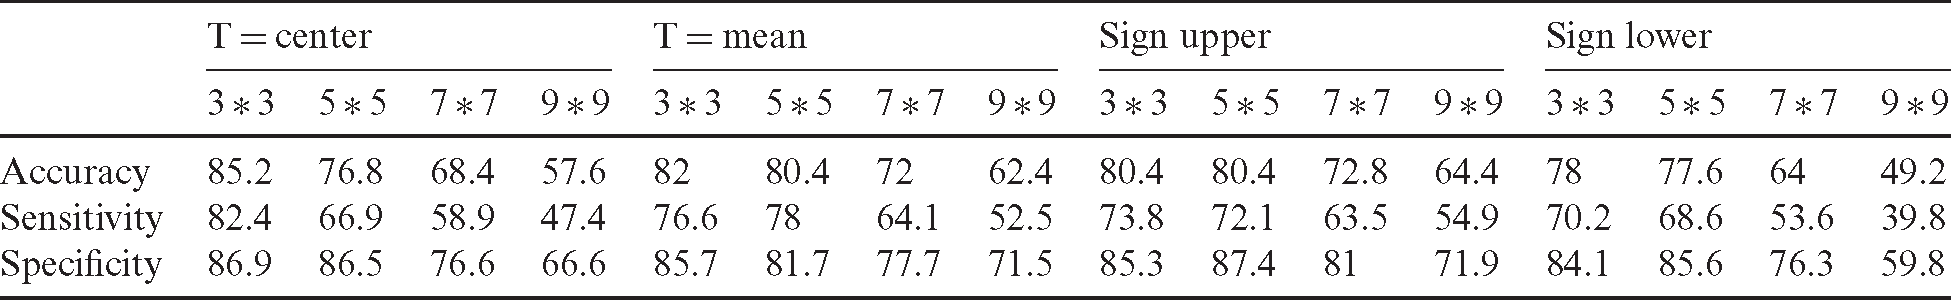
  , much amount of data in the image was processed with smoothness, indicating high accuracy. Tab. 4 illustrates the estimated sensitivity, specificity, and accuracy of features of each LBP uniform obtained using the proposed model on the Wiener-filtered image compared with the combined features. Apparently, the proposed model produced excellent results compared with traditional state-of-the-art methods.
Table 3: Performance evaluation of noise reduction based on different size of the median filter
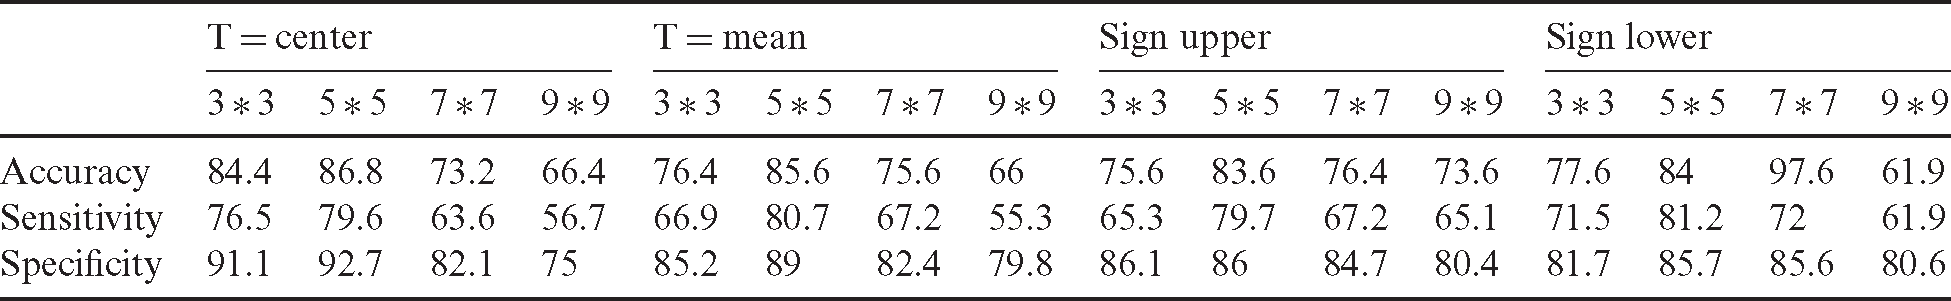
Table 4: Performance evaluation of noise reduction based on different size of wiener filter
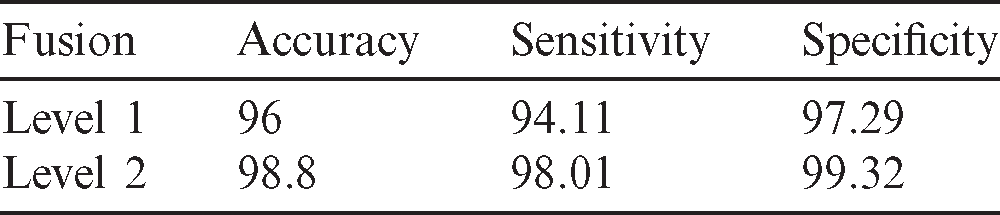
4.3 Performance Evaluation of Multi-Level Fusion Method
The classification performance is further investigated using different levels of fusion. Obviously, the proposed method included different levels of fusion and produced excellent results compared with the traditional state-of-the-art methods. The first level combined the uniform LBP features produced from different thresholds. In this level, the features were unified to produce one vector. The second level included the fusion of different classifiers using diverse images generated from various filters. The effectiveness of the proposed model at different levels became evident, i.e., fusion level 2 could enhance the outcomes. Tab. 5 illustrates the estimated sensitivity, specificity, and accuracy of combined features of the proposed model based on a different level of fusions.
Table 5: Performance evaluation of different level fusion using ANN classifier
To show the analysis of the performance evaluation of the proposed strategy a Scatter plot has been utilized for both levels of fusion. Fig. 11 demonstrates the second level fusion of all feature sets that somewhat ameliorated the accuracy, sensitivity, and specificity of classification performance using ultrasound with the ANN classifier.
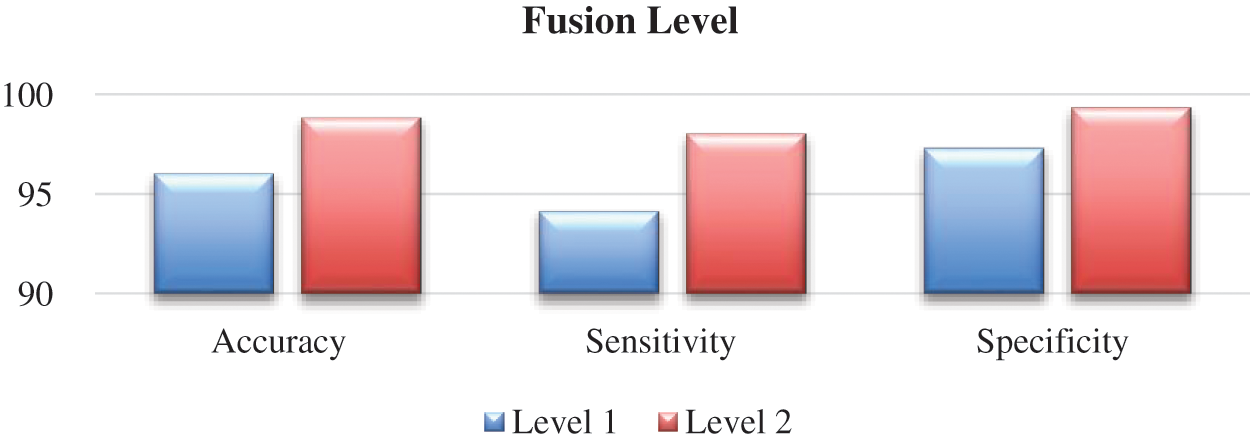
Figure 11: Scatter plot of the performance of different level fusion
In the proposed approach, all CAD stages, namely, segmentation, feature extraction, feature selection, and classification, are performed without manual intervention. Several existing methods are presented in Tab. 6 to address the problem of cancer identification. The evaluation performance of the proposed study has been compared with the presented studies. The proposed study outperformed the traditional one in terms of accuracy, sensitivity, and specificity.
Table 6: Compare the output of the proposed method and other existing feature extraction methods
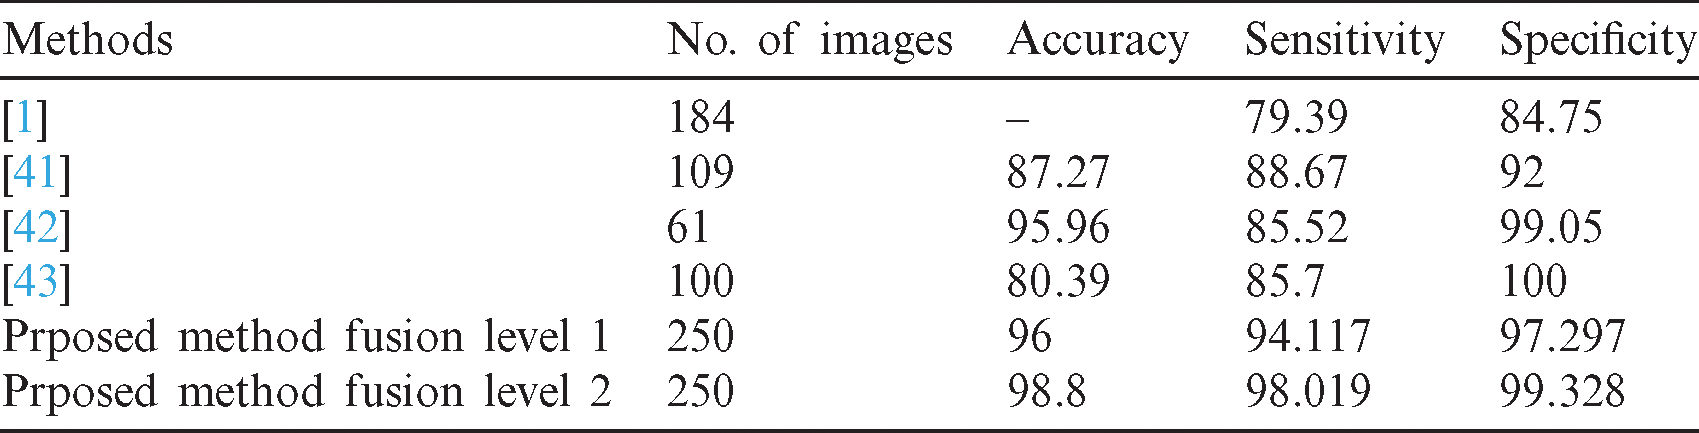
The proposed method has been applied to 250 images compared with other methods that have been tested on a smaller number of images. The accuracy of the existing methods (between 80% to 96%) are listed in Tab. 6. It has been mentioned in this comparison that those abovementioned methods have been applied to fewer images. By contrast, the accuracy of our proposed method is more than 98%. The sensitivity and specificity are the indicators used to determine the effect of the proposed method; the success of catching the malignant and the benign cases was measured. By comparing the sensitivity of the proposed method with the existing method, we determined that our method leads to a better result, which is around 98%. For the specificity indicator, the method used in a previous study [43] obtained a better result but was tested on only 100 images. Moreover, our method’s sensitivity value is close to that of [43], which is more than 99%.
We strongly believe that the texture features used to identify the abnormality are not enough to describe the cases. Therefore, combining the texture features with other measurements, such as geometry features, would be useful. Based on our investigation, several multi sub-classes exist under each class (benign and malignant). Identifying the exact class is important for the doctor. Our proposed model cannot identify the subclass because of two reasons, namely, (i) it does not have the labels for the sub-class and (ii) our main objective is to build a model that can help identify the malignant from benign cases.
Breast cancer is the leading cause of cancer-related death in women. Ultrasound is a standard breast imaging procedure that can be used to screen women for early signs of breast cancer. This study presents a multi-level fusion for the automatic classification using CAD at an early stage. The proposed model was developed following a critical appraisal of the findings obtained from the existing techniques and algorithms. The exploration of the technique workflow and the data collected from the case study interviews were performed in the proposed study. This model could improve the trainable model based on the multi-level fusion for the automatic classification of the static ultrasound images of breast cancer, in which different levels of fusion were implemented. The first level combined the uniform LBP features produced from a different threshold to obtain one vector. The second level involved the fusion of different classifiers, in which different images were generated using the median and Wiener filters. These filters enabled the decrease of the speckle noise and enhanced the ultrasound image textures. The LBP-based texture feature can be used to categorize the ultrasound images accurately and efficiently. The proposed model produced excellent accuracy, sensitivity, and specificity.
Acknowledgement: The authors would like to acknowledge Duhok Polytechnic University for providing all facilities and support for this study.
Funding Statement: This research received funding from Duhok Polytechnic University.
Conflicts of Interest: The authors declare that they have no conflicts of interest to report regarding the present study.
1 M. A. Mohammed, B. Al-Khateeb, A. N. Rashid, D. A. Ibrahim, M. K. Abd ghani et al. (2018). “Neural network and multi-fractal dimension features for breast cancer classification from ultrasound images,” Computers & Electrical Engineering, vol. 70, pp. 871–882. [Google Scholar]
2 M. Xian, Y. Zhang, H. D. Cheng, F. Xu, B. Zhang et al. (2018). “Automatic breast ultrasound image segmentation: A survey,” Pattern Recognition, vol. 79, pp. 340–355. [Google Scholar]
3 D. Q. Zeebaree, H. Haron, A. M. Abdulazeez and D. A. Zebari. (2019). “Machine learning and region growing for breast cancer segmentation,” in Proc. IEEE. Int. Conf. on Advanced Science and Engineering, Duhok, Iraq, pp. 88–93. [Google Scholar]
4 L. Dora, S. Agrawal, R. Panda and A. Abraham. (2017). “Optimal breast cancer classification using Gauss–Newton representation based algorithm,” Expert Systems with Applications, vol. 85, pp. 134–145. [Google Scholar]
5 T. Sadad, A. Munir, T. Saba and A. Hussain. (2018). “Fuzzy c-means and region growing based classification of tumor from mammograms using hybrid texture feature,” Journal of Computational Science, vol. 29, pp. 34–45. [Google Scholar]
6 L. Kinnard, S. C. Lo, P. Wang, M. T. Freedman and M. Chouikha. (2002). “Automatic segmentation of mammographic masses using fuzzy shadow and maximum-likelihood analysis,” in Proc. IEEE Int. Sym. on Biomedical Imaging, Washington, DC, USA, pp. 241–244. [Google Scholar]
7 Y. L. Huang, D. R. Chen and Y. K. Liu. (2004). “Breast cancer diagnosis using image retrieval for different ultrasonic systems,” in Proc. IEEE Int. Conf. on Image Processing, Singapore, Singapore, vol. 5, pp. 2957–2960. [Google Scholar]
8 D. Q. Zeebaree, H. Haron, A. M. Abdulazeez and D. A. Zebari. (2019). “Trainable model based on new uniform LBP feature to identify the risk of the breast cancer,” in Proc. IEEE. Int. Conf. on Advanced Science and Engineering ICOASE, Duhok, Iraq, pp. 106–111. [Google Scholar]
9 M. A. Mohammed, M. K. Abd Ghani, N. A. Arunkumar, S. A. Mostafa, M. K. Abdullah et al. (2018). “Trainable model for segmenting and identifying Nasopharyngeal carcinoma,” Computers & Electrical Engineering, vol. 71, pp. 372–387. [Google Scholar]
10 O. I. Obaid, M. A. Mohammed, M. Ghani, A. Mostafa and F. Taha. (2018). “Evaluating the performance of machine learning techniques in the classification of wisconsin breast cancer,” International Journal of Engineering & Technology, vol. 7, no. 436, pp. 160–166. [Google Scholar]
11 D. Q. Zeebaree, H. Haron and A. M. Abdulazeez. (2018). “Gene selection and classification of microarray data using convolutional neural network,” in Proc. IEEE. Int. Conf. on Advanced Science and Engineering, Duhok, Iraq, pp. 145–150. [Google Scholar]
12 M. K. Abd Ghani, M. A. Mohammed, N. Arunkumar, S. A. Mostafa, D. A. Ibrahim et al. (2020). “Decision-level fusion scheme for nasopharyngeal carcinoma identification using machine learning techniques,” Neural Computing and Applications, vol. 32, no. 3, pp. 625–638. [Google Scholar]
13 N. Arunkumar, M. A. Mohammed, S. A. Mostafa, D. A. Ibrahim, J. J. Rodrigues et al. (2020). “Fully automatic model-based segmentation and classification approach for MRI brain tumor using artificial neural networks,” Concurrency and Computation: Practice and Experience, vol. 32, no. 1, e4962. [Google Scholar]
14 S. A. Mostafa, A. Mustapha, M. A. Mohammed, R. I. Hamed, N. Arunkumar et al. (2019). “Examining multiple feature evaluation and classification methods for improving the diagnosis of Parkinson’s disease,” Cognitive Systems Research, vol. 54, pp. 90–99. [Google Scholar]
15 N. Arunkumar, M. A. Mohammed, M. K. A. Ghani, D. A. Ibrahim, E. Abdulhay et al. (2019). “K-means clustering and neural network for object detecting and identifying abnormality of brain tumor,” Soft Computing, vol. 23, no. 19, pp. 9083–9096. [Google Scholar]
16 M. A. Mohammed, M. K. Abd Ghani, N. A. Arunkumar, R. I. Hamed, M. K. Abdullah et al. (2018). “A real time computer aided object detection of nasopharyngeal carcinoma using genetic algorithm and artificial neural network based on Haar feature fear,” Future Generation Computer Systems, vol. 89, pp. 539–547. [Google Scholar]
17 Y. L. Huang, D. R. Chen, Y. R. Jiang, S. J. Kuo, H. K. Wu et al. (2008). “Computer-aided diagnosis using morphological features for classifying breast lesions on ultrasound,” Ultrasound in Obstetrics and Gynecology: The Official Journal of the International Society of Ultrasound in Obstetrics and Gynecology, vol. 32, no. 4, pp. 565–572. [Google Scholar]
18 H.-D. Cheng, J. Shan, W. Ju, Y. Guo and L. Zhang. (2010). “Automated breast cancer detection and classification using ultrasound images: A survey,” Pattern Recognition, vol. 43, no. 1, pp. 299–317. [Google Scholar]
19 L. Panigrahi, K. Verma and B. K. Singh. (2016). “An enhancement in automatic seed selection in breast cancer ultrasound images using texture features,” in Proc. IEEE. Int. Conf. on Advances in Computing, Communications and Informatics, Jaipur, India, pp. 1096–1102. [Google Scholar]
20 S. Bhusri and S. Jain. (2017). “Classification of breast lesions using texture ratio vector technique,” in Proc. of the 11th INDIACom Int. Conf. on Computing for Sustainable Global Development, BVICAM, New Delhi, India, pp. 6289–6293. [Google Scholar]
21 K. D. Marcomini, A. A. Carneiro and H. Schiabel. (2016). “Application of artificial neural network models in segmentation and classification of nodules in breast ultrasound digital images,” International Journal of Biomedical Imaging, vol. 2016, no. 2, pp. 1–13. [Google Scholar]
22 I. Muhimmah and R. Zwiggelaar. (2006). “Mammographic density classification using multiresolution histogram information,” in Proc. of the Int. Special Topic Conf. on Information Technology in Biomedicine, Britash, UK, pp. 26–28. [Google Scholar]
23 R. Zwiggelaar, I. Muhimmah and E. Denton. (2005). “Mammographic density classification based on statistical grey-level histogram modeling,” in Proc. of the Medical Image Understanding and Analysis (MIUA’05Bristol, UK, pp. 183–186.
24 E. Hadjidemetriou, M. D. Grossberg and S. K. Nayar. (2004). “Multiresolution histograms and their use for recognition,” IEEE Transactions on Pattern Analysis and Machine Intelligence, vol. 26, no. 7, pp. 831–847. [Google Scholar]
25 M. A. Mohammed, M. K. Abd Ghani, R. I. Hamed, D. A. Ibrahim and M. K. Abdullah. (2017). “Artificial neural networks for automatic segmentation and identification of nasopharyngeal carcinoma,” Journal of Computational Science, vol. 21, pp. 263–274. [Google Scholar]
26 C. Zhou, H. P. Chan, N. Petrick, M. A. Helvie, M. M. Goodsitt et al. (2001). “Computerized image analysis: Estimation of breast density on mammograms,” Medical Physics, vol. 28, no. 6, pp. 1056–1069. [Google Scholar]
27 W. He, E. R. Denton and R. Zwiggelaar. (2012). “Mammographic segmentation and risk classification using a novel binary model based bayes classifier,” in Int. Workshop on Digital Mammography. Springer, Berlin, Heidelberg, pp. 40–47.
28 A. Oliver, J. Freixenet and R. Zwiggelaar. (2005). “Automatic classification of breast density,” in Proc. IEEE Int. Conf. on Image, Italy, Genova, vol. 2, pp. 1258. [Google Scholar]
29 T. Ojala, M. Pietikainen and T. Maenpaa. (2002). “Multiresolution gray-scale and rotation invariant texture classification with local binary patterns,” IEEE Transactions on Pattern Analysis and Machine Intelligence, vol. 24, no. 7, pp. 971–987. [Google Scholar]
30 L. Liu, S. Lao, P. W. Fieguth, Y. Guo, X. Wang et al. (2016). “Median robust extended local binary pattern for texture classification,” IEEE Transactions on Image Processing, vol. 25, no. 3, pp. 1368–1381. [Google Scholar]
31 Z. Guo, X. Wang, J. Zhou and J. You. (2015). “Robust texture image representation by scale selective local binary patterns,” IEEE Transactions on Image Processing, vol. 25, no. 2, pp. 687–699. [Google Scholar]
32 C. Zhu and R. Wang. (2012). “Local multiple patterns based multiresolution gray-scale and rotation invariant texture classification,” Information Sciences, vol. 187, pp. 93–108. [Google Scholar]
33 Z. Pan, H. Fan and L. Zhang. (2015). “Texture classification using local pattern based on vector quantization,” IEEE Transactions on Image Processing, vol. 24, no. 12, pp. 5379–5388. [Google Scholar]
34 D. O. T. Bruno, M. Z. Do Nascimento, R. P. Ramos, V. R. Batista, L. A. Neves et al. (2016). “LBP operators on curvelet coefficients as an algorithm to describe texture in breast cancer tissues,” Expert Systems with Applications, vol. 55, pp. 329–340. [Google Scholar]
35 Z. Guo, L. Zhang and D. Zhang. (2010). “A completed modeling of local binary pattern operator for texture classification,” IEEE Transactions on Image Processing, vol. 19, no. 6, pp. 1657–1663. [Google Scholar]
36 L. Liu, Y. Long, P. W. Fieguth, S. Lao and G. Zhao. (2014). “Brint: Binary rotation invariant and noise tolerant texture classification,” IEEE Transactions on Image Processing, vol. 23, no. 7, pp. 3071–3084. [Google Scholar]
37 R. Liao, T. Wan and Z. Qin. (2011). “Classification of benign and malignant breast tumors in ultrasound images based on multiple sonographic and textural features,” in Proc. IEEE Third Int. Conf on Intelligent Human-Machine Systems and Cybernetics, China, Zhejiang, vol. 1, pp. 71–74. [Google Scholar]
38 J. L. Jesneck, L. W. Nolte, J. A. Baker, C. E. Floyd and J. Y. Lo. (2006). “Optimized approach to decision fusion of heterogeneous data for breast cancer diagnosis,” Medical Physics, vol. 33, no. 8, pp. 2945–2954. [Google Scholar]
39 F. Tajeripour, E. Kabir and A. Sheikhi. (2008). “Fabric defect detection using modified local binary patterns,” EURASIP Journal on Advances in Signal Processing, vol. 2008, no. 783898, pp. 1–2. [Google Scholar]
40 L. Cai, X. Wang, Y. Wang, Y. Guo and Y. Wang. (2015). “Robust phase-based texture descriptor for classification of breast ultrasound images,” Biomedical Engineering Online, vol. 14, no. 1, pp. 26. [Google Scholar]
41 T. Prabhakar and S. Poonguzhali. (2017). “Automatic detection and classification of benign and malignant lesions in breast ultrasound images using texture morphological and fractal features,” in Proc. IEEE. 10th Biomedical Engineering Int. Conf., Hokkaido, Japan, pp. 1–5.
42 L. Liu, K. Li, W. Qin, T. Wen, L. Li et al. (2018). “Automated breast tumor detection and segmentation with a novel computational framework of whole ultrasound images,” Medical & Biological Engineering & Computing, vol. 56, no. 2, pp. 183–199.
43 J. Virmani and R. Agarwal. (2019). “Effect of despeckle filtering on classification of breast tumors using ultrasound images,” Biocybernetics and Biomedical Engineering, vol. 39, no. 2, pp. 536–560.
 | This work is licensed under a Creative Commons Attribution 4.0 International License, which permits unrestricted use, distribution, and reproduction in any medium, provided the original work is properly cited. |