DOI:10.32604/cmc.2021.013092
| Computers, Materials & Continua DOI:10.32604/cmc.2021.013092 | |
| Article |
A New Decision-Making Model Based on Plithogenic Set for Supplier Selection
1Faculty of Computers and Informatics, Zagazig University, Zagazig, 44519, Egypt
2Math & Science Department, University of New Mexico, Gallup, New Mexico,87301, USA
3College of Computer Information Technology, American University in the Emirates, Dubai, The United Arab Emirates
*Corresponding Author: Mohamed Abdel-Basset. Email: analyst_mohamed@yahoo.com
Received: 25 July 2020; Accepted: 21 September 2020
Abstract: Supplier selection is a common and relevant phase to initialize the supply chain processes and ensure its sustainability. The choice of supplier is a multi-criteria decision making (MCDM) to obtain the optimal decision based on a group of criteria. The health care sector faces several types of problems, and one of the most important is selecting an appropriate supplier that fits the desired performance level. The development of service/product quality in health care facilities in a country will improve the quality of the life of its population. This paper proposes an integrated multi-attribute border approximation area comparison (MABAC) based on the best-worst method (BWM), plithogenic set, and rough numbers. BWM is applied to regulate the weight vector of the measures in group decision-making problems with a high level of consistency. For the treatment of uncertainty, a plithogenic set and rough number (RN) are used to improve the accuracy of results. Plithogenic set operations are used to deal with information in the desired manner that handles uncertainty and vagueness. Then, based on the plithogenic aggregation and the results of BWM evaluation, we use MABAC to find the optimal alternative according to defined criteria. To examine the proposed integrated algorithm, an empirical example is produced to select an optimal supplier within five options in the healthcare industry.
Keywords: Supplier selection; rough set theory; MABAC; MCDM; BWM; plithogenic set
The process of evaluating a set of criteria under a series of constraints to obtain the optimal alternative became popular and significant in many decision-making issues. In MCDM problems, the decision-maker tries to decide the optimal alternative that fulfills most of the criteria considering conditions and constraints. In most current practices, supply chain (SC) managers focus on selecting the proper supplier to improve performance in the supply phase, such as product quality, delivery consistency, and prices. Appropriate supplier selection can significantly increase productivity, meet customer expectations, increase profitability, and reduce the supply costs. But, due to the growth in the number of suppliers, the full range of products available, and the increase of customer expectations, supplier selection became complex, and a real challenge for the supply chain managers, thus it needs to be studied under uncertain environment.
Researchers used different MCDM techniques for selecting the supplier, where the problem of supplier selection among alternatives is presented based on a set of criteria consistent with the nature of the field. It is worth presenting the problem of selecting suppliers in the form of a multi-criteria decision-making problem as the selection criteria differ from one domain to another. Several MCDM methods were used in making proposed models to solve the problem of supplier selection in several areas; for example, a combined model of BWM and fuzzy grey cognitive maps to evaluate green suppliers [1]. In the field of supplier selection to supply chain sustainability, an extension of the Data Envelopment Analysis (DEA) model was suggested [2]. An analytical hierarchy process (AHP), additive ratio assessment (ARAS), and multi-choice goal programming (MCGP) to select a catering supplier is proposed in [3]. A sustainable supplier selection is evaluated with the intuitionistic fuzzy Techniques for Order Preferences by Similarity to Ideal Solution (TOPSIS) method [4].
The supplier selection problem is based on a set of criteria that are defined according to business nature. There are many MCDM methods, such as BWM, that can be used to evaluate these criteria and obtain the optimal alternative. The Best-Worst is a simple pairwise comparison method that shows reliable results in many topics. Gupta (2018) combined BWM with Fuzzy TOPSIS to evaluate green human resource management (GHRM) [5]. The selection of the conceptual design of the products was evaluated using BWM under fuzzy environment [6]. Supply chain sustainability was measured by BWM [7]. In this paper, BWM is used to decide and evaluate the weight of the selection standards that are defined to measure the suppliers.
The aim of this paper is to solve a supplier selection problem according to plithogenic set, which is to aggregate the group decision-makers. To achieve this aim, we propose an integrated plithogenic approach based on BWM to find the weight vector of the criteria and the MABAC method to obtain the optimal alternative.
This paper is structured as follows: a summarized presentation of studies on supplier selection and healthcare industry in Section 2. Section 3 consists of definitions and details of the techniques applied in the research. Section 4 gives the details of the proposed approach to handle the supplier selection problem. Our method is applied to numerous examples, and the results are discussed in Section 5. The conclusion of the research is given in Section 6.
Supplier selection is a superior responsibility of SC managers. Supplier selection is considered as MCDM process that involves comparisons among groups of criteria to choose the preferable supplier, providing the highest level of performance to the organization. Appropriate supplier selection can improve the profit, decrease costs, satisfy customer expectations, and stimulate the competitiveness of the organization [8]. That is why the supplier selection process became a critical decision that may influence the whole supply chain performance. In this study, a group of MCDM methods were combined to arrive at the best decision, which is to choose the optimal supplier. The importance of combining these theories is due to the creation of a more accurate model of decisions, where the BWM is characterized by its ability to determine the weights of measurement criteria that relate to selecting the best supplier. MABAC is characterized by the ability to choose the best alternative from the proposed alternatives. This proposed hybrid model was developed under uncertainty environment based on rough numbers and plithogenic set to avoid problems of ambiguity of information that characterizes most decision-making problems. Health care problems are among the most significant problems that need to be studied carefully in decision-making.
The supplier selection can be resumed in three main steps [9]. Firstly, the selection criteria should be chosen, such as product quality, cost, product reliability, or delivery performance. Of course, the set of criteria is not standard for all supplier selection situations. Secondly, the weight of each criterion previously defined should be determined, and the collection of supplier alternatives that may fit the production process should be decided. Finally, an MCDM model should be constructed to assess the alternatives based on the evaluation metrics to find the optimal supplier. The aim of the supplier evaluation process in the supply chain is to recognize the optimal supplier that can provide the accepted quality of product/service and the right capacity at the right stage and right location [10].
Health care products accomplished growth in past years. These products have many standards and guidelines that restrict companies in the supplier selection process. The distribution of health care facilities by the use of GIS and MCDM techniques is studied in [11]. Also, to select the best treatment technology in health-care waste (HCW) management, a model based on MCDM methods was proposed [12]. Weighted average operator and TOPSIS were used to offer a model that assists the hierarchical medical system [13]. An expert system based on the fuzzy set for assessment of health care structures was introduced in [14]. Besides, fuzzy (Quality Function Development) QFD was integrated with ordered weighted averaging (OWA) operator to solve the supplier selection problem in health care facilities [15].
Selecting the optimal supplier process implies a large amount of uncertainty, which requires different methodologies to accurate the results of the selection. There are various types of MCDM techniques that can be involved in supplier selection, but the question is which approach or method to apply. RN is an appropriate tool to deal with uncertainty or to handle subjective judgments of customers, and also to determine the boundary intervals [16]. It helps many MCDM methods to improve efficient results in an uncertain environment. Consequently, the qualitative flexible multiple criteria method was combined with a rough number to disband the trouble of shelter site selection. The assessment of third-party logistics was measured by MABAC and BWM based on the rough number in the research of [17]. Chen et al. (2019) combined a rough number with the fuzzy-DEMATEL and analytical network process method (ANP) to evaluate the product-service system [18].
Plithogeny theory refers to creating, improving, and growth of novel objects from groups of conflicting or non-conflicting old objects [19]. It is considered as a generalization of neutrosophic set theory. Plithogenic set has two features that enhance the importance of its operations. The first feature is the contradiction degree between the set of elements, which improves the plithogenic operation accuracy. This feature compares the dissimilarities between the dominant attributes and the set of attributes. The second feature is the appurtenance degree of the attribute value, which we discuss in detail in the next section.
The three representations of c(v, D) can be fuzzy CF, intuitionistic fuzzy (CIF: V×V → [0,1]2), or neutrosophic (CN: V×V → [0,1]3). The contradiction degree function used in plithogenic set operators is needed for the Intersection (AND), Union (OR), Implication (=>), Equivalence (⇔), and other plithogenic aggregation operators that combine two or more attribute-value degrees [20].
Definition 1. Let 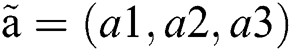 and
and 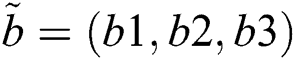 be two plithogenic sets.
The plithogenic intersection is:
The plithogenic union is:
where


where, 
The plithogenic complement (negation) is:

RN is the approximation of the upper and lower values of the original crisp value. It’s an efficient theory in decision making because the decision must be determined by a group of decision-makers rather than a single one. The rough number is inspired by the rough set theory proposed in [21]. Also, RN is regulated by lower and upper bounds vague information. Therefore it can effectively obtain the real decision-makers’ expectations and combine them in an accurate manner [22].
Definition 2. Suppose U is the universe containing objects, and there are n classes expressed as  ordered as
 ; then, the lower approximation
  and the upper approximation
  of
of  will be defined as:


Then,  can be expressed by RN as
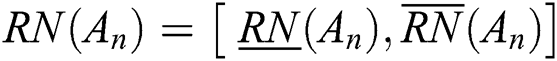 , where
  is the lower limit and
  is the upper limit, as:


where M L and M U are the number of objects contained in and
and  , respectively. The basic operations of rough numbers were proposed [22].
Definition 3. Let  and
and  be two rough numbers, where
  and
and  ; so:
; so:


Definition 4. Let  , which is the summation of the upper and lower limits, and
  , which is the subtraction of the lower and upper limits. For
  and
and  two rough numbers,
• If  , then
  ;
;
• If  and
and  , then
  ;
;
• If  and
and  , then
  .
.
BWM is an efficient and straightforward pairwise comparison of MCDM problems that compare the most preferred (best) criterion and the least desired (worst) criterion with the rest of the problem criteria [23]. A framework based on the BWM to evaluate the financial performance to compare dynamic analysis and cross-sectional analysis was suggested in [24]. Also, sustainable supplier selection criteria were evaluated using BWM [25]. BWM consists of five steps:
Step 1: The set of criteria A is defined by a committee of decision-makers  based on the scope of the problem as
 .
.
Step 2: Determine the Best AB and Worst AW criterion from the set of criteria A according to the decision-maker preferences.
Step 3: Construct the best-to-other vector }, where
  is the preference of criteria n compared by the Best criterion B using a (1–9) scale.
Step 4: Construct the others-to-worst vector }, where
  is the preference of criteria n compared by the Worst criterion W using a (1–9) scale.
Step 5: Propose the BWM model that evaluates the weight of the criteria  :
:
Min 
s.t.
 , for all j
 , for all j

 , for all j
MABAC method is a recent MCDM technique that evaluates a set of criteria to find the best alternative. This method compares the relevant distance ideal and anti-ideal solution, and it is valuable when the problem has enormous alternatives or criteria [10].
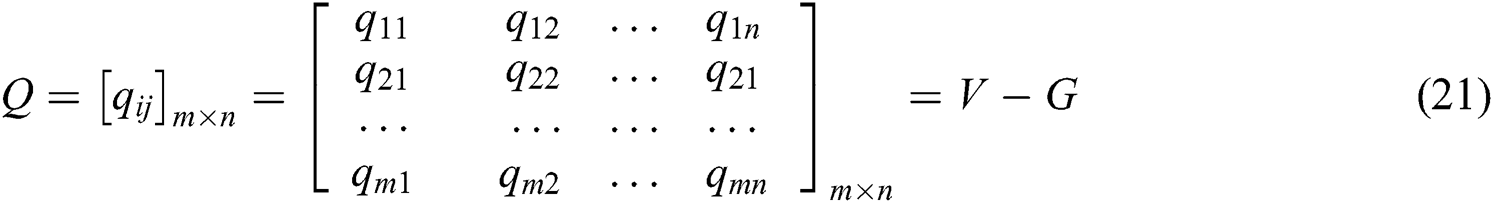
• Step 1: Construct the decision-making matrix  based on the committee of decision-makers (DMs), which evaluates the alternatives m according to the set of criteria n.
• Step 2: Compute the normalized decision matrix:

where,
• Step 3: Calculate weighted matrix element:

• Step 4: Determine the border approximation area (BAA) matrix:

• Step 5: Calculate the distance between each alternative and the BAA:
Alternative m may belong to three regions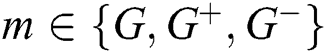 as Fig. 1 shows:
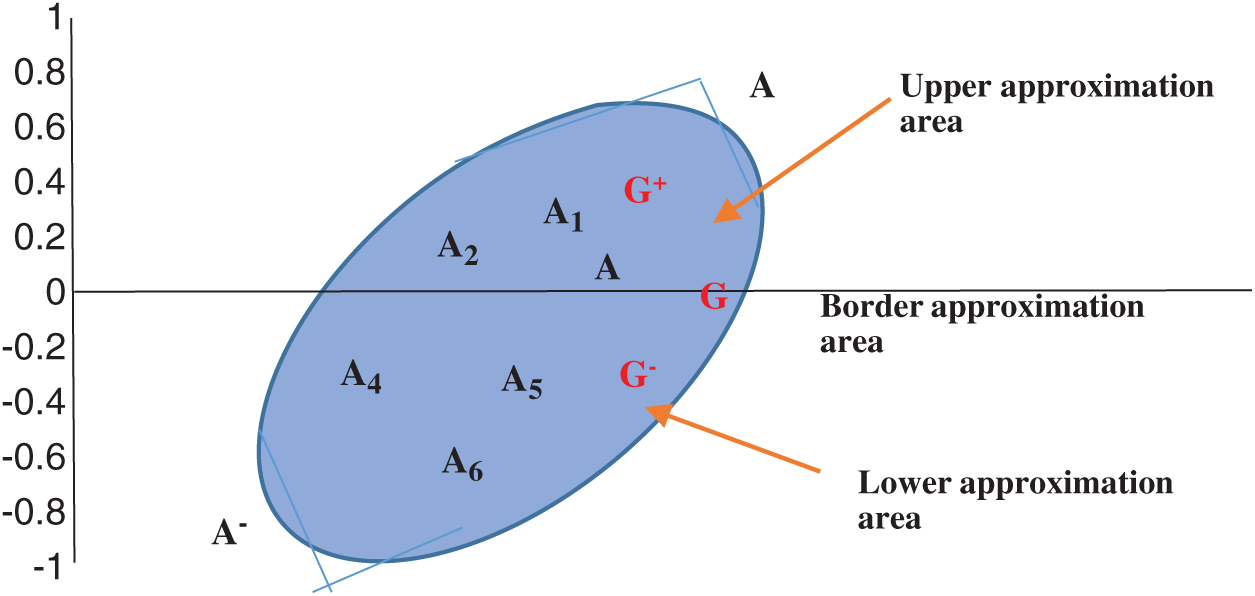
Figure 1: Border approximation area
1. Belong to the BAA (G)
2. Upper approximation area (G+)
3. Lower approximation area (G-)
• Step 6: Rank the alternatives and find the best solution.

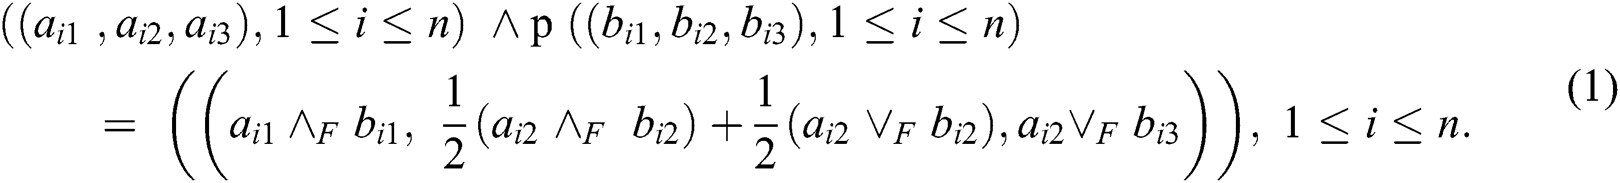
This research proposes an integrated approach to disband a supplier selection problem taking into consideration ambiguous information. This approach integrates the features of the four techniques and methods. Firstly, the plithogenic set aggregation features concentrates on providing more accurate aggregation results while considering uncertainty. Secondly, rough numbers consider the higher and lower limits of the information to handle vague information; thirdly, BWM evaluates a set of criteria in MCDM problems; and finally, the MABAC method determines the optimal alternative compared with a group of criteria by measuring the distance of alternatives with the BAA. The value of integrating these methods lies in the development of a more effective decision model. Rough numbers and plithogenic sets support the proposed model to have a more accurate and consistent decision and solve the problem of information ambiguity in an uncertainty environment. The process of the proposed model is summarized in Fig. 2.
Figure 2: Proposed model’s main steps
• Step 1: A group of DMs with experience in the problem scope must be chosen,  and the set of criteria that control the problem
 must be determined, together with the alternatives that need to be compared to find the best one
 .
.
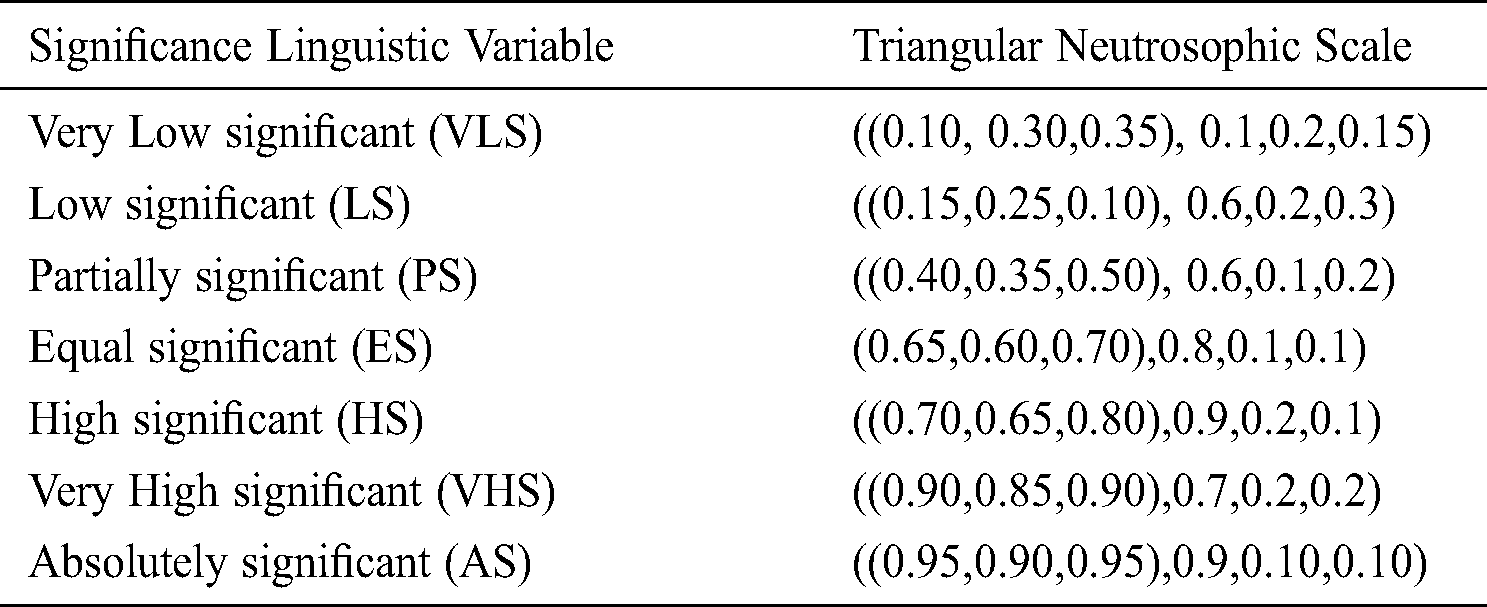
• In order to evaluate the alternatives to the criteria by a group of DMs, identify an evaluation scale. In this research, TNN is employed used in a linguistic scale (Tab. 1).
• Step 2: Express the evaluation matrix values as rough numbers to consider the uncertain information and define the upper and lower limits of the evaluation, as explained in detail in Section 3.3.
• Step 3: Aggregate the decision maker’s evaluation using plithogenic aggregation operator as discussed in Eqs. (1), (3), (4).
• Define the contradiction degree that establishes the relation between the most preferred (dominant) criterion and other criteria. This feature improves the accuracy of the aggregation operation.
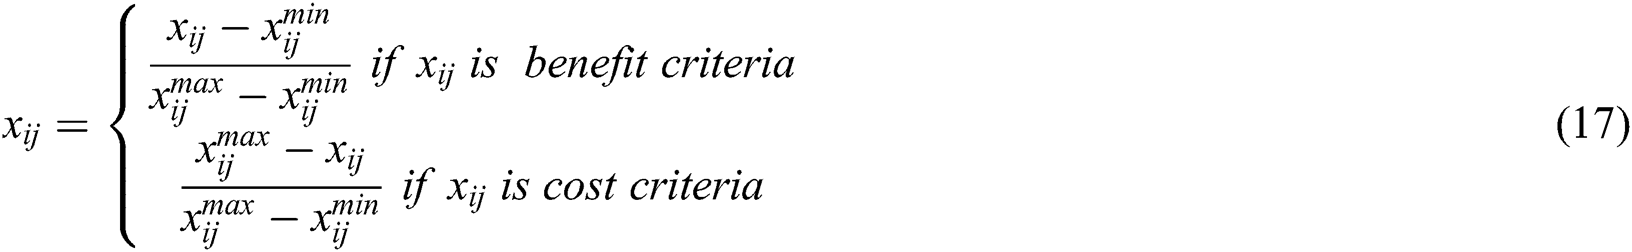
• Step 4: Normalize the decision matrix using Eqs. (16), (17), considering whether the criterion is benefit and cost criteria.
• Convert the neutrosophic evaluation values to crisp values, as in Eq. (23).

• Step 5: Find the weighted decision matrix based on BWM.
• Find the best, and the worst criterion according do decision-makers experience or preference
• Construct the best-to-other vector and others-to-worst vector based on the scale [0,1]
• Use the BWM model (24,25) to find the weight vector
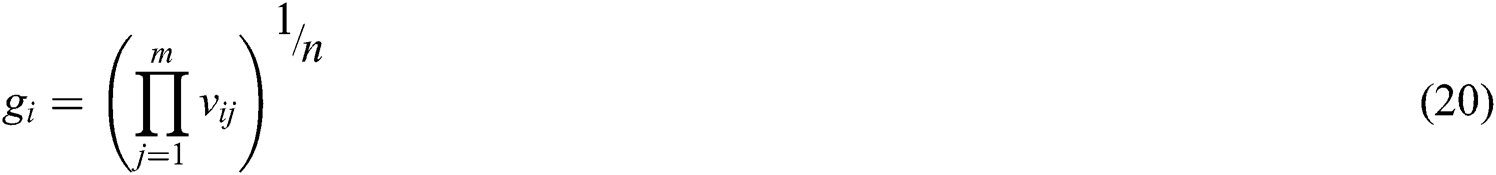
• Step 6: Calculate the BAA matrix using Eqs. (19), (20).
• Step 7: Find the distance between the alternatives and BAA matrix to define the alternatives in the upper approximation area, BAA, and lower approximation area, as in Eq. (21).
• Step 8: Using Eq. (22), rank the alternatives.
5 Numerical Application and Results
The proposed approach evaluates a major MCDM problem, which is the supplier selection in the healthcare industry. As a case study, we simulate a supplier selection at a private healthcare firm in Malaysia that owns both a wholesaler and a chain of medical clinics. Wholesaler includes an administrative center and a single warehouse that collects products from five different suppliers. They are seeking to find the best supplier to execute a large supply order.
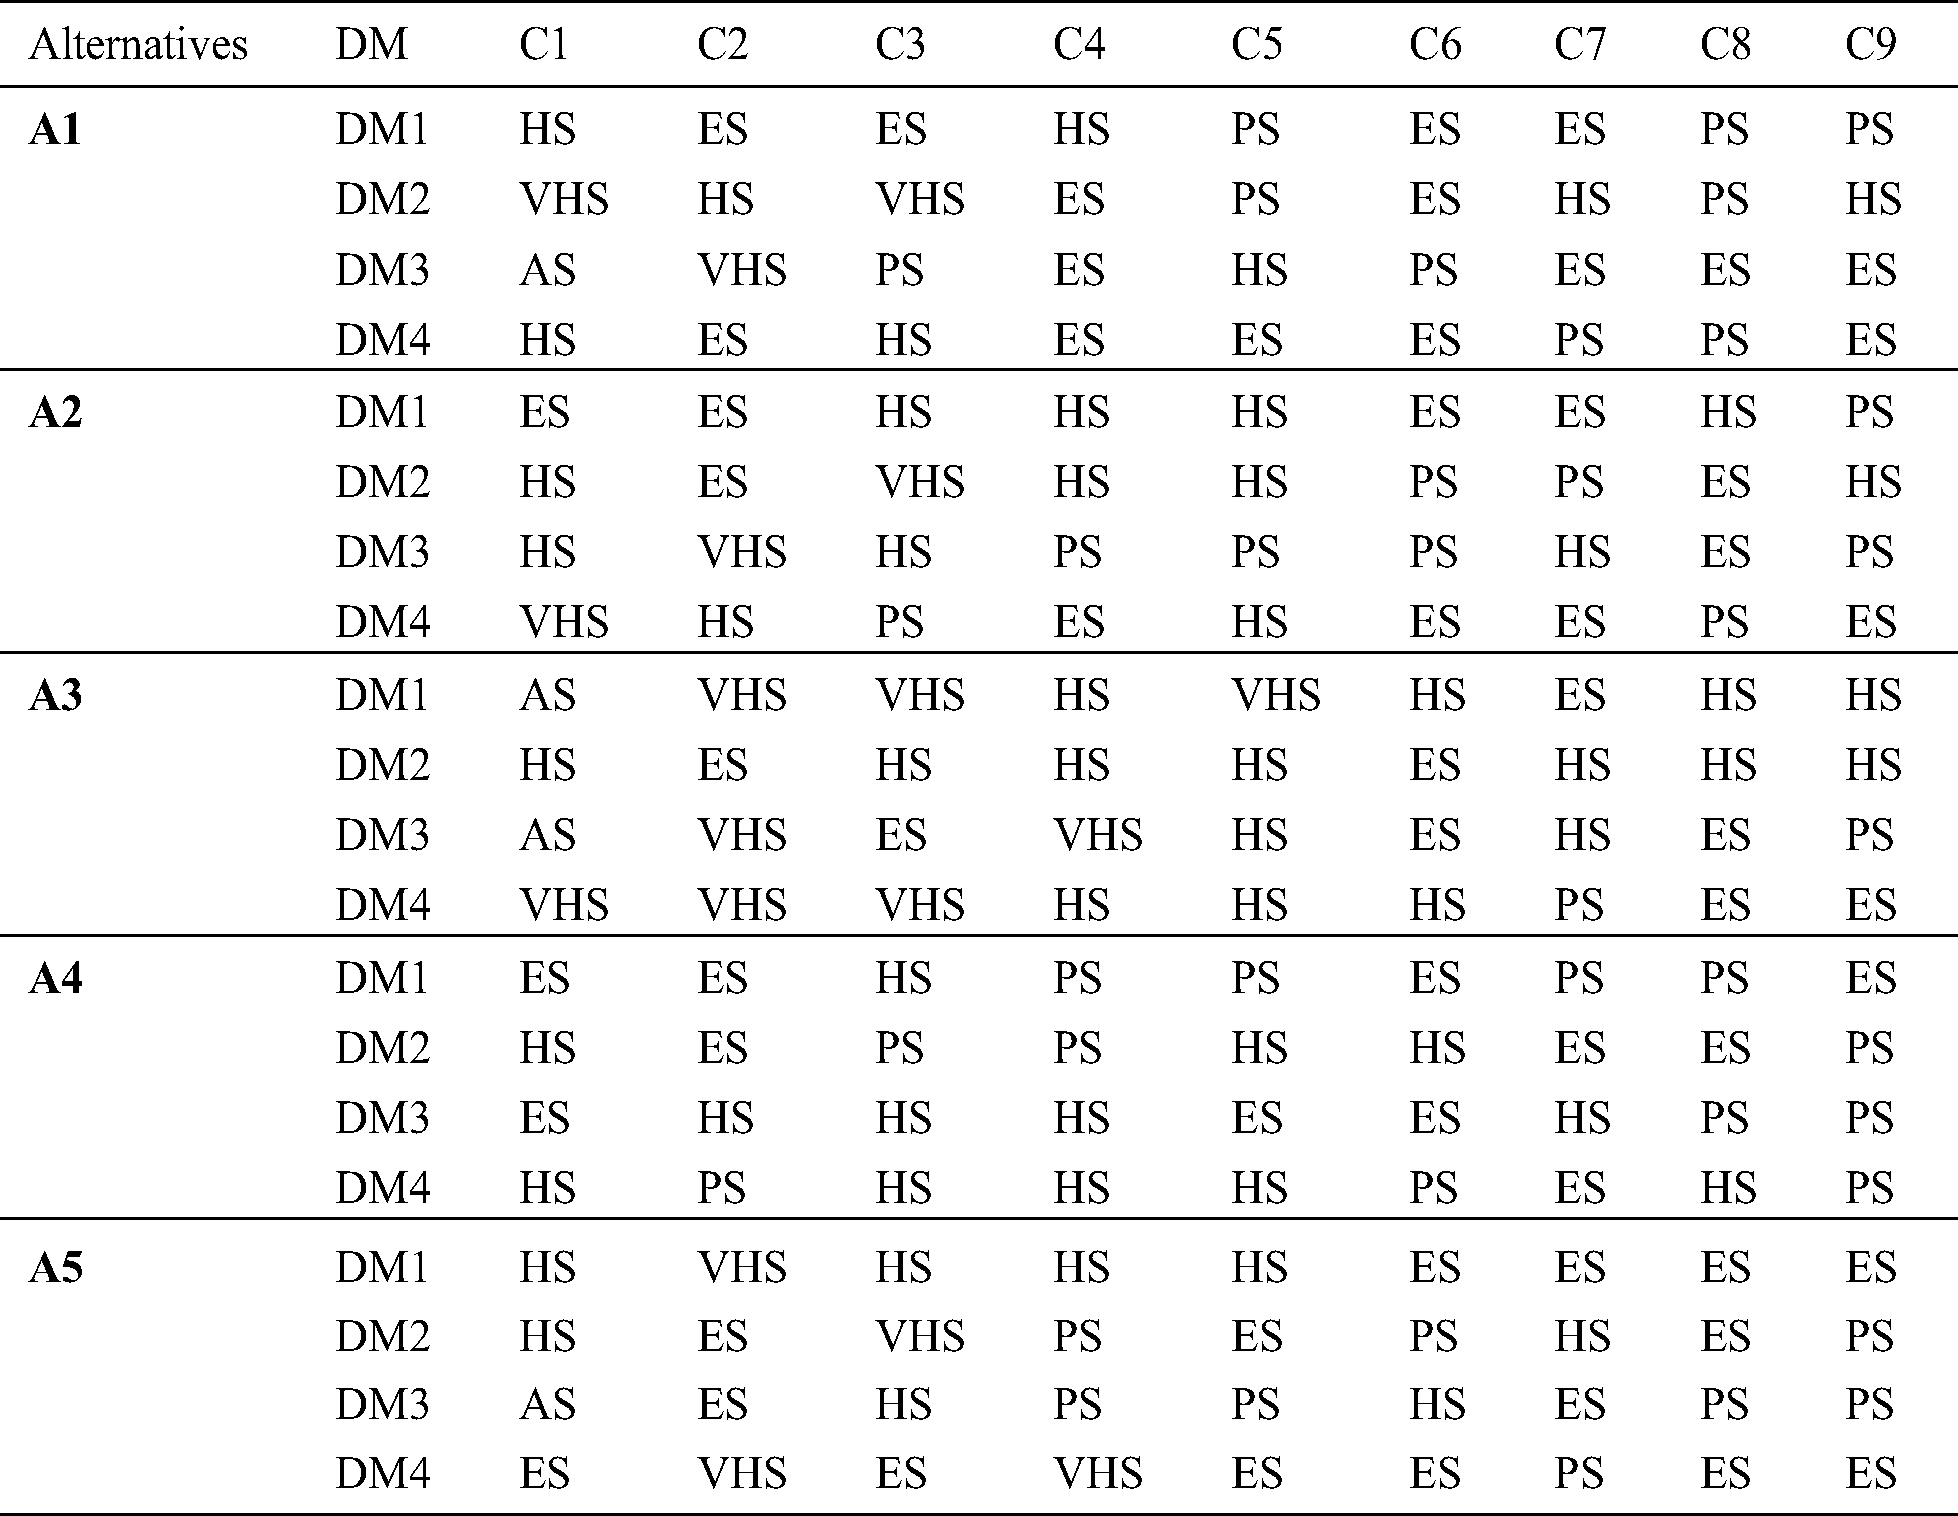
A committee of four experts who have a long experience in healthcare devices met to help in this decision. They defined a set of nine criteria that must be considered while evaluating the five alternatives. These criteria are:
– product quality (C1),
– supplier expedites emergency orders (C2),
– supplier adequately test new products (C3),
– technology service: problem-solving (C4),
– technology service: responsiveness (C5),
– the supplier provides technical assistance (C6),
– the supplier provides notice of product problems (C7),
– consistency of delivered product (C8), and
– accuracy in filling orders (C9).
The hierarchy of this case is presented in Fig. 3.
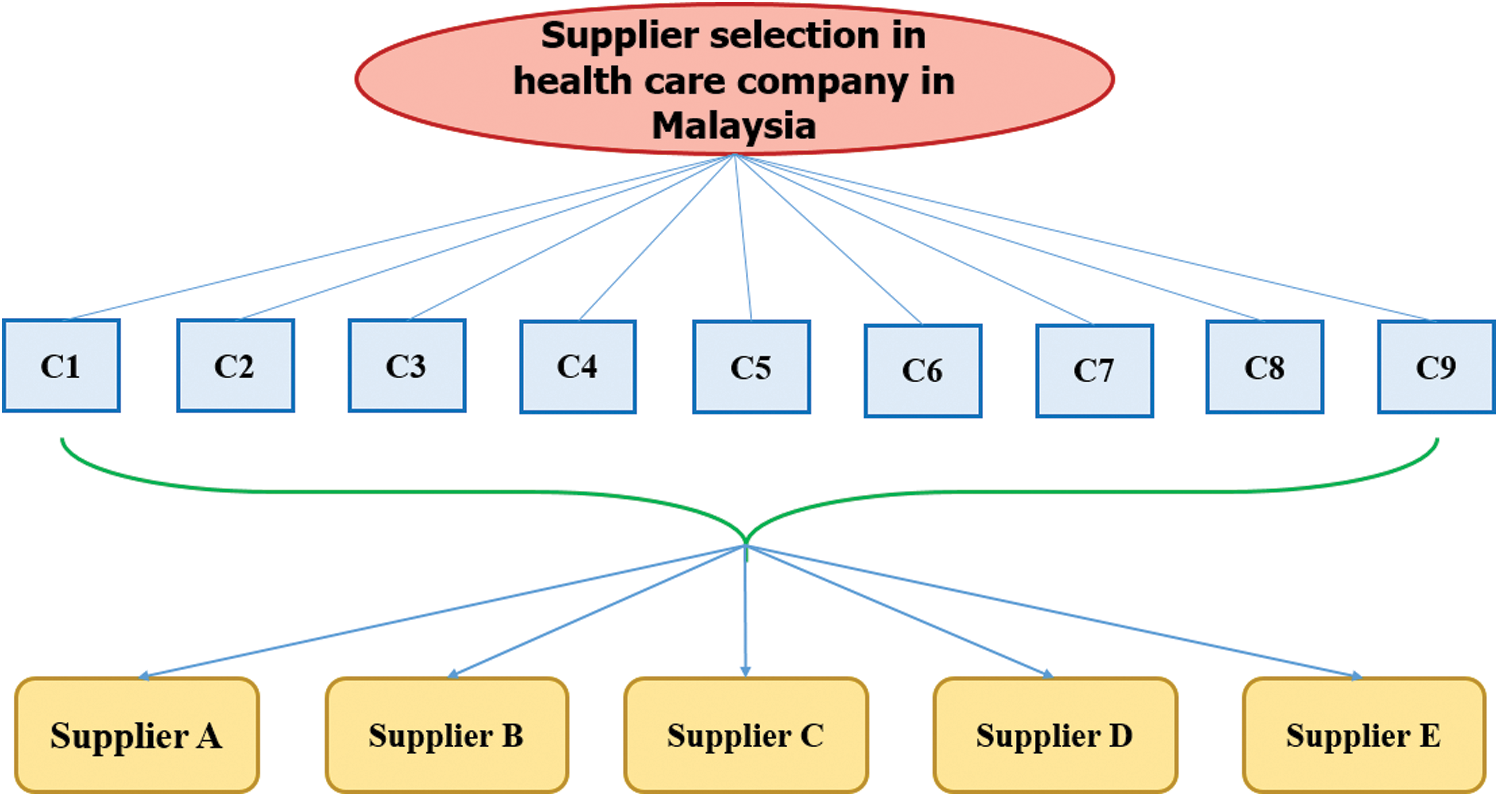
Figure 3: Healthcare industry hierarchy
Applying the proposed integrated approach in the case of a health care company in Malaysia will be as follows:
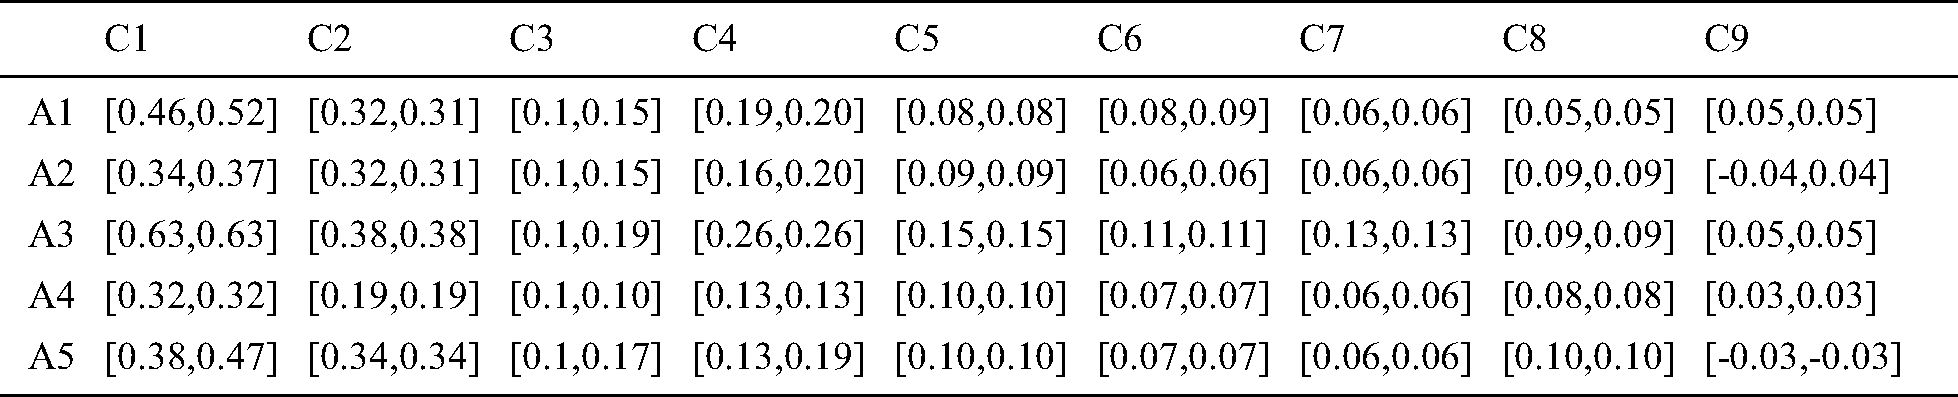
According to the neutrosophic linguistic scale in Tab. 1, the five suppliers will be evaluated by the group of decision-makers, as in Tab. 2:
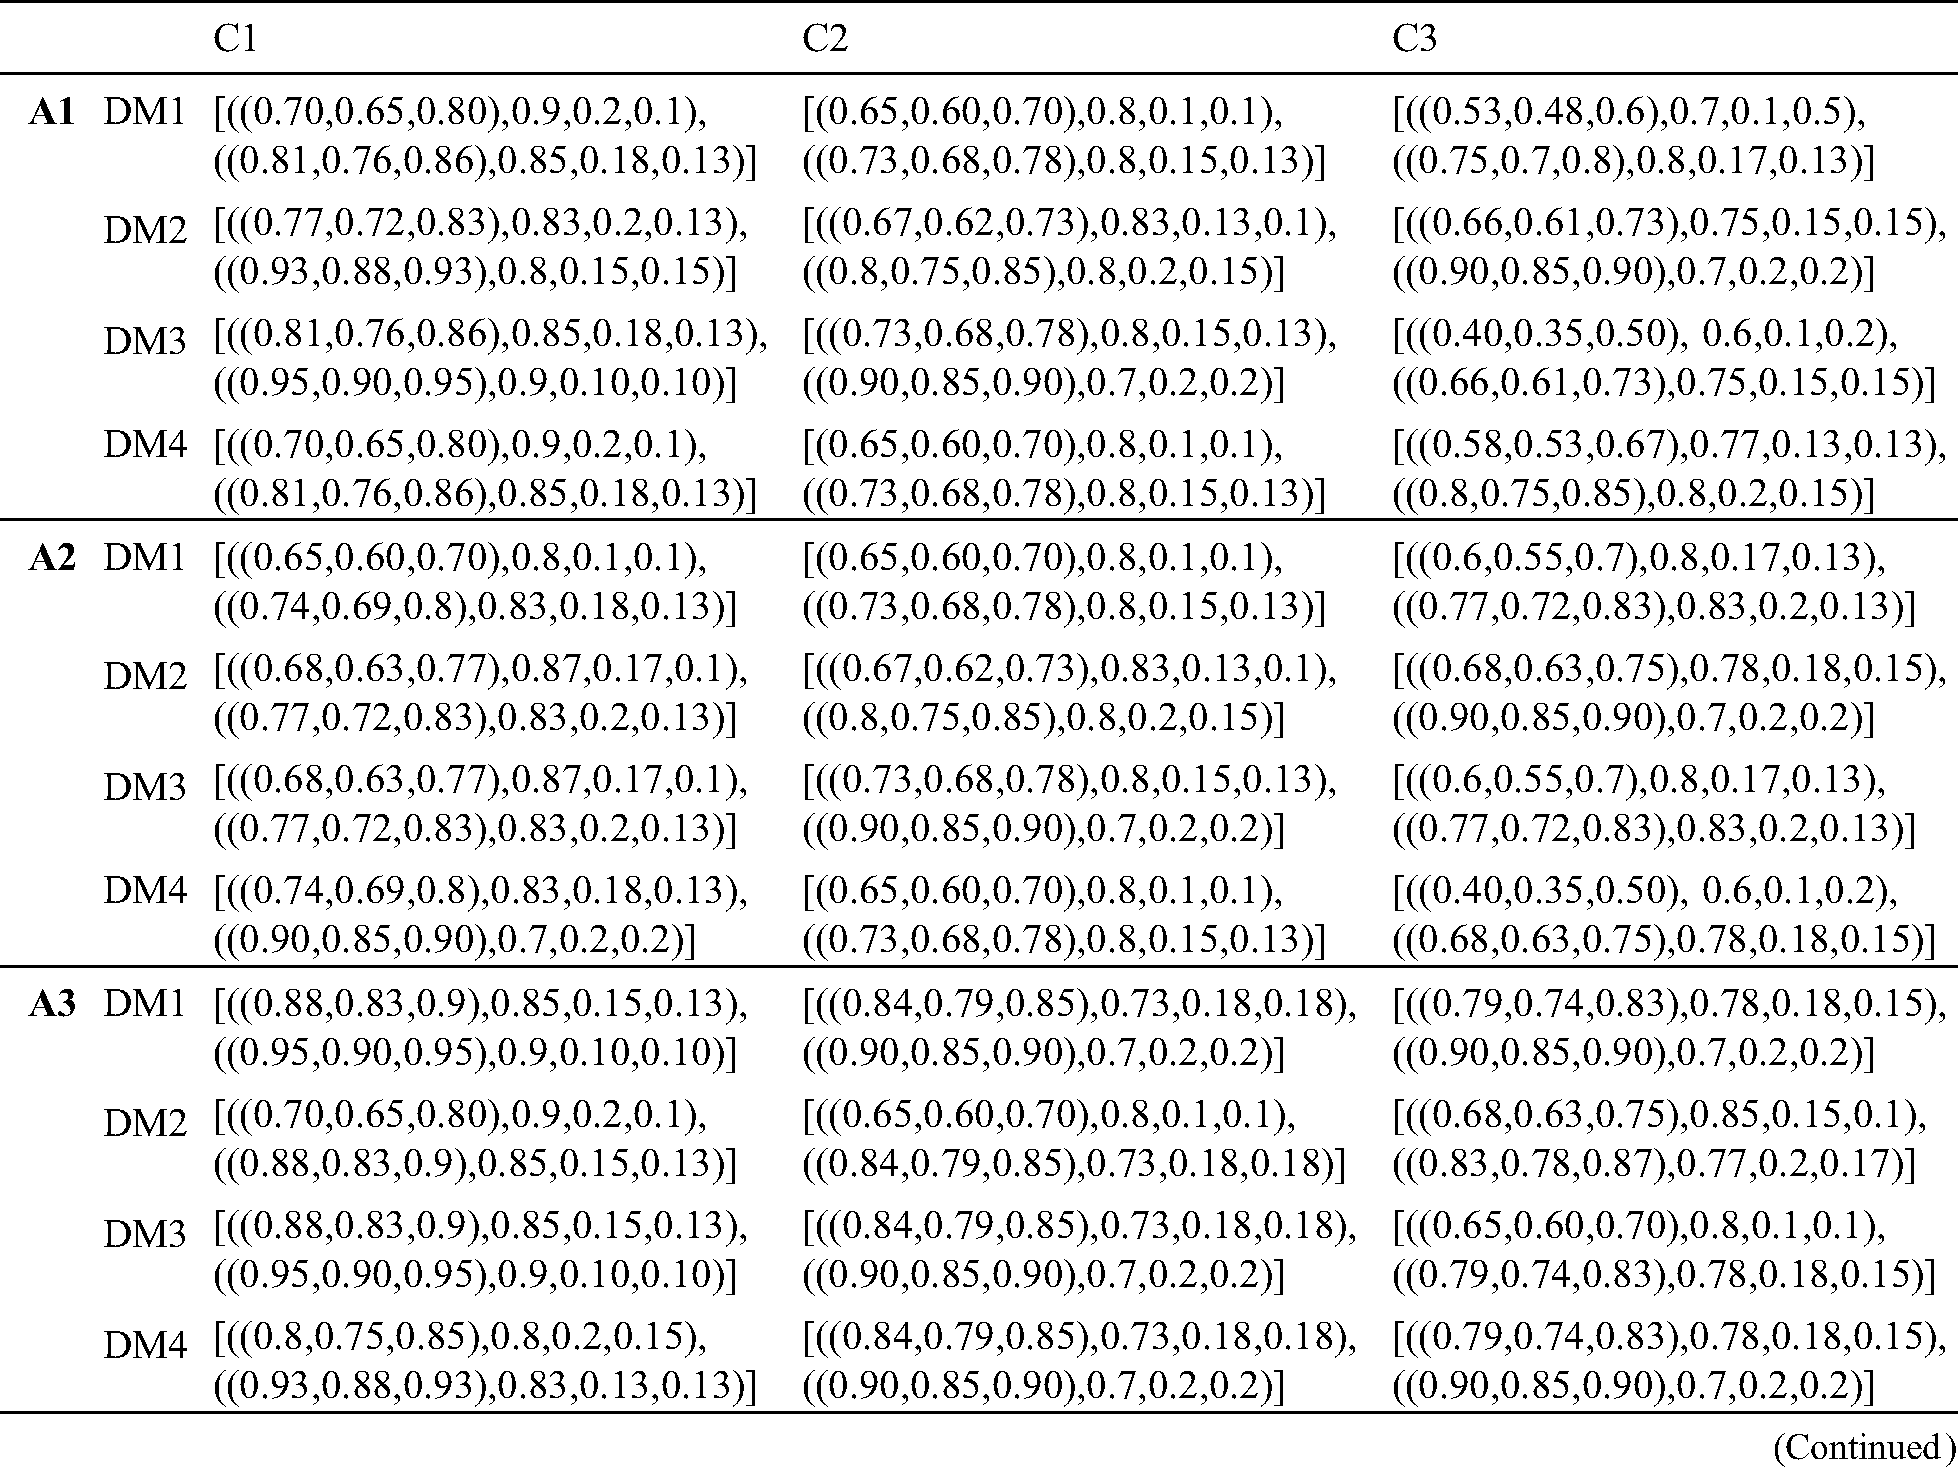
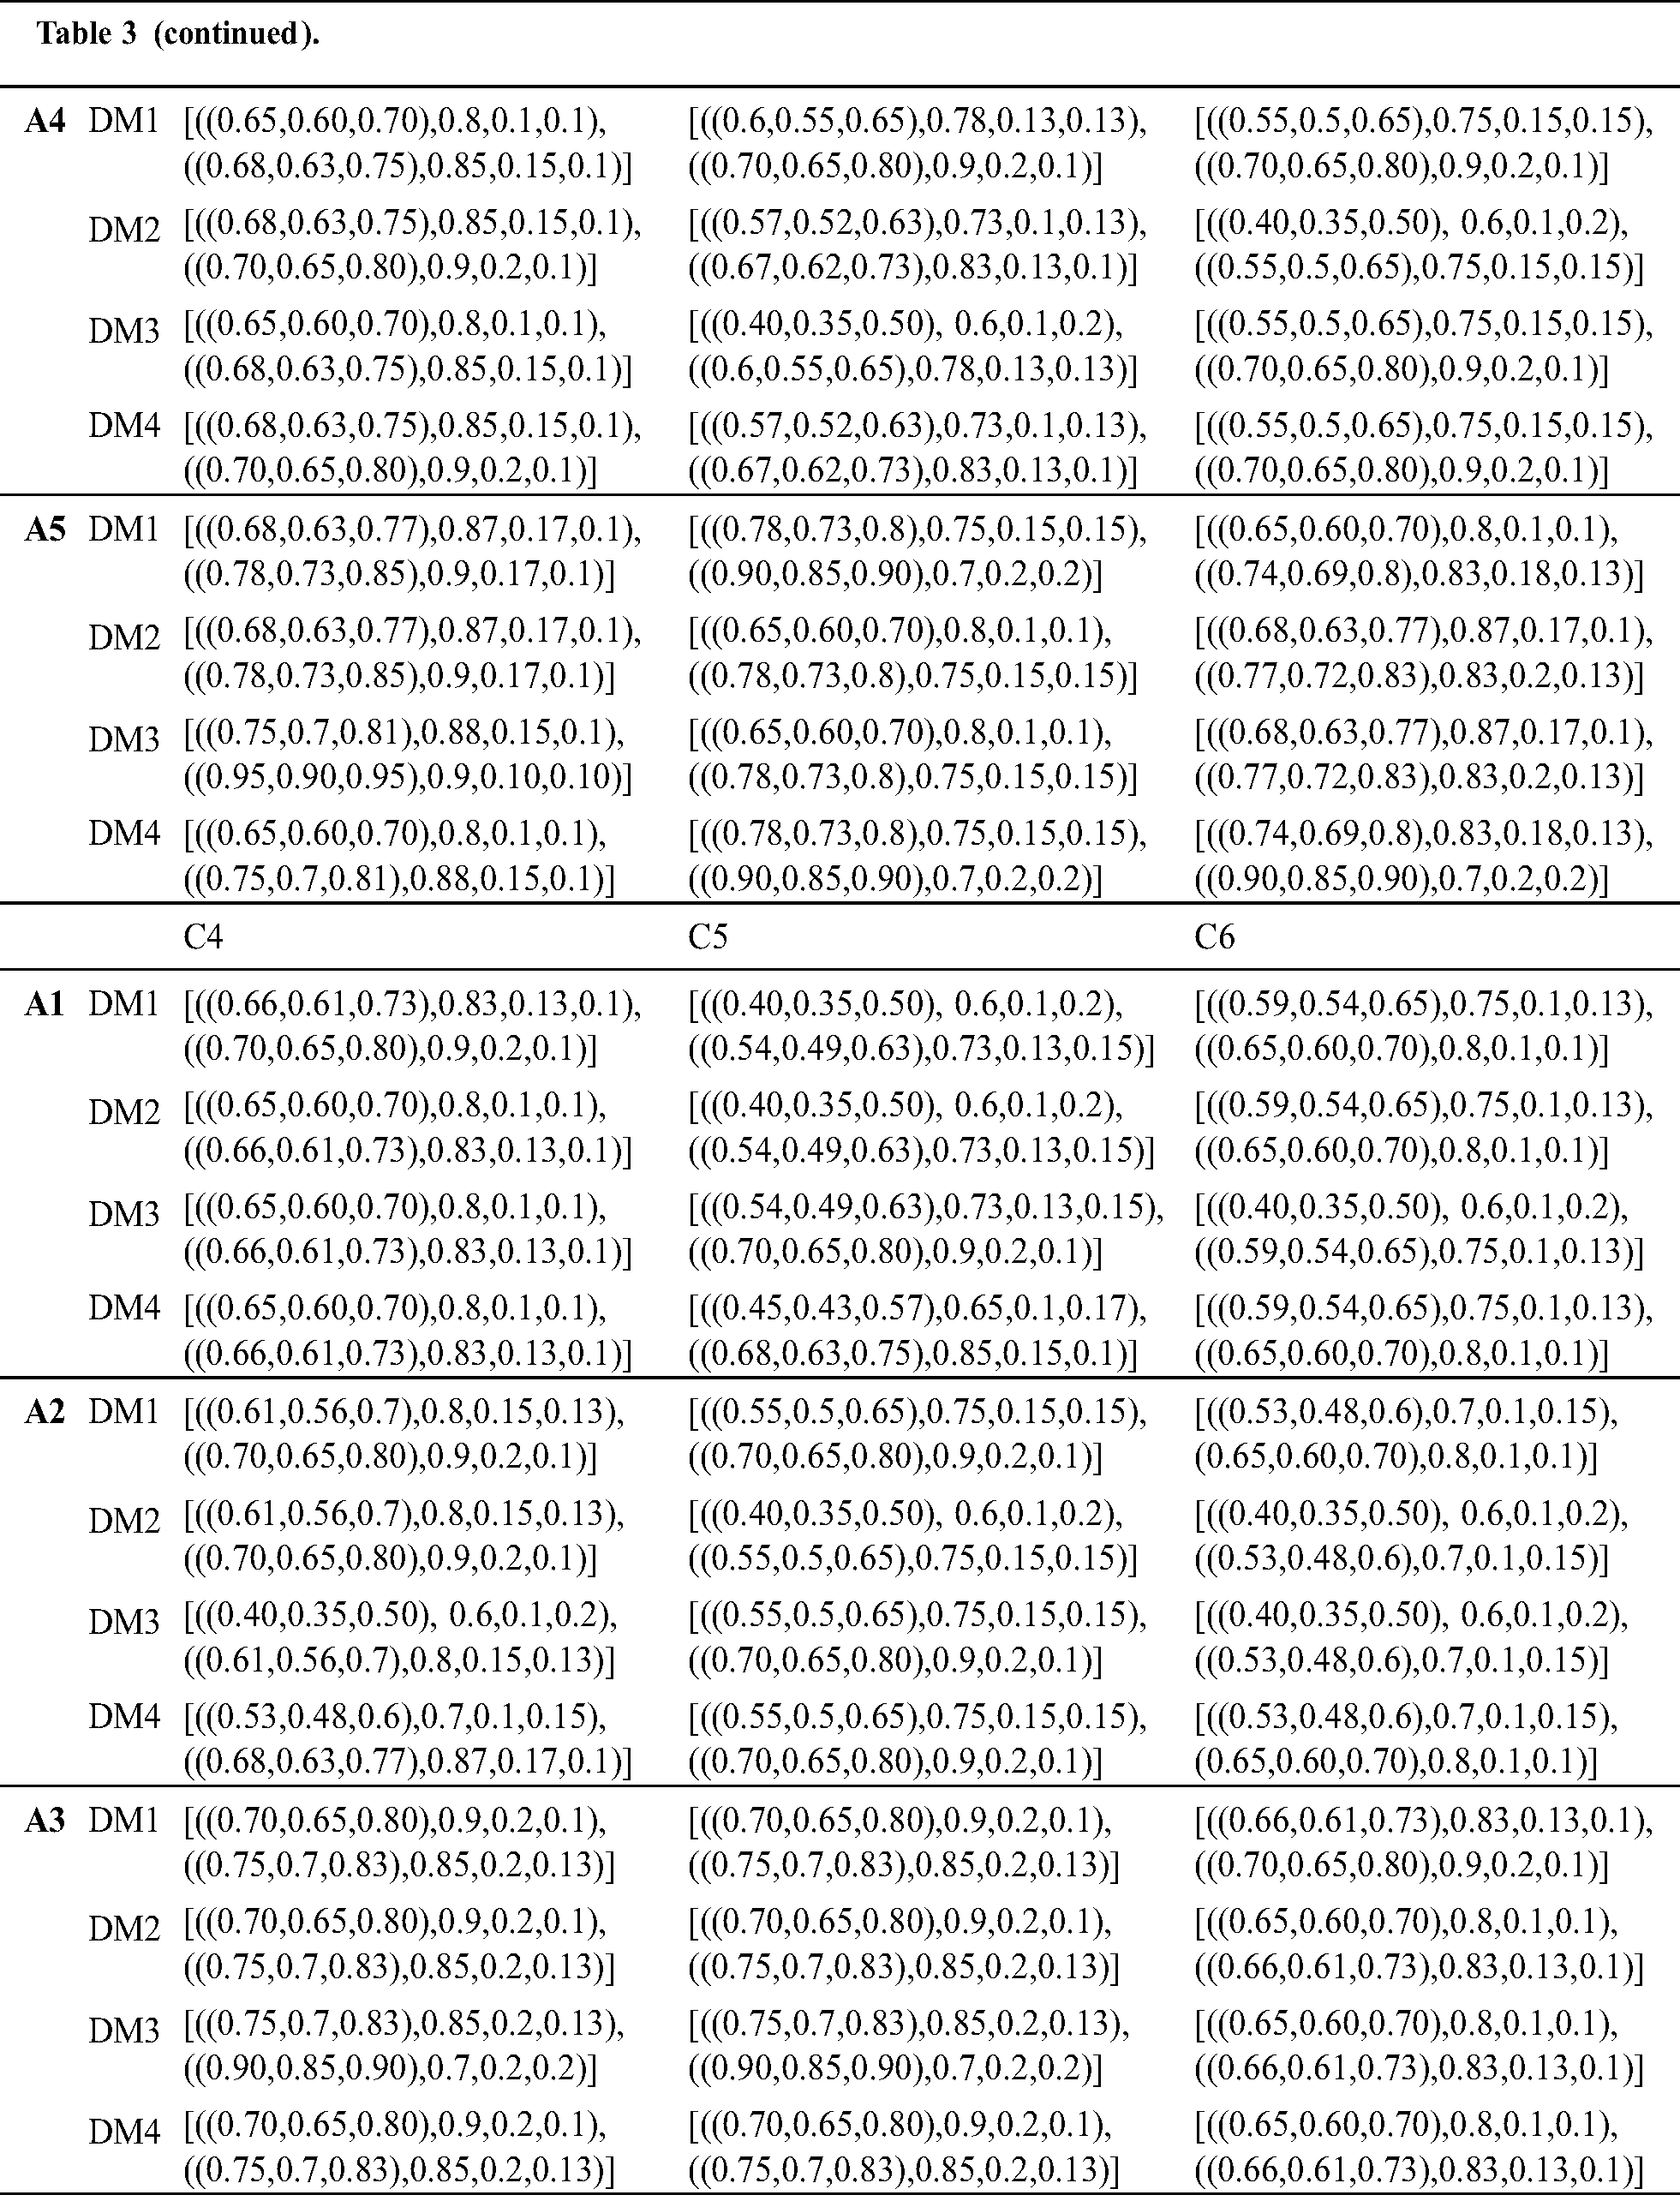
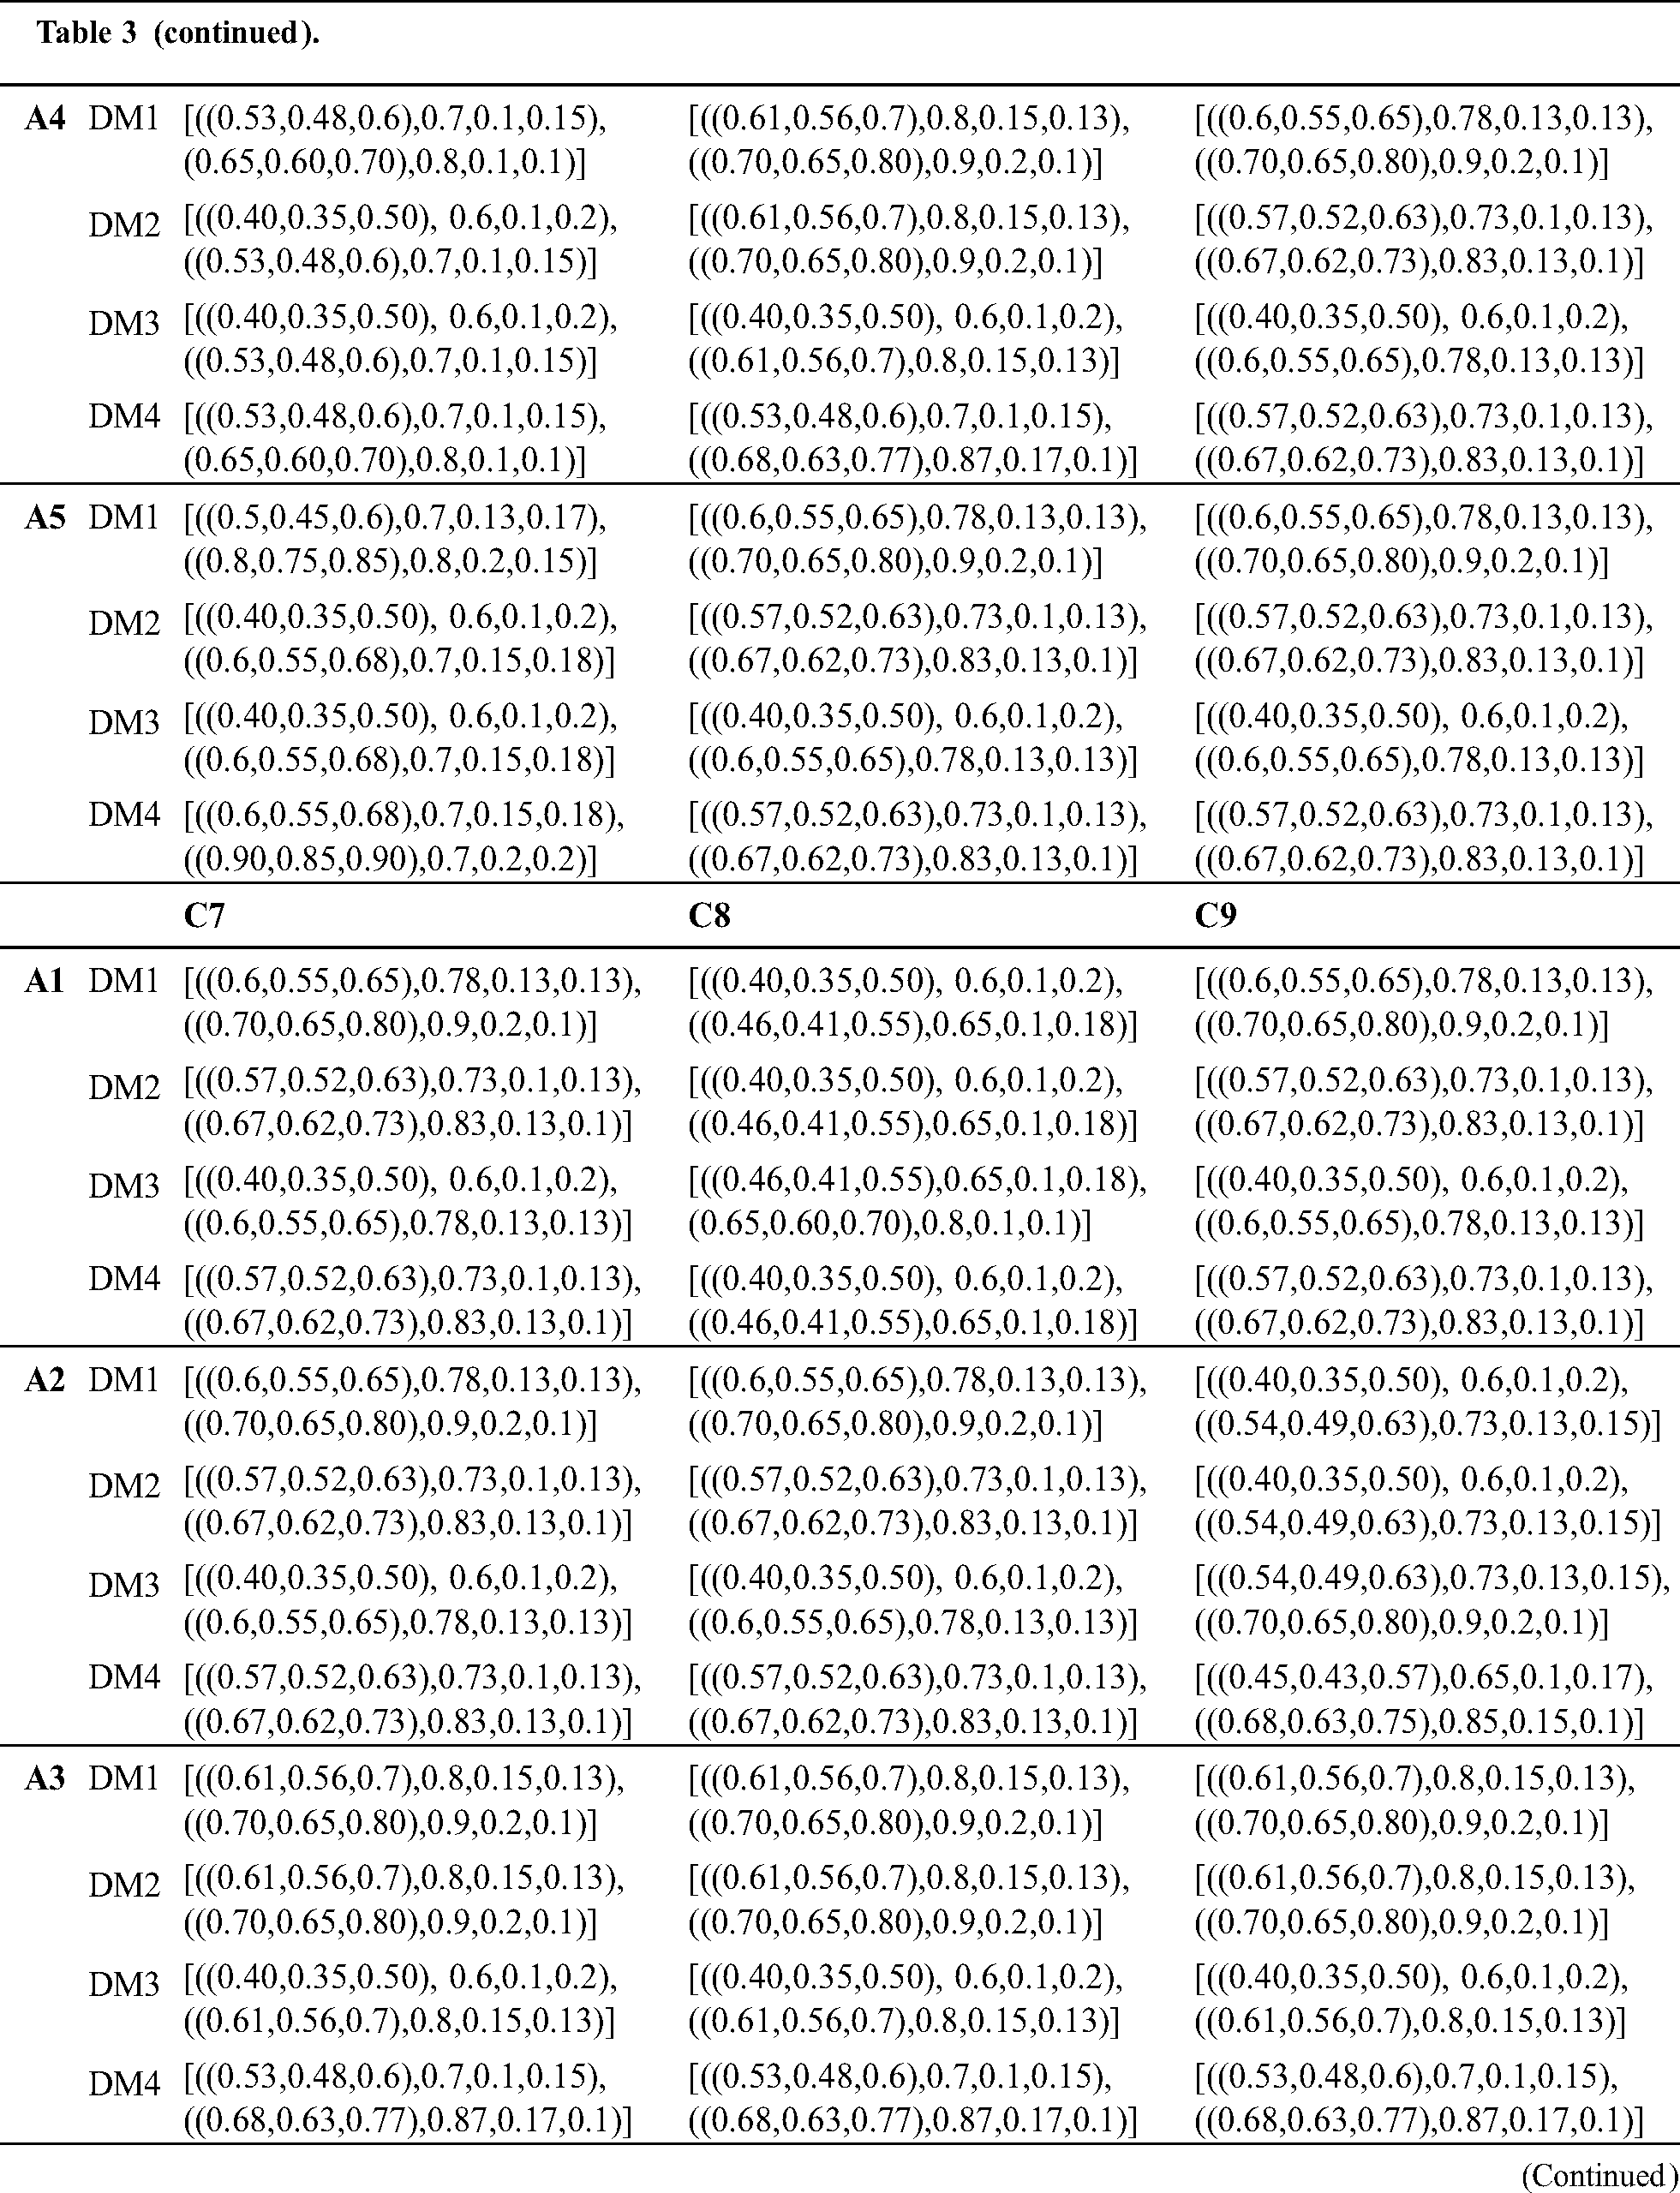
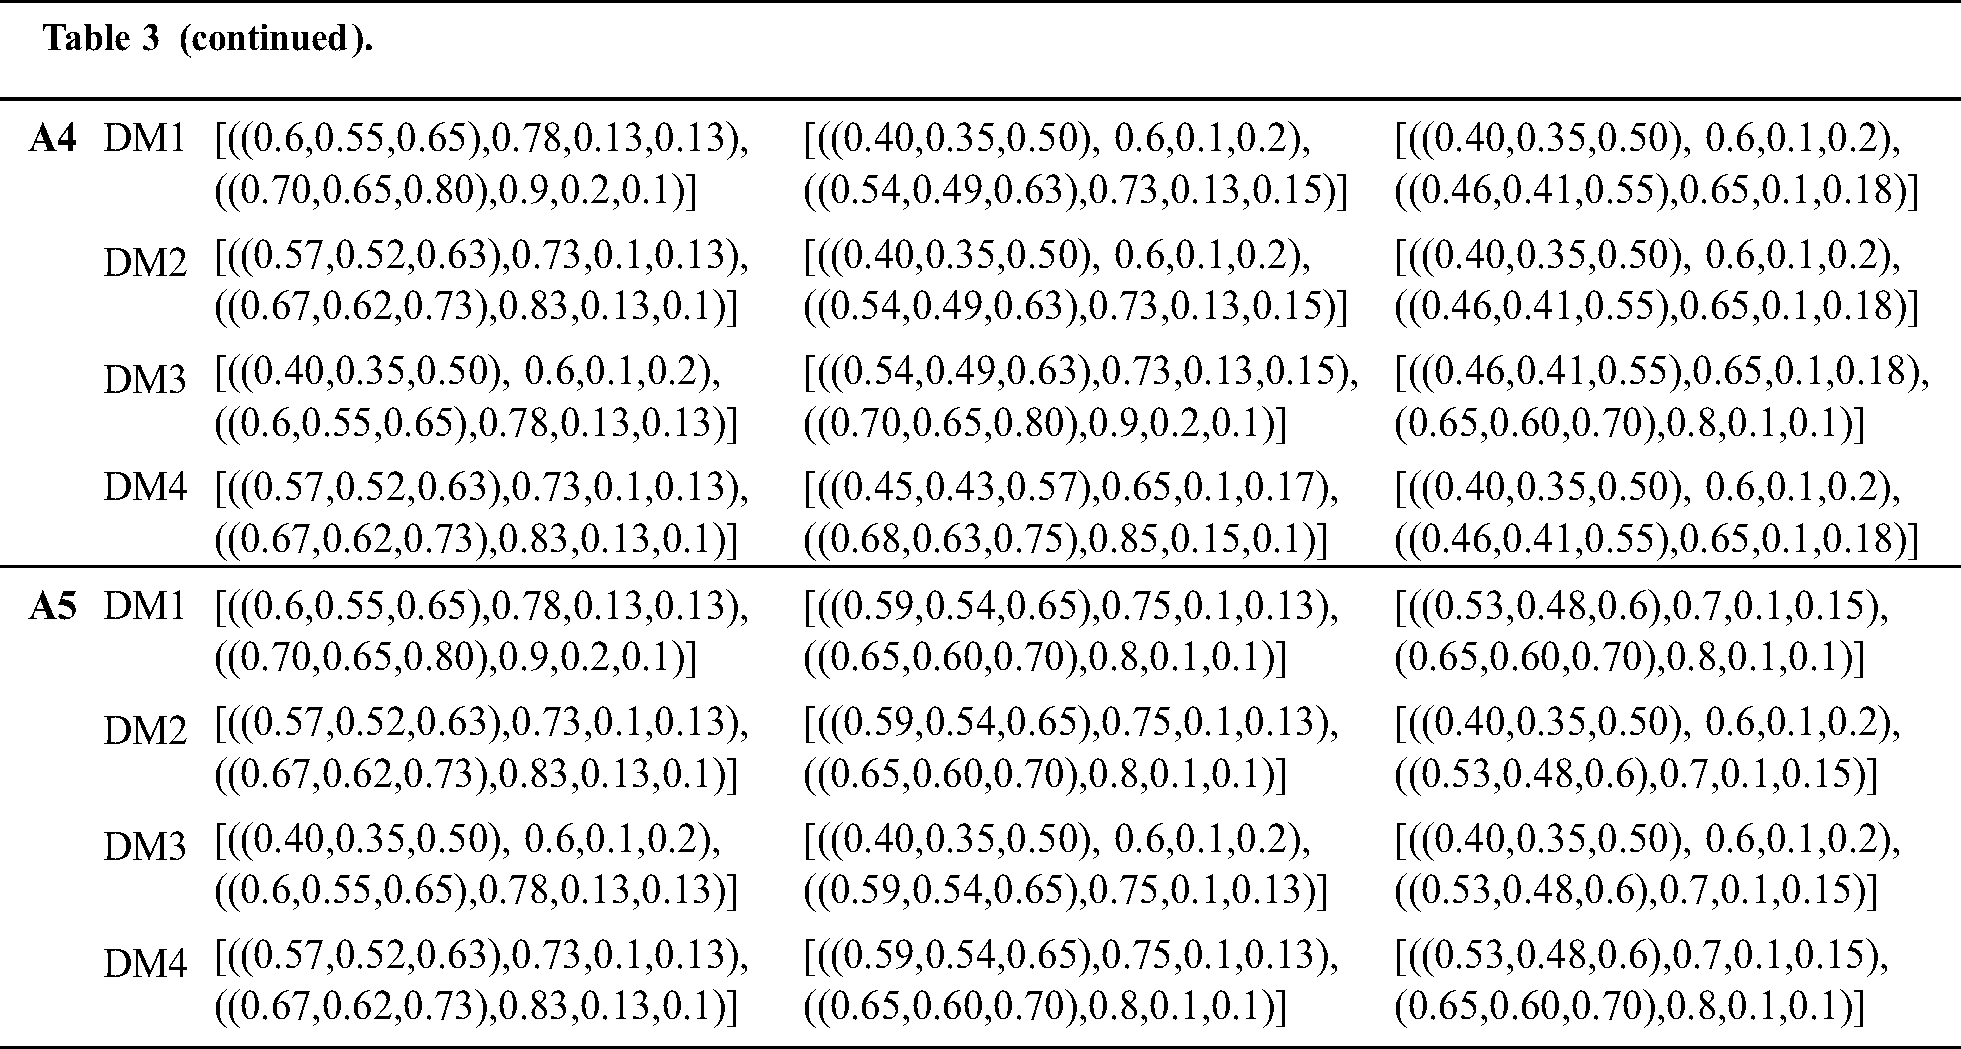
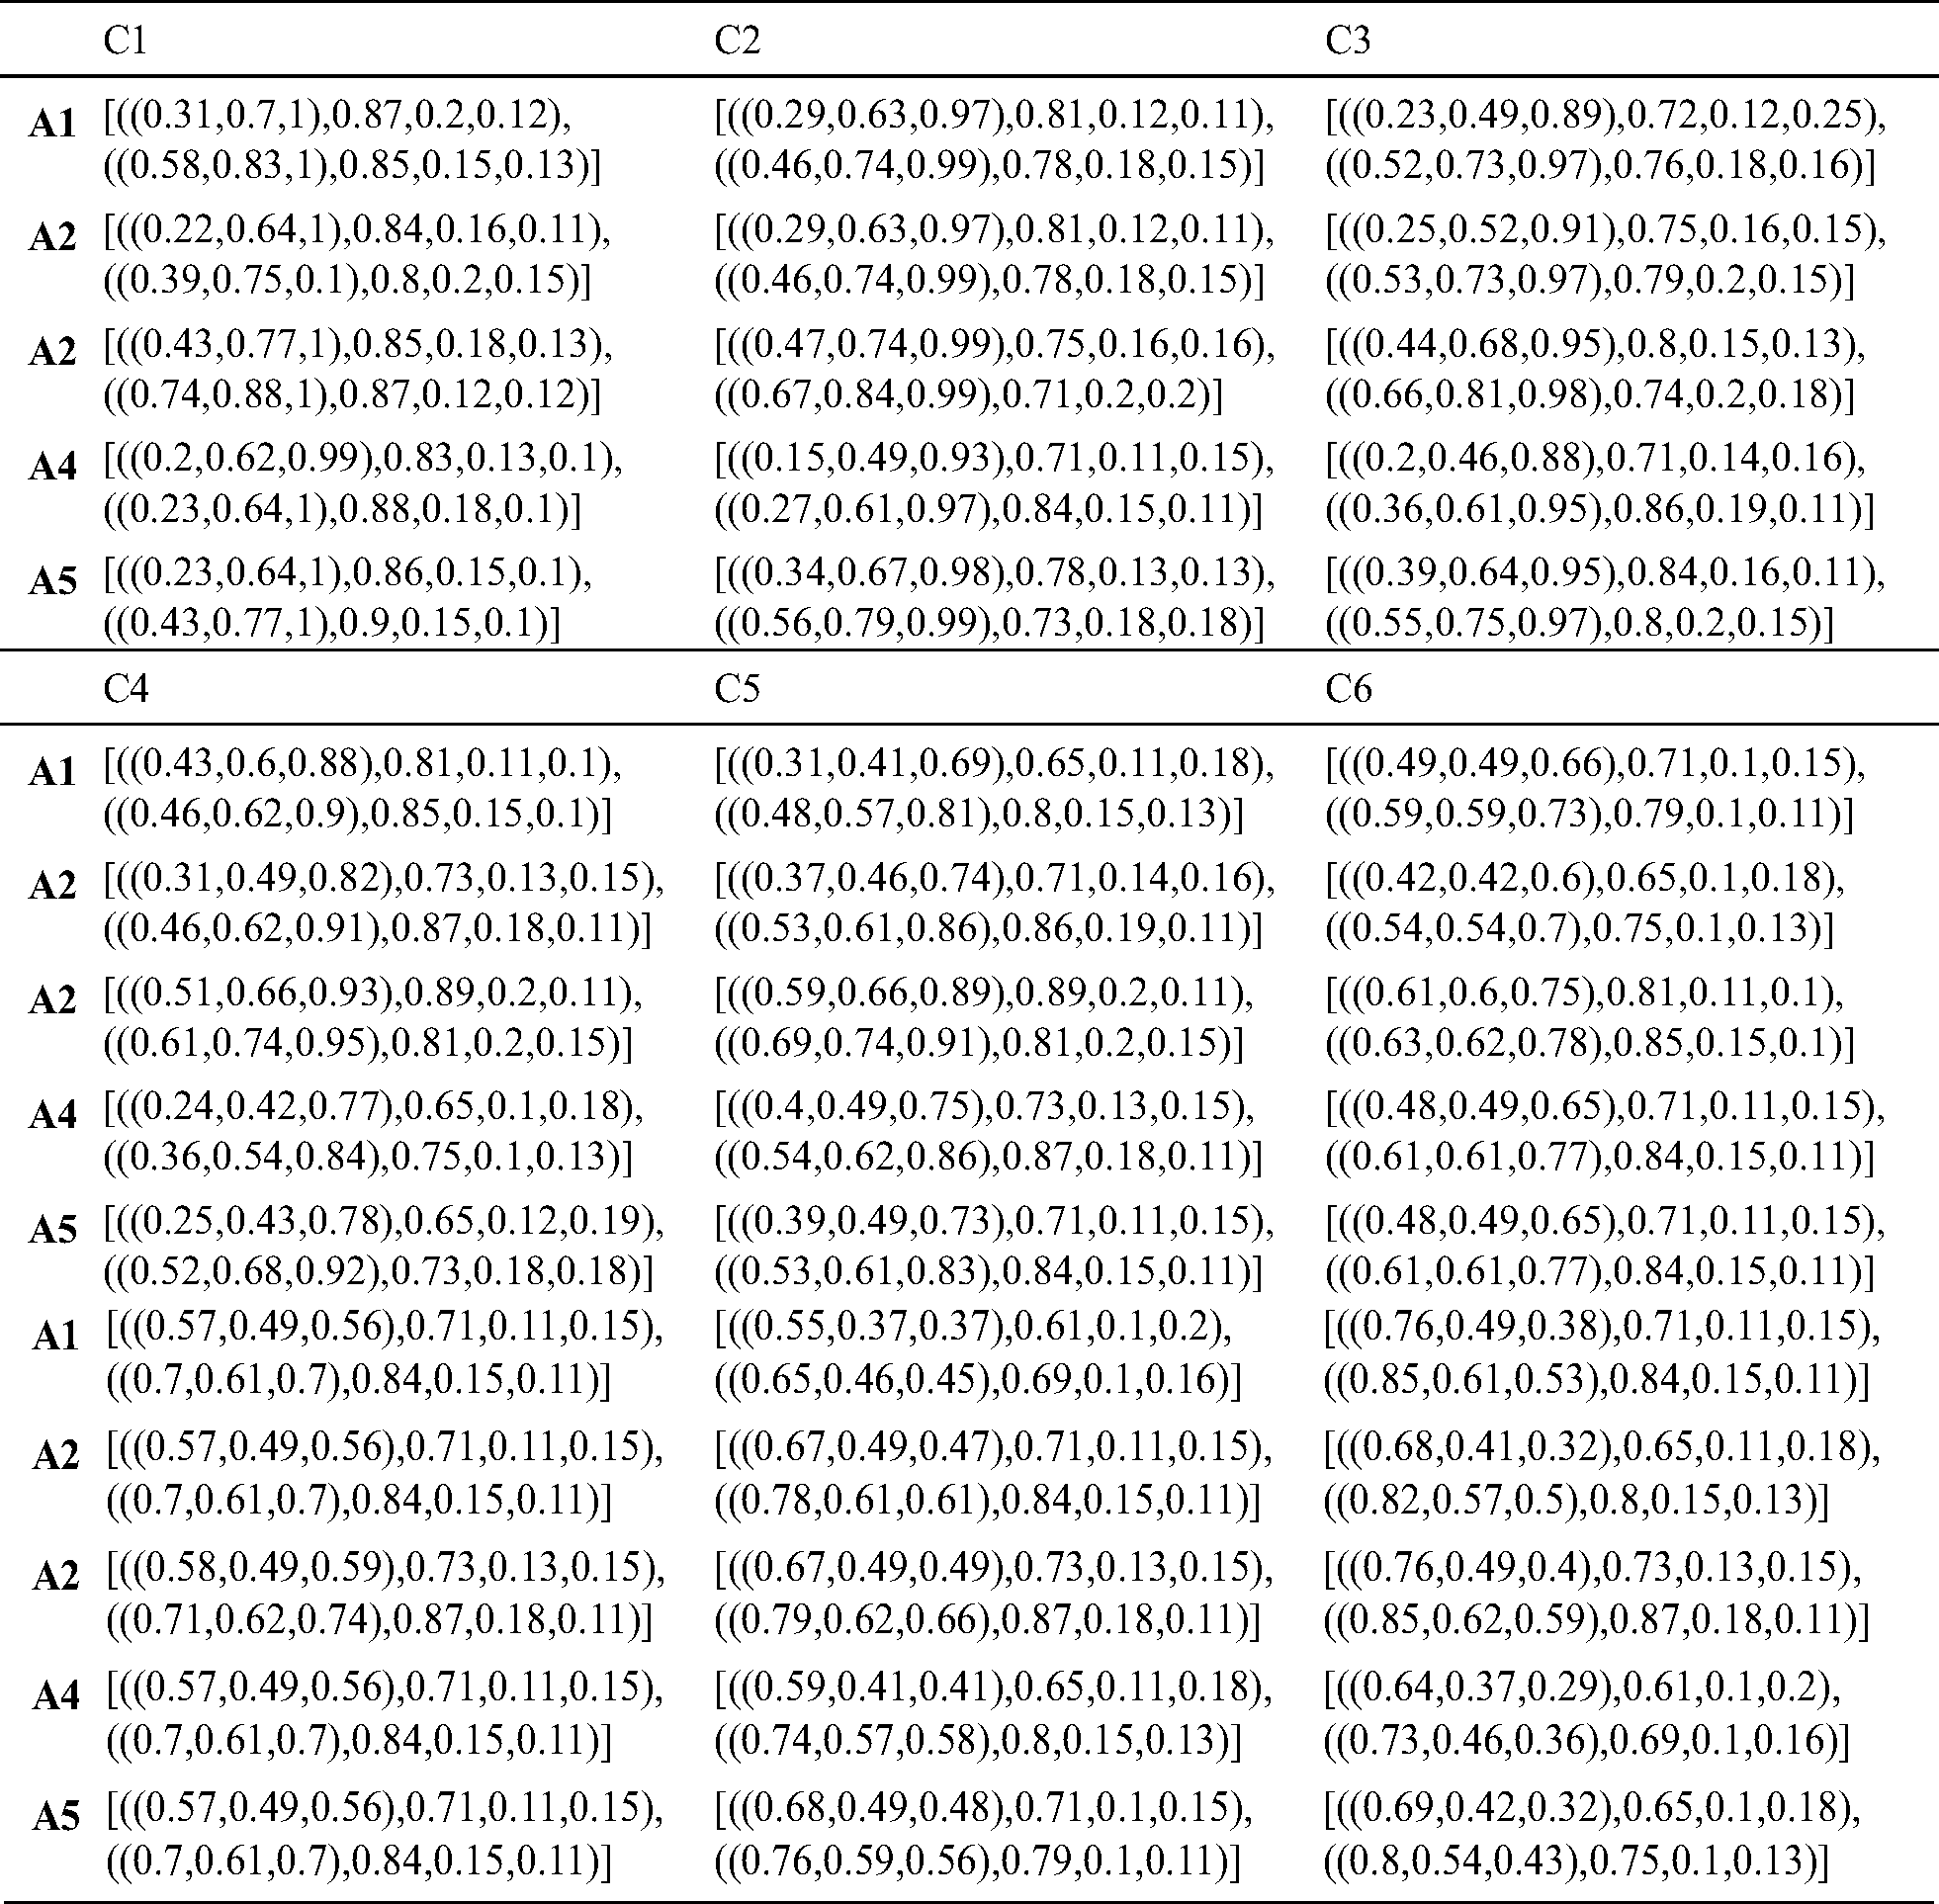
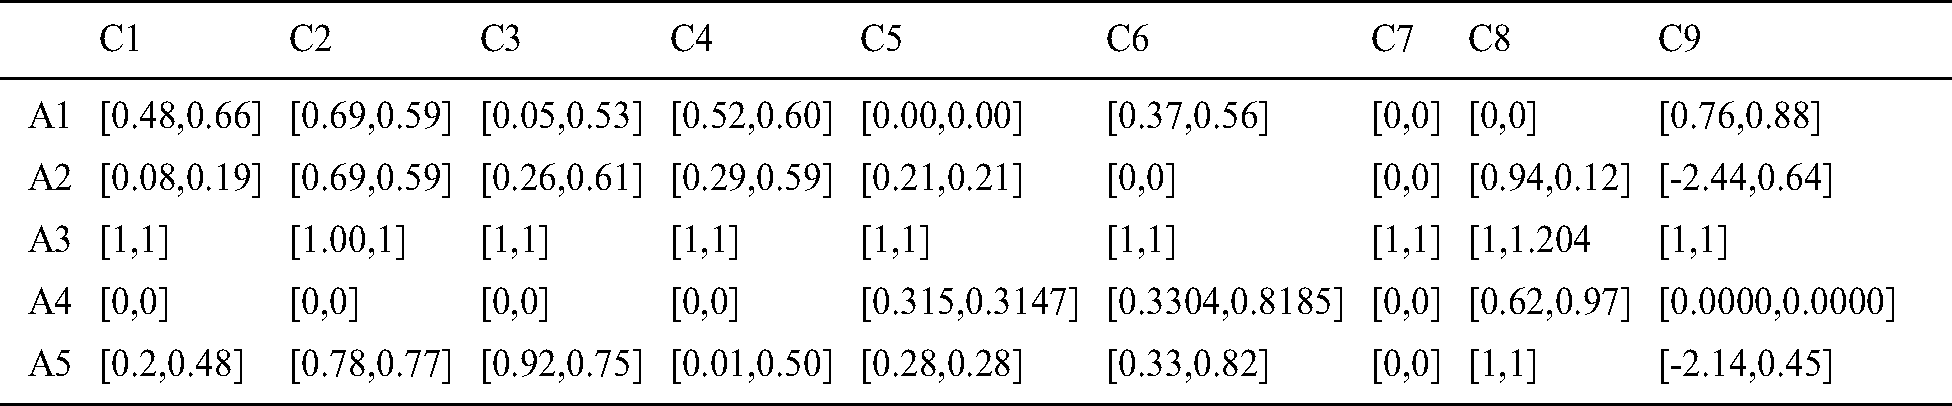
To handle the uncertainty of information, the evaluation values will be transformed into rough numbers to define the upper and lower limits of the evaluation, as discussed in Section 3.3. The evaluation matrix is represented in rough numbers in Tab. 3. Then, the plithogenic aggregation operator-assisted in combining the assessment of the four decision-makers. The contradiction degree of the criteria was defined to ensure more accurate gathering, as shown in Tab. 4. After converting the evaluation to crisp values as in Eq. (23), the normalized decision matrix must be calculated based on the nature of the criteria, as expressed in Eqs. (16), (17), and the result is presented in Tab. 5.
Table 3: Evaluation matrix by rough numbers
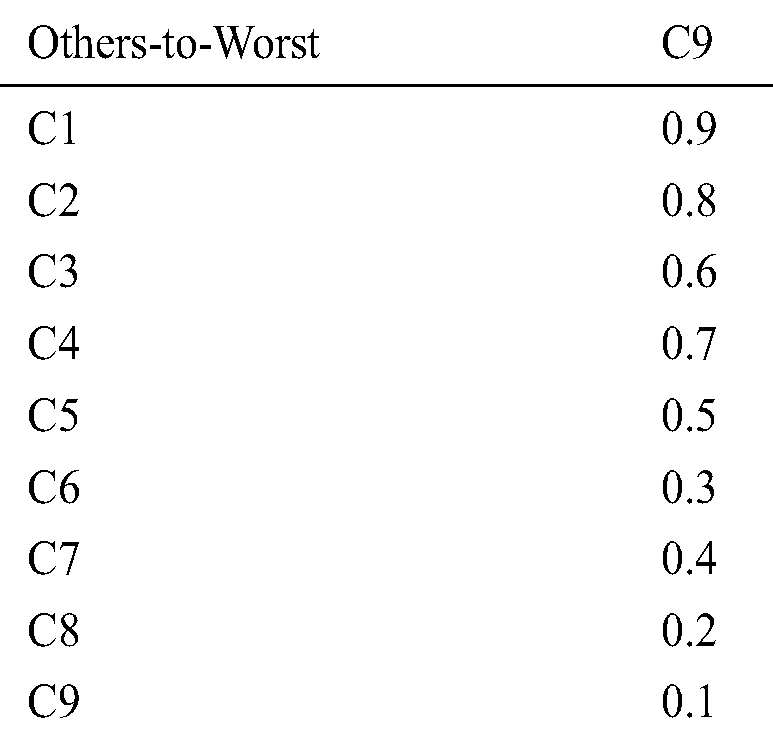
To evaluate the weights of the criteria, BWM is applied. Decision-makers define the product quality as the most desired criterion and accuracy in filling the order as the least preferred criterion. According to the importance rating scale, best-to-other, and others-to-worst vectors were determined as in Tabs. 6 and 7. After applying the BWM model, the weight vector resulted is presented in Tab. 8. The result of the BWM to weight the set of criteria shows that the product quality (C1) criterion is the highest with weight 0.315, and the lowest one has the accuracy in filling the order (C9) with weight 0.027. The rest of the criteria are arranged as follows: supplier expenditure emergency order (C2) with weight 0.192, technology service: problem-solving (C4) with weight 0.128, supplier adequately test new products (C3) with weight 0.096, technology service: responsiveness (C5) with weight 0.077, the supplier provides notice of product problems (C7) with weight 0.064, the supplier provides technical assistance (C6) with weight 0.055, and consistency of delivered product (C8) with weight 0.048.
Table 6: Best-to-others vector

Table 7: Other-to-worst vector

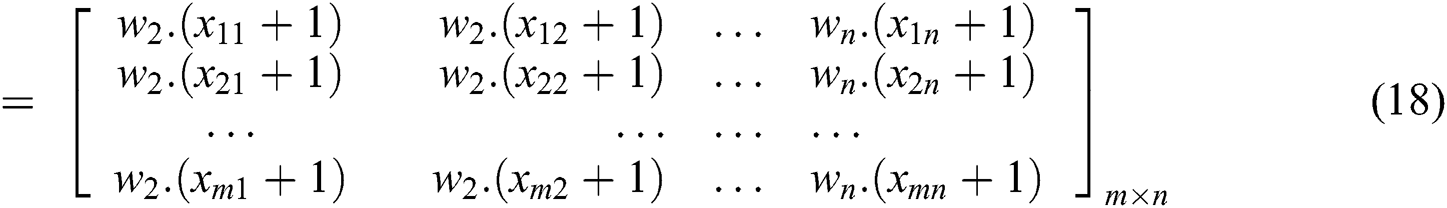
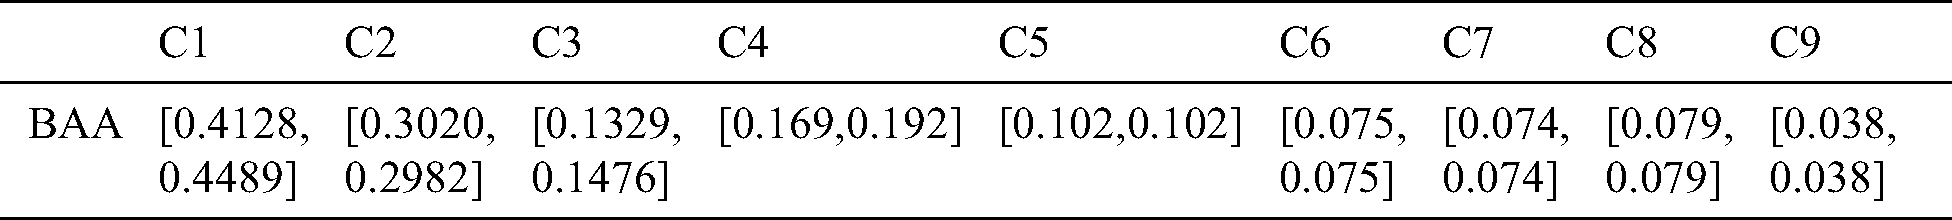
Based on the weight vector determined by BWM, the weighted matrix (Tab. 9) was calculated as Eq. (18) shows. According to Eqs. (19), (20), rough BAA can be calculated, as shown in Tab. 10.
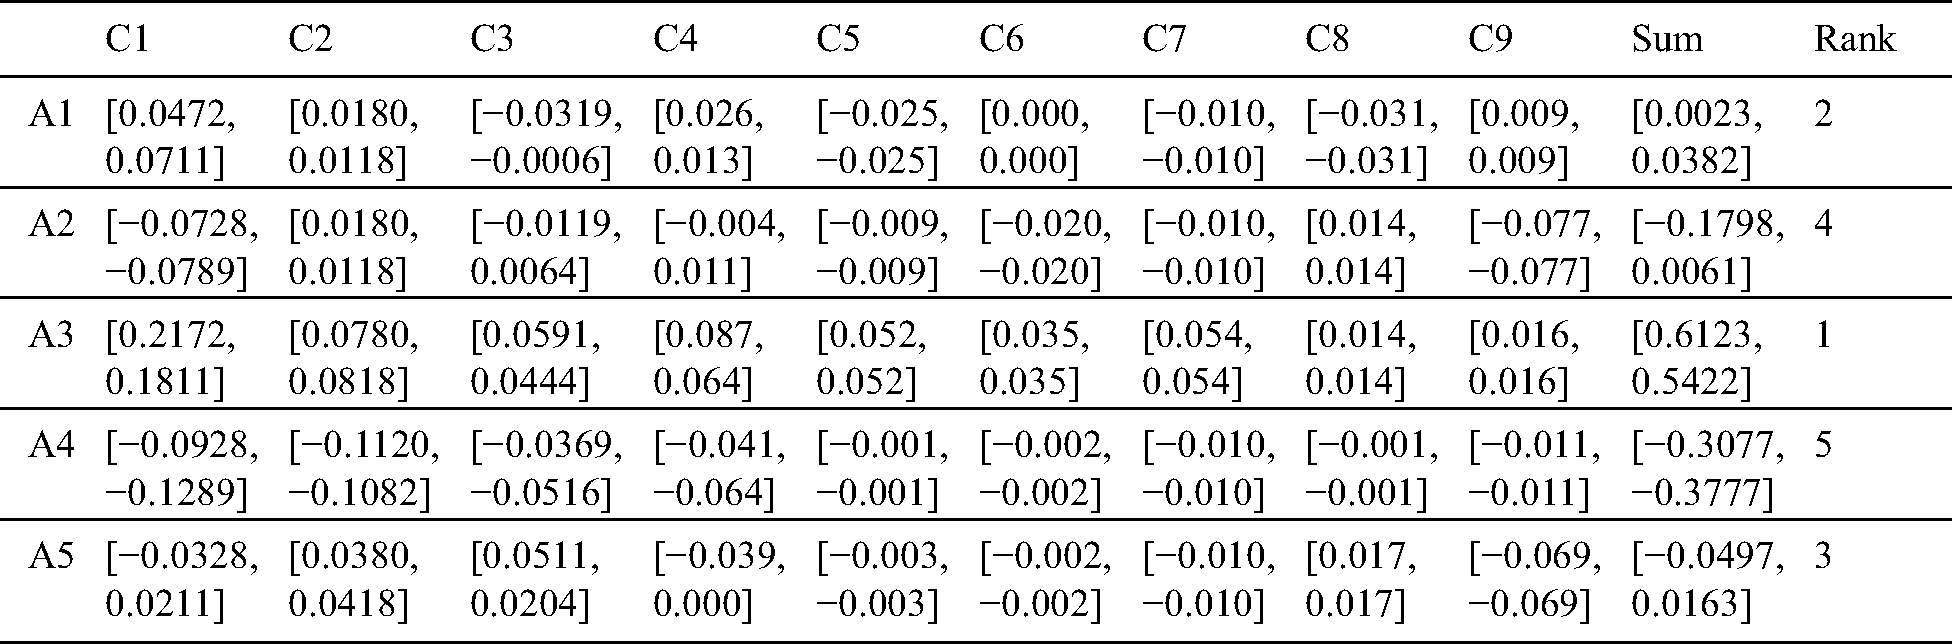
The distance of the alternatives from the rough BBA is obtained using Eq. (21), and the ranking of the alternatives based on the range is calculated according to Eq. (22); the results are expressed in Tab. 11. As Fig. 4 shows, the third alternative is the best for this private healthcare company, while alternative 4 is the least preferred one. By applying the proposed approach in a supplier selection problem in the healthcare industry, the results show that:
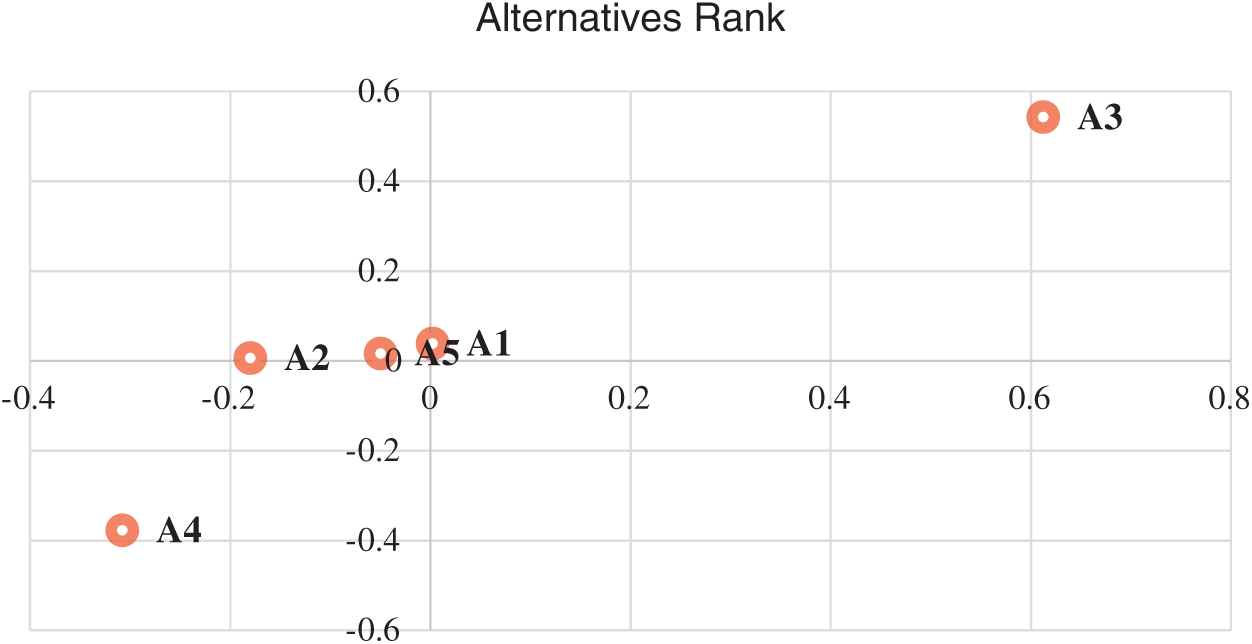
Figure 4: Ranking of the alternatives
Table 11: Evaluating results of alternatives
• Decision-makers and experts in the healthcare sector defined nine criteria that control supplier selection decisions among five suppliers. Using the Best-Worst method, we found that the product quality (C1) criterion has the highest weight (0.315), and the lowest one has the accuracy in filling the order (C9) (0.027).
• The order of the weight vector is as follows: C1 > C2 > C4 > C3 > C5 > C7 > C6 > C8 > C9. One of the main features of BWM is the consistency ratio that measures how consistent is the comparison. The consistency ratio is 0.0129, which means that the model is compatible.
• Using the MABAC method, the best supplier for the company based on the previously established set of criteria is the third supplier, and the least preferred is the fourth supplier. The first and the third supplier are in the upper approximation area, while the second, the fourth, and the fifth are in the lower approximation area, as shown in Fig. 4. The ranking of the suppliers on this case study is as follows: A3 > A1 > A5 > A2 > A4. As Fig. 4 shows, the alternative A3 is located at the upper corner of the upper approximation area. followed by the alternative A1 at the lower corner of the area, while the alternative A4 is located at the end of the lower approximation area, so it is the most anti-ideal alternative and at the end of the ranking.
• This study supports health care managers in looking at the problem of selecting the optimal supplier in more detail and taking into account the factor of uncertainty to which the decision-maker may be exposed to in the evaluation processes in a significant way.
Supplier selection is a major supply chain problem that has a lot of uncertain information, which leads to a difficult decision-making process. An integrated approach for the manipulation of uncertainty in the supplier selection process based on RNs and plithogenic set theory was applied. Firstly, we discussed the concept of plithogenic set and its aggregation operator that improve the aggregation with high consideration of uncertainty. Then, we considered the transformation of evaluation values into rough numbers to cover the upper and lower evaluation of the decision. Thirdly, the BWM was applied to evaluate and conclude the weight of the criteria. Finally, we used the MABAC method to rank the set of alternate suppliers based on the defined criteria weight that was computed by the BWM.
Our approach provides an exceptional level of consideration of uncertainty. Firstly, the group decision evaluation is presented as rough numbers that observe upper and lower approximation limits of the decision which handle the diversity of DMs’ judgments. Secondly, the assessment of the DMs was combined using plithogenic aggregation operation, which considers the contradiction degree to ensure more accurate aggregated results. Thirdly, BWM was applied to identify the weight vector of the criteria, which was considered as a useful and straightforward pairwise comparison method. The consistency ratio of the BWM evaluation was computed to evaluate how consistent is the evaluation. Finally, the MABAC method was applied to assess the set of alternate suppliers using criteria weights resulted from BWM.
Some deficiency of this study is that of not highlighting the priority of decision-makers, in order to get a comprehensive view of the problem and to get the best evaluation that takes into account the weights and priority of decision-makers according to the problem. This study also needs to make comparisons of the results found through other methods. Our recommendation for the further use of this approach is to employ it in decision-making problems from different fields. Moreover, the weight vector of the criteria could be computed by various MCDM methods, instead of BWM. Also, the plithogenic set operators should add an advantage to other decision making approaches.
Funding Statement: The author(s) received no specific funding for this study.
Conflicts of Interest: The authors declare that they have no conflicts of interest to report regarding the present study.
1. S. Haeri, A. Seyed and J. Rezaei. (2019). “A grey-based green supplier selection model for uncertain environments,” Journal of Cleaner Production, vol. 221, pp. 768–784.
2. A. Reza, S. A. Torabi and N. Altay. (2019). “Strategic supplier selection under sustainability and risk criteria,” International Journal of Production Economics, vol. 208, pp. 69–82.
3. Fu Y. K. (2019). “An integrated approach to catering supplier selection using AHP-ARAS-MCGP methodology,” Journal of Air Transport Management, vol. 75, pp. 164–169.
4. A. Memari, A. Dargi, M. R. A. Jokar, R. Ahmad and A. A. Rahim. (2019). “Sustainable supplier selection: A multi-criteria intuitionistic fuzzy TOPSIS method,” Journal of Manufacturing Systems, vol. 50, pp. 9–24.
5. G. Himanshu. (2018). “Assessing organizations performance on the basis of GHRM practices using BWM and Fuzzy TOPSIS,” Journal of Environmental Management, vol. 226, pp. 201–216.
6. A. J. Maghsoodi, M. Mosavat, A. Hafezalkotob and A. Hafezalkotob. (2019). “Hybrid hierarchical fuzzy group decision-making based on information axioms and BWM: Prototype design selection,” Computers & Industrial Engineering, vol. 127, pp. 788–804.
7. H. B. Ahmadi, S. K. Sarpong and J. Rezaei. (2017). “Assessing the social sustainability of supply chains using best worst method,” Resources, Conservation and Recycling, vol. 126, pp. 99–106.
8. E. A. Frej, L. R. P. Roselli, J. A. deAlmeida and A. T. deAlmeida. (2017). “A multicriteria decision model for supplier selection in a food industry based on FITradeoff method,” Mathematical Problems in Engineering, vol. 2017, pp. 1–9.
9. I. Sahidul and S. C. Deb. (2019). “Neutrosophic goal programming approach to a Green Supplier Selection model with quantity discount,” Neutrosophic Sets and Systems, vol. 30, pp. 98–112.
10. A. H. Zaied, M. Ismail and A. Gamal. (2019). “An integrated of neutrosophic-ANP technique for supplier selection,” Neutrosophic Sets and Systems, vol. 27, pp. 237–244.
11. S. Mishra, P. K. Sahu, A. K. Sarkar, B. Mehran and S. Sharma. (2019). “Geo-spatial site suitability analysis for development of health care units in rural India: Effects on habitation accessibility, facility utilization and zonal equity in facility distribution,” Journal of Transport Geography, vol. 78, pp. 135–149.
12. F. Xiao. (2018). “A novel multi-criteria decision making method for assessing health-care waste treatment technologies based on D numbers,” Engineering Applications of Artificial Intelligence, vol. 71, pp. 216–225.
13. A. H. Zaied, A. Gamal and M. Ismail. (2019). “An integrated neutrosophic and TOPSIS for evaluating airline service quality,” Neutrosophic Sets and Systems, vol. 29, pp. 1–12.
14. M. Cinzia, T. Piazza and G. Vizzini. (2017). “An expert system for financial performance assessment of health care structures based on fuzzy sets and KPIs,” Knowledge-Based Systems, vol. 97, pp. 1–10.
15. K. E. Ertugrul and M. Dursun. (2015). “An integrated fuzzy MCDM approach for supplier evaluation and selection,” Computers & Industrial Engineering, vol. 82, pp. 82–93.
16. S. Shuyang, H. Zhou and W. Song. (2019). “Sustainable shelter-site selection under uncertainty: A rough QUALIFLEX method,” Computers & Industrial Engineering, vol. 128, pp. 371–386.
17. M. Emad. (2018). “Single valued neutrosophic soft approach to rough sets, theory and application,” Neutrosophic Sets Syst, vol. 20, pp. 76–85.
18. Z. Li, G. Wei, R. Wang, J. Wu, C. Wei et al. (2020). , “EDAS method for multiple attribute group decision making under q-rung orthopair fuzzy environment,” Technological and Economic Development of Economy, vol. 26, no. 1, pp. 86–102.
19. G. N. Zhu, J. Hu, J. Q. Chao-Chen and Y. H. Peng. (2015). “ An integrated AHP and VIKOR for design concept evaluation based on rough number,” Advanced Engineering Informatics, vol. 19, no. 3, pp. 408–418.
20. F. Smarandache. (2018). “Plithogenic set, an extension of crisp, fuzzy, intuitionistic fuzzy, and neutrosophic sets-revisited,” Neutrosophic Sets and Systems, vol. 21, pp. 153–166.
21. G. Xie, J. Zhang, K. K. Lai and L. Yu. (2008). “Variable precision rough set for group decision-making: An application,” International Journal of Approximate Reasoning, vol. 49, no. 2, pp. 331–343.
22. M. Abdel-Basset and M. Mohamed. (2018). “The role of single valued neutrosophic sets and rough sets in smart city: Imperfect and incomplete information systems,” Measurement, vol. 124, pp. 47–55.
23. J. Rezaei, W. Jing and L. Tavasszy. (2015). “Linking supplier development to supplier segmentation using best worst method,” Expert Systems with Applications, vol. 42, no. 23, pp. 9152–9164.
24. S. A. Edalatpanah and F. Smarandache. (2019). “Data envelopment analysis for simplified neutrosophic sets,” Neutrosophic Sets and Systems, vol. 29, pp. 215–226.
25. A. Cheraghalipour and F. Saba. (2018). “A bi-objective sustainable supplier selection and order allocation considering quantity discounts under disruption risks: A case study in plastic industry,” Computers & Industrial Engineering, vol. 118, pp. 237–250.
 | This work is licensed under a Creative Commons Attribution 4.0 International License, which permits unrestricted use, distribution, and reproduction in any medium, provided the original work is properly cited. |