DOI:10.32604/cmc.2021.013067
| Computers, Materials & Continua DOI:10.32604/cmc.2021.013067 | |
| Article |
Prediction of COVID-19 Cases Using Machine Learning for Effective Public Health Management
1Department of Computer Sciences, Kinnaird College for Women, Lahore, 54000, Pakistan
2Department of Information Systems, College of Computer and Information Sciences, Jouf University, Sakaka, Aljouf, 72341, Saudi Arabia
3Division of Computer Science & Information Technology, University of Education, Lahore, 54000, Pakistan
4School of Computer Science, National College of Business Administration & Economics, Lahore, 54000, Pakistan
5Department of Clinical Laboratory Sciences, College of Applied Medical Sciences, Jouf University, Sakaka, Aljouf, 72341, Saudi Arabia
*Corresponding Author: Fahad Ahmad. Email: fahad.ahmad@kinnaird.edu.pk; drfahadahmadmian@gmail.com
Received: 24 July 2020; Accepted: 30 September 2020
Abstract: COVID-19 is a pandemic that has affected nearly every country in the world. At present, sustainable development in the area of public health is considered vital to securing a promising and prosperous future for humans. However, widespread diseases, such as COVID-19, create numerous challenges to this goal, and some of those challenges are not yet defined. In this study, a Shallow Single-Layer Perceptron Neural Network (SSLPNN) and Gaussian Process Regression (GPR) model were used for the classification and prediction of confirmed COVID-19 cases in five geographically distributed regions of Asia with diverse settings and environmental conditions: namely, China, South Korea, Japan, Saudi Arabia, and Pakistan. Significant environmental and non-environmental features were taken as the input dataset, and confirmed COVID-19 cases were taken as the output dataset. A correlation analysis was done to identify patterns in the cases related to fluctuations in the associated variables. The results of this study established that the population and air quality index of a region had a statistically significant influence on the cases. However, age and the human development index had a negative influence on the cases. The proposed SSLPNN-based classification model performed well when predicting the classes of confirmed cases. During training, the binary classification model was highly accurate, with a Root Mean Square Error (RMSE) of 0.91. Likewise, the results of the regression analysis using the GPR technique with Matern 5/2 were highly accurate (RMSE = 0.95239) when predicting the number of confirmed COVID-19 cases in an area. However, dynamic management has occupied a core place in studies on the sustainable development of public health but dynamic management depends on proactive strategies based on statistically verified approaches, like Artificial Intelligence (AI). In this study, an SSLPNN model has been trained to fit public health associated data into an appropriate class, allowing GPR to predict the number of confirmed COVID-19 cases in an area based on the given values of selected parameters. Therefore, this tool can help authorities in different ecological settings effectively manage COVID-19.
Keywords: Public health; sustainable development; artificial intelligence; SARS-CoV-2; shallow single-layer perceptron neural network; binary classification; gaussian process regression
In December 2019, an outbreak of pneumonia of unknown etiology was noticed in Wuhan City, China, which later spread across the globe. In January 2020, the cause of this pneumonia-like disease was confirmed to be a novel coronavirus known as SARS-CoV-2 [1]. This virus belongs to Coronaviridae, a large family of enveloped single-stranded RNA viruses [2]. Coronaviruses are well known to cause a variety of diseases, from the common cold to significant epidemics, like severe acute respiratory syndrome (SARS) and Middle East respiratory syndrome (MERS) [1–3].
In March 2020, the World Health Organization (WHO) classified COVID-19 as a pandemic that could threaten millions of people all over the world [4]. Ever since, the number of confirmed cases has increased, partially because this new viral disease is highly contagious during the incubation period. Asymptomatic individuals infected with COVID-19 can spread the disease throughout their communities [5]. Thus, asymptomatic carriers can play a significant role in related viral infections, such as rhinovirus and the influenza virus [6,7]. In addition, there is no antiviral drug or vaccine available against this virus. Therefore, molecular testing is the most reliable diagnostic test for COVID-19.
COVID-19 poses a significant challenge for governments. Though stakeholders have dedicated many resources to fight it, the epidemic has nevertheless caused a social and economic crisis in both developed and developing countries. During the present crisis, it is important to understand how to maintain sustainability practices with limited resources so that long-term public health outcomes can still be achieved. Sustainable development depends on the cooperation of stakeholders across social, ecological, cultural, and political domains. The current challenges of COVID-19 have caused mortality and morbidity on a massive scale, directly or indirectly influencing all these domains. After the emergency declaration from the WHO, all trade and travel were banned, which led to social unrest and devastating economic consequences. In the past, the Ebola, influenza, SARS, and HIN1 epidemics caused almost US $10 billion in losses. The current crisis is similar in nature to what occurred during the SARS epidemic and may have worse consequences; if the spread of the epidemic continues as it has, the worldwide losses are projected to exceed US $150 billion [8].
As the situation worsens, relevant tools based on artificial intelligence (AI) need to be studied; a machine learning process uses big data for pattern recognition, explanation, and prediction based on input data [9,10]. Therefore, AI has the potential to design tools to fight COVID-19. In this study, we utilized SSLPNN and GPR to predict the classes to which specific case studies belonged and the number of confirmed COVID-19 cases in specific geographical areas. Though, climatic and socio-economic conditions have a strong relationship with the incidence and spread of infectious diseases [11,12]. Nevertheless, this analysis will help to design public health policies to manage sustainable development policies.
This study was designed to predict the number of COVID-19 cases based on environmental and non-environmental factors. We used two different approaches. First, we analyzed the correlations between the confirmed cases (from February 1, 2020 to April 20, 2020) and several environmental factors (temperature, humidity, wind speed, ultraviolet (UV) index, elevation, air quality index and pollution level) and non-environmental factors (population, population density, gender ratio, and human development index). Second, we built a binary classification model to predict and classify COVID-19 cases using an SSLPNN algorithm based on critical factors related to sustainable development in the area of public health. These factors were divided into two significant modules: the first was the non-environmental module, and the second was the environmental module. Both modules were used as the inputs, with the number of confirmed COVID-19 cases designated as the outputs. The study design is presented in Fig. 1.
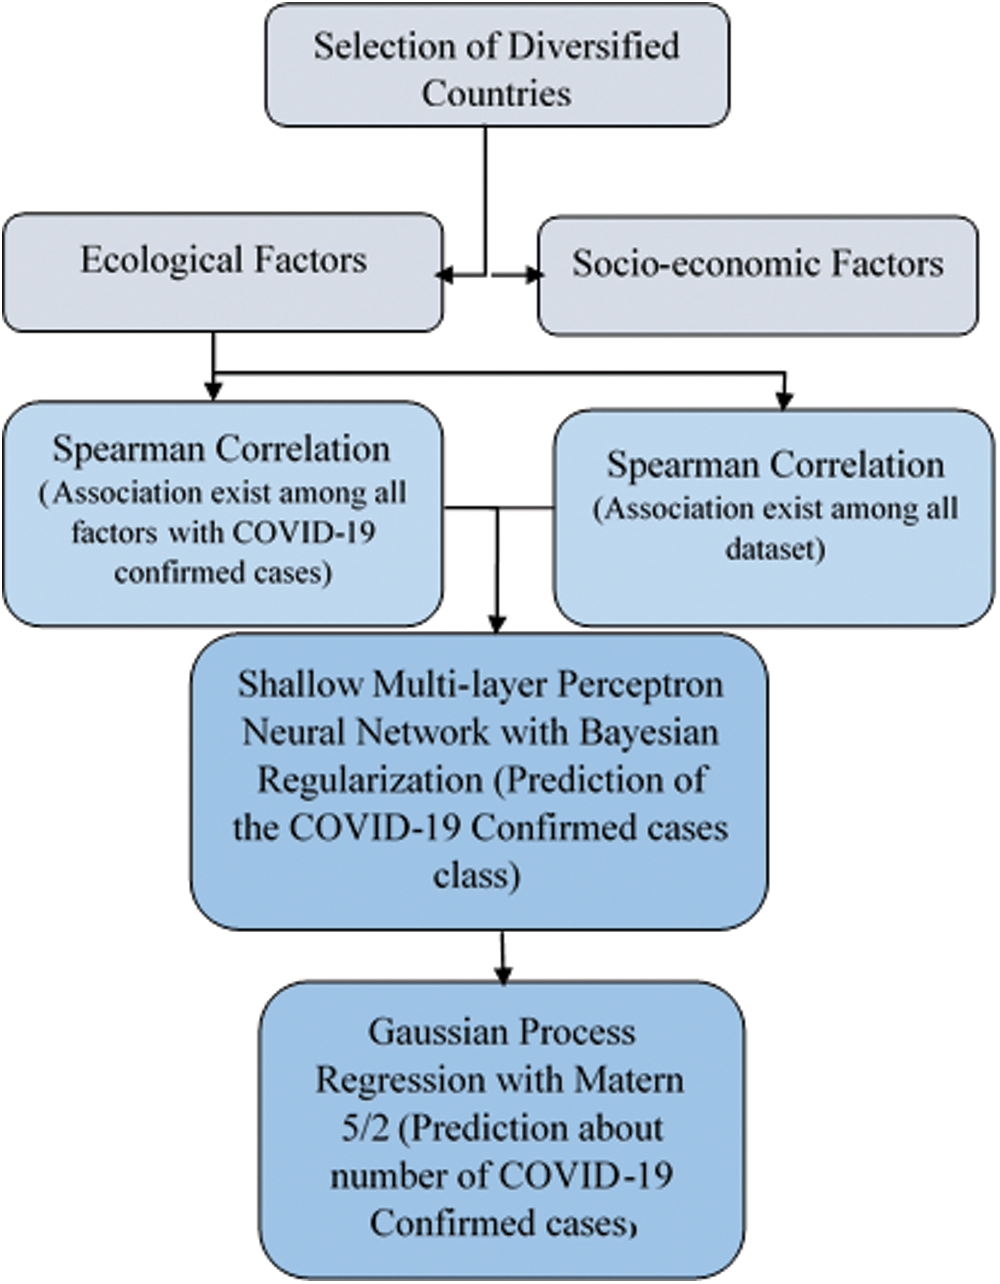
Figure 1: Artificial intelligence–based framework for the prediction of confirmed COVID-19 cases
In the analysis, specific conditions were applied. These conditions included the following:
• • In addition to the number of COVID-19 cases, 14 different environmental and non-environmental variables were used, including temperature (minimum, maximum, and average), humidity, wind speed, air quality index, UV index, pollution level, population, population density, gender ratio, average age, and human development index levels.
• • To enhance the precision of the estimates and to reduce bias, different countries were considered due to their different topographical, monetary, and ecological situations.
• • The environmental data used in this study was based on the capital cities of the selected regions, as these regions generally had larger populaces.
• • The non-environmental data used in this study was also taken from the regions of the respective countries.
• • The analysis period was from February 1, 2020 to April 20, 2020.
• • Different countries of the Asian continent were selected for this study.
In this study, data was collected from the various official and independent websites of the selected countries, which were China, South Korea, Japan, Pakistan, and Saudi Arabia [13–23]. These countries were selected due to their diverse climatic conditions. The details of this dataset are provided in the supplementary file.
To see the relationships between the total confirmed COVID-19 cases in the 54 provinces of the five countries included in this study and the 14 environmental and non-environmental variables, a correlation analysis was performed.
2.4 Spearman’s Rank Correlation
Before building the model, it was necessary to evaluate the correlations between each independent dataset. For this purpose, a Spearman’s correlation analysis was done on the non-parametric dataset. In a non-parametric dataset, the population data usually does not have a normal distribution and is randomly distributed vertically and horizontally. For this test, the selected parameters (environmental and non-environmental) and the total number of confirmed COVID-19 cases were included. This test was conducted to reveal the associations between two different variables without considering the distribution of the data, which is highly recommended for a dataset with at least ordinal scale. The relationships among the non-parametric variables are represented by parallel plot in Fig. 2. The mathematical formulation of Spearman’s rank correlation can be represented by the following equation:

Figure 2: Parallel plot depicting the relationships among the non-parametric environmental & non-environmental variables

 = Spearman’s rank correlation
si = the transformation between the ranks of corresponding parameters
m = the number of values
2.5 Shallow Single-Layer Perceptron Neural Networks (SSLPNN)
AI embraces a wide variety of approaches and algorithms based on machine intelligence. It has numerous applications in innumerable areas of science, encompassing fuzzy logic theory, machine learning techniques, risk valuations and hazard detection, meta-heuristic algorithms and classification, and clustering techniques [24]. SSLPNN is a type of neural network that has a smaller number of hidden layers and can be used for pattern recognition. While studies have shown that a shallow network can fit any function in the identification of patterns and prediction of problems, it is also considered a less complex artificial neural network. Though the use of deep learning is rapidly increasing in different fields of science, SSLPNN is still widely used in regression problems.
2.6 Mathematical Modeling of the Shallow Single-Layer Neural Network
In this study, we used a neural network architecture with 2,352 inputs for each selected parameter, one output neuron with a linear output function, and a single-layer grid. Through forward propagation, the network calculated the dot product between the nth sample x(n) and the weight vector w and then added the bias b. This calculation produced the weighted sum of the inputs with bias correction:


w = weight vector
b = bias
g = activation function
 = network output
The mean square error function assesses the credibility of the algorithm on a distinct trial:

where, y(n) is 2 if the nth trial fits category 2, 1 if the nth trial fits category 1, and 0 if the nth trial fits category 0. A cost function with L2 regularization of the weights is used to assess the global performance of the classifier. The term is affixed with the cost function to handle huge weights and to lessen the search space, reducing the inoperable weights toward zero, thus delivering more straightforward representations:

where:
 = regularization parameter
 = L2 norm of the weight vector
For large values of  , the regularization is robust, enhancing the capacity associated with the weights. Consequently, the weights, which are not able to lessen the Mean Square Error (MSE), decrease to zero. However, for small values of
  , the regularization outcome is weak. Here, the regression results are converted into class tags by using a Heaviside step function to deliver a numerical measure of the grid performance:

Of note, the accuracy is computed as if it were a classification part.
The cost function is deputed to compute the errors in the recent forecasts. The learning process matter is comparable to the cost function reduction. While the training samples are fixed, the cost function depends only on the network parameters (the weights and bias). Thus, the cost function reduction is also comparable to the optimization of the grid parameters. The whole process is controlled by the following equations.
The objective function to be reduced is the cost function Kn(θ), where n denotes the nth epoch, µ is a label for w and b, and gn represents the gradient.

This evaluation is then utilized to consider two exponential moving averages of the gradient mn and the squared gradient vn, respectively.


The two hyper-parameters β1, β2 ∈ [0, 1) regulate the exponential decline rates of these moving averages.
Finally, the grid parameters are restructured by utilizing the classical method of gradient descent represented by  , respectively.


The term  certifies that the denominator is always non-zero and avoiding mathematical difficulties.

The SSLPNN algorithm can forecast the value  an estimated function for every input vector
  . Fig. 3 shows the flow of the input and output variables in the SSLPNN algorithm. The inputs are brought into the opening layer. Then, the valuation and optimization procedures are conducted, ending when the algorithm obtain better results The SSLPNN algorithm can be used as an influential instrument to deal with unexpected and indefinite problems. Thus, in the present study, a binary classification analysis was done by the SSLPNN algorithm.

Figure 3: Structure of the Neural Network
To refine the precision of the model and to reduce the learning errors so as to obtain optimized outcomes, dissimilar models were created by hit-and-trial methods to find the appropriate number of layers and neurons for each layer. The input variables were the previously mentioned 14 notable factors: Namely, the population, population density, gender ratio, average age, human development index, elevation, temperatures (maximum, minimum, and average), relative humidity, wind speed, air quality index, pollution level, and UV index of each region. The number of confirmed COVID-19 cases was used as the output dataset. Two classes (labels) were assigned to the number of confirmed cases. Specifically, the number of confirmed cases under or equal to 800 were labeled as “0,” and the number of confirmed cases above 800 were labeled as “1.” The number of cases in five countries were included in the study. For modeling, 70% of the cases were used as training cases, 15% were used for validation, and 15% were reserved for testing.
2.9 Regression Learning through a Gaussian Process Regression (GPR) with the Matern 5/2 Preset
Determining the regulating parameters in an algorithm is important, as it aids in the quick convergence of the algorithm. There were no explicit associations among most of the parameters in this study. Thus, these parameters were considered independent and identified with the assistance of recent studies, experts, and trial-and-error methods. It is also important to identify the relationships between parameters through regression analysis, which helps with predictions based on the least learning error that are measured by the Root Mean Square Error (RMSE). Therefore, the process of selection was dimensionless and influenced the sensitivity of the modeling error. It is worth mentioning that the RMSE was used by the GPR algorithm with the Matern 5/2 GPR preset as a measurement of accuracy for the regression learner model.
When the dimensionality of the data is high, parameter identification typically turns out to be instinctive for the learning algorithms, as high-dimensional data tends to undesirably affect the efficacy of the majority of learning algorithms. Parameter identification is an effective dimensionality reduction procedure that chooses an ideal subclass of the unique parameters, delivering exceptional predictive control when modeling the data. These diverse structures can then be utilized to segregate trials into dissimilar modules. In this study, the Principal Component Analysis (PCA) procedure was used to select the optimal parameters.
In regression analysis, a GPR algorithm with variable models can adapt to numerous types of pattern recognition data for prediction through classification. The excellent experimental results demonstrate that GPR models provide a very promising feature selection solution to numerous pattern recognition problems through PCA. The algorithm can acquire patterns from the global distribution, therefore improving the precision of its pattern recognition capabilities.
GPR models with a finite-dimensional group of arbitrary variables and multivariate distribution are non-parametric kernel-based probabilistic models. Therefore, each linear combination is consistently distributed and the notion of Gaussian procedures is named after Carl Friedrich Gauss, as it emerges from Gaussian distribution to be an infinite-dimensional generalization of multivariate normal distributions. In this study, Gaussian process was used in the statistical modeling, regression to multiple target values, and analyses of mapping in higher dimensions. In addition, a GPR model with the Matern 5/2 GPR preset was used to plot the behavior of the algorithm; calculate the RMSE, R-Squared Value, MSE, Mean Absolute Error (MAE), prediction speed, and training time; and analyze the results of the GPR to see the similarities and differences in the data. The Matern 5/2 kernel does not have competence for measure problems in high dimensional spaces. The mathematical model of the Matern 5/2 GPR is illustrated as follows:

where:

3.1 Relationships between Environmental and Non-Environmental Parameters and COVID-19 Cases
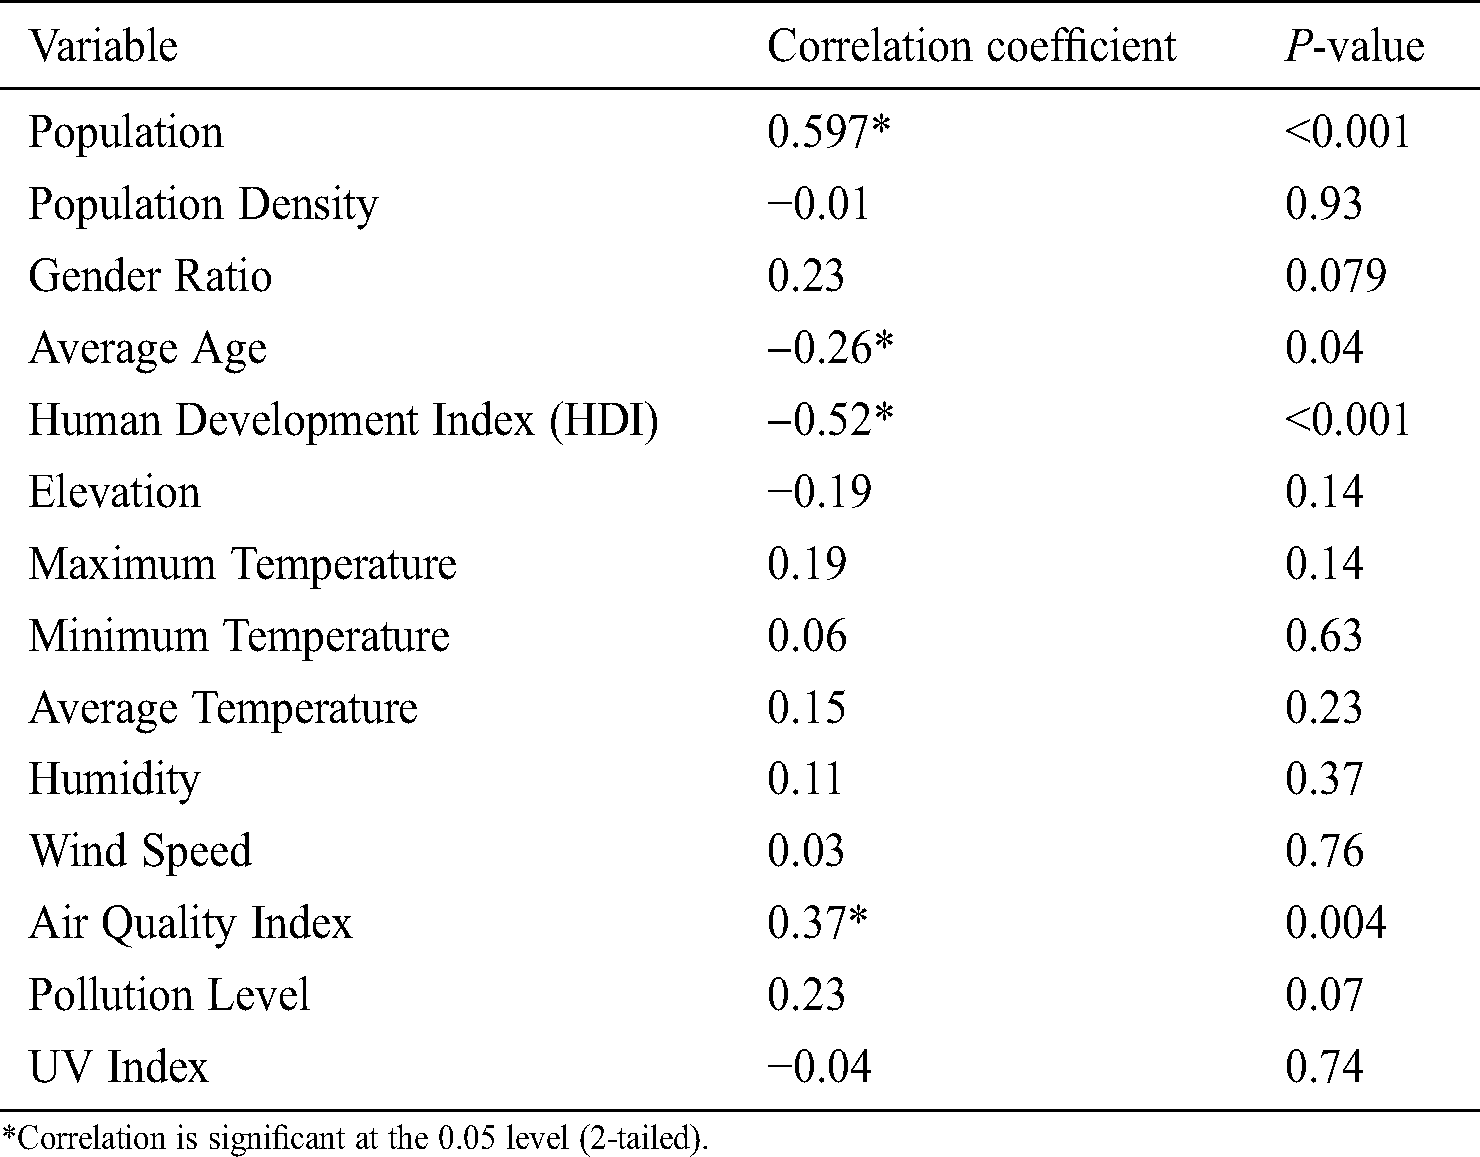
The number of cases showed a significant correlation with the population and air quality index of a region. A statistically significant inverse relationship was observed between the number of cases and the average age and human development index levels. The results of the correlation analysis are presented in Tab. 1.
Table 1: Correlation analysis of COVID-19 cases with selected environmental and non-environmental variables
3.2 Independent Association of Environmental and Non-Environmental Parameters
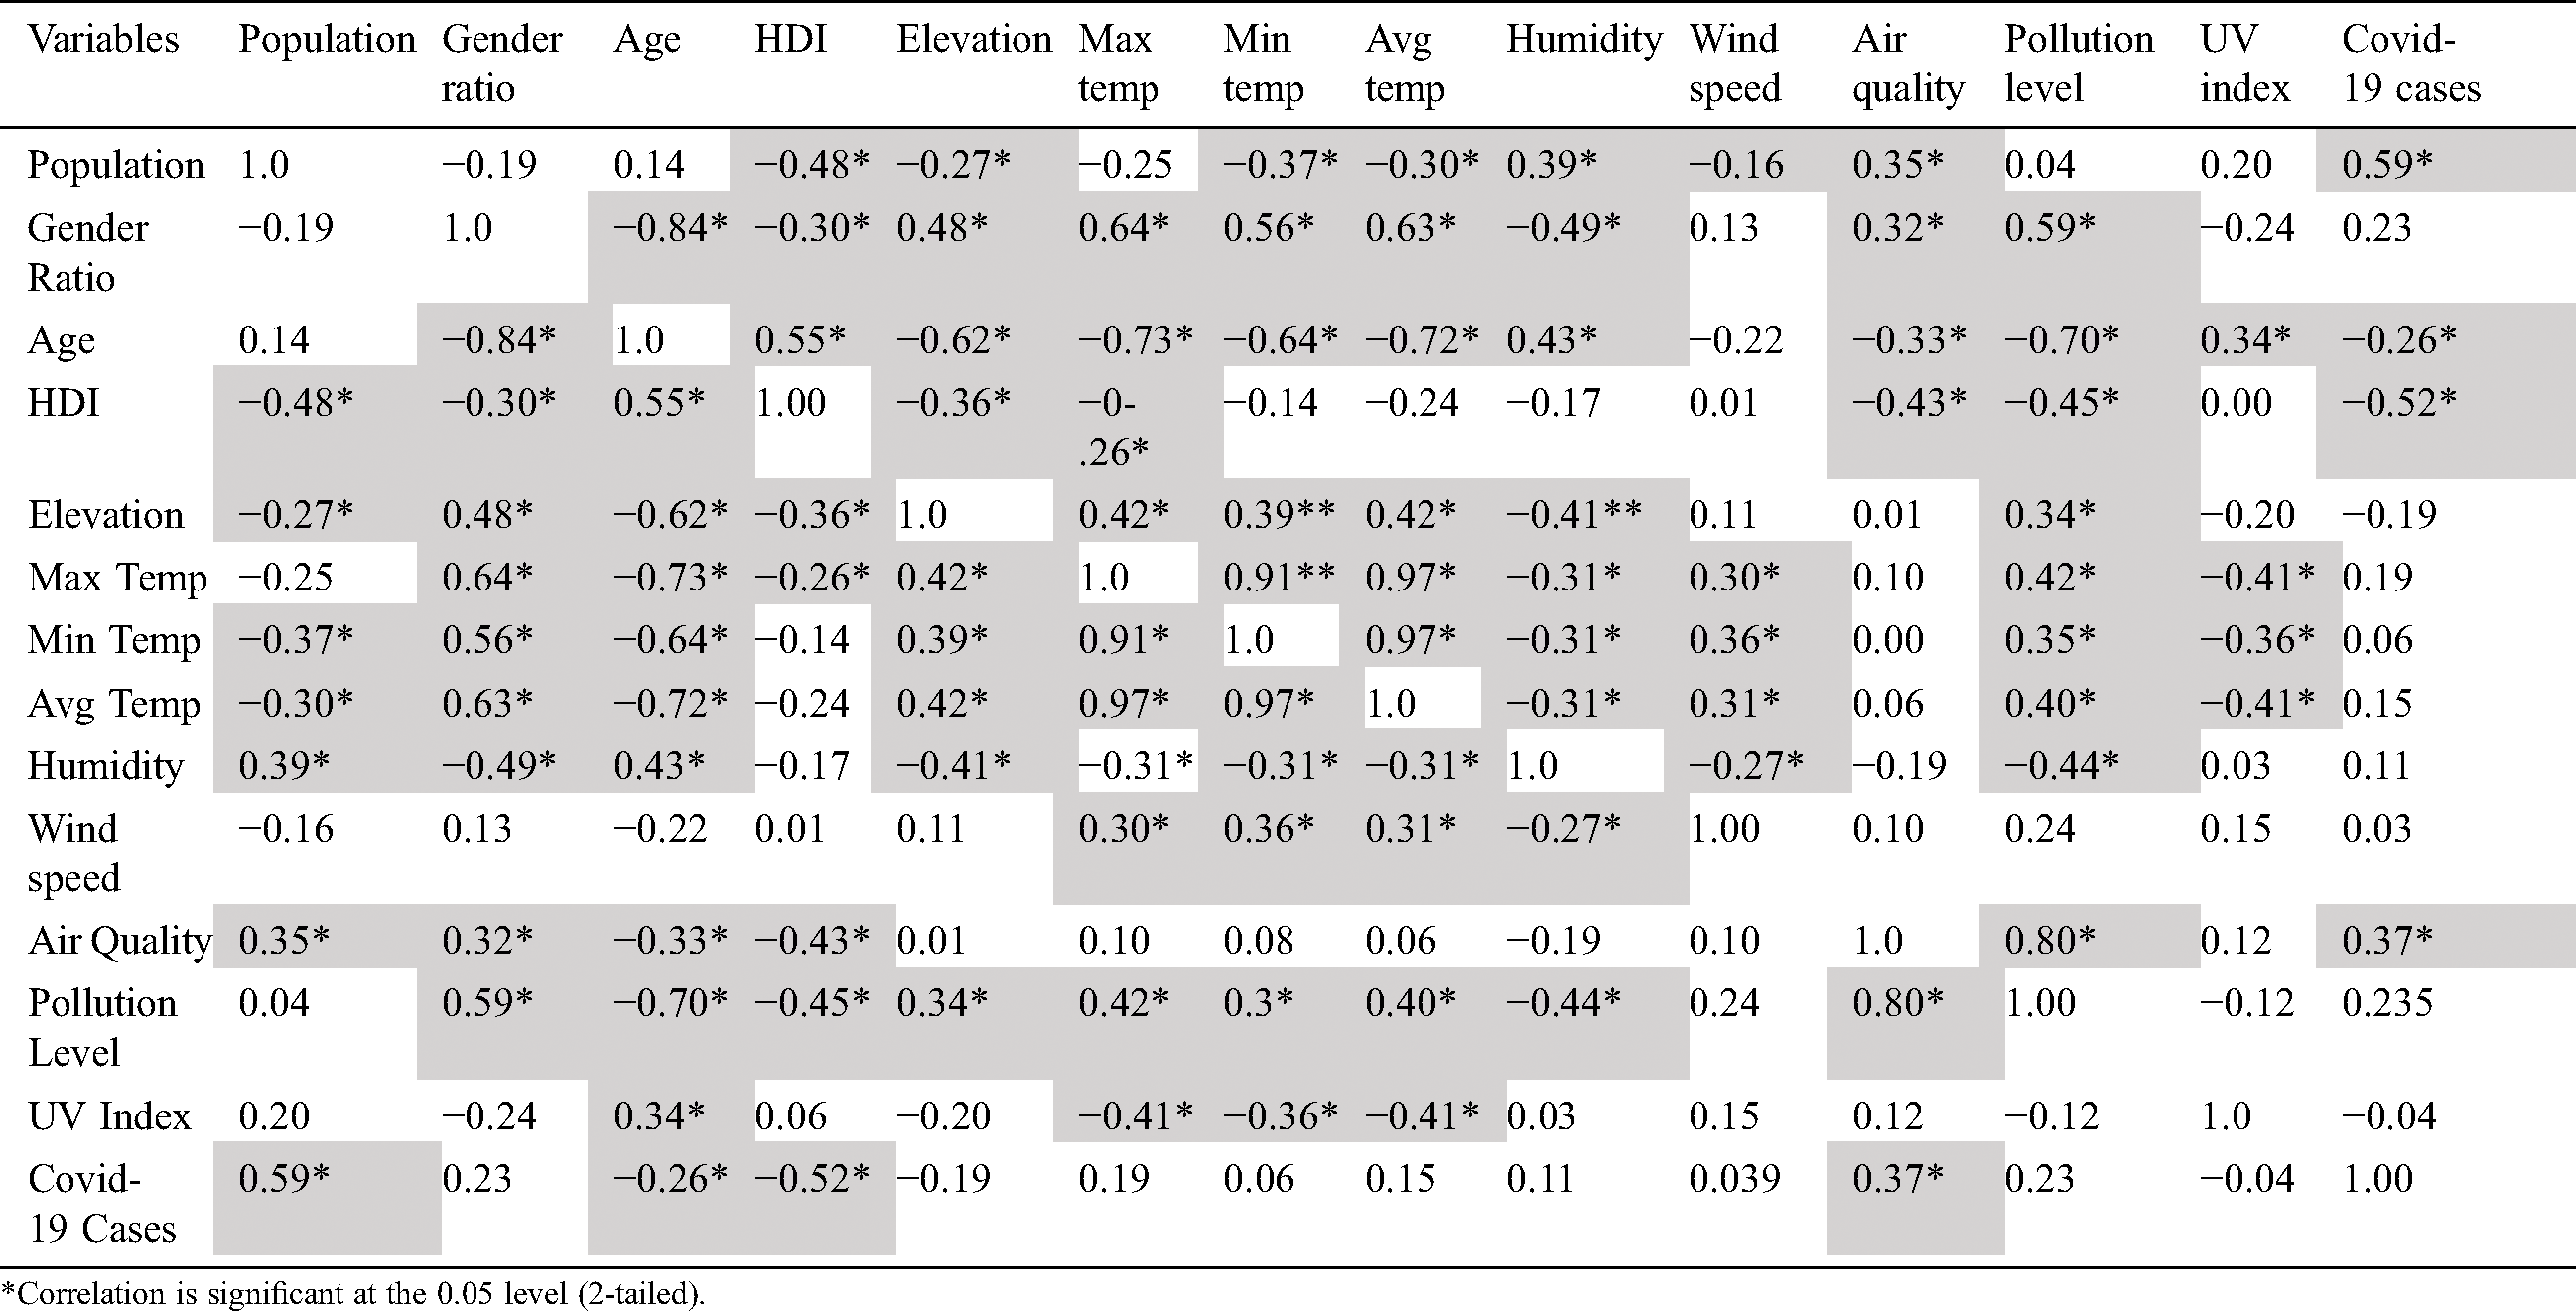
Furthermore, all included variables were analyzed to assess their correlations. An independent association was observed between each of the parameters. The results of this analysis are presented in Tab. 2. The correlation coefficient (R) indicated that the relationships were either negatively correlated or positively correlated among the independent parameters. Thus, the obtained results showed that SSLPNN could be used to further develop a pattern recognition model based on the selected parameters.
Table 2: Spearman’s correlation for all mutually independent variables
3.3 Results of the Pattern Recognition Model for Binary Classification Using SSLPNN
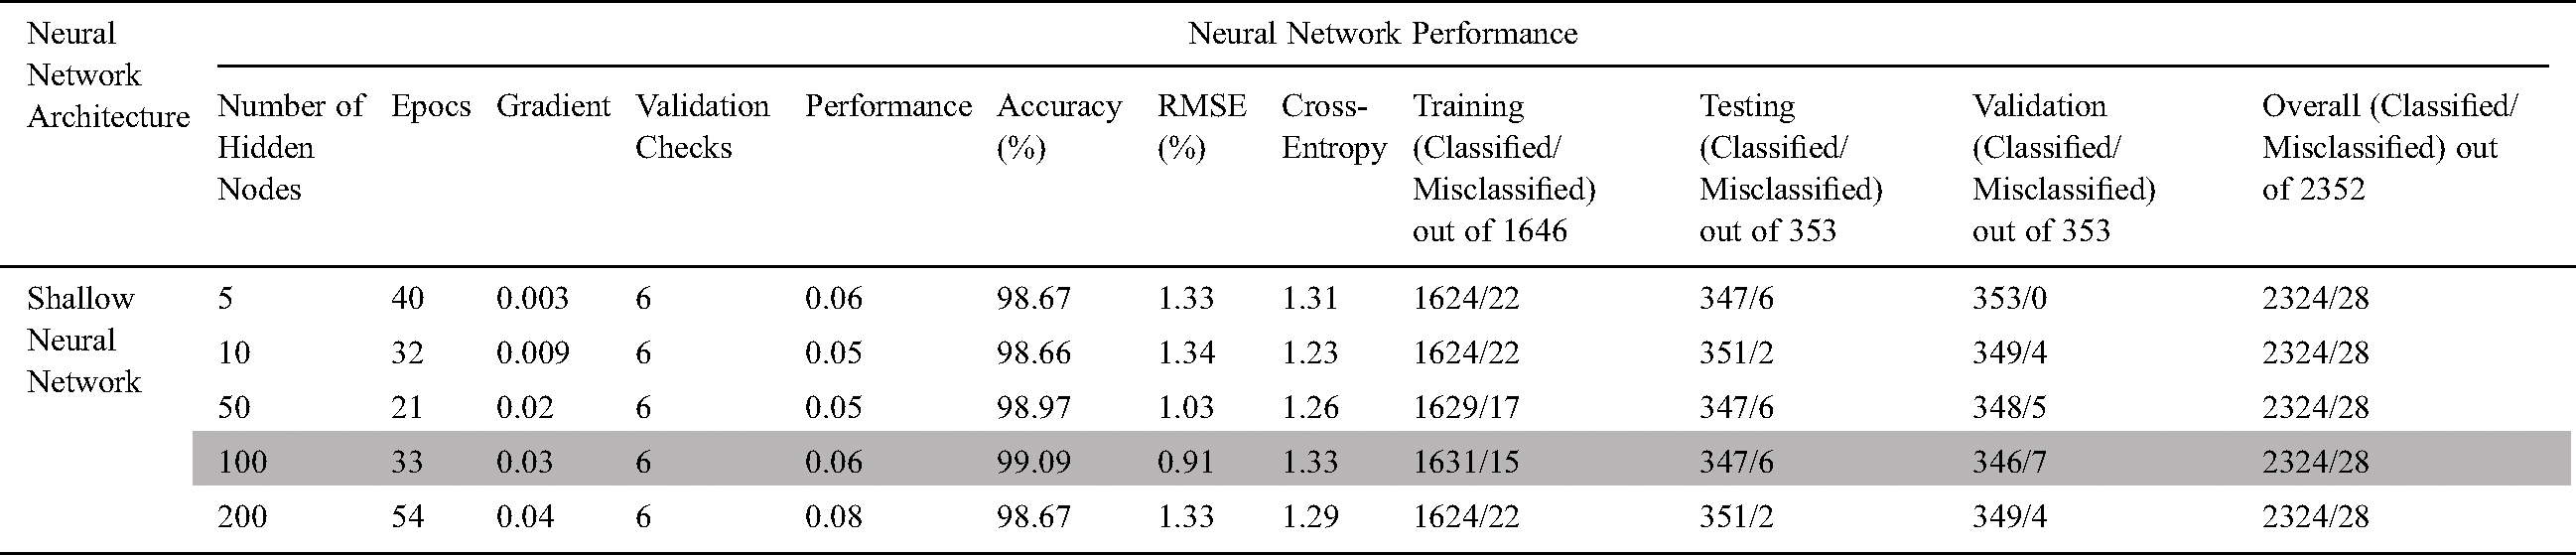
Before applying the binary classification through the pattern recognition model using the SSLPNN algorithm, a correlation analysis was conducted for the 54 case studies in the five countries, which included China, South Korea, Japan, Saudi Arabia, and Pakistan. This analysis showed a reasonable correlation coefficient (R) among the non-parametric variables (Tab. 3). Thus, it was decided that the 54 case studies could be evaluated in a cluster with the binary classification through the pattern recognition model. The results of our analysis indicate that the SSLPNN algorithm performed excellently, predicting the classes of the number of COVID-19 cases with an accuracy of 99.09% during training and an accuracy of 99.04% during testing, as shown in Tab. 3. These results demonstrated the high accuracy of the system, as presented in Fig. 4. The MSE for testing was almost 0 (MSE testing 9.11804e−01).


Figure 4: Best results of the shallow neural network (neurons = 100)
Table 3: Pattern recognition model for confirmed COVID-19 cases using SSLPNN
3.4 Prediction of COVID-19 Cases by Regression Analysis
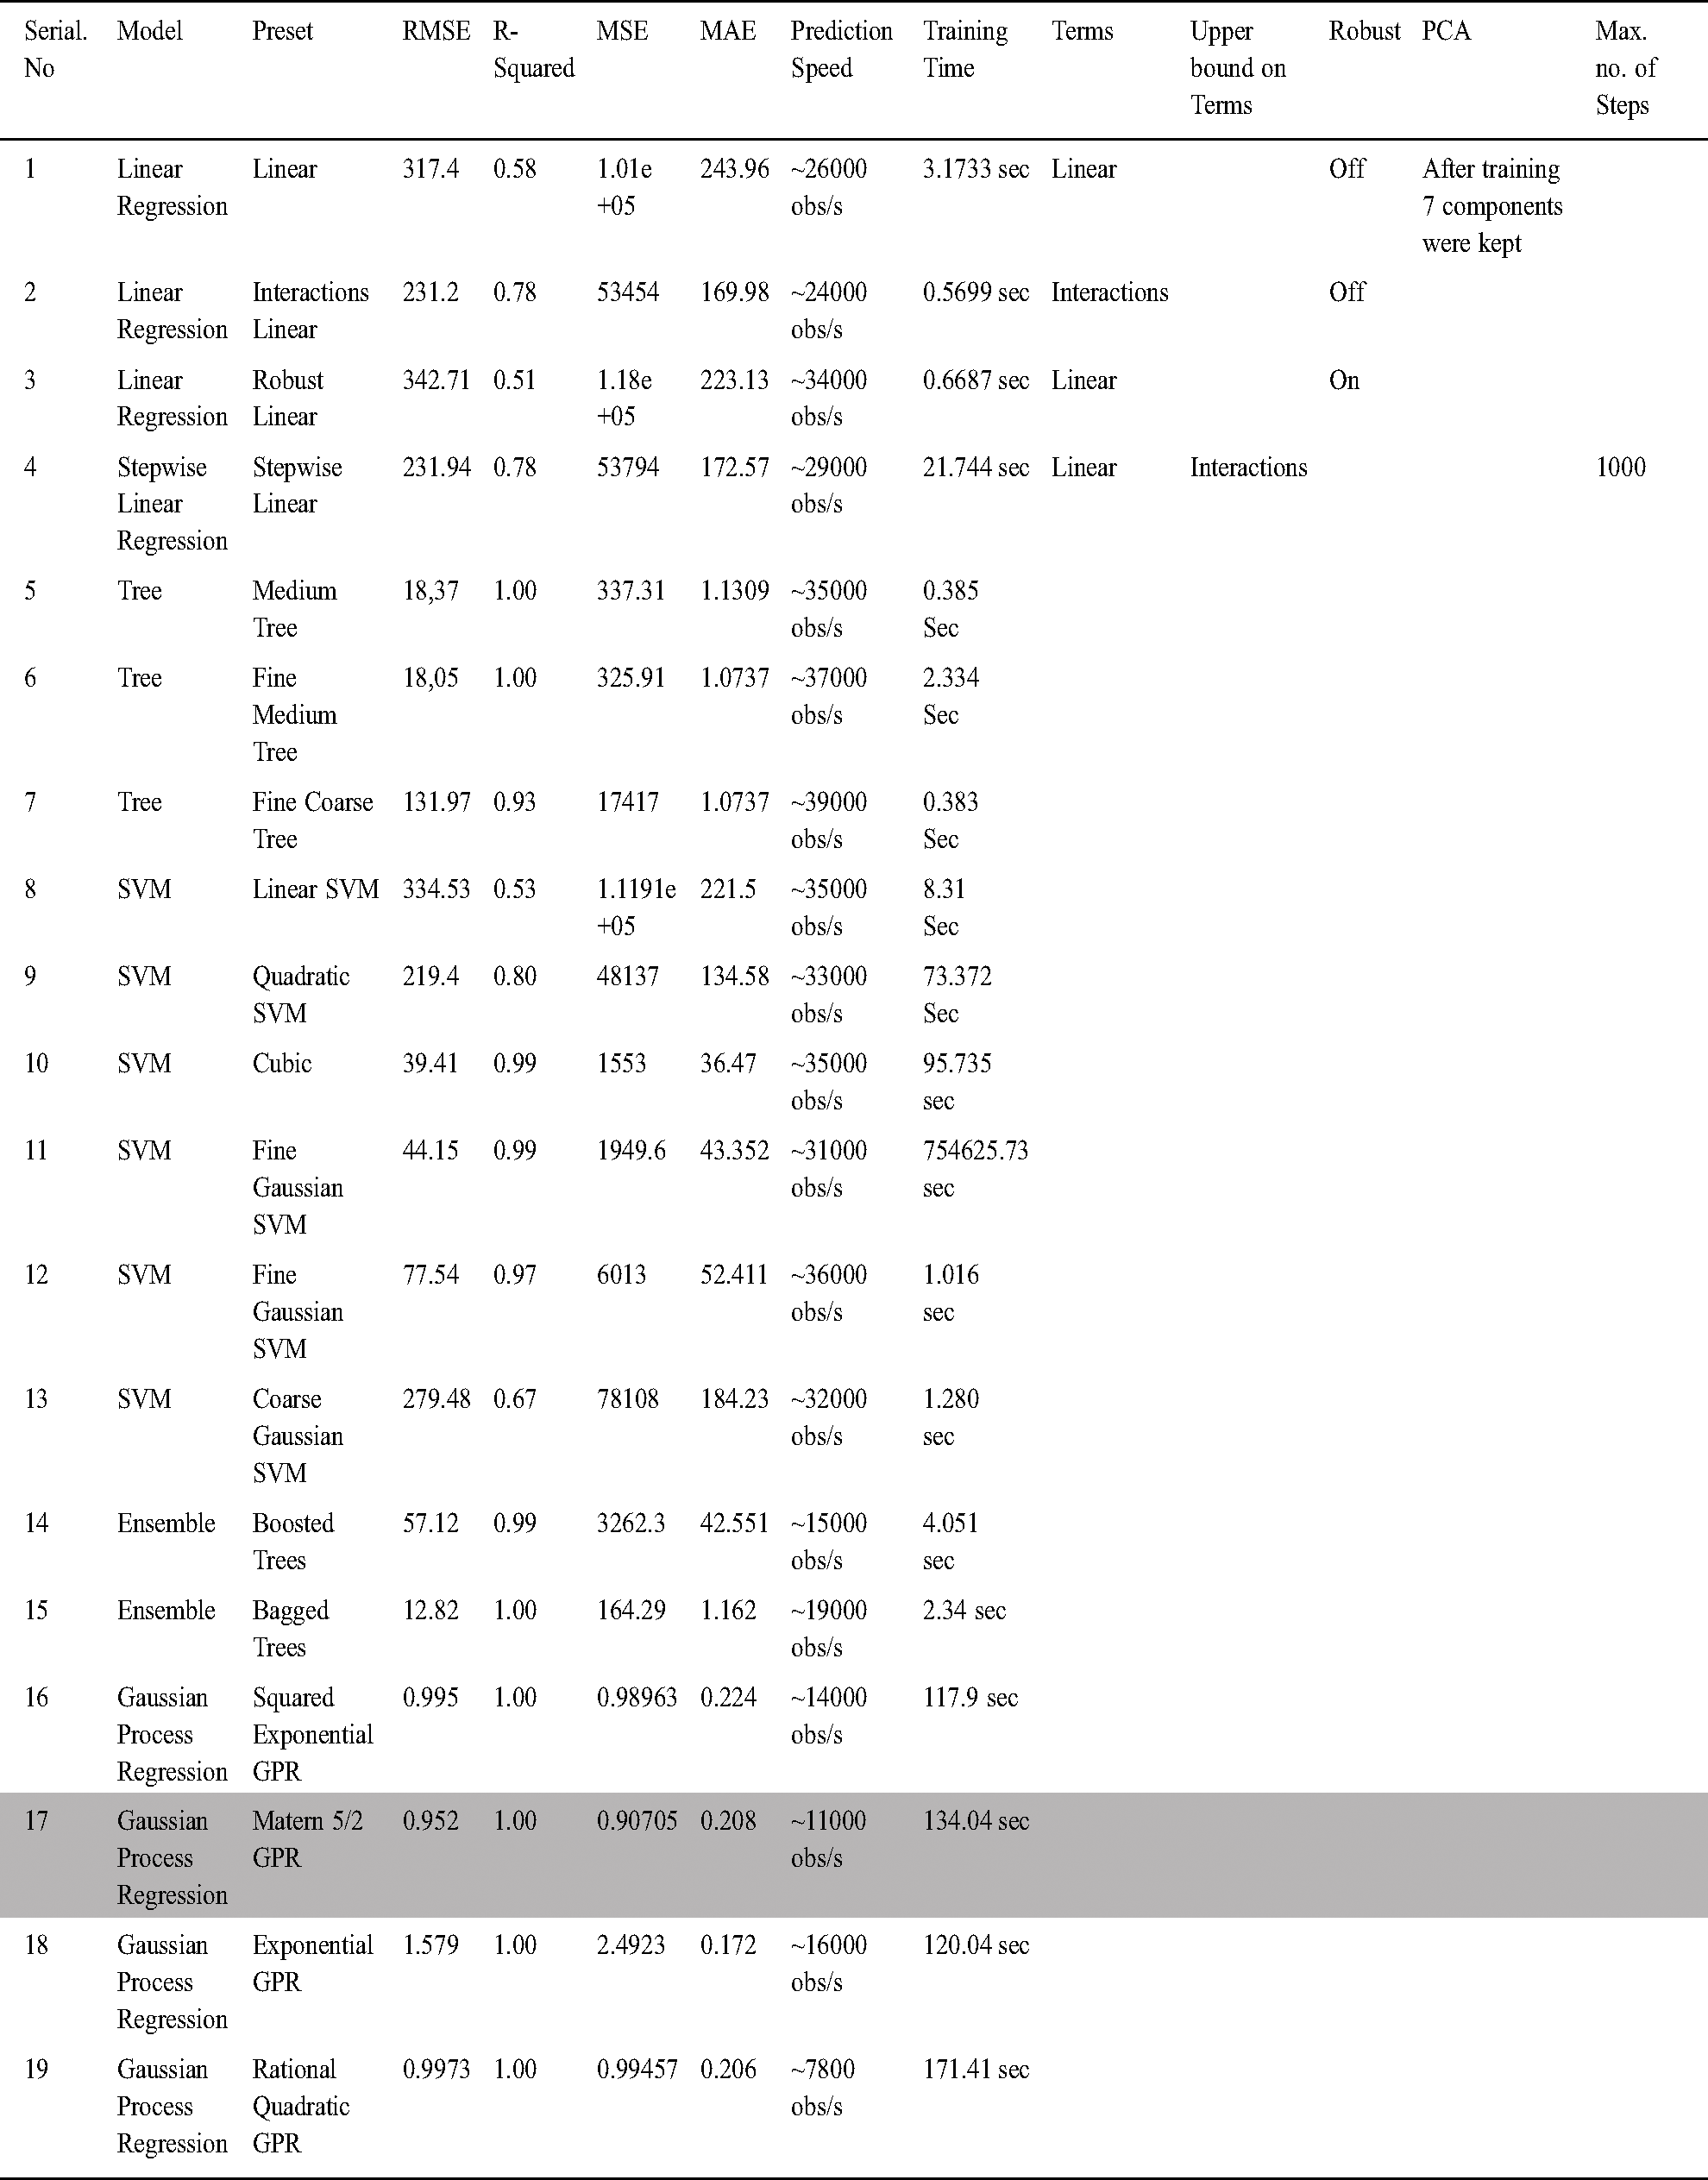
The results of the regression analysis using the GPR technique with Matern 5/2 were reasonably accurate, with an RMSE of 0.95239 in the prediction of confirmed COVID-19 cases. The PCA technique was used for the removal of noise and redundant parameters in order to reduce the dimensionality of the dataset. The information and results for the models are presented in Tab. 4. In addition, the response plot and predicted values vs. actual values plot for the whole scenario are provided in Fig. 5. These results were promising, with the lowest RMSE value (0.952) and an R-value of 1 that could predict the values more accurately than all other competing models, as presented in Tab. 4. The overall training time required for this model was 134.04 sec, and the prediction speed was 11000 obs/sec.

Figure 5: Best results of the regression analysis with Gaussian process regression kernel function
Table 4: Gaussian process regression model with the highest prediction performance
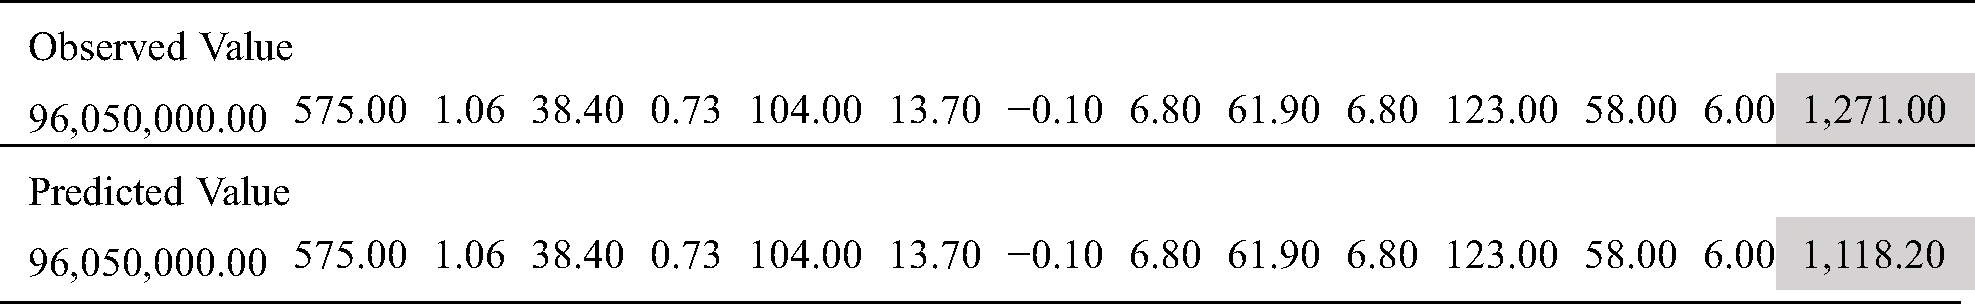
Finally, the predictive number of COVID-19 cases was compared with the actual observed cases; the results were close. The overall observed cases were 1,271.00, and our model predicted 1,118.2 with an 87.96% accuracy. The results are presented in Tab. 5.
Table 5: Comparison between the observed and predicted COVID-19 cases
This paper examined the relationship between COVID-19 cases and different environmental, ecological, and socio-economic factors and established a model system based on these variables to classify and predict rates of infection. COVID-19 has created a panic among the public. Scientific approaches must be identified and developed to predict the impact of these factors and to help policymakers take appropriate actions in the future.
Weather conditions, such as temperature, humidity, wind speed, and air quality, can affect the viability of viruses. Studies suggest that temperature and humidity have a strong influence on the transmission of COVID-19 [25]; researchers have also found that temperature and humidity may affect COVID-19 mortality [26]. In this study, we reported a statistically significant positive correlation between pollution, air quality index, and the number of positive COVID-19 cases in an area. Poor air quality is associated with the incidence of many diseases, such as asthma, bronchitis, lung and heart diseases, and many respiratory allergies [27]. China, where the epidemic started, is also severely affected by air pollution [28], indicating a relationship between poor air quality and COVID-19 [29].
The results of this study indicate that population density and human development index levels can also be associated with the number of COVID-19 cases in an area. Socio-economic factors like population size and low human development index levels are a significant driver for emerging infectious diseases and their subsequent effects on public health [30,31]. According to the Spearman’s correlation coefficient, a direct and inverse relationship exists among the independent parameters of different case studies, due to the policies and restrictions in different countries for this issue. This finding supports the predictive power of our study, indicating we may be able to generalize it for other countries and extend its scope [32].
Despite significant advancements in medical science, infectious diseases are a leading cause of mortality. For a novel disease like COVID-19 that does not have any standard guidelines for treatment and vaccination, the short-term response from medical science will be limited. However, we can utilize mathematical tools to better understand and forecast the impacts of such diseases. In the last few years, AI has been widely adopted to better understand infectious diseases and to predict epidemics [33].
Studies have reported on the use of neural networks to predict the outbreaks of many diseases, such as foot and mouth disease, influenza, epidemic diarrhea, Ebola virus, Rift Valley fever virus, Nipah virus, and SARS [34–36]. A recent report utilized neural network models to identify the risk of COVID-19 cases in a specific country based on weather conditions, and promising results were reported [37].
In this paper, we used the SSLPNN algorithm, which performed excellently, predicting the classes of COVID-19 cases for both the training and testing datasets with an accuracy of 99.09% and 99.04%, respectively.
The results of the binary classification modeling using SSLPNN with Scaled Conjugate Gradient Backpropagation (SCGB) showed high accuracy, with an MSE of 0.0114858 in five selected countries. Moreover, the results of the regression analysis using the GPR technique with Matern 5/2 for 54 case studies in five countries also showed high accuracy in the prediction of COVID-19 confirmed cases, with an RMSE of 0.952. This study established some previously unexplored patterns in the relationships between COVID-19 infections and the environmental and non-environmental conditions of select countries. Based on this analysis, we propose that both SCGB and GPR may be applicable to classifying and predicting patterns of COVID-19 cases. The results show that AI techniques can provide reasonable estimates about upcoming events based on specific inputs by learning the hidden structures of a scenario [38,39]. These rational outcomes can support governments in policy-making decisions, particularly those regarding public health, to ensure a sustainable development process. Our comparative analysis of daily weather parameters and trends of confirmed cases also demonstrate the role of these variables in the rate of COVID-19 cases.
Our findings are consistent with previous studies into the effects of climatic conditions on epidemic diseases and public health [40,41]. A recent analysis of confirmed COVID-19 cases through a binary classification using artificial intelligence and regression analysis also showed the impact of weather conditions in the COVID-19 epidemic [42]. Overall, machine learning is an innovative technique that is helpful when predicting upcoming trends in COVID-19 cases in relation to specific ecological and socio-economic factors.
Funding Statement: The authors received no specific funding for this study.
Conflict of Interest: The authors declare that they have no conflicts of interest to report regarding the present study.
1. V. Surveillances. (2020). “The epidemiological characteristics of an outbreak of 2019 novel coronavirus diseases (COVID-19)—China, 2020,” China CDC Weekly, vol. 2, no. 8, pp. 113–122. [Google Scholar]
2. S. Kannan, S. S. P. Ali, A. Sheeza and K. Hemalatha. (2020). “COVID-19 (novel coronavirus 2019)-recent trends,” European Review for Medical and Pharmacological Sciences, vol. 24, no. 4, pp. 2006–2011. [Google Scholar]
3. T. Phan. (2020). “Novel coronavirus: From discovery to clinical diagnostics,” Infection, Genetics and Evolution, vol. 79, 104211. [Google Scholar]
4. World Health Organization. (2020). “WHO director-general’s opening remarks at the media briefing on COVID-19 March 2020,”. [Google Scholar]
5. S. Lei, F. Jiang, W. Su, C. Chen, J. Chen et al. (2020). , “Clinical characteristics and outcomes of patients undergoing surgeries during the incubation period of COVID-19 infection,” EClinicalMedicine, vol. 21, pp. 100331. [Google Scholar]
6. A. Granados, E. C. Goodall, K. Luinstra, M. Smieja and J. Mahony. (2015). “Comparison of asymptomatic and symptomatic rhinovirus infections in university students: Incidence, species diversity, and viral load,” Diagnostic Microbiology and Infectious Disease, vol. 82, no. 4, pp. 292–296. [Google Scholar]
7. L. Furuya-Kanamori, M. Cox, G. J. Milinovich, R. J. S. Magalhaes, I. M. Mackay et al. (2016). , “Heterogeneous and dynamic prevalence of asymptomatic influenza virus infections,” Emerging Infectious Diseases, vol. 22, no. 6, pp. 1052. [Google Scholar]
8. M. Di Marco, M. L. Baker, P. Daszak, P. De Barro, E. A. Eskew et al. (2020). , “Opinion: Sustainable development must account for pandemic risk,” in Proc. of the National Academy of Sciences of the United States of America, vol. 117, no. 8, pp. 3888–3892. [Google Scholar]
9. C. Garcia-Vidal, G. Sanjuan, P. Puerta-Alcalde, E. Moreno-García and A. Soriano. (2019). “Artificial intelligence to support clinical decision-making processes,” EBioMedicine, vol. 46, pp. 27–29. [Google Scholar]
10. T. Hassan and F. Ahmad. (2018). “Transaction and identity authentication security model for e-banking: Confluence of quantum cryptography and AI, in Int. Conf. on Intelligent Technologies and Applications, pp. 338–347. [Google Scholar]
11. E. Rees, V. Ng, P. Gachon, A. Mawudeku, D. Mckenney et al. (2019). , “Risk assessment strategies for early detection and prediction of infectious disease outbreaks associated with climate change,” Canada Communicable Disease Reports, vol. 45, no. 5, pp. 119–126. [Google Scholar]
12. F. R. Chowdhury, Q. S. U. Ibrahim, M. S. Bari, M. J. Alam, S. J. Dunachie et al. (2018). , “The association between temperature, rainfall and humidity with common climate-sensitive infectious diseases in Bangladesh,” PLoS One, vol. 13, no. 6, pp. 1–17. [Google Scholar]
13. “List of countries by sex ratio,” . [Online]. Available: http://statisticstimes.com/demographics/countries-by-sex-ratio.php. [Google Scholar]
14. “Coronavirus pandemic in Pakistan,” . [Online]. Available: https://en.wikipedia.org/wiki/2020_coronavirus_pandemic_in_Pakistan. [Google Scholar]
15. “List of Japanese prefectures by human development index,” . [Online]. Available: https://en.wikipedia.org/wiki/List_of_Japanese_prefectures_by_Human_Development_Index. [Google Scholar]
16. “List of regions of South Korea by human development index,” . [Online]. Available: https://en.wikipedia.org/wiki/List_of_regions_of_South_Korea_by_Human_Development_Index. [Google Scholar]
17. “List of administrative divisions of greater China by human development index,” . [Online]. Available: https://en.wikipedia.org/wiki/List_of_administrative_divisions_of_Greater_China_by_Human_Development_Index. [Google Scholar]
18. “Lahore US embassy, Pakistan air pollution: real-time air quality index,” . [Online]. Available: https://aqicn.org/city/pakistan/lahore/us-embassy/. [Google Scholar]
19. “Saudi Arabia population,” . [Online]. Available: https://countrymeters.info/en/Saudi_Arabia. [Google Scholar]
20. “Saudi Arabia—median age of the population 1950–2050,” . [Online]. Available: https://www.statista.com/statistics/262482/median-age-of-the-population-in-saudi-arabia/. [Google Scholar]
21. “List of countries and dependencies by population density,” . [Online]. Available: https://en.wikipedia.org/wiki/List_of_countries_and_dependencies_by_population_density. [Google Scholar]
22. “List of administrative units of Pakistan by human development index,” . [Online]. Available: https://en.wikipedia.org/wiki/List_of_administrative_units_of_Pakistan_by_Human_Development_Index. [Google Scholar]
23. “Coronavirus disease (COVID-19) situation reports,” . [Online]. Available: https://www.who.int/emergencies/diseases/novel-coronavirus-2019/situation-reports/. [Google Scholar]
24. S. Shahzadi, B. Khaliq, M. Rizwan and F. Ahmad. (2020). “Security of cloud computing using adaptive neural fuzzy inference system,” Security and Communication Networks, vol. 2020, no. 8, pp. 1–15. [Google Scholar]
25. B. Chen, H. Liang, X. Yuan, Y. Hu, M. Xu et al. (2020). , “Roles of meteorological conditions in COVID-19 transmission on a worldwide scale,” medRxiv. [Google Scholar]
26. Y. Ma, Y. Zhao, J. Liu, X. He, B. Wang et al. (2020). , “Effects of temperature variation and humidity on the mortality of COVID-19 in Wuhan,” medRxiv. [Google Scholar]
27. M. Brauer. (2010). “How much, how long, what, and where: Air pollution exposure assessment for epidemiologic studies of respiratory disease,” in Proc. of the American Thoracic Society, vol. 7, no. 2, pp. 111–115. [Google Scholar]
28. M. Z. He, P. L. Kinney, T. Li, C. Chen, Q. Sun et al. (2020). , “Short-and intermediate-term exposure to NO2 and mortality: A multi-county analysis in China,” Environmental Pollution, vol. 261, pp. 114165. [Google Scholar]
29. F. Dutheil, J. S. Baker and V. Navel. (2020). “COVID-19 as a factor influencing air pollution?,” Environmental Pollution, vol. 263, pp. 114466. [Google Scholar]
30. K. E. Jones, N. G. Patel, M. A. Levy, A. Storeygard, D. Balk et al. (2008). , “Global trends in emerging infectious diseases,” Nature, vol. 451, no. 7181, pp. 990–993. [Google Scholar]
31. A. R. Parra, L. Echezuria and A. Rodriguez-Morales. (2010). “Epidemiological transition in Venezuela: Relationships between infectious diarrheas, ischemic heart diseases and transportation accidents mortalities and the human development index (HDI) in Venezuela, 2005–2007,” International Journal of Infectious Diseases, vol. 14, pp. e426–e427. [Google Scholar]
32. T. Cleff. (2019). “Applied statistics and multivariate data analysis for business and economics,” Switzerland: Springer, . [Online]. Available: https://link.springer.com/book/10.1007%2F978-3-030-17767-6. [Google Scholar]
33. S. Agrebi and A. Larbi. (2020). “Use of artificial intelligence in infectious diseases,” Artificial Intelligence in Precision Health, pp. 415–438. [Google Scholar]
34. M. D. Philemon, Z. Ismail and J. Dare. (2019). “A review of epidemic forecasting using artificial neural networks,” International Journal of Epidemiology, vol. 6, no. 3, pp. 132–143. [Google Scholar]
35. W. Jia, X. Li, K. Tan and G. Xie. (2019). “Predicting the outbreak of the hand-foot-mouth diseases in China using recurrent neural network,” in IEEE Int. Conf. on Healthcare Informatics, Xi’an: IEEE, pp. 1–4. [Google Scholar]
36. A. Forna, P. Nouvellet, I. Dorigatti and C. A. Donnelly. (2019). “Case fatality ratio estimates for the 2013–2016 West African Ebola epidemic: Application of boosted regression trees for imputation,” International Journal of Infectious Diseases, vol. 79, no. 12, pp. 128. [Google Scholar]
37. R. Pal, A. A. Sekh, S. Kar and D. K. Prasad. (2020). “Neural network based country wise risk prediction of COVID-19,” arXiv preprint, arXiv:2004.00959. [Google Scholar]
38. A. P. Piotrowski, J. J. Napiorkowski and A. E. Piotrowska. (2019). “Impact of deep learning-based dropout on shallow neural networks applied to stream temperature modelling,” Earth-Science Reviews, vol. 201, 103076. [Google Scholar]
39. N. Zhang, J. Xiong, J. Zhong and K. Leatham. (2018). “Gaussian process regression method for classification for high-dimensional data with limited samples,” in Eighth Int. Conf. on Information Science and Technology, Cordoba: IEEE, pp. 358–363. [Google Scholar]
40. V. Martin, V. Chevalier, P. Ceccato, A. Anyamba, L. De Simone et al. (2008). , “The impact of climate change on the epidemiology and control of rift valley fever,” Revue Scientifique et Technique, vol. 27, no. 2, pp. 413–426. [Google Scholar]
41. B. Pirouz, S. Shaffiee Haghshenas, S. Shaffiee Haghshenas and P. Piro. (2020). “Investigating a serious challenge in the sustainable development process: Analysis of confirmed cases of COVID-19 (new type of coronavirus) through a binary classification using artificial intelligence and regression analysis,” Sustainability, vol. 12, no. 6, pp. 2427. [Google Scholar]
42. C. Bezirtzoglou, K. Dekas and E. Charvalos. (2011). “Climate changes, environment and infection: Facts, scenarios and growing awareness from the public health community within Europe,” Anaerobe, vol. 17, no. 6, pp. 337–340. [Google Scholar]
 | This work is licensed under a Creative Commons Attribution 4.0 International License, which permits unrestricted use, distribution, and reproduction in any medium, provided the original work is properly cited. |