DOI:10.32604/cmc.2021.012907
| Computers, Materials & Continua DOI:10.32604/cmc.2021.012907 | |
| Review |
Detection and Grading of Diabetic Retinopathy in Retinal Images Using Deep Intelligent Systems: A Comprehensive Review
1Department of ECE, Karunya Institute of Technology and Sciences, Coimbatore, 641114, India
2Faculty of Electrical Engineering and Information Technology, University of Oradea, Oradea, Romania
3Institute of Research and Development, Duy Tan University, Da Nang, Vietnam
4VNU Information Technology Institute, Vietnam National University, Hanoi, Vietnam
*Corresponding Author: Le Hoang Son. Email: lehoangson2@duytan.edu.vn
Received: 17 July 2020; Accepted: 15 August 2020
Abstract: Diabetic Retinopathy (DR) is an eye disease that mainly affects people with diabetes. People affected by DR start losing their vision from an early stage even though the symptoms are identified only at the later stage. Once the vision is lost, it cannot be regained but can be prevented from causing any further damage. Early diagnosis of DR is required for preventing vision loss, for which a trained ophthalmologist is required. The clinical practice is time-consuming and is not much successful in identifying DR at early stages. Hence, Computer-Aided Diagnosis (CAD) system is a suitable alternative for screening and grading of DR for a larger population. This paper addresses the different stages in CAD system and the challenges in identifying and grading of DR by analyzing various recently evolved techniques. The performance metrics used to evaluate the Computer-Aided Diagnosis system for clinical practice is also discussed.
Keywords: Diabetic retinopathy; computer-aided diagnosis system; vessel extraction; optic disc segmentation; retinal features; grading of DR
The human eye is a sensitive organ that provides the visual gateway to the world. Few diseases in the eye can cause a loss in vision which cannot be retained; hence identifying these diseases at an early stage is necessary to prevent the vision loss. The most common eye diseases are Cataracts, Corneal Ulcers, Retinal Tear and Detachment, Vitreous Floaters, Glaucoma, Diabetic Retinopathy, Melanoma, Macular degeneration, Blepharitis, Conjunctivitis, Exotropia, and Esotropia. Fundus Photography, also known as fundus image, is used to capture the rear of an eye. Fundus camera contains an intricate microscope fixed to the camera with flash and is used in fundus photography. Structures like the retina, macula, and optic disc can be envisioned on a fundus image. Fundus photography can be observed with colored filters or with dyes like fluorescein and indocyanine green. Diseases like DR, glaucoma, macular degeneration, retinal neoplasms, multiple sclerosis, and choroid disturbances can be identified using fundus images. Since 1920 fundus photography has been used for deciding in diagnosing and treating patients in ophthalmology [1].
The world’s largest number of blind population is in India, with 15 million over the 37 million blind people in the world and is considered as the capital of diabetes. The chance of avoiding blindness is 75%, and though there is a need for 40,000 optometrists only 8,000 optometrists are available. Diabetes is the major cause of blindness which mostly affects the working-age population [2]. Between 1996 to 2009 the prevalence of diabetes increased from 439,123 to 1,140,248 over 20 years [3]. Delhi based expert’s clinical data states that the rise in the number of DR is among the people affected by diabetes. In 2017, over 72 million cases of diabetes were reported in India. According to a report by the World Health Organization (WHO), India will be in lead by 2030 with 79 million cases, if diabetes is not controlled [4].
Diabetes Mellitus generally known as diabetes is a disease that affects the human body based on the glucose level. Clinical features of DR include Microaneurysms, Hard Exudates, Cotton Wool Spots, Hemorrhages, Neovascularization, and Macular Edema. Depending on these 5 clinical features DR is classified into two types a) Nonproliferative (Early) Diabetic Retinopathy (NPDR) b) Proliferative (Advanced) Diabetic Retinopathy (PDR). Microaneurysms are the early stage of retinal damage and are formed by the non-perfusion or abnormal permeability of retinal blood vessels. The size of Microaneurysms is less than 125 microns and can be seen in the fundus image as the red spot with sharp margins. Hard Exudates are formed in the outer layer of the retina and are due to the leakage of lipoproteins and other proteins through the abnormal blood vessels. It develops as small white or yellowish-white spots with sharp margins [5]. The fluffy white lesion in the Retinal Nerve Fiber Layer due to debris accumulation is known as Cotton Wool Spots [6], and they exist due to the blockage of the arteriole. Hemorrhages are red spots with irregular margin due to the leakage of the weak capillaries and are greater than 125 microns. Neovascularization occurs in the inner surface of the retina with the abnormal growth of blood vessels which bleed into the vitreous cavity, causing blurred vision [7]. Fluid leakage and solute over the macula caused due to the retinal capillary abnormality is known as Macular Edema [8]. If there is no growth of new blood vessels in retina then, it is NPDR and it includes three stages: mild stage, moderate stage, and severe stage.
CAD techniques have been used for over 40 years in the clinical environment but they do not substitute doctors; instead, their role is secondary to the medical professionals. However, early signs of abnormality in patients can be detected through CAD techniques, which will be difficult to deduct for the human eye. A few diseases which can be identified by CAD techniques include DR, architectural distortion in mammograms, ground-glass nodules in thoracic CT, and non-polypoid lesions in CT colonography. Diabetic Retinopathy classification and detection can be done by CAD. Normal and effected changes in the eye images can be detected using computer-based methods [9–11]. Challenges while using CAD systems in grading DR are listed below:
1. Identifying anatomical structures and lesions becomes complicated because of their similar structures.
2. The early stage of DR is difficult to identify because of only the retinal structural changes during that stage.
3. The best algorithm with high accuracy for DR screening has not been fixed yet for clinical use.
This paper is based on the survey for the grading of DR. The structure of this paper is as follows: Section 2 deals with the list of available retinal fundus datasets, Section 3 deals with the various enhancing techniques for the enhancement of the fundus images, Section 4 deals with the segmentation methods for segmenting blood vessels and optic disc from the images, Section 5 describes various feature extraction methods, Section 6 explains the feature selection methods, Section 7 deals with the classification methods for the grading of DR, Section 8 deals with the performance analysis of the existing methods, and Section 9 provides the conclusions.
2 Retinal Fundus Image Database
In image processing, image acquisition, i.e., the input for retrieving an image from the source is the first step. The source can be from the existing datasets. Nothing can be processed without image acquisition. As the number of images increases in the dataset the accuracy gets reduced so, the dataset should be selected properly. DRIVE and STARE datasets are commonly used for identifying DR and the mentioned datasets are from the people of other countries. Indian Diabetic Retinopathy Image Dataset (IDRiD) is the first dataset collected from Indians and can be used for the grading of DR. Real-time images can be collected from hospitals for better performance and comparison. Fundus images available datasets with the camera model, number of images, resolution and format of the images, availability of ground truth, and the web link of the datasets are listed in Tab. 1.
Table 1: Retinal fundus image datasets

Image enhancement involves the modification of image properties for the ease of analysis. Artifact errors arising from media opacity, small pupils, camera nonalignment, camera focusing problems, and noise factors in the image acquisition stage can reduce the quality of the fundus images. This in turn affects the illumination, color, and contrast of the image. To overcome these limitations, image enhancement is a necessity in CAD techniques. Various image enhancement techniques are discussed in this section.
3.1 Enhancement for Detection of DR
In this section, various image enhancement techniques that help in detecting the presence of DR are discussed.
3.1.1 Image Resolution Enhancement
Image resolution enhancement generates a high-resolution image of the desired scaling factor from a low-resolution image. The retinal examination requires good quality images for detecting retinal diseases but handheld cameras provide low-resolution images that may not be appropriate for diagnosis. To overcome the inadequacy of the low-resolution images, various super-resolution techniques are explored [20]. Some of the commonly used super-resolution techniques include interpolation, regularization, learning-based approaches, and frequency domain approaches. An image resolution enhancement using Generative Adversarial Networks (GAN) incorporating local saliency map is proposed and the presence of the saliency map requires the selection of window size and weight for each input image. To overcome these limitations, a Progressive GAN (P-GAN) which avoids the heuristic parameter selection is used [21].
Filters are applied in the retinal fundus image for enhancing the retinal features like blood vessels, optic disc, and the clinical features of the DR. Denoising technique removes the noise in the retinal fundus image with no loss in the information of blood vessels with background suppression [22]. Flickers in an image can be filtered using a gaussian filter by selecting the maximum frequency response for enhancing blood vessels. Cascaded gaussian filter and median filter are used for the multidimensional filtering and component extraction. Median filter helps in highlighting the blood vessels in the retinal fundus image without fading the sharp edges and suppresses the noise in the images [23]. Gabor filter is used for detecting the edges, for texture discrimination, representation with frequency, and orientation representations. Noise may not be removed properly and artifacts generation is possible if the estimation is too high [24]. The effect of uneven illumination correction can be reduced by dark channel prior method and homomorphic filtering by enhancing the retinal blood vessels [25].
Histogram Equalization (HE) is a method used for redistributing image intensities to enhance the contrast of the image such that the output contains a uniform distribution of intensities. Different variations of HE has been explored by the researchers in order to obtain effective contrast enhancement. For images with local regions of low contrast, bright or dark regions, normal HE may not be effective. In such cases modified HE called Adaptive Histogram Equalization (AHE) can be used which considers smaller regions in the image for performing contrast enhancement. Contrast Limited AHE (CLAHE) is a variation of AHE where there is limited contrast amplification for reducing noise. The low contrast issue in the medical image is improved using CLAHE by clipping the height and limiting the slope of the histogram. Compared to Histogram Equalization and Adaptive Histogram Equalization, CLAHE is more effective in detecting small blood vessels and in increasing the visibility of hidden features in the image [26,27]. However, in some image types, Histogram Equalization can show hidden noise even after the processing is done.
3.1.4 Morphological Operations
Morphological operations take a binary image and a structuring element as input and process subjects in the image based on the characteristics of its shape with or encoded in the structural elements. It can be used for contrast enhancement and background subtraction. Morphological opening and closing operations are applied to an image based on the multi-structure element to enhance the vessel edges and smoothen the region. A morphological opening operation can remove the false edges and preserve the thin vessel edges perfectly whereas a morphological closing operation is applied to the retinal fundus image for preserving bright lesions. Tophat transform is useful to enhance the blood vessel from the retinal image. It is based on image opening and closing operations. Hit or miss transformation helps detect scattered areas of the retina. Morphological operations can accurately detect retinal blood vessels and exudates [28–30].
In medical image analysis preserving the mean brightness of the input image is necessary. Most of the image enhancement techniques can improve the image quality but fail to preserve the mean brightness of the image and introduce color artifacts [31]. Fuzzy based enhancement is efficient in handling the intensity values better than the traditional enhancement techniques. Dynamic contrast issues in the retinal fundus image can be overcome by fuzzy partitioning and computing-based enhancement; no new artifacts are added to the output image [32].
3.1.6 Transform Based Enhancement
Transform based techniques give spectral information of the image and it is easy to manipulate the frequency composition of the image without any effect on spatial information. Contourlet transform is used to enhance the edges and microstructure in an image by finding the discontinuities in points and forming a linear structure on linking point discontinuities. This may cause changes in the width of the blood vessel which emphasizes the importance of appropriate parameter selection [33]. The ability of curvelet transform to represent edge information and stationary wavelet transform makes it a better choice for retinal image enhancement and helps in easier segmentation of tiny blood vessels [34,35]. The limitation of the transform based technique is that it enhances the entire structures in a medical image without discrimination whereas, for effective detection of lesions, it is necessary to enhance only specific target lesions and not the surrounding tissues.
3.2 Enhancement for Grading of DR
People affected by DR will have a loss in vision and hence it is of extreme importance to classify and stage the severity of DR to get adequate therapy. Grading of DR requires the removal of the optic disc in the preprocessing stage and the image should contain blood vessel and clinical features. Enhancement of clinical features is necessary for proper grading of DR. Diagnosis of DR requires only the main retinal pixels for processing; hence the background pixels are separated from the foreground pixels in the preprocessing stage by the mean and variance-based method. Once the background is separated, the main components in the retina such as optic disc and blood vessels are extracted [36]. CLAHE and Independent Component Analysis (ICA) based enhancement method is useful for distinguishing blood vessels from the background [37]. Exposure based Sub Image Histogram Equalization (ESIHE) is another enhancement technique that can regulate the enhancement levels with better brightness and is considered to be superior over other HE methods [38].
3.3 Performance Metrics for Enhancement
To compare different enhancement techniques, various quantitative performance measures have been explored to evaluate their performances. Some of the performance metrics discussed are Entropy [39], Structural Similarity Index Measure (SSIM), Peak Signal to Noise Ratio (PSNR) [40], Signal to Noise Ratio (SNR), Euclidean Distance, Enhancement Measurement Error (EME) [41], Relative Contrast Enhancement Factor (RCEF), Absolute Mean Brightness Error (AMBE), Mean Square Error (MSE), Root Mean Square Error (RMSE) [42], Contrast Improvement Index (CII) [43] and Linear Index of Fuzziness (LIF) [44]. The clarity of the retinal image is defined using two metrics namely CII and LIF. A larger value of CII indicates that the retinal vessels are enhanced better. The small value of LIF indicates that the whole enhanced image is clearer with less noise. Hence, good image enhancement is characterized by a large CII value and a small LIF value. A good enhancement is indicated by a high value of AMBE and EME, provided RCEF is greater than 1.
The presence of bright and light lesions in the retinal fundus images makes it difficult to segment blood vessel and optic disc which, consequentially, may affect the classification of retinal diseases. Hence, the unwanted regions need to be removed for increasing the accuracy. The segmentation section includes segmentation of retinal blood vessels, segmentation and elimination of optic disc, and lesion segmentation. Before the segmentation process, green channel is input RGB image then converted to grayscale and filter is applied for better enhancement. The sample image till the segmentation process in shown in Fig. 1.
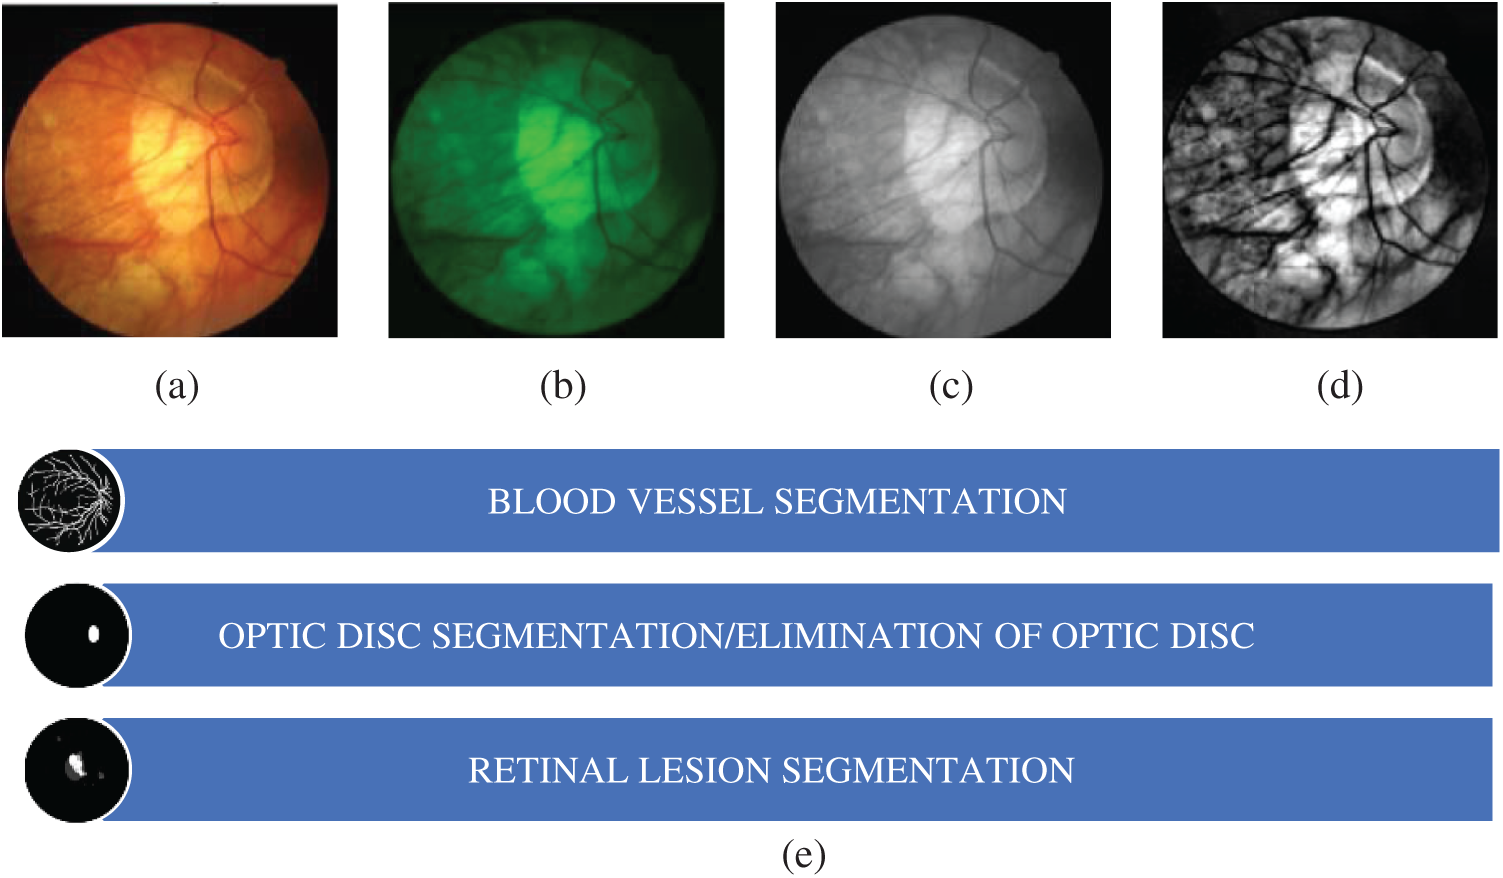
Figure 1: (a) Retinal fundus image (b) green channel (c) grayscale image (d) filtered image (e) segmentation process
4.1 Segmentation of Retinal Blood Vessels
Retinal blood vessel segmentation helps eye specialists to perform mass vision screening exams for early detection and treatment of DR. This helps in prevention of vision impairments and reduction of screening cost. Different categories of blood vessel segmentation techniques are discussed in this work.
4.1.1 Kernel Based Segmentation
This segmentation method is dependent on the variation of pixel intensities of retinal blood vessels which builds a filter kernel and detects retinal vessel boundaries. The kernel can take the form of the cross-section of the retinal vessel or can be modified depending on the vessel boundaries [45]. By considering that the blood vessels have a symmetric Gaussian cross-section and non-blood vessels have an asymmetric cross-section, a matched filter with symmetric Gaussian kernel and another with the first-order derivation of Gaussian is proposed [46]. Kernel based segmentation suffers from the limitation that some non-vessel structures are segmented as a part of the retinal vessels that subsequently degrade the performance of the segmentation.
4.1.2 Thresholding Based Segmentation
Thresholding based segmentation sets a value from the image which maximizes the separation between different classes in the image. This is useful for segmenting thick blood vessels [47]. Statistical thresholding method generates a binary vascular mask to isolate the vessels from the rest of the image and helps in effective segmentation [48]. A knowledge-based thresholding method using a verification based multi thresholding probing scheme is proposed in Jiang et al. [49]. Uneven illumination and presence of artifacts serve as a major drawback for thresholding based segmentation.
4.1.3 Model-Based Segmentation
This segmentation method is based on shape variation modeling where the shape can be a flexible curve or surface which is modified depending on the object class. It can be of two types: parametric deformable model and geometric deformable model. Parametric deformable models are characterized by curves or active contours whereas geometric deformable models are characterized by surfaces. An active contour model for vessel segmentation uses a combination of intensity information and enhancement map to preserve the vessel edges and correctly segment the blood vessels [50]. A local region area descriptor using a contour-based model for the segmentation of retinal vessels is proposed in Gongt et al. [51]. A contour region is decided based on which the entire image is divided into different parts depending on the pixel position. Ridge identification and boundary detection of retinal vessels using the phase map is a level set based retinal vessel segmentation technique presented in Dizdaro et al. [52]. A major drawback of the model-based technique is the difficulty in finding a set of seed points.
4.1.4 Soft Computing Based Segmentation
Soft computing has become a popular research area and is gaining importance over the years. It is being applied in various research areas mainly in medical image analysis. Tab. 2 gives different soft computing-based segmentation techniques.
Table 2: Intelligent systems for segmentation

Soft computing segmentation can be classified as supervised and unsupervised. Some of the supervised techniques used are moment invariant based feature and feedforward neural network [57], pathological and vessel structure based on booster decision tree [58], and integrated features with AdaBoost classifier [59]. Even though supervised segmentation is effective over unsupervised segmentation, it is sensitive to shape, size, or connectivity of blood vessels and may lead to performance degradation due to incorrect identification of retinal structures.
4.2 Segmentation and Elimination of Optic Disc
The change in anatomical structures in the human retina such as blood vessel, optic disc, and optic cup are the early indicators of DR. Due to the similar structures of optic disc and lesion (Exudate), there are chances for incorrect grading of DR. So, it is important to have the proper segmentation and elimination of optic disc. Segmentation of optic disc is used for the detection of glaucoma but for the grading of DR, optic disc segmentation and elimination are considered as the preprocessing stages. Optic disc processing comprises two stages: Localization and Segmentation. In order to localize the optic disc two different techniques are used:
a) Detecting the circular bright shapes by analyzing the vessel convergence [60].
b) Using fuzzy hough transform to detect the brightest circular area [61].
Optic disc segmentation using Peripapillary Atrophy (PPA) elimination includes edge filtering, elliptical hough transform, and  -PPA detection. Finding the region of interest and the edges of the optic disc are the main steps in this method [62]. Apart from hough transform, circular transformation can also be used for optic disc segmentation. It detects the circular boundary and variation in color across the optic disc boundary [63]. Once the segmentation is done, the optic disc can be eliminated from the segmented image by considering the average diameter of the optic disc.
4.3 Segmentation of Retinal Lesions
Lesions in the retina are the most critical indicator of DR. Eye specialists diagnose and grade DR depending on the presence of these lesions. The lesions in the retinal images are Microaneurysms, Exudates, Hemorrhages, and Cotton-Wool Spots. Effective segmentation is characterized by the identification of retinal lesions based on the intensity spectrum. However low contrast of the individual lesions and its overlapping intensity spectrum makes it difficult to perform multiregional segmentation to separate the lesions from the surrounding. A segmentation approach for bright lesions (Exudates, Cotton Wool Spots) and dark lesions (Microaneurysms, Hemorrhages) using an adaptive region growing with background correction is proposed in Köse et al. [64]. This method is effective in removing blood vessels and the optic disc region to correctly segment the lesions. Identification and differentiation of dark and bright lesions using the combination of matched filter and Laplacian of Gaussian (LoG) filter is described in Kar et al. [65]. Transfer learning and fined tuning based exudate segmentation identify potential bright lesions which are classified based on k-Nearest Neighbor (kNN) [66]. Convolutional Neural Network (CNN) based techniques are also effective for lesion segmentation. One of the major drawbacks of this method is its sensitivity to background noise.
Ophthalmologists found abnormalities in images using morphological, and texture-based features. Segmentation and classification of retinal lesions use the mathematical representation of features for the ophthalmologist visualization. A morphological based geometrical feature is mainly classified by the size, shape, and contour of retinal lesions. It contains 15 features for grading of DR by visualizing the bright and dark lesions using geometrical properties. Geometrical features include Area, Perimeter, Thinness Ratio, Bounding Length and Width, Major axis length, Minor axis length, Aspect ratio, Rectangular aspect ratio, Area ratio, Maximum radius, Minimum radius, Radius ratio, Standard deviation, Mean of all radii and Haralick ratio. Texture features include First Order Statistics (FOS), Gray Level Co-Occurrence Matrix of Second Order Statistics (GLCM), and Gray Level Run Length Matrix of Higher Order Statistics (GLRLM). Mean, Median, Mode, Range, Variance, Standard Deviation, Skewness, and Kurtosis are considered as FOS, i.e., First Order Statistical Texture Features. Correlation, Homogeneity, Clustershade, Entropy, Cluster Prominence, Autocorrelation, and Dissimilarity are considered as GLCM, i.e., Second Order Statistical Texture Features. Long Run Emphasis, Short Run Emphasis, Gray Level Nonuniformity, Run Length Nonuniformity, and Run Percentage are considered as GLRLM, i.e., Higher Order Statistical Texture Features.
Feature selection chooses the most significant features that contribute to the output. It is done to eliminate redundant attributes that may affect the accuracy of the framework. The normal features in fundus image include blood vessel, fovea, and the optic disc, and the abnormal features include microaneurysms, exudate, hemorrhages, and cotton wool spots. Exudate detection using mathematical morphology method is proposed in Sopharak et al. [67]. It can detect exudate from low contrast images thereby helping the eye specialist to detect the symptoms faster. Blood vessel detection and segmentation using Bee Colony Swarm Optimization is presented in Hassanien et al. [68]. This method can effectively detect the presence of blood vessels with small diameters also. Exudate detection using the Genetic Algorithm a fuzzy c means clustering utilizes retinal color information to identify variation in exudate color [69]. SVM with glowworm swarm and ant colony optimization can detect microaneurysms and cotton wool spots [70,71]. Artificial neural networks can identify hemorrhages, microaneurysms, hard exudates, and cotton wool spots [72]. Exudates can also be identified by Fisher’s linear discriminant analysis and recursive elimination using logistic regression [73,74]. The main limitation as part of exudate detection is the small area it occupies and the similar structure of the optic disc.
Diabetic Retinopathy has a significant impact on the lights of diabetic patients. Proper detection and classification of patients with DR can reduce the risk of vision loss. DR falls into two main categories: Normal, mild NPDR, moderate NPDR, severe NPDR and PDR depending on whether or not there is abnormal blood vessel growth in the retina. DR classification based on its severity can be classified by extracting Microaneurysms, Hemorrhages, Exudates, and Cotton-Wool Spots, and given to the classifiers for classification. The sample images of different stages of DR is shown in Fig. 2.
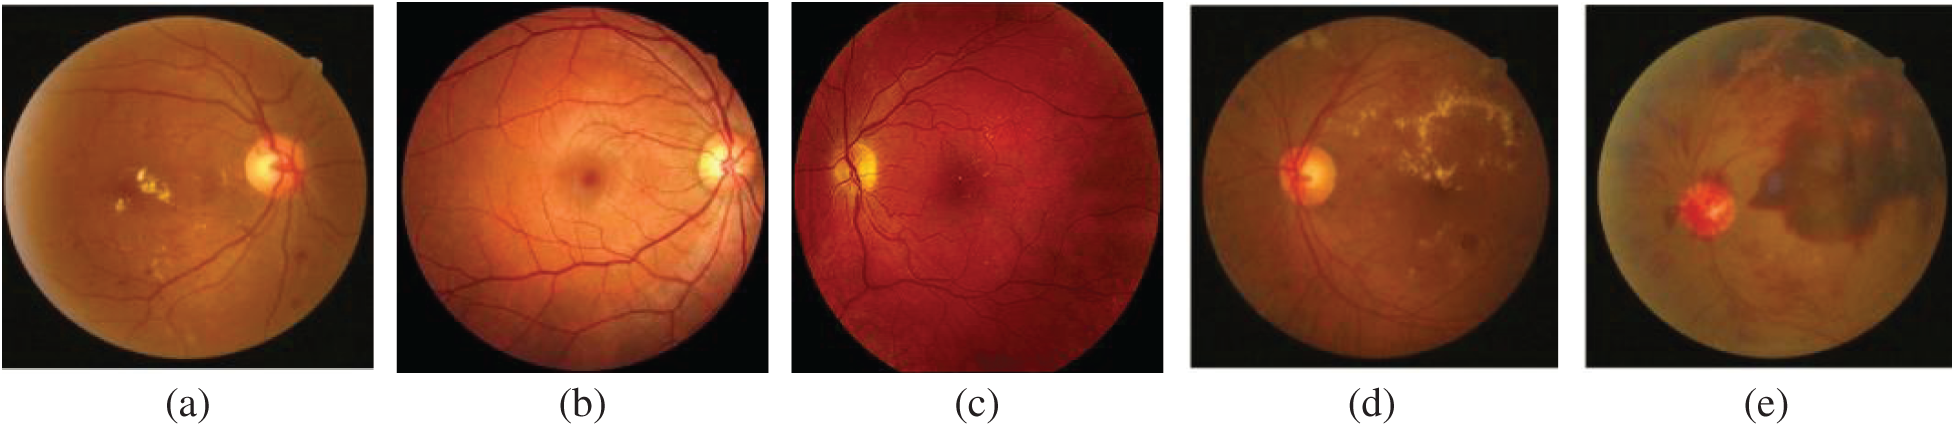
Figure 2: Different stages of DR (a) normal fundus image (b) mild NPDR (c) moderate NPDR (d) severe NPDR (e) PDR
Early identification is difficult because only retinal structural changes happen using during the early stage. Machine learning and deep learning methods are implemented for the automated grading of DR in which multiclass classification implementation is the challenges mostly faced by the researchers [75]. Salient area highlighting and abnormal findings in the fundus images can be implemented by deep learning algorithms [76]. CNN architectures not only reduce the computational power but also gives the better performance [77]. Although many methods have been developed, researchers could not yet generalize a methodology for practical clinical use. Various classification approaches with the datasets used, extracted features along with the performance analysis are listed in Tab. 3.
Table 3: Various classification approaches

8 Performance Measures and Discussions
It is mandatory to evaluate the algorithms to find out the effectiveness of implementation based on the model and the datasets. Considering classification, detection, segmentation, and prediction, various metrics were used to evaluate different machine learning algorithms. Several methods can be used to measure the performance of the algorithm. Few of them are accuracy, Area under curve (AUC), confusion matrix, precision, recall, sensitivity, specificity, and F-Score. The confusion matrix is a matrix output that describes the performance of the model by the above metrices. Binary classification takes two possible values: positive and negative. There are four terms: True Positive (TP) in which predicted class is true and actual class is also true, i.e., Normal image classified correctly as the normal fundus image, True Negative (TN) in which predicted class is false but actual class is true, i.e., DR image is correctly classified as DR, False Positive (FP) in which predicted class is true whereas actual class is false, i.e., DR image is wrongly classified as normal fundus image and False Negative (FN) in which both predicted class and actual class are false, i.e., normal fundus image is wrongly classified as DR.
The CAD system comprises image enhancement, segmentation, feature extraction, feature selection, and classification where in the first stage, fundus image quality is enhanced for effective DR feature detection. Segmentation localizes and separates the region of interest from the background information after which extraction of the segmented region is done for further classification. Finally, DR is graded into different classes (Normal, Mild NPDR, Moderate NPDR, Severe NPDR, PDR) depending on the extent of damage to the retina. From this survey, it can be observed that significant efforts have been made for enhancing the image quality by modifying the image contrast and background illumination. Various filters such as Median, Gaussian, Gabor, and Bilateral filters have been found to perform better due to the edge-preserving property of the filter.
Segmentation of retinal image has a direct effect on the accuracy and grading of DR and hence, researchers have put in a lot of effort to provide accurate segmentation. DR segmentation segments key features in DR such as blood vessels, optic discs, microaneurysms, exudates, hemorrhages, and cotton wool spots. Segmentation is performed using various techniques such as model-based, kernel based, and thresholding based segmentation. However, due to the limitations in the traditional segmentation methods such as the manual selection of seed points, researchers have delved more into soft computing-based segmentation. It is also necessary that optic disc should be removed before the segmentation of lesions to avoid misclassification due to the similar structures of optic disc and exudates. Various techniques such as mathematical morphology and recursive feature elimination using logistic regression have been applied for feature selection. To enhance these approaches, optimization-based algorithms such as Artificial Bee Colony Optimization, Genetic Algorithm, and Ant Colony Optimization have been applied. From this review, it is clear that the evolutionary algorithms are effective in performing parameter optimization for feature selection classification. However, applying soft computing techniques for segmentation and classification though effective can make the CAD system time-consuming.
Diabetic Retinopathy is one of the most important causes of vision impairment in the world. Early detection and diagnosis can reduce the severity of vision loss due to DR. This paper presents a comparative analysis of various stages of CAD system for detecting DR. Grading of DR is judged by the presence of dark and bright lesions in the retinal fundus image. The CAD system is composed of various stages namely (i) Retinal image enhancement, (ii) Optic disc removal and segmentation of blood vessel and lesions, (iii) DR feature extraction and selection, and (iv) Grading of the severity level of DR. Under-segmentation or over-segmentation of DR features due to varying sizes, presence of blocking artifacts, and resemblance in structures of anatomical and clinical features are some of the drawbacks seen in the CAD system. Even though various methods have proven to give good detection accuracy the researchers are still finding it difficult to generalize a methodology for practical clinical use. Researchers should extend their work focusing on the construction of a prediction model with multi categorical classification techniques to improve the grading of DR.
Funding Statement: The authors received no specific funding for this study.
Conflicts of Interest: The authors declare that they have no conflict of interest to report regarding the present study.
1. T. J. MacGillivray, E. Trucco, J. R. Cameron, B. Dhillon, J. G. Houston et al. (2014). , “Retinal imaging as a source of biomarkers for diagnosis, characterization and prognosis of chronic illness or long-term conditions,” British Journal of Radiology, vol. 87, no. 1040, pp. 1–16. [Google Scholar]
2. P. Moinul, J. Barbosa, J. Qian, M. L. Chen, M. Mohaghegh et al. (2018). , “Does patient education improve compliance to routine diabetic retinopathy screening?,” Journal of Telemedicine and Telecare, vol. 26, no. 3, pp. 1–13. [Google Scholar]
3. A. Julius and W. Hopper. (2019). “A non-invasive, multi-target approach to treat diabetic retinopathy,” Biomedicine & Pharmacotherapy, vol. 109, pp. 708–715. [Google Scholar]
4. R. Williams, M. Airey, H. Baxter, J. Forrester, T. Kennedy-Martin et al. (2004). , “Epidemiology of diabetic retinopathy and macular oedema: A systematic review,” Eye, vol. 18, no. 10, pp. 963–983. [Google Scholar]
5. A. Benzamin and C. Chakraborty. (2018). “Detection of hard exudates in retinal fundus images using deep learning,” in Proc. ICIEV & iclVPR, Kitakyushu, Japan, pp. 465–469. [Google Scholar]
6. T. Y. P. Chui, L. N. Thibos, A. Bradley and S. A. Burns. (2009). “The mechanisms of vision loss associated with a cotton wool spot,” Vision Research, vol. 49, no. 23, pp. 2826–2834. [Google Scholar]
7. A. Patz. (1980). “Studies on retinal neovascularization. friedenwald lecture,” Investigative Ophthalmology & Visual Science, vol. 19, no. 10, pp. 1133–1138. [Google Scholar]
8. L. Giancardo, F. Meriaudeau, T. P. Karnowski, Y. Li, S. Garg et al. (2012). , “Exudate-based diabetic macular edema detection in fundus images using publicly available datasets,” Medical Image Analysis, vol. 16, no. 1, pp. 216–226. [Google Scholar]
9. K. Suzuki, F. Li, S. Sone and K. Doi. (2005). “Computer-aided diagnostic scheme for distinction between benign and malignant nodules in thoracic low-dose CT by use of massive training artificial neural network,” IEEE Transactions on Medical Imaging, vol. 24, no. 9, pp. 1138–1150. [Google Scholar]
10. A. Lostumbo, K. Suzuki and A. H. Dachman. (2010). “Flat lesions in CT colonography,” Abdominal Imaging, vol. 35, no. 5, pp. 578–583.
11. N. Salamat, M. M. S. Missen and A. Rashid. (2019). “Diabetic retinopathy techniques in retinal images: A review,” Artificial Intelligence in Medicine, vol. 97, pp. 168–188. [Google Scholar]
12. P. Liskowski and K. Krawiec. (2016). “Segmenting retinal blood vessels with deep neural networks,” IEEE Transactions on Medical Imaging, vol. 35, no. 11, pp. 2369–2380. [Google Scholar]
13. S. Roychowdhury, D. D. Koozekanani and K. K. Parhi. (2014). “DREAM: Diabetic retinopathy analysis using machine learning,” IEEE Journal of Biomedical and Health Informatics, vol. 18, no. 5, pp. 1717–1728. [Google Scholar]
14. P. Adarsh and D. Jeyakumari. (2013). “Multiclass SVM-based automated diagnosis of diabetic retinopathy,” in Proc. ICCSP, Melmaruvathur, India, pp. 206–210. [Google Scholar]
15. P. Khojasteh, B. Aliahmad and D. K. Kumar. (2018). “Fundus images analysis using deep features for detection of exudates, hemorrhages and microaneurysms,” BMC Ophthalmology, vol. 18, no. 1, pp. 1–13. [Google Scholar]
16. G. Quellec, K. Charrière, Y. Boudi, B. Cochener and M. Lamard. (2017). “Deep image mining for diabetic retinopathy screening,” Medical Image Analysis, vol. 39, pp. 178–193. [Google Scholar]
17. Z. Jiang, H. Zhang, Y. Wang and S. B. Ko. (2018). “Retinal blood vessel segmentation using fully convolutional network with transfer learning,” Computerized Medical Imaging and Graphics, vol. 68, pp. 1–15. [Google Scholar]
18. C. Hernandez-matas, X. Zabulis, A. Triantafyllou and P. Anyfanti. (2017). “FIRE: Fundus image registration dataset,” Journal for Modeling in Opthalmology, vol. 1, no. 4, pp. 16–28. [Google Scholar]
19. M. V. D. S. Ferreira, A. O. D. C. Filho, A. D. D. Sousa, A. C. Silva and M. Gattass. (2018). “Convolutional neural network and texture descriptor-based automatic detection and diagnosis of glaucoma,” Expert Systems with Applications, vol. 110, pp. 250–263. [Google Scholar]
20. V. Das, S. Dandapat and P. K. Bora. (2019). “A novel diagnostic information based framework for super-resolution of retinal fundus images,” Computerized Medical Imaging and Graphics, vol. 72, pp. 22–33. [Google Scholar]
21. D. Mahapatra, B. Bozorgtabar and R. Garnavi. (2019). “Image super-resolution using progressive generative adversarial networks for medical image analysis,” Computerized Medical Imaging Graphics, vol. 71, pp. 30–39. [Google Scholar]
22. P. Dai, H. Sheng, J. Zhang, L. Li, J. Wu et al. (2016). , “Retinal fundus image enhancement using the normalized convolution and noise removing,” International Journal of Biomedical Imaging, vol. 2016, pp. 1–12. [Google Scholar]
23. A. Roy, D. Dutta, P. Bhattacharya and S. Choudhury. (2017). “Filter and fuzzy c means based feature extraction and classification of diabetic retinopathy using support vector machines,” in Proc. ICCSP, Chennai, India, pp. 1844–1848. [Google Scholar]
24. P. Raghavi. (2013). “Classification and grading of diabetic retinal images for implementation of computer-aided diagnosis system,” International Journal of Engineering Research and Technology, vol. 2, no. 8, pp. 1966–1972. [Google Scholar]
25. A. Salvatelli, G. Bizai, G. Barbosa, B. Drozdowicz and C. Delrieux. (2007). “A comparative analysis of pre-processing techniques in colour retinal images,” Journal of Physics: Conference Series, vol. 90, no. 1, pp. 012069. [Google Scholar]
26. S. S. Sonali, A. K. Singh, S. P. Ghrera and M. Elhoseny. (2019). “An approach for de-noising and contrast enhancement of retinal fundus image using CLAHE,” Optics & Laser Technology, vol. 110, pp. 87–98. [Google Scholar]
27. A. W. Setiawan, T. R. Mengko, O. S. Santoso and A. B. Suksmono. (2013). “Color retinal image enhancement using CLAHE,” in Proc. ICICTSS, Jakarta, Indonesia, pp. 1–3. [Google Scholar]
28. S. Pal and S. Chatterjee. (2017). “Mathematical morphology aided optic disk segmentation from retinal images,” in Proc. CATCON, Rupnagr, India, pp. 380–385. [Google Scholar]
29. R. Sukanya and G. Holi. (2015). “Retinal blood vessel segmentation and optic disc detection using combination of spatial domain techniques,” International Journal of Computer Science Engineering, vol. 4, no. 3, pp. 102–109.
30. M. Berndt-Schreiber. (2007). “Morphological operations in fundus image analysis,” Journal of Medical Informatics & Technologies, vol. 11, pp. 79–86. [Google Scholar]
31. N. S. Datta, H. S. Dutta and K. Majumder. (2016). “Brightness-preserving fuzzy contrast enhancement scheme for the detection and classification of diabetic retinopathy disease,” Journal of Medical Imaging, vol. 3, no. 1, pp. 014502. [Google Scholar]
32. S. K. Ghosh, B. Biswas and A. Ghosh. (2020). “A novel enhancement and segmentation of color retinal image based on fuzzy measure and fuzzy integral,” in Proc. CIPR, Kolkata, India, pp. 9–21. [Google Scholar]
33. P. Feng, Y. Pan, B. Wei, W. Jin and D. Mi. (2007). “Enhancing retinal image by the contourlet transform,” Pattern Recognition Letters, vol. 28, no. 4, pp. 516–522. [Google Scholar]
34. M. S. Miri and A. Mahloojifar. (2011). “Retinal image analysis using curvelet transform and multistructure elements morphology by reconstruction,” IEEE Transactions on Biomedical Engineering, vol. 58, no. 5, pp. 1183–1192. [Google Scholar]
35. T. A. Soomro and J. Gao. (2016). “Non-invasive contrast normalisation and denosing technique for the retinal fundus image,” Annals of Data Science, vol. 3, no. 3, pp. 265–279. [Google Scholar]
36. M. U. Akram, S. Khalid, A. Tariq, S. A. Khan and F. Azam. (2014). “Detection and classification of retinal lesions for grading of diabetic retinopathy,” Computers in Biology and Medicine, vol. 45, pp. 161–171. [Google Scholar]
37. M. Sharif and J. H. Shah. (2019). “Automatic screening of retinal lesions for grading diabetic retinopathy,” International Arab Journal of Information Technology, vol. 16, no. 4, pp. 766–774. [Google Scholar]
38. I. Qureshi, J. Ma and K. Shaheed. (2019). “A hybrid proposed fundus image enhancement framework for diabetic retinopathy,” Algorithms, vol. 12, no. 1, pp. 1–16. [Google Scholar]
39. N. Singh, L. Kaur and K. Singh. (2019). “Histogram equalization techniques for enhancement of low radiance retinal images for early detection of diabetic retinopathy,” Engineering Science and Technology, An International Journal, vol. 22, no. 3, pp. 736–745. [Google Scholar]
40. Q. Abbas, A. Farooq, M. T. A. Khan, M. E. Celebi, I. F. Garcia et al. (2013). , “Feature preserving contrast improvement for retinal vascular images,” ICIC International, vol. 9, no. 9, pp. 3731–3739. [Google Scholar]
41. K. Nirmala and N. Venkateswaran. (2014). “Analysis of enhancement techniques for retinal Images,” International Journal of Scientific & Engineering Research, vol. 5, no. 4, pp. 266–271. [Google Scholar]
42. M. Kaur and A. Kamra. (2019). “A novel mechanism for enhancement and detection of retinal blood vessels,” International Journal of Engineering and Advanced Technology, vol. 9, no. 1, pp. 1048–1054. [Google Scholar]
43. Y. M. S. Reddy, R. S. E. Ravindran and K. H. Kishore. (2018). “Spatial mutual relationship based retinal image contrast enhancement for efficient diagnosis of diabetic retinopathy,” International Journal of Intelligent Engineering & Systems, vol. 11, no. 5, pp. 48–58. [Google Scholar]
44. M. N. Naik and K. V. S. Reddy. (2019). “Spatial correlation based contrast enhancement for retinal images,” International Journal of Innovative Technology Exploring Engineering, vol. 8, no. 4S2, pp. 130–134. [Google Scholar]
45. J. Almotiri, K. Elleithy and A. Elleithy. (2018). “Retinal vessels segmentation techniques and algorithms: A survey,” Applied Sciences, vol. 8, no. 2, pp. 155. [Google Scholar]
46. B. Zhang, L. Zhang, L. Zhang and F. Karray. (2010). “Retinal vessel extraction by matched filter with first-order derivative of Gaussian,” Computers in Biology and Medicine, vol. 40, no. 4, pp. 438–445. [Google Scholar]
47. L. Xu and S. Luo. (2010). “A novel method for blood vessel detection from retinal images,” Biomedical Engineering Online, vol. 9, no. 1, pp. 1–10. [Google Scholar]
48. M. U. Akram, A. Tariq and S. A. Khan. (2009). “Retinal image blood vessel segmentation,” in Proc. ICICT, Karachi, Pakistan, pp. 181–192. [Google Scholar]
49. X. Jiang and D. Mojon. (2003). “Adaptive local thresholding by verification-based multithreshold probing with application to vessel detection in retinal images,” IEEE Transactions on Pattern Analysis and Machine Intelligence, vol. 25, no. 1, pp. 131–137. [Google Scholar]
50. Y. Zhao, L. Rada, K. Chen, S. P. Harding and Y. Zheng. (2015). “Automated vessel segmentation using infinite perimeter active contour model with hybrid region information with application to retinal images,” IEEE Transactions on Medical Imaging, vol. 34, no. 9, pp. 1797–1807. [Google Scholar]
51. H. Gongt, Y. Li, G. Liu, W. Wu and G. Chen. (2015). “A level set method for retina image vessel segmentation based on the local cluster value via bias correction,” in Proc. IEEE (CISPShenyang, China, pp. 413–417. [Google Scholar]
52. B. Dizdaro, E. Ataer-Cansizoglu, J. Kalpathy-Cramer, K. Keck, M. F. Chiang et al. (2012). , “Level sets for retinal vasculature segmentation using seeds from ridges and edges from phase maps,” in Proc. MLSP, Santander, Spain, pp. 1–6. [Google Scholar]
53. Q. Li, B. Feng, L. Xie, P. Liang, H. Zhang et al. (2015). , “A cross-modality learning approach for vessel segmentation in retinal images,” IEEE Transactions on Medical Imaging, vol. 35, no. 1, pp. 109–118. [Google Scholar]
54. S. W. Franklin and S. E. Rajan. (2014). “Retinal vessel segmentation employing ANN technique by gabor and moment invariants-based features,” Applied Soft Computing, vol. 22, pp. 94–100. [Google Scholar]
55. N. Memari, A. R. Ramli, M. I. B. Saripan, S. Mashohor and M. Moghbel. (2019). “Retinal blood vessel segmentation by using matched filtering and fuzzy c-means clustering with integrated level set method for diabetic retinopathy assessment,” Journal of Medical and Biological Engineering, vol. 39, no. 5, pp. 713–731. [Google Scholar]
56. Y. Jiang, H. Zhang, N. Tan and L. Chen. (2019). “Automatic retinal blood vessel segmentation based on fully convolutional neural networks,” Symmetry, vol. 11, no. 9, pp. 1112. [Google Scholar]
57. D. Marín, A. Aquino, M. E. Gegúndez-Arias and J. M. Bravo. (2010). “A new supervised method for blood vessel segmentation in retinal images by using gray-level and moment invariants-based features,” IEEE Transactions on Medical Imaging, vol. 30, no. 1, pp. 146–158. [Google Scholar]
58. M. M. Fraz, P. Remagnino, A. Hoppe, B. Uyyanonvara, A. R. Rudnicka et al. (2012). , “An ensemble classification–Based approach applied to retinal blood vessel segmentation,” IEEE Transactions on Biomedical Engineering, vol. 59, no. 9, pp. 2538–2548. [Google Scholar]
59. C. A. Lupaşcu, D. Tegolo and E. Trucco. (2010). “FABC: Retinal vessel segmentation using adaboost,” IEEE Transactions on Information Technology in Biomedicine, vol. 14, no. 5, pp. 1267–1274. [Google Scholar]
60. A. Hoover and M. Goldbaum. (2003). “Locating the optic nerve in a retinal image using the fuzzy convergence of the blood vessels,” IEEE Transactions on Medical Imaging, vol. 22, no. 8, pp. 951–958. [Google Scholar]
61. M. Abdullah, M. M. Fraz and S. A. Barman. (2016). “Localization and segmentation of optic disc in retinal images using circular hough transform and grow-cut algorithm,” PeerJ, vol. 4, pp. 1–22. [Google Scholar]
62. J. Cheng, J. Liu, D. W. K. Wong, F. Yin, C. Cheung et al. (2011). , “Automatic optic disc segmentation with peripapillary atrophy elimination,” in Proc. IEEE (EMBSBoston, MA, USA, pp. 6224–6227. [Google Scholar]
63. S. Lu. (2011). “Accurate and efficient optic disc detection and segmentation by a circular transformation,” IEEE Transactions on Medical Imaging, vol. 30, no. 12, pp. 2126–2133. [Google Scholar]
64. C. Köse, U. Şevik, C. Ikibaş and H. Erdöl. (2012). “Simple methods for segmentation and measurement of diabetic retinopathy lesions in retinal fundus images,” Computer Methods and Programs in Biomedicine, vol. 107, no. 2, pp. 274–293. [Google Scholar]
65. S. S. Kar and S. P. Maity. (2018). “Gradation of diabetic retinopathy on reconstructed image using compressed sensing,” IET Image Processing, vol. 12, no. 11, pp. 1956–1963. [Google Scholar]
66. M. Niemeijer, B. V. Ginneken, S. R. Russell, M. S. A. Suttorp-Schulten, M. D. Abràmoff. (2007). “Automated detection and differentiation of drusen, exudates, and cotton-wool spots in digital color fundus photographs for diabetic retinopathy diagnosis,” Investigative Ophthalmology & Visual Science, vol. 48, no. 5, pp. 2260–2267. [Google Scholar]
67. A. Sopharak, B. Uyyanonvara, S. Barman and T. H. Williamson. (2008). “Automatic detection of diabetic retinopathy exudates from non-dilated retinal images using mathematical morphology methods,” Computerized Medical Imaging Graphics, vol. 32, no. 8, pp. 720–727. [Google Scholar]
68. A. E. Hassanien, E. Emary and H. M. Zawbaa. (2015). “Retinal blood vessel localization approach based on bee colony swarm optimization, fuzzy c-means and pattern search,” Journal of Visual Communication Image Representation, vol. 31, pp. 186–196. [Google Scholar]
69. A. Osareh, B. Shadgar and R. Markham. (2009). “A computational-intelligence-based approach for detection of exudates in diabetic retinopathy images,” IEEE Transactions on Information Technology in Biomedicine, vol. 13, no. 4, pp. 535–545. [Google Scholar]
70. R. Karthikeyan and P. Alli. (2018). “Feature selection and parameters optimization of support vector machines based on hybrid glowworm swarm optimization for classification of diabetic retinopathy,” Journal of Medical Systems, vol. 42, no. 10, pp. 1–11. [Google Scholar]
71. S. Sreng, N. Maneerat, K. Hamamoto and R. Panjaphongse. (2019). “Cotton wool spots detection in diabetic retinopathy based on adaptive thresholding and ant colony optimization coupling support vector machine,” IEEJ Transactions on Electrical and Electronic Engineering, vol. 14, no. 6, pp. 884–893. [Google Scholar]
72. D. Usher, M. Dumskyjs, M. Himaga, T. H. Williamsont, S. Nussey et al. (2004). , “Automated detection of diabetic retinopathy in digital retinal images: a tool for diabetic retinopathy screening,” Diabetic Medicine, vol. 21, no. 1, pp. 84–90. [Google Scholar]
73. C. I. Sánchez, R. Hornero, M. I. López, M. Aboy, J. Poza et al. (2008). , “A novel automatic image processing algorithm for detection of hard exudates based on retinal image analysis,” Medical Engineering & Physics, vol. 30, no. 3, pp. 350–357. [Google Scholar]
74. K. Akyol, B. Şen, Ş. Bayir and H. B. Çakmak. (2017). “Assessing the importance of features for detection of hard exudates in retinal images,” Turkish Journal of Electrical Engineering & Computer Sciences, vol. 25, no. 2, pp. 1223–1237. [Google Scholar]
75. F. Li, Z. liu, H. Chen, M. Jiang, X. Zhang et al. (2019). , “Automatic detection of diabetic retinopathy in retinal fundus photographs based on deep learning algorithm,” Translational Vision Science & Technology, vol. 8, no. 6, pp. 1–13. [Google Scholar]
76. J. Son, J. Y. Shin, H. D. Kim, K. H. Jung, K. H. Park et al. (2020). , “Development and validation of deep learning models for screening multiple abnormal findings in retinal fundus images,” American Academy of Ophthalmology, vol. 127, no. 1, pp. 85–94. [Google Scholar]
77. S. B. Hathwar and G. Srinivasa. (2019). “Automated grading of diabetic retinopathy in retinal fundus images using deep learning,” in Proc. ICSIPA, Kuala Lumpur, Malaysia, pp. 73–77. [Google Scholar]
78. V. Chandore and S. Asati. (2017). “Automatic detection of diabetic retinopathy using deep convolutional neural network,” International Journal of Advance Research, Ideas and Innovations in Technology, vol. 3, no. 4, pp. 633–641. [Google Scholar]
79. S. Kumar and B. Kumar. (2018). “Diabetic retinopathy detection by extracting area and number of microaneurysm from colour fundus image,” in Proc. SPIN, Noida, India, pp. 359–364. [Google Scholar]
80. S. Kanth, A. Jaiswal and M. Kakkar. (2013). “Identification of different stages of diabetic retinopathy using artificial neural network,” in Proc. IC3, Noida, India, pp. 479–484. [Google Scholar]
81. T. Chandrakumar and R. Kathirvel. (2016). “Classifying diabetic retinopathy using deep learning architecture,” International Journal of Engineering Research & Technology, vol. 5, no. 6, pp. 19–24. [Google Scholar]
82. M. Sankar, K. Batri and R. Parvathi. (2016). “Earliest diabetic retinopathy classification using deep convolution neural networks,” International Journal of Advanced Engineering Technology, vol. 7, no. 1, pp. 466–470. [Google Scholar]
83. M. Naveenraj, K. Haripriya, N. Keerthana, K. M. Priya and R. Mounika. (2016). “Severity grading for diabetic retinopathy,” International Journal of Recent Trends in Engineering and Research, vol. 2, pp. 146–150. [Google Scholar]
 | This work is licensed under a Creative Commons Attribution 4.0 International License, which permits unrestricted use, distribution, and reproduction in any medium, provided the original work is properly cited. |