DOI:10.32604/cmc.2021.012691
| Computers, Materials & Continua DOI:10.32604/cmc.2021.012691 | |
| Article |
Fully Automatic Segmentation of Gynaecological Abnormality Using a New Viola–Jones Model
1BIOCORE Research Group, Universiti Teknikal Malaysia Melaka, Melaka, 76100, Malaysia
2Director of UTeM International Centre, BIOCORE Research Group, Universiti Teknikal Malaysia Melaka, Melaka, 76100, Malaysia
3College of Computer Science and Information Technology, University of Anbar, Ramadi, 31001, Iraq
4Department of Computer Science, College of Computer Information Technology, American University in the Emirates, 503000, United Arab Emirates
5eVIDA Laboratory, University of Deusto,Bilbao, 48007, Spain
6Medical Laboratory Science Department, King Abdulaziz University, Jeddah, 21589, Saudi Arabia
7Software Engineering Department, College of Computer and Information Sciences, King Saud University, Riyadh, 11451, Saudi Arabia
*Corresponding Author: Mazin Abed Mohammed. Email: mazinalshujeary@uoanbar.edu.iq
Received: 09 July 2020; Accepted: 13 October 2020
Abstract: One of the most complex tasks for computer-aided diagnosis (Intelligent decision support system) is the segmentation of lesions. Thus, this study proposes a new fully automated method for the segmentation of ovarian and breast ultrasound images. The main contributions of this research is the development of a novel Viola–James model capable of segmenting the ultrasound images of breast and ovarian cancer cases. In addition, proposed an approach that can efficiently generate region-of-interest (ROI) and new features that can be used in characterizing lesion boundaries. This study uses two databases in training and testing the proposed segmentation approach. The breast cancer database contains 250 images, while that of the ovarian tumor has 100 images obtained from several hospitals in Iraq. Results of the experiments showed that the proposed approach demonstrates better performance compared with those of other segmentation methods used for segmenting breast and ovarian ultrasound images. The segmentation result of the proposed system compared with the other existing techniques in the breast cancer data set was 78.8%. By contrast, the segmentation result of the proposed system in the ovarian tumor data set was 79.2%. In the classification results, we achieved 95.43% accuracy, 92.20% sensitivity, and 97.5% specificity when we used the breast cancer data set. For the ovarian tumor data set, we achieved 94.84% accuracy, 96.96% sensitivity, and 90.32% specificity.
Keywords: Viola–Jones model; breast cancer segmentation; ovarian tumor; ovarian tumor segmentation; breast cancer; ultrasound images; active contour; cascade model
The analysis of images involves the extraction of their relevant details. Machines are typically used in this extraction process, with minimal human effort required [1–3]. The role of medical imaging systems in image processing cannot be underestimated because it involves the use of semi- and completely automatic algorithms for the high-speed and accurate analysis of images [4]. A wide range of imagery modalities can be used for the diagnosis of human diseases and ailments, such as detection of tumors. These devices are designed to capture the images of internal organs of humans in a non-invasive manner. One such device used for this purpose is the ultrasound scan, which is referred to as a sonogram. This device works by sending high-frequency sound waves over the tissues of a given body part. Moreover, this device has transducers that enable it to receive sound waves that are eventually converted to electric impulses. Thereafter, internal structure images are produced on the computer screen via electric pulses [5,6].
To date, an ultrasound machine has been used in identifying the risks of numerous tumors. This study uses such a machine to detect gynaecological abnormalities, particularly, ovarian tumor and breast cancer. The current research selects these two cases because they share similar problems and may have similar shapes. Accordingly, this study investigates the two cases to determine an effective solution. The hope is that this solution will assist experts in their diagnoses. To avoid human errors in the quantification and diagnosis stages, computer-based image processing and analysis tools should be developed to help minimize the rates of false positives and false negatives. Apart from the development of such tools, they should also be tested and combined into the medical identification. Many studies investigation and improvement of multidisciplinary technology must be pursued to address the challenges associated with detecting and classifying gynaecological abnormalities. Such a multidisciplinary technology must be a combination of machine learning, medical image classification methods, and pattern identification methods developed through the collaboration of domain experts. Note that human expertise cannot be replaced by computer-based tools because specialists have a wealth of knowledge obtained through life–long training. The most reliable method through which high accuracy can be achieved in terms of abnormality detection is the hybrid approach, which is also capable of improving patient care and management [7–9]. With such technologies, specific tools can be produced to assist in the training of radiology students in medical schools and other hospital personnel. In general, when a computer-based tool is being designed, an important aspect is to remember the purpose for which it is being designed. This tool must either be designed in a manner that it is equipped with features that facilitate decision-making, or as a conventional software that supports the automated extraction of parameters/features required by domain experts [10,11].
Computer-based tools equipped with decision-making capabilities, such that they are more sophisticated than conventional expert systems, should also be developed. In addition, machine learning techniques must be integrated into computer-based tools to enable the extraction of features that are seldom used by experts. Despite the need to develop sophisticated computerized tools, many challenges are associated with the design of these tools. However, they can be successfully designed through the selection of the most appropriate representation of data and methods of data analysis. The current study focuses on developing computerized tools that possess the characteristics of the second type of computerized tools. Given that domain knowledge of experts continues to increase and evolve, such tools will continue to be improved and designed rely on the facts and needs of felid specialists [12,13]. In the last decade, the domain of ultrasound medical image analysis has witnessed an increase in publications. However, only a few studies have been observed to focus on the area of fully automated gynaecological segmentation [14–16]. The next section presents an overview of the extant automated methods of the region-of-interest (ROI) segmentation and reviews the related studies. In particular, the focus of the current study is on the analysis of ultrasound images, and the images analysed in this research are those generated from gynaecological investigations and those collected for the purpose of ovarian tumor or breast cancer diagnosis. The aim is to develop and evaluate the efficiency of a new automated and computerized approach that is capable of analyzing gynaecological US for the detecting and classifying of abnormal cases or objects that have an impact on women’s health. The computational examinations conducted in this study are motivated by advancements in imaging technologies, advent of state-of-the-art models of data mining and machine learning, and image processing and analysis theories.
The current research aims to build an intelligent decision support system model that can segment and identify the risks of malignant breast cancer and ovarian tumor in the early stage. To achieve this objective, we should first identify the limitation of the existing methods and attempt to reduce the effects of the limitations. The limitations of ultrasound images can be classified into three parts. First, speckle noise is one of the major limitations that can affect segmentation and feature extraction. Speckle noise will reduce segmentation accuracy by increasing false cases and reducing the clarity of the ROI edge. For texture, speckle noise has resulted in an unclear ROI texture information, which cannot be used to identify malignant risks. Thereafter, building or using a good filter can facilitate the reduction of speckle noise, thereby making the segmentation and feature extraction task considerably easy. Second, the artifact produced from the machine can make the segmentation a difficult task. Lastly, powerful features may be difficult to find in identifying the risk of the malignant. Therefore, we proposed a model that can:
• Enhance images, thereby making it suitable for segmentation and enhancing the texture features for the diagnosis stage. Thereafter, we proposed a new cascade model to segment and extract ROI from ultrasound images. In the filtering stage, the proposed model combines the Wiener filter with wavelet filter to highlight ROI from the rest of the images and make the ROI edge clear for the segmentation task. In addition, the Wiener filter used alone will enhance the texture for the classification stage.
• For the segmentation stage, we modified the Viola–Jones model and made it suitable for the segmentation instead of using it for object detection. In the traditional method, the Viola–Jones model is used for object detection by scanning images with different window sizes. By using this method, we determined problems related to the false positive cases generated by the Viola–Jones model, although we cannot obtain the entire ROI from the images. Therefore, we end up with under- and over-segmentation problems. Our proposed model modified the Viola–Jones model and made it suitable for the segmentation task by scanning images pixel by pixel utilizing the local details of pixels.
The remainder of this paper is organized as follows. Section 2 presents the existing studies on the segmentation approach of automated ultrasound images. Section 3 explains the proposed Viola–Jones model to segment ultrasound images of ovarian and breast cancer cases. Section 4 presents the experiment results in terms of the segmentation and classification results. Lastly, Section 5 details the conclusion of our study.
2 Existing Studies on Automated US Segmentation
One of the main challenges associated with the detection of abnormalities in human organs is the extraction of relevant information from ultrasound images, and the possibility of human error in terms of inaccuracies in manual methods is high. The implication of such inaccuracies could be differences in intra- and inter-observer. Moreover, high-level experiences and expertise are required to interpret such an information. Thus, automatic methods of processing and analyzing images automatically should be developed. These automatic methods will enable gynaecologists and sonographers to accurately diagnose diseases [4,8]. Fig. 1 shows an illustration of the main components of the underpinning task of the automatic analysis of ultrasound cases.
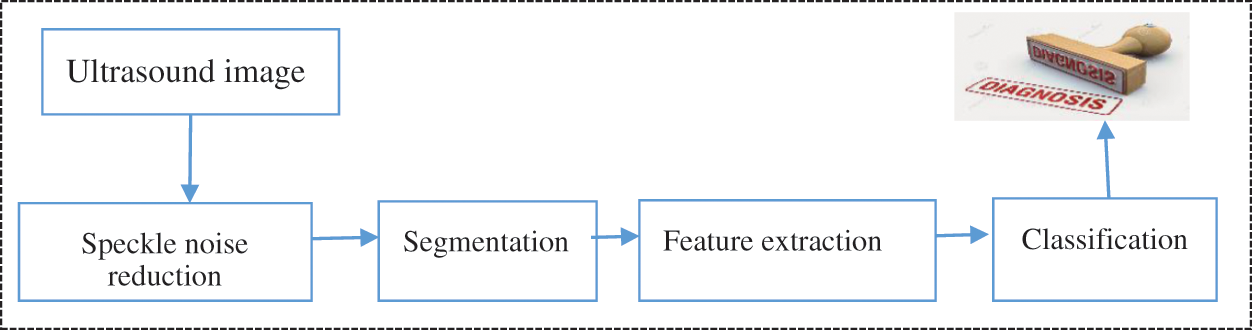
Figure 1: US analysis and understand
A common challenge in the area of image processing is segmentation (e.g., image analysis, recognition of pattern, and scene analysis) [4,17]. The segmentation process involves partitioning images into numerous groups of pixels, in which the grouping is done according to pixels that are similar in terms of certain criteria. One of the major principles of segmentation is that there must be no intersection of objects that vary, and neighboring objects should remain heterogeneous. Substances obtained from the process of segmentation are referred to as image segments. Segmentation is likewise a clustering-based task, which is utilized in image processing to divide digital images into different segmentation to enable the easy conduct of additional investigations. Segmentation is a crucial step in image analysis and the first step performed to differentiate the varying objects present in pictures. Accordingly, objects of interest are separated from the remaining objects. In this process, pixels with common visual characteristics, such as motion, color, depth, texture, intensity, and gray level, are categorized into salient image regions. ROI is extracted and represented from images using segmentation techniques [18].
At present, a variety of image segmentation applications enable the compression of images, retrieval of contents, editing of images, and machine vision (e.g., a method of arranging versatile robots). Other applications include computer-aided fingerprint recognition and facial identification, satellite imaging usages, and remote sensing applications. However, four main categories of image processing techniques are often used, and they are described as follows [19].
1. Edge-based methods. These methods are among the main essential approaches of medical image handling used in computer vision, the main aim of which is detection contours, which are representative of the boundaries of image objects. Such algorithms are advantageous because they offer low-cost computation. However, major challenges are associated with the edge grouping process, and some of them include setting the right thresholds and the production of connected, one-pixel-wide contours. The task of edge detecting often involves three steps. In the first step, noise is reduced through the use of smoothing techniques. The second step involves the application of local operators to detect edge points. In the last step, spurious pixels are eliminated from the edges [20].
2. Clustering-based methods: For this method, sorting or image pixels is performed in an aggregate order as a histogram based on intensity ratios. Examples of this approach include K-means and fuzzy-c-means (FCM) methods. This approach is advantageous because it allows the use of iterative processes on problems associated with threshold setting. Moreover, contours that are segmented are consistently continuous. However, the occurrence of over-segmentation will be recorded in an event that pixels belonging to the same cluster are not adjacent [21,22].
3. Region-based approaches: These approaches aim to detect regions in accordance with a certain predefined homogeneity threshold. This approach is widely available because segmentation contour is often uninterrupted and one-pixel-wide in this method. In addition, this approach offers shorter computational time. Nevertheless, variation may occur in the results of segmentation owing to the variation in similarity threshold settings, thereby possibly resulting in over-segmentation [12,14].
4. Split-merge methods: These approaches on response case can be partitioned into homogeneous original areas through the use of FCM or K-means as a split step. Thereafter, neighbouring objects that are similar to one another are combined into a specific decision rule as a merging step [5,10].
One of the most critical steps in the processing and analysis of images is the segmentation of US cases, which is also a difficult task aimed at dividing images into meaningful parts. This process is used in distinguishing objects of interest from the background. Numerous conventional techniques and approaches have been used in ultrasound image segmentation. However, binary segmentation is the easiest method that can be implemented easily and is accompanied by rapid operation procedures. In this section, the studies reviewed have been subjected to thorough clinical validation.
A novel automatic method of follicle segmentation was proposed. In the current research, the images of human ovaries were smoothened through the use of an adaptive neighbourhood median filter, whereas the geometric active contour methods are utilized for the initial segmentation of the dark regions. The process involve as it were portion of these dark segmenting areas is a true, curiously objects. A SVM classifier was used to determine whether every dark area is completely carpel or not [22]. In the study conducted by [23], a semi-automated segmentation approach was introduced to segment the left ventricle in the US imaging of the heart. Segmentation was carried out through the use of the snake method, which is particularly tailored to address the issues associated with the processing of ultrasound images. The snake technique uses two anchor points and builds a tracking approach alongside a prior model for the frame-to-frame movement. By means of the proposed method, segmentation is carried over the entire cardiac cycle with as it were an initialization within the to begin with outline.
An active contour approach was proposed by [24], which uses a genetic algorithm to achieve optimization. The first image in this approach is subjected to the process of low pass filtering, and the initial estimate contour was defined by means of morphological operations. Moreover, a nonlinear mapping of the intensity gradients is utilized for minimized energy function. Contour finding was initialized in the subsequent frame through the use of the final contour. The method’s convergence was equated with understanding active contour via implications of the customary compelled quasi-Newton strategy. Delineations are physically done on 20 outlines via two specialists. Physical delineations are done on 20 frames by 2 specialists, and a comparison was made between the average and automated algorithms. The aim was to show that the intervariability among specialists was comparable to the distinction between the automated and manual strategies. Accordingly, the area correlation was determined to be 0.92. However, conclusions cannot be made based on this result because this outcome is from a preliminary assessment.
In [25] prescribed a method that is completely automated for the segmentation of breast ultrasound images to classify them using support vector machine (SVM) and discriminant analyses. In the current study, the pixels of the ultrasound breast images obtained from a set of multi-resolution image processing method are classified using five types of features, namely, higher band-pass filtering, non-linear diffusion, lower band-pass filtering, and two types of mean curvature from Gaussian filtering for different values that can be detected between  and
and  . Subsequent to this classification process, the edge of the object is enhanced through the implementation of a filling operation. A semi-automatic segmentation method was proposed to address the limitation that accompanies the automatic segmentation of images [26]. In their work, the ultrasound image was represented using the patch-based continuous graph cut method. At the initial stage, a seed point, which is also known as a marker, is provided by the user outside or inside the object of interest. Thus, the objects will be represented by the variation in points. Their proposed framework was deployed on a wide range of problems associated with ultrasound, including fetus, liver, eye, and prostate. The proposed method achieved an accuracy of 94% in terms of segmentation for all the data sets used in the study [26]. Some studies [27,28] have proposed a novel method capable of automatically identifying miscarriage cases. The segmentation part of their method involves the use of Otsu as a threshold method. First, the object of interest is separated starting with the background, and the boundary of the object is smoothened and the small holes are filled thereafter through the application of median filter, which is characterized by a window size of
  . Lastly, a small object or any other object that is attached to the boundary is eliminated through the use of the area feature. In addition, an automatic method was proposed by [29] to enable the segmentation of 2D foot ultrasound image. Their study comprises three phases. The first phase involved the use of anisotropic diffusion filter, after which the contrast was enhanced through morphological process to improve the US case as a pre-processing operation. In the second stage, segmentation is performed using the active contour method, although the output comes in the form of a binary image. Lastly, the border was eliminated using post-segmentation methods, which were also used in eliminating irrelevant objects. A scheme was proposed by [30] for the segmentation of ultrasound images. This segmentation was performed using watershed transform, which is a widely used and accepted tool used in image segmentation. In the watershed transform method, gradient images extracted from the original US cases are used, rather than using the image directly, in solving several problems. Nevertheless, the watershed method of segmentation used for the image texture is ineffective, particularly if images are characterized regions with constant homogeneity. The proposed method is characterized by three main stages. The first stage involves segmentation using watershed to divide images into different regions. In the second stage, the similarity between regions that are close to one another is checked using the similar region merging strategy. In the third and last stage, the edges of the objects are enhanced through the application of boundary extraction.
However, the main limitations of US images can be classified into three issues. Firstly, speckle noise is one of the major limitations that can affect segmentation and feature extraction. Secondly, the artifact produced from the machine can make the segmentation a difficult task. Lastly, powerful features may be difficult to find in identifying the risk of the malignant. The proposed research and model aims to build an intelligent decision support system model that can segment and identify the risks of malignant breast cancer and ovarian tumor in the early stage.
3 Proposed Ultrasound Image Segmentation
The result of an ultrasound is reflected through images. The ultrasound could be that of various types of tissues. Thus, these images are characterized by darkness, low contrast, blurry RIO edge, and objects with nearly the same characteristics. Moreover, the type of machine used and its resolution determines the quality of images. Thus, these factors result in the segmentation process and risk of the malignant becoming complicated. We begin by describing the basic idea of the proposed method to understand the impact of the different techniques used. Three basic components possess the framework presented in this study. Fig. 2 presents these components. These component are pre-processing, segmentation, and features extraction to classify the cases as benign and malignant. In the enhancement stage, US is taken and subjected to speckle noise reduction, thereby producing a clear image as the output. Moreover, as highlight the ROI and make it suitable for the segmentation task. We follow different steps during segmentation. First, the image is binarized by using the initial segmentation step. Second, unwanted objects are removed by filtering out non-ROI. For the final step of the segmentation, we will use the active contour to avoid the under segmentation issue. Lastly, the feature extraction and classification stages evaluates the efficiency of the proposed segmentation methods.
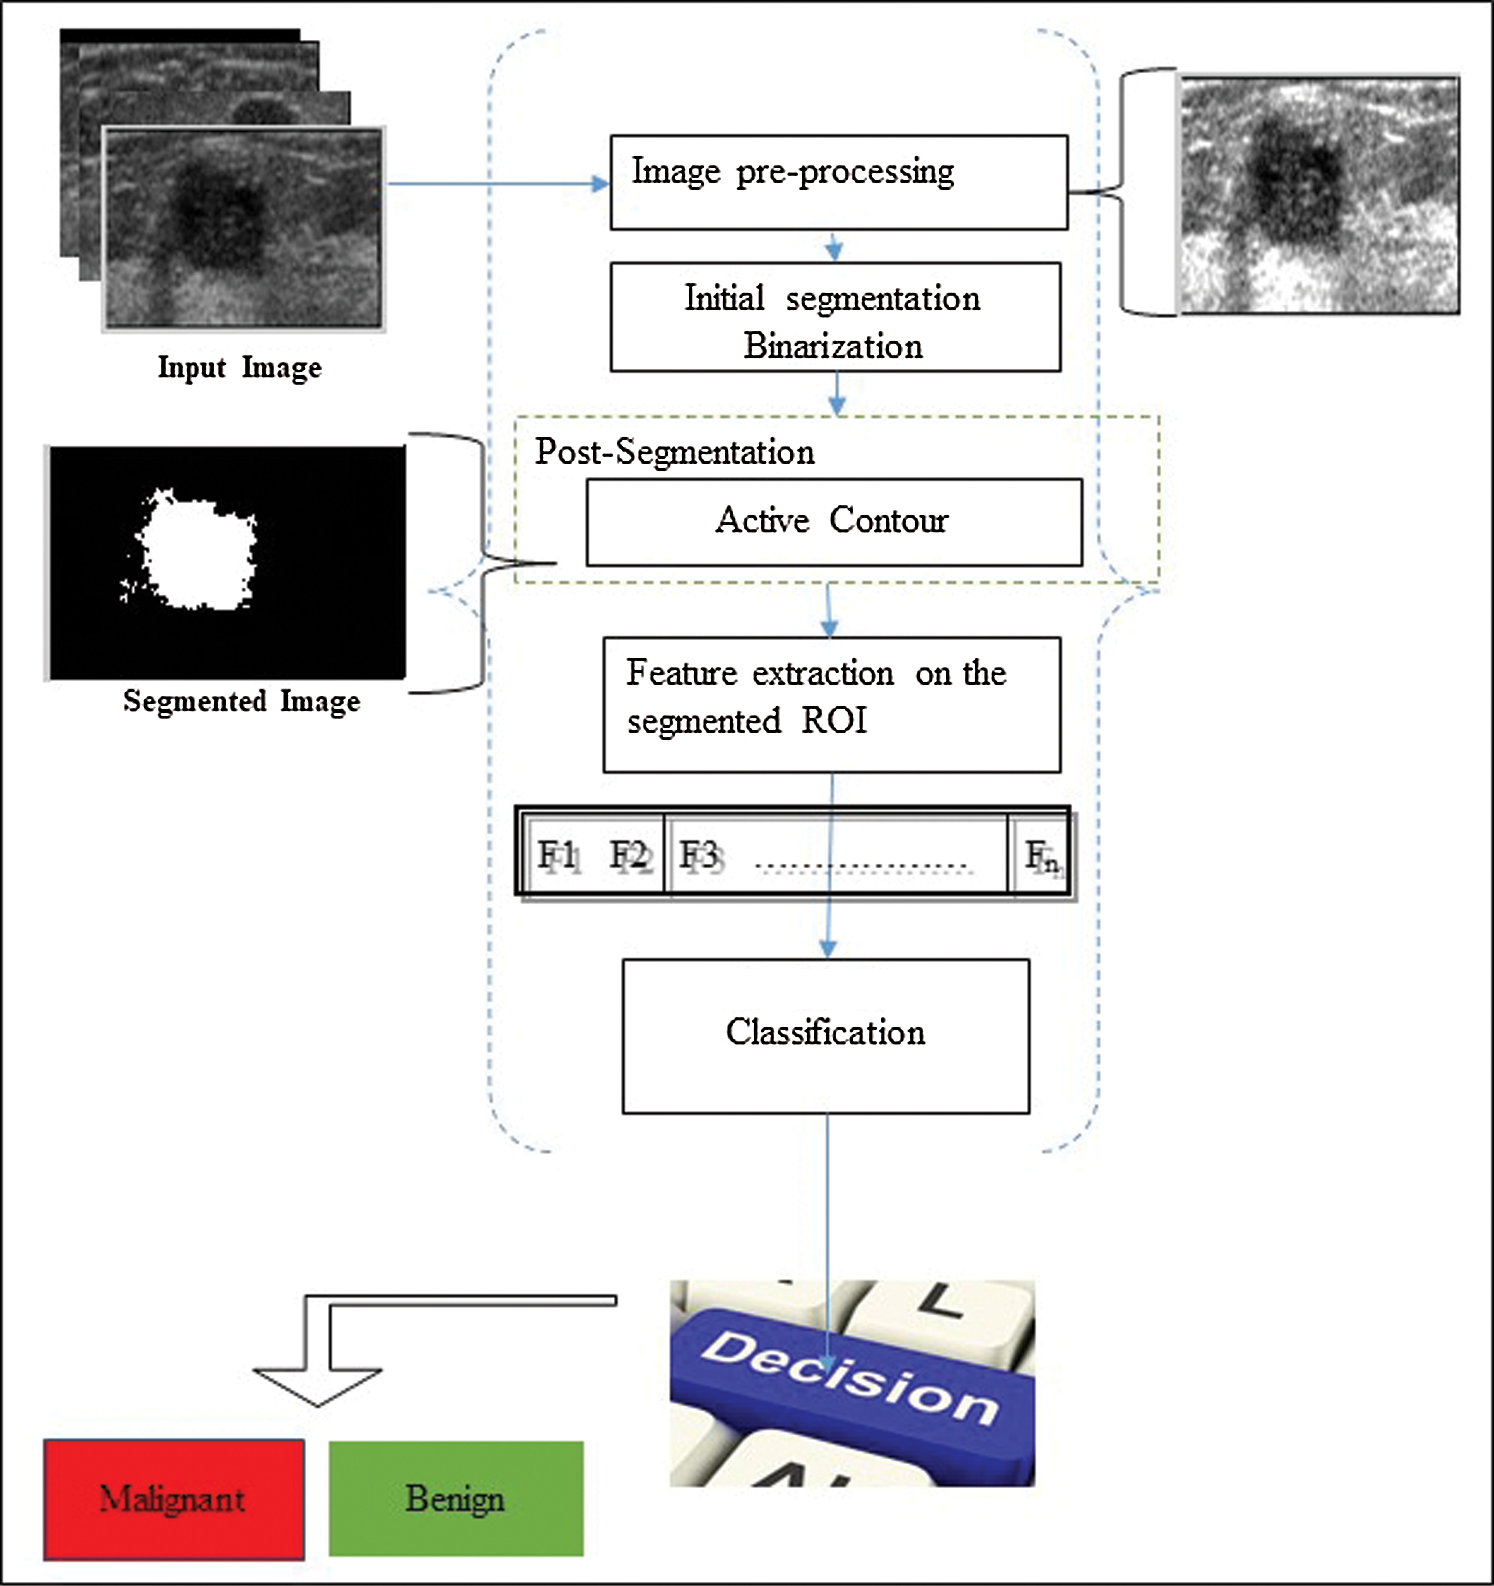
Figure 2: Outline of the proposed system
The proposed system includes the following main steps:
• The pre-processing phase enhances the image, highlights ROI, and makes US image clear for the segmentation task. In this stage, we used Wiener filter followed by wavelet transform to highlight the region will be working on it.
• We used Wiener filter only for texture feature enhancement.
• The second stage includes segment and ROI is extracted from the remainder of the US image. For this stage, we built a powerful trainable cascade model.
• Lastly, to assess the proposed segmentation, we extracted the LBP features from the segmented ROI and fed them to the SVM classifier to identify the risk of the malignant in early stage.
Degradations in image and signal can occur as a result of the presence of artifacts and noise in several clinical modalities. The degradation that occurs in image modalities vary based on the type of modality. Typically, the most common type of degradation associated with radiograph is low contrast, while speckle noise is often observed in images the formation of which was achieved using coherent energy, such as ultrasound. The quality of images can be strongly influenced by the degradation of image, which has an effect on the way the image will be interpreted by humans. In addition, the accuracy of the system can be influenced by image degradation. The simplicity and reliability of quantitative measurements is often tampered with by low-quality images. That is, poor-quality images is makes the quantitative measurements unreliable and complex. Moreover, poor-quality images affect the reliability of the system in terms of analysis of image, segmentation, and feature extraction. Accordingly, the images should be despeckled to improve the quality. Given this situation, numerous studies should be conducted in the area of medical imaging.
Images with noise that should be eliminated must be despeckled. Consequently, the quality of ultrasound images can be enhanced, while the boundaries of the salient tissues are maintained in the images. This stage aims to accurately find the boundaries of structures, thereby providing an improved visual representation of the location of structures and quantifying the morphology. The majority of previous studies have referred to speckle noise as a key challenge connected with the analysis and segmentation of US images. These studies have used techniques based on pre-processing to eliminate speckle noise. Therefore, the current study performs speckle noise reduction to eliminate noise while maintaining the object of interest.
The proposed model for the speckle noise reduction and ROI highlight include the application of Wiener filter, the output of which for the wavelet transform is used to extract the low-frequency sub-band and for segmentation. The Wiener filter was used to achieve two objectives. First, ROI is smoothen for the wavelet transform and used for segmentation (Fig. 3). Second, the ROI texture was enhanced to extract powerful features for the diagnosis stage. In this study, noise reduction was achieved through the use of the Wiener filter, which is a linear filter, and its application to an image is performed in an adaptive manner. This filter is specially designed to suit the local variance of images and smoothens the boundaries of images when a huge variance exists. When the variance is small, more smoothening exists. That is, the larger the variance, the lesser the smoothening; and the lesser the variance, the more the smoothening. The Wiener filtering approach has proven the ability to enhance results compared with linear filters. Through this filter, the edges of image and other areas of images with high frequency are preserved. The reason is that this instance is inherently choosy compared with linear filters. However, the Wiener filter is accompanied by a limitation, in which the requirement is additional computational power compared with the linear filter, which uses minimal computational energy. The Haar wavelet was used as a second stage to identify the low frequency sub-band LL from the high frequency ones. This situation will facilitate the reduction, identify the noise and artifacts, and exclude them by resizing the LL sub-band only. This model will assist us to highlight ROI and remove numerous artifacts from the image.
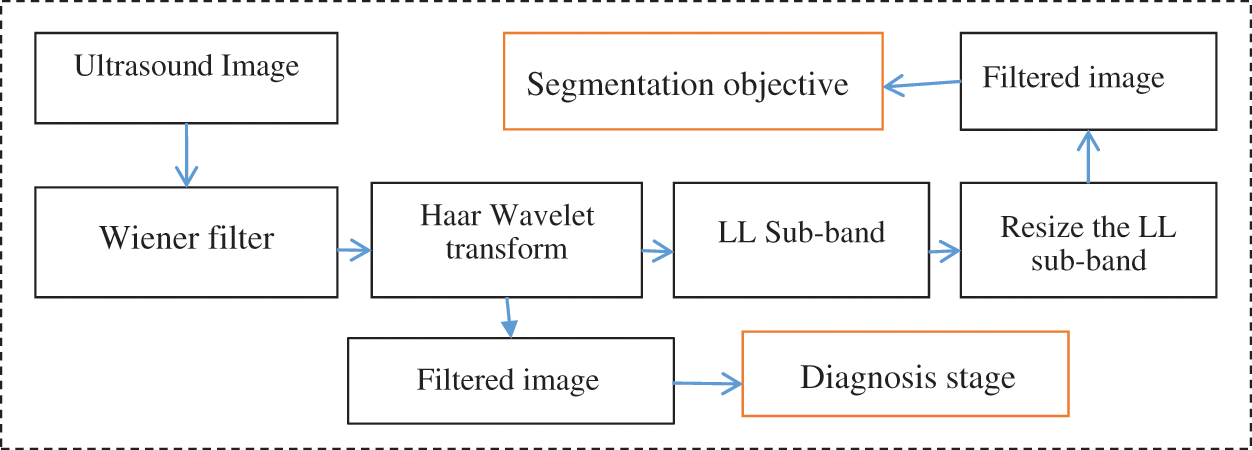
Figure 3: Enhancement of ultrasound images
Our investigations in this area indicated that studies have exerted effort geared toward the elimination of speckle noise in ultrasound images. Despite the relevance of speckle noise elimination, it does not guarantee that image segments will be accurately produced. The reason is that the accuracy with which images are segmented does not solely rely on the removal of speckle noise from the image. That is, apart from speckle noise, other factors that influence the accurate segmentation of images. However, one of the aims of this study is to minimize speckle noise, while highlighting ROI for image segmentation. Thus, this research proposes an approach that can smoothen images. This approach also aims to produce a clear ROI to easily implement segmentation.
The extraction of object from images can be achieved using any of the different methods available for this purpose. Some of these methods include edge-, threshold-, and region-based segmentations and clustering techniques. Some of the methods may be inappropriate for some images because of the variance between the intensity values of images in different data sets. For this reason, such complex cases were handled in this study through the use of the Viola–Jones model [31,32]. This model is advantageous because it is able to perform some tasks as follows: (1) Selection of the most relevant features from a large vector of features, such as the Harr features; (2) Construction of weak classifier methods, in which the number of methods rely on the number of the features selected by the optimization technique, and every classifier is dependent on one of the features chosen; and (3) Construction of a robust classifier by boosting the weak classifiers. The cascade model (i.e., Viola–Jones model) has been used for a long time to detect objects. The current study will modify the idea and make it suitable for segmentation instead of detection. Fig. 5 shows the proposed cascade model. The goal of the initial segmentation is to separate the region of interest from the remainder of the ultrasound image. The main steps of the proposed cascade model (modified Viola–Jones model) are as follows.
1. The method begins by choosing a specific number of samples as US images for the training process. To train the model for the segmentation task (binarization), we took small windows ( ) from ROI and the regions outside ROI (non-ROI).
2. A group of Haar features was extracted from the windows that cropped from the training images. Fig. 4; shows the masks used to extract the Haar features. Note that we extracted five types of Haar features.
3. To provide a trained model, the five types of Haar features were used as input to the weak classifier with window labels (i.e., labels present as ROI and non-ROI). The output of this stage is a trained cascade model (i.e., modified Viola–Jones model).
4. During the training stage, the best Haar features will be selected to identify ROI from non-ROI.
5. Each type of Haar features has been used as input for one of the weak classifiers, and the combination of the weak classifiers will result in a powerful and strong classifier.
6. The testing stage includes scanning each image pixel by pixel in the testing set. For every pixel found in the segmented US image is a minimal square area of the same window measure with the pixel as the middle is built ( window) and the Haar features type that has been selected during the training. The pixel is classified by the trained cascade model into two classes: “inside ROI” and “outside ROI.”
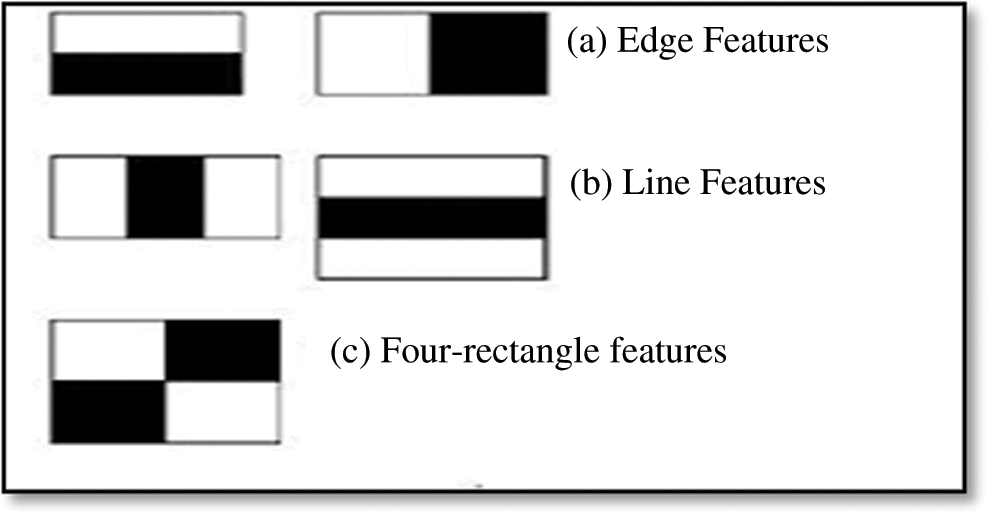
Figure 4: Haar cascade features
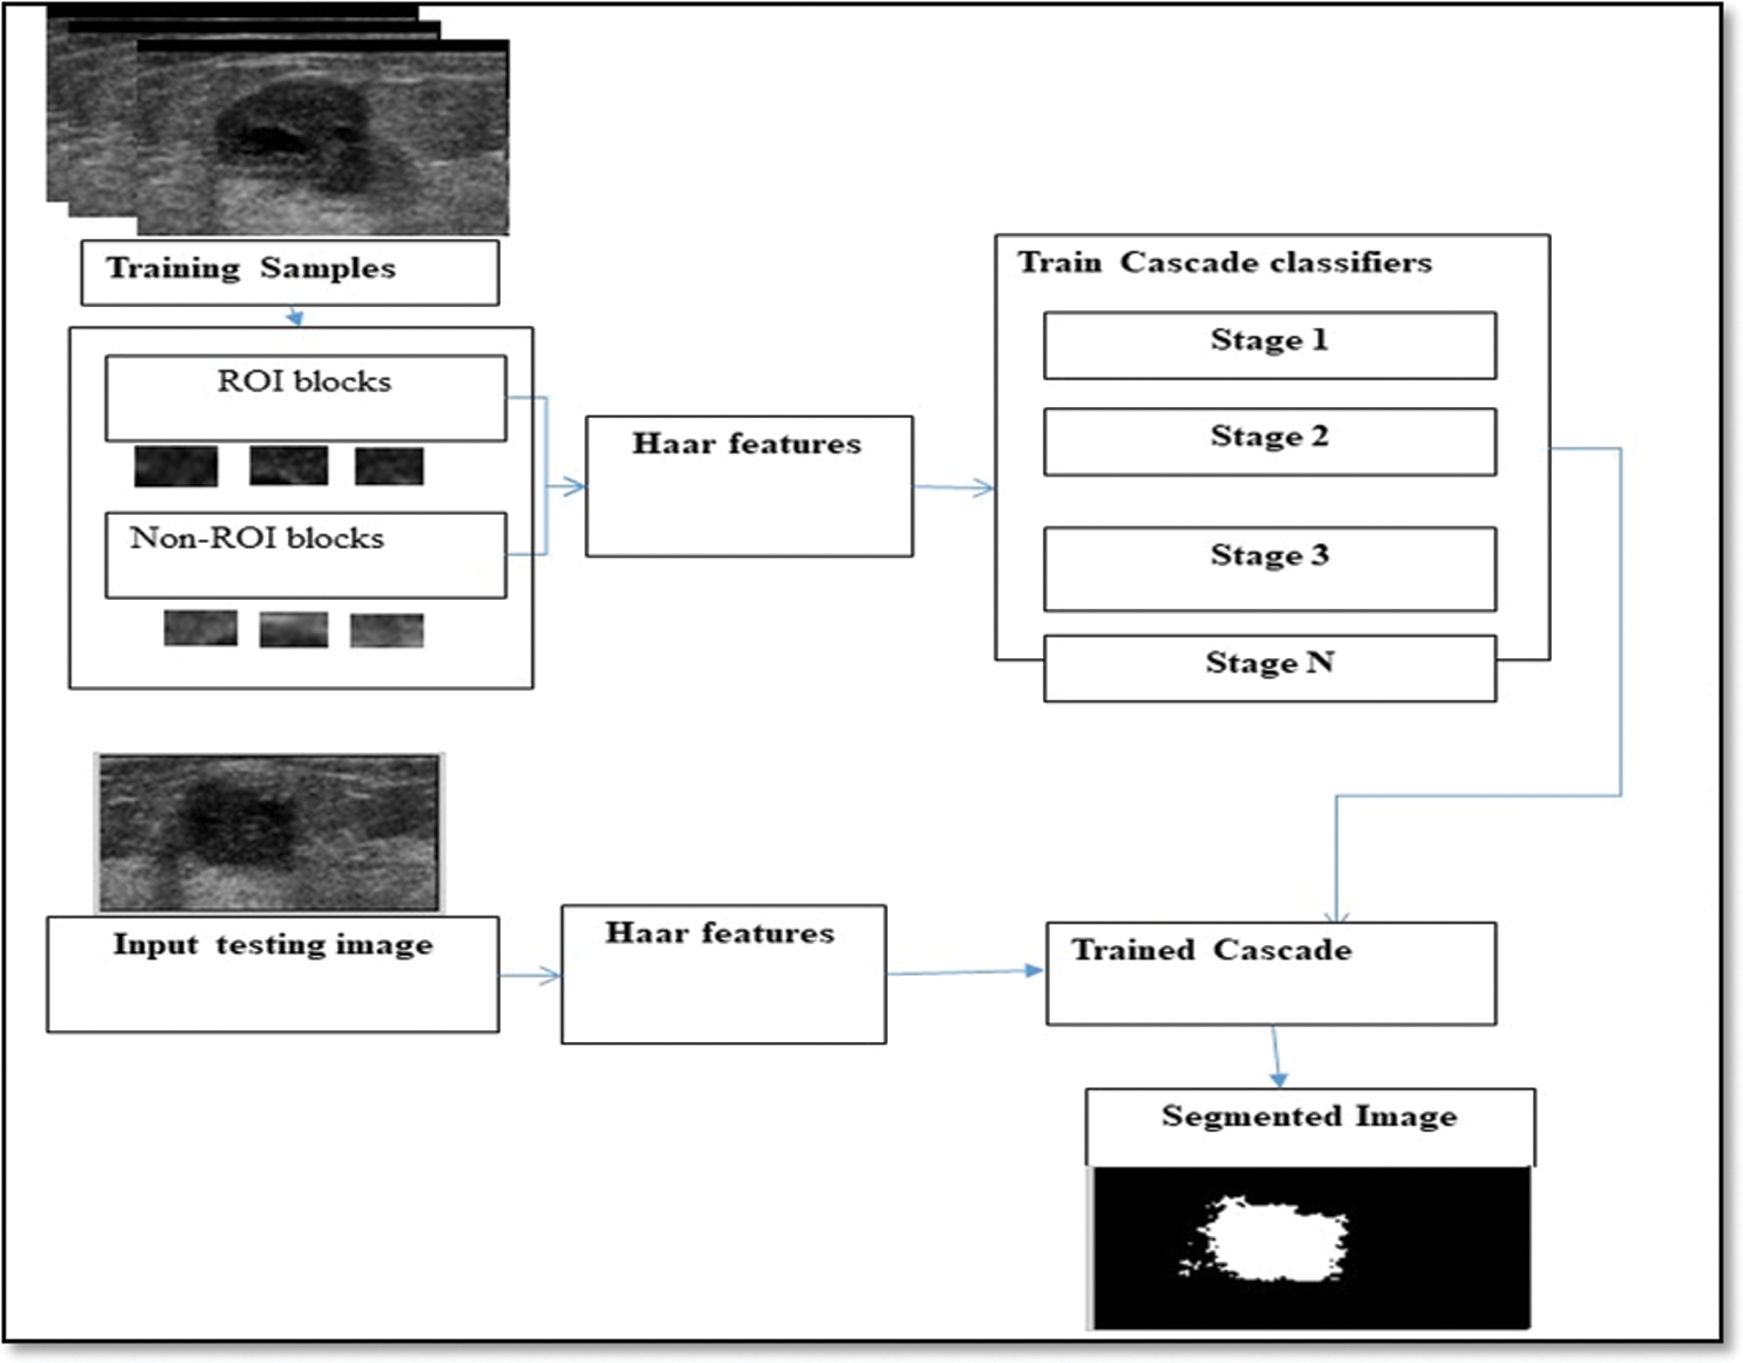
Figure 5: Proposed cascade model (Viola–Jones model)
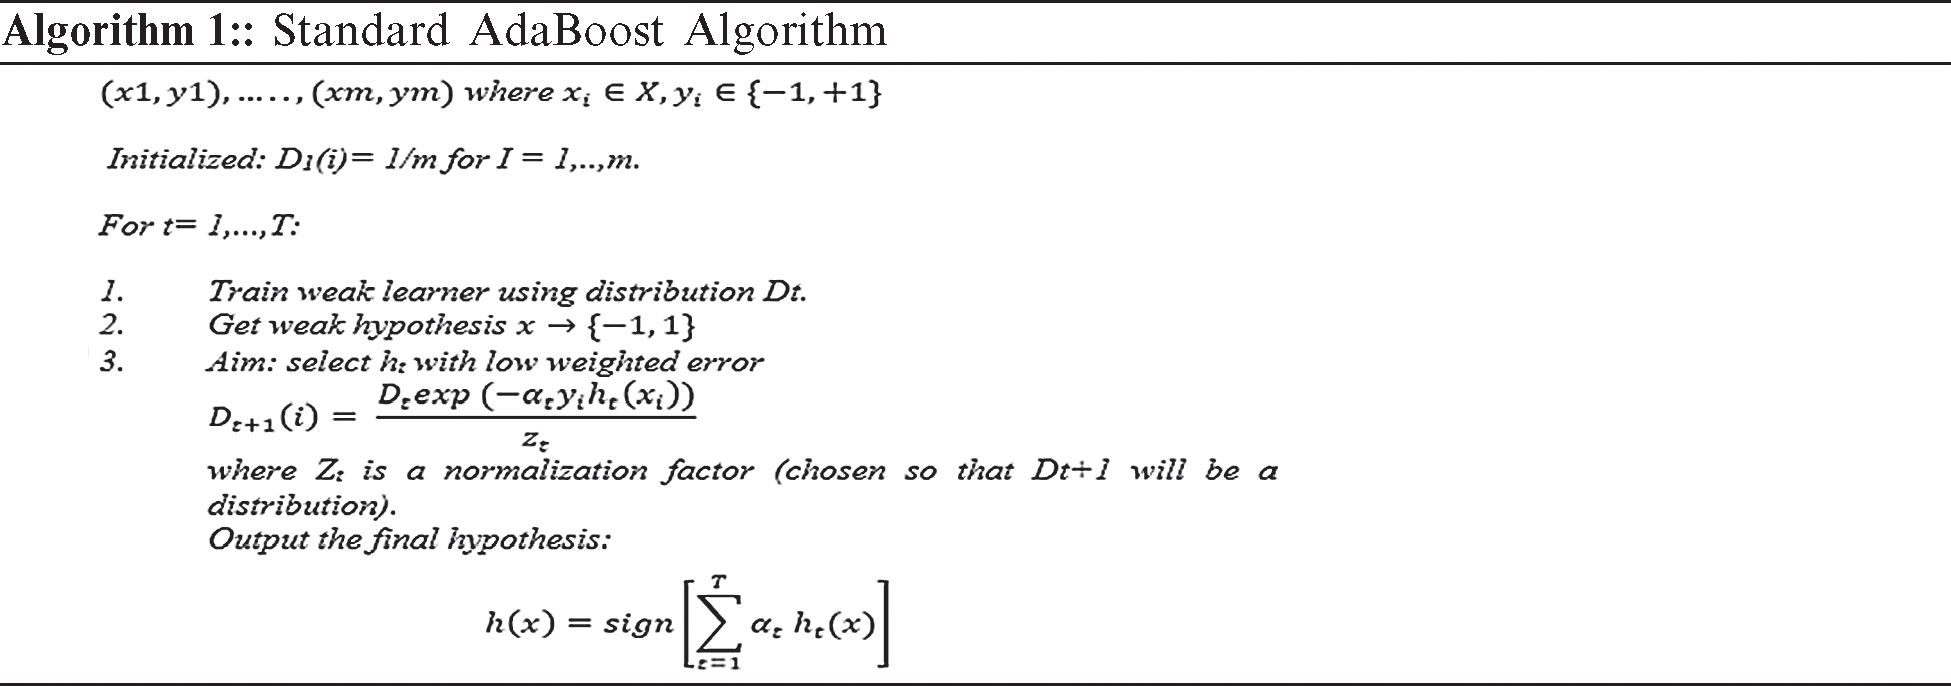
AdaBoost is a boosting algorithm that is widely accepted and used. The use of this algorithm has proven that a strong classifier can be produced when weak classifiers are combined. Furthermore, AdaBoost has demonstrated a strong ability to efficiently combine simple statistical learners and minimize errors during training, including errors related to vague conclusions [4]. The two major steps are involved in the use of AdaBoost-based approach. The first step involves the construction of a powerful classifier through the combination of weak classifiers. In the second step, strong classifiers are combined sequentially to enable the construction of a boosted classifier cascade. The manual cropping of many samples has been performed in this research, and the vectors of each sample have been extracted using the Harr features. Some examples of a specific m labelled training, such as  , are provided. In this case, x denoted a feature vector and the labels
  . In each round
  , the computation of the s distribution Dt is done. In the event that a weak hypothesis
  should be determined, a weak algorithm is used thereafter. A weak learner is determined so that a hypothesis can be formulated with low weighted error that is relative to Dt, as observed in Algorithm 1. The weighted sign that has been produced subsequent to the combination of the weak hypothesis is computed using the final hypothesis as shown in Eq. (1):

The cascaded classifier comprises stages and each stage possesses a strong classifier. Moreover, each stage plays a critical role in ascertaining if a given sub-window is completely an ROI or non-ROI. In the event that a non-ROI is not detected at a particular stage, the window is discarded immediately. Meanwhile, in the event that a sub-window is detected as ROI, it is forwarded to the subsequent stage of the cascaded classifier. This process is in accordance with the proposition that the more stages passed by a specific sub-window, the possibility of having an ROI sub-window is high. One of the most common problems observed in the classifiers that have just one stage is the acceptance of additional false negative, while aiming to minimize the rate of false positives. However, in the early stages of the staged classifiers, false positives are not the current concern because the problem is expected to be solved in the next stages. Thus, the conditions in which several false positives can be accepted in the early stages of such classifiers have been prescribed by the Viola–Jones model. Thus, the cases of false negative are expected to be reduced in the final stages of the staged classifier.
The experiments performed in this study involved the use of ovarian and breast cancer ultrasound images. Given that the extraction of the entire ROIs was not possible in some of the images, active contour was used as a post-segmentation step to enable the complete extraction of ROI with the correct boundary. In the proposed model, the use of active contours was employed. The first type involved the use of a single seed point possessing numerous iterations. For this reason, the detection of an object’s border in this active contour requires additional time. The second type of active contour used in the current study was used based on the largest mask through the detection of two points in the breast and ovarian cases. With this principle, the number of iterations required is decreased, while enabling the growth of the active contour from the external part of the sac based on the mask.
Local binary patterns (LBPs) are among the features used for texture classification [1]. LBP operator refers to a technique that performs image transformation into integer labels or an array of images, which provides description of an image’s microscopic appearances [3]. Statistics or labels of the image, typically the histogram, is subsequently utilized to conduct a fine analysis of images. The majority of the operators have been constructed to deal with monochromatic images. However, studies have begun extending operators to deal with polychromatic images, volumetric data, and videos.
The essential LBP presented by [8] is based on the presumption that texture has two locally complementary viewpoints, namely, design and its quality. This study proposed LBP as a two-level adaptation of the texture unit to depict the nearby textural designs. The initial adaptation of LBP was applied in a  -pixel piece of a picture. The pixels can be expressed as follows in Eq. (2):

where ic is compared with the dark esteem of the central pixel (xc,) and -ic is the dark values of the 8 encompassing pixels. In the event that in − ic > 0, (in − ic) = 1, S(in − ic) = 0. Fig. 6 shows an example of how to calculate the essential LBP value.

Figure 6: Example of a basic LBP
A basic LBP is inefficient in computing the pattern code of an individual pixel situated in some neighborhood. An enhanced LBP is considered to enhance computation efficiency. Fig. 7a shows that if we assume that a pixel (consequently denoted as pixel1) has a gray value of 6, then its LBP is  . Another pixel that has a gray value of 7 holds LBP with
  . The final trailing code “1” in Pattern 1 is obtained by comparing pixels 2 and 1, while the initial code “0” in Pattern 2 is obtained by executing the comparison of pixel 1 with pixel 2 (marked red in Fig. 7). A comparison between pixels 1 and 2 is performed twice, followed by further reiteration to compare the two pixels. Through deeper analysis, an individual code of LBP can be obtained through reiteration. In terms of an entire image, half of LBP would offer a complete description of the local texture (indicated by the red lines in Fig. 7c). Accordingly, a quasi-LBP is proposed as follows.
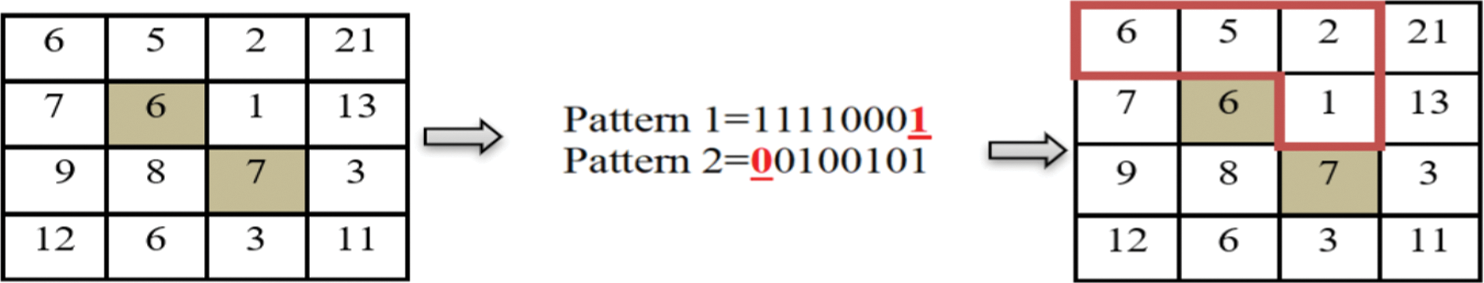
Figure 7: Comparison of two neighbor pixels’ LBP (A) original sub-image (B) binary code for two pixels (C) LBP image
In computing an individual pixel’s LBP, as many as eight comparisons are executed in a standard LBP technique. In a quasi-LBP proposed, the comparison is reduced by 50%, with the range of code reduced from 0–255 to 0–15. This result would significantly improve the performance of LBP in computing histogram. Even though the technique’s enhancement is not rotation invariant, it may continue to be employed in background modeling with monocular camera, which is attributed to the existence of the minute rotation in raw video obtained from one camera. Thresholding is enforced by a center pixel value on pixels in the block, magnified by the power of two, and with the aim to obtain the center pixel’s label. Eight pixels that exist in a neighborhood would yield 28 = 256 distinct labels, which is contingent on the neighborhood and center pixels’ relative gray values. Texture analysis has widely adopted LBP descriptors attributed to the efficiency of computation and flexibility to illumination fluctuations. Nevertheless, LBP descriptors may be incapable of capturing discriminative information completely because only the sign information of vectors’ difference in a local region is utilized.
This study uses support vector machine (SVM) classifier because it is one of the methods utilized in breast cancer diagnosis. This classifier performs a classification of malignant or benign tumors in a shrunken set of features [3]. In the current study, the SVM classifier performed classification on breast lesions. Poonguzhali and Ravindran (2006) proposed SVM as a statistical learning concept. SVM inserts a hyperplane among classes and maintains the furthest distance from the nearest data points. Data points appearing closest to the hyperplane are known as support vectors. Widely used kernels include neural nets (sigmoid), Gaussian radial basis function (RBF), polynomial kernel of degree “d,” and linear kernel [3].
The main advantage of SVM classifiers is to discover the improved decision border, which exemplifies the greatest decisiveness (maximum margin) amidst the classes. The SVM standard begins from resolving the problems of linear separable and expands to treat the non-linear cases. Fig. 8 shows a paradigm of the SVM framework of breast cancer.
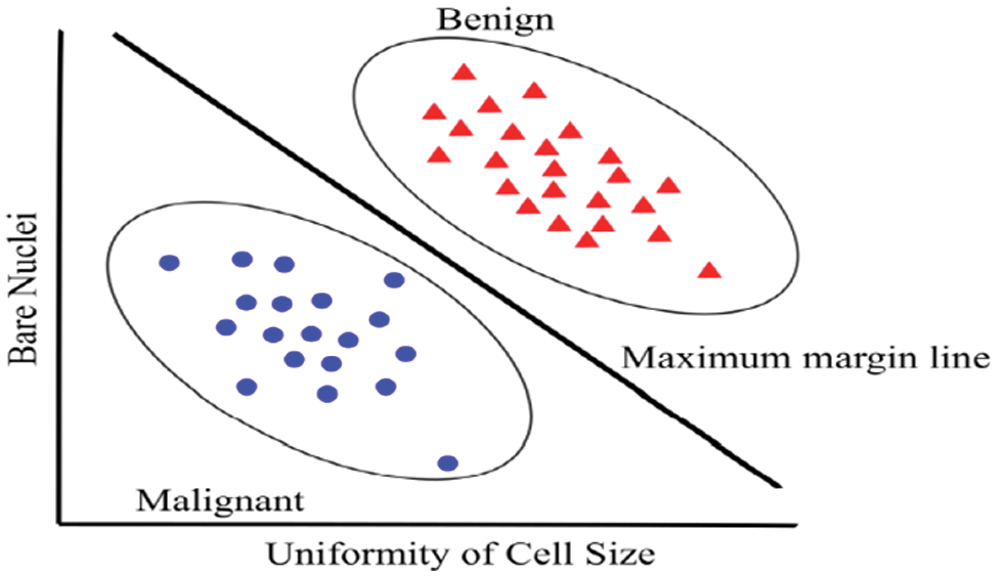
Figure 8: Example of SVM in recognized between malignant and benign cancer [8]
The SVM method used to classify a new sample created by computing the ratio (Sc) of the testing sample x depends on the following Eq. (3):

One of the critical activities of research is the data collection process. At this stage, the research must ensure the accuracy of the collected data to guarantee the reliability and integrity of the study. Ultrasound images comprise the data used in this study. The choice of an appropriate data set is crucial to the testing of any kind of automatic system of image classification, computer-based methods of diagnosis, and models of medical image segmentation. In general, sample pictures of breast cancer classes have been provided to enable readers to judge whether the automated pattern recognition was achieved or not. The source of the data sets should also be determined so that their importance and reliability to the study can be ascertained. The experiments were carried out using 250 ultrasound images, 150 of which are malignant and the remaining 100 are benign. The data set used by previous studies can be accessed from [33]. Apart from the 250 ultrasound images acquired from the aforementioned sources, 100 images of ovarian tumor were obtained from was collected from the oncology specialist hospital in Baghdad, Iraq. In this data set of 125 images, 90 are benign, while the remaining 35 are malignant. The experimental setup and implementation of the code to perform the analysis and the library used in this study as Matlab 2020 b, with windows 10, Ram 8G, CPU core i7.
The execution of the proposed segmentation was also compared with the current methods utilized to segment diverse types of US cases see Tab. 1. We used previous studies as bases to determine that these techniques are well-known and efficient for distinctive types of US cases. Evidently, the proposed mode achieved good results compared with Otsu’s method and that with active contour. To see the affective of the proposed model we have shown the result of the prepressing as well as segmentation in Fig. 9. Fig. 9 shows that pre-processing enabled us to highlight ROI and reduce the artifacts. The proposed segmentation captured ROI from the remainder of the images.
Table 1: Comparison of the segmentation result of the proposed system with other current techniques
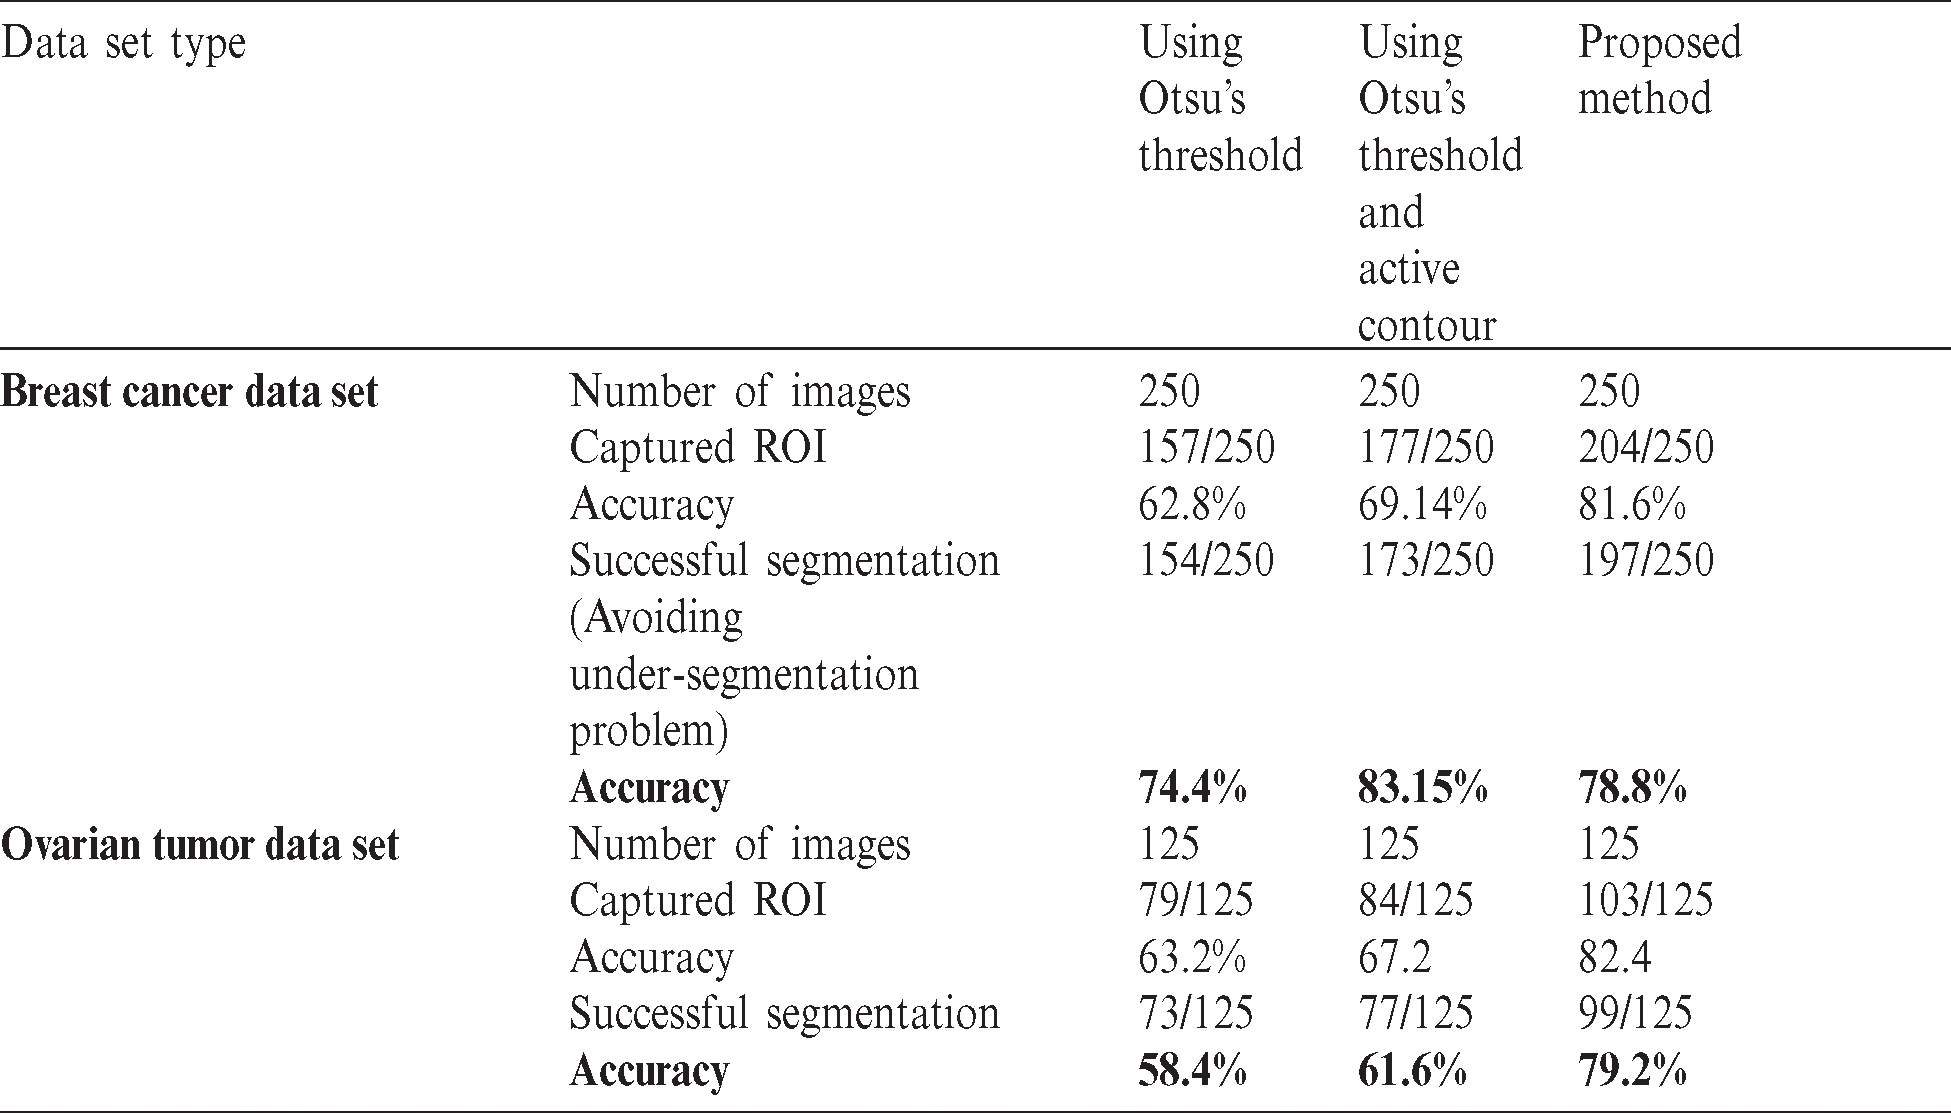
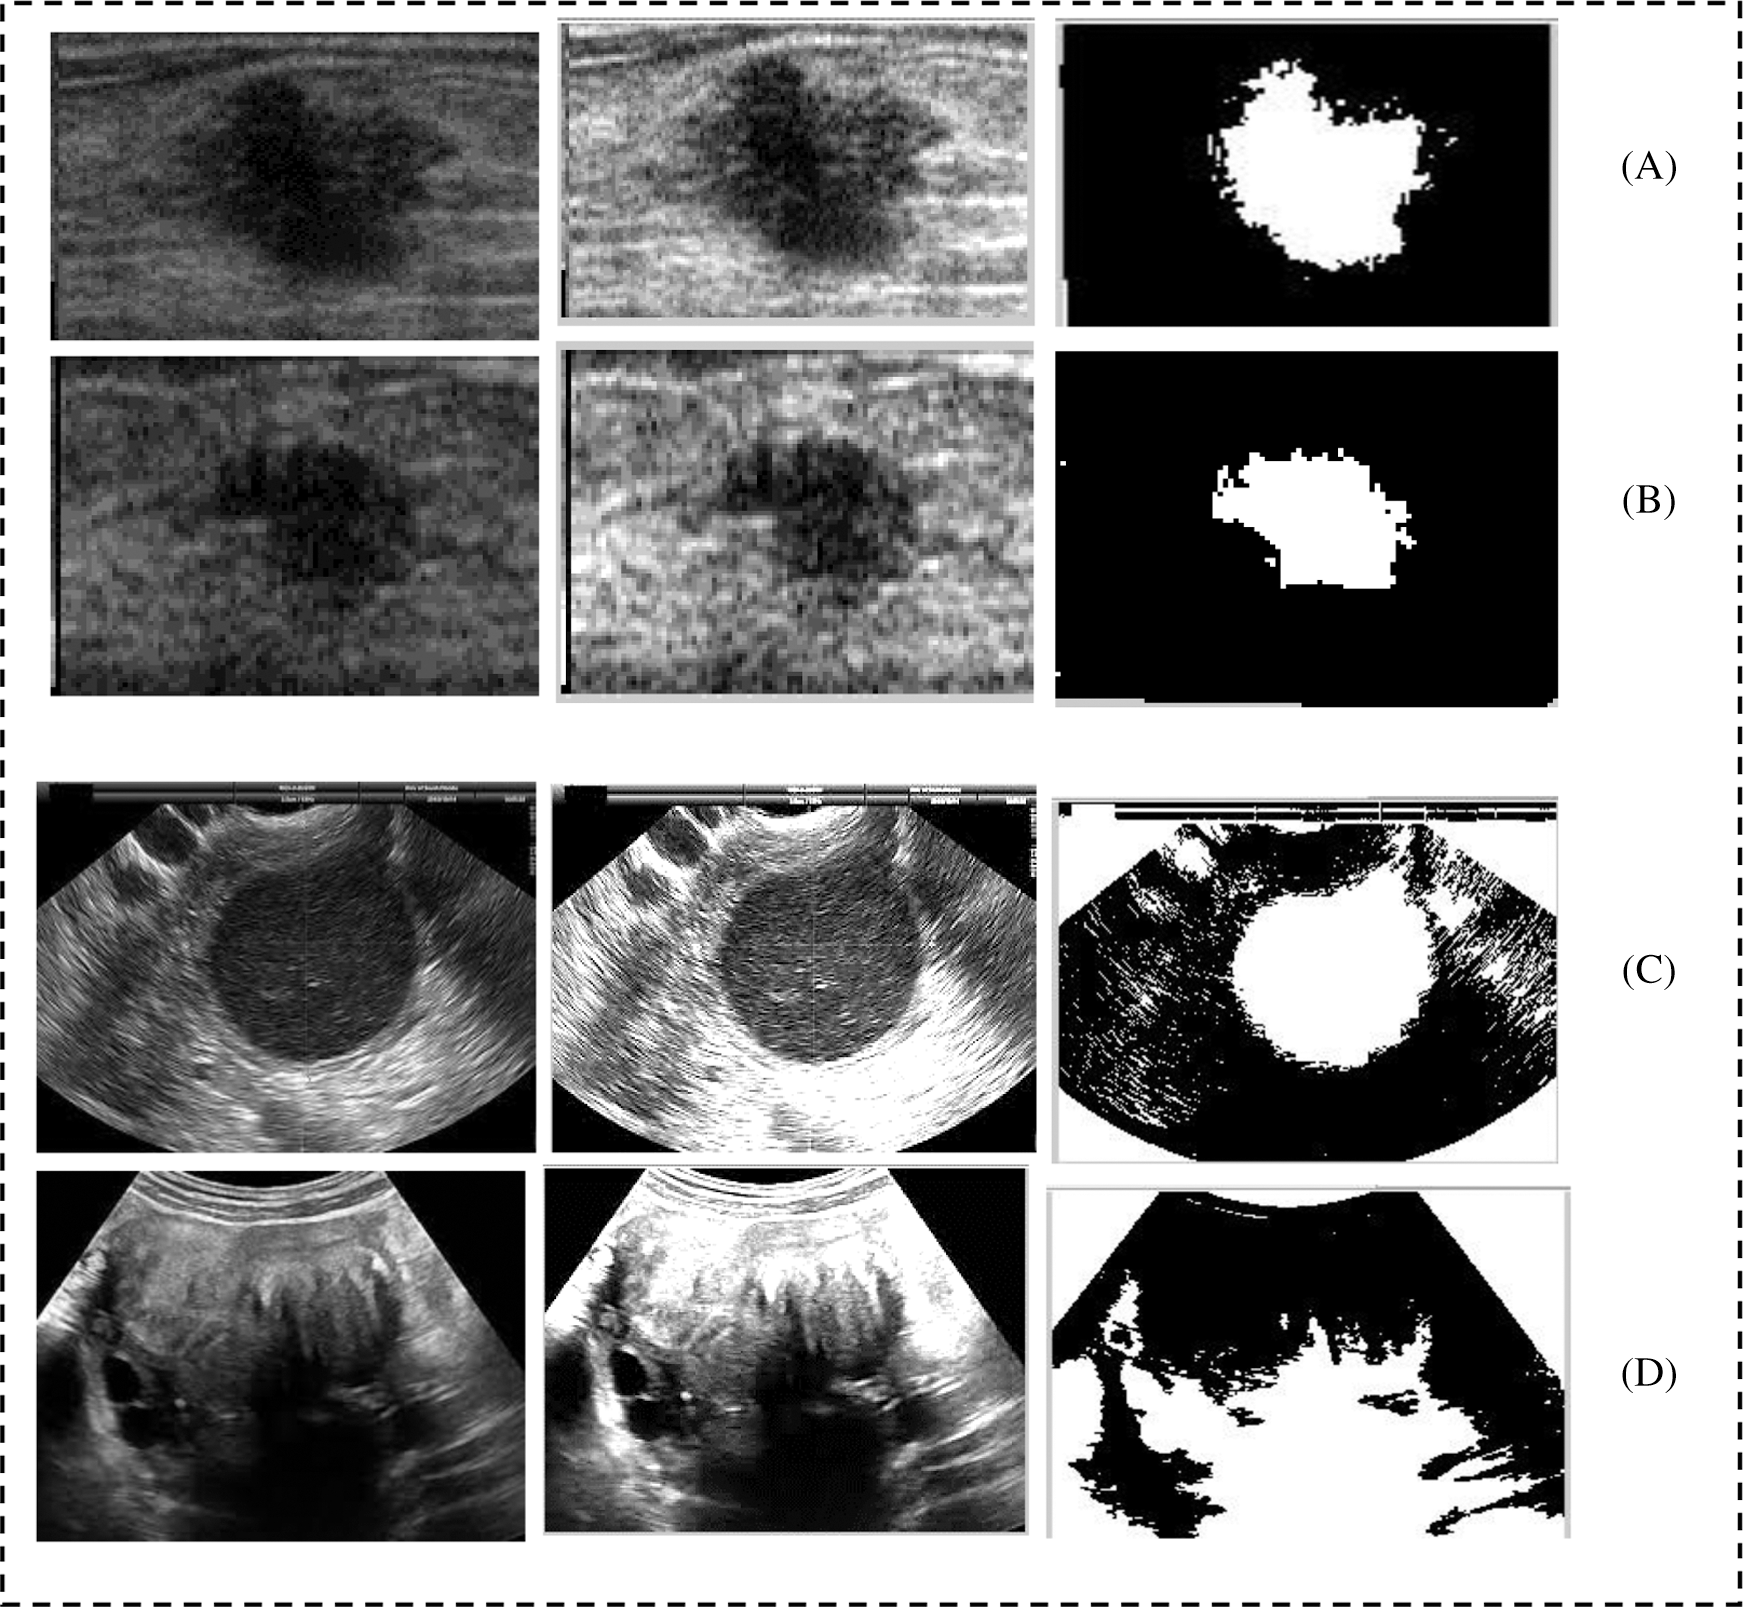
Figure 9: Shows the preprocessing and segmentation of six cases taken from the breast and ovarian ultrasound images; (A and B) shows the breast cancer cases; (D and E) shows the ovarian tumor cases
Fig. 10 shows two samples of images that taken from the data set. Those images has more challenges and as we can see that border of those images is not clear and that has made the images more difficulties. Therefore, we have applied the proposed method to highlight the border of the ROI and make the ROI more clear. Then we applied the segmentation method to extract the ROI as a binary object. We can see that the proposed method has extract the ROI without under and over-segmentation problem.
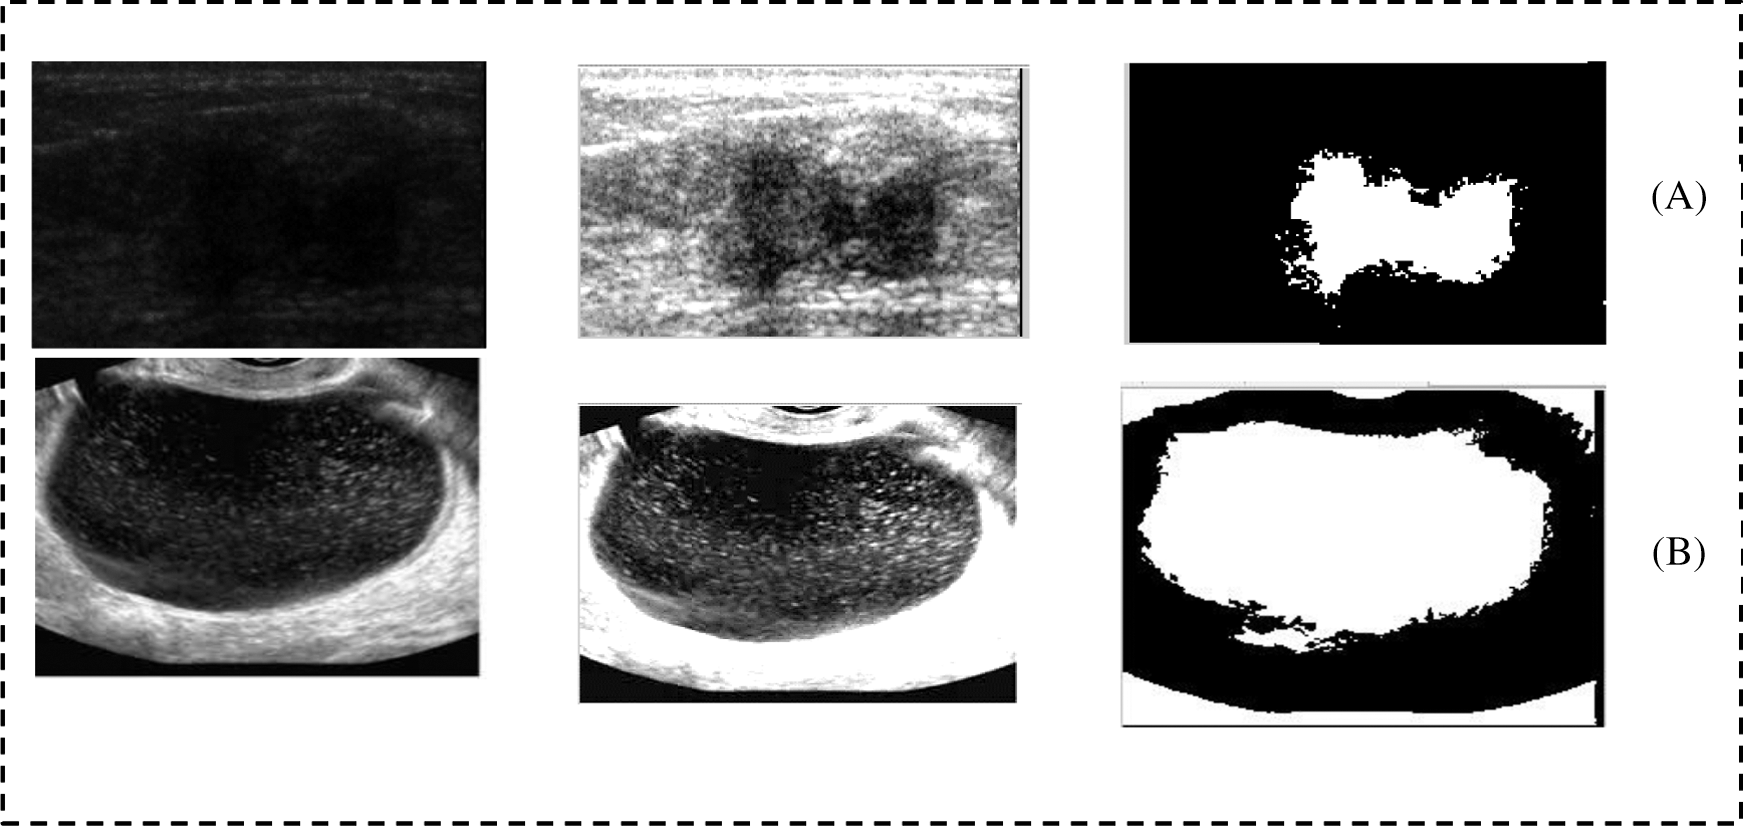
Figure 10: Two samples from the breast and ovarian cases. (A) Breast case and (B) Ovarian case
This stage uses the images segmented correctly. The total number of ultrasound images contained in the data set is 250, 100 of which are benign cases, while the remaining 250 are ultrasound images. The images segmented correctly are 197, including 123 sample malignant and 74 benign images. For the ovarian images, we obtained 99 images out of the 125 segmented correctly, 67 of which are benign and 30 are malignant. A random portioning of the data set into 5 rounds is carried out, with the same number allocated to benign and malignant cases. There are 50 images contained in each rounds and are equally divided into two parts (i.e., 25 benign and 25 malignant). In each round (M), the testing portion is examined, whereas the remaining portion of the data (subset-M) are used as the training set. Thus, each round is divided into K folds  , with each fold having the same size as the others. Training and testing are performed K times. F1 is used in the first iteration as a test set, whereas the remaining folds are used as the training set. In the second iteration, F2 is used as a test set, and
  as training sets, and so on.
The processes of testing and training are carried out repeatedly for K times with different testing sets, and the performance of the classifier is regarded as the average performance of the K tests. Eventually, all data were used for the purposes of training and testing. However, the computational cost of testing the model is high because testing is performed K times. The same experiment strategy was used for the ovarian ultrasound images to identify the malignant risk in the early stage. The efficiency of the model is evaluated using the SVM classifier, while the accuracy is evaluated based on the LBP feature.
This section presents the results from the experiments involving the two sets of data. The proposed model was evaluated based on the results of the two experiments. Thus, in the first stage, effort was exerted to address the problem of class imbalance between the malignant and benign, which was achieved using a sample strategy described in this section. Each round involved a random selection of 25 images of benign class, which were merged thereafter with the 25 images of the malignant cases. The training sample was formed by combining the two classes. Testing was performed repeatedly for 5 rounds. Each of the rounds involved the use of tow images as testing set, and 48 images were used as the training set. Thus, testing and training were conducted using each image. The evaluation of the system was done using an average of 20 rounds of tests. Tab. 2 shows the result for each round and we can see clearly the overall accuracy for the whole rounds. In the breast cancer cases, the proposed model achieved 94.4% accuracy, 94.3% sensitivity, and 94.4% specificity. For the ovarian cases, the proposed model achieved 96.4% accuracy, 96.7% sensitivity, and 96.3% specificity, as shown in Fig. 11.
Table 2: Accuracy, sensitivity, and specificity for each round in experiment 1
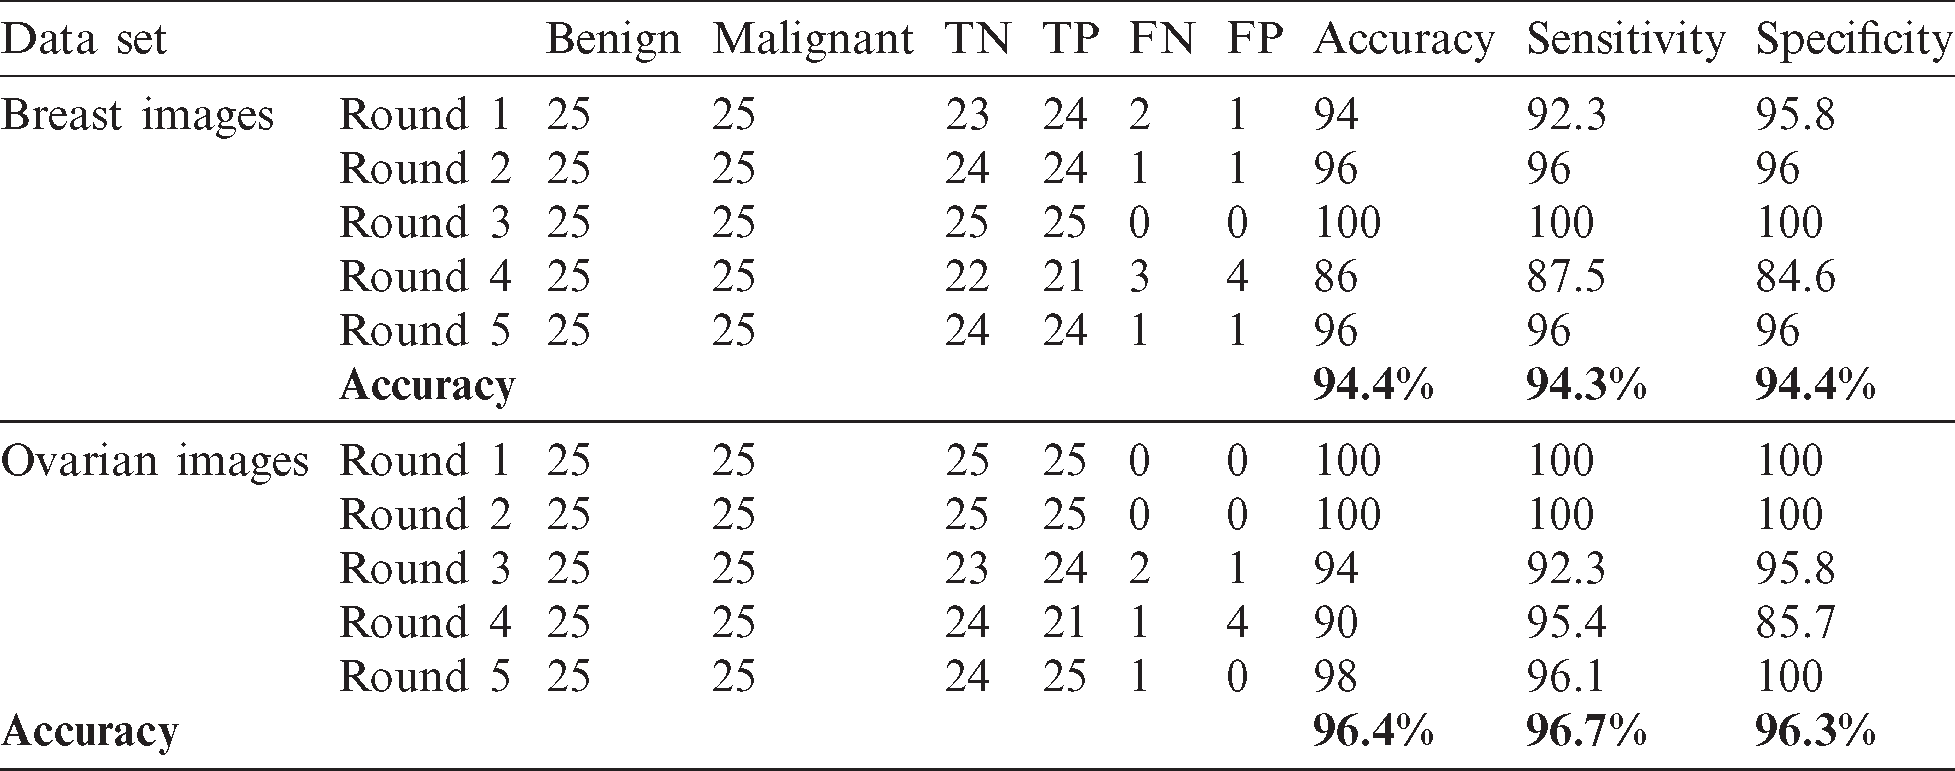
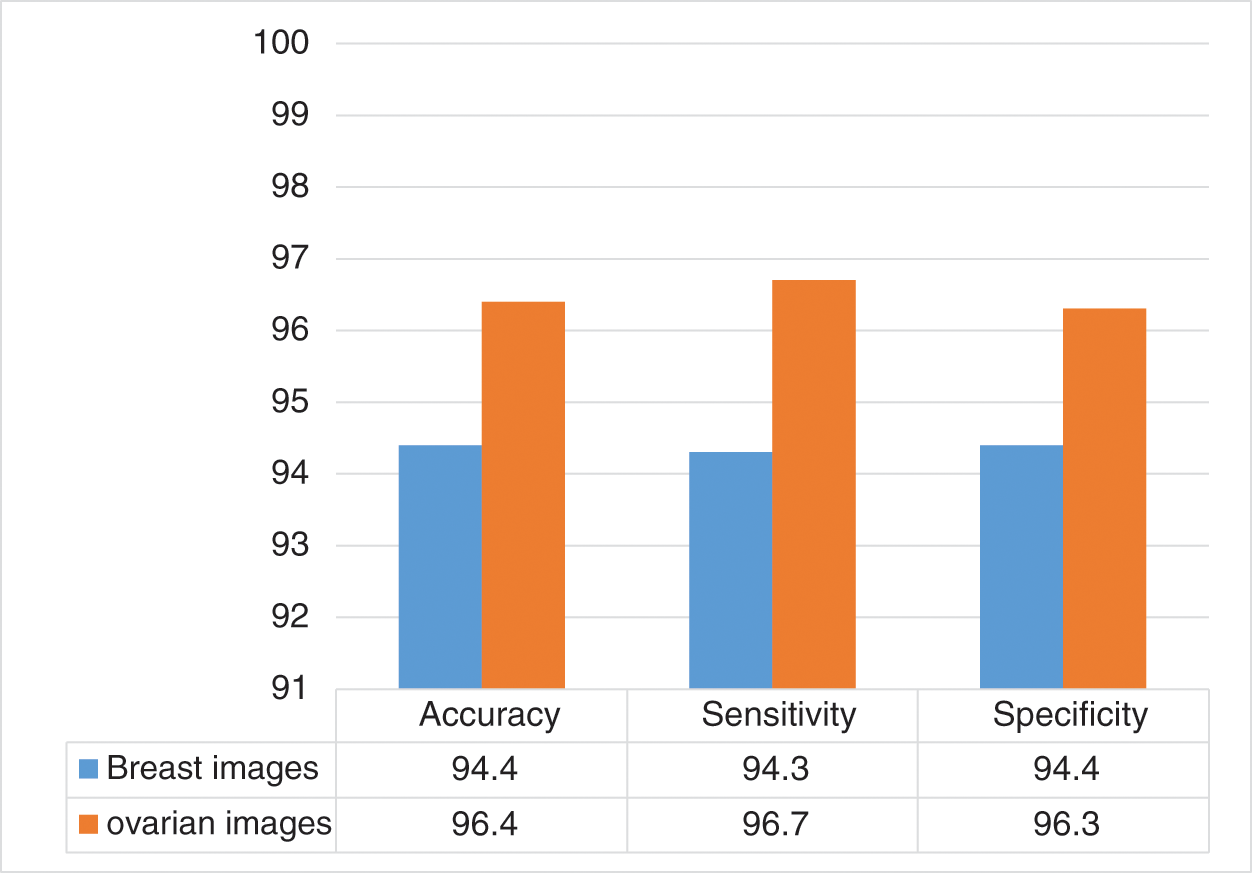
Figure 11: Accuracy, sensitivity, and specificity of the proposed model in the breast and ovarian images
In the second set of experiment, we used 50% of the images as testing and 50% as training, as well as simultaneously used the training as testing and testing samples as training. For this case, we achieved 95.43% accuracy, 92.20% sensitivity, and 97.5% specificity when we used the breast cancer images. For the ovarian tumor, we achieved 94.84% accuracy, 96.96% sensitivity, and 90.32% specificity, as shown in Tab. 3 and Fig. 12.
Table 3: Accuracy, sensitivity, and specificity for each training and testing in experiment 2
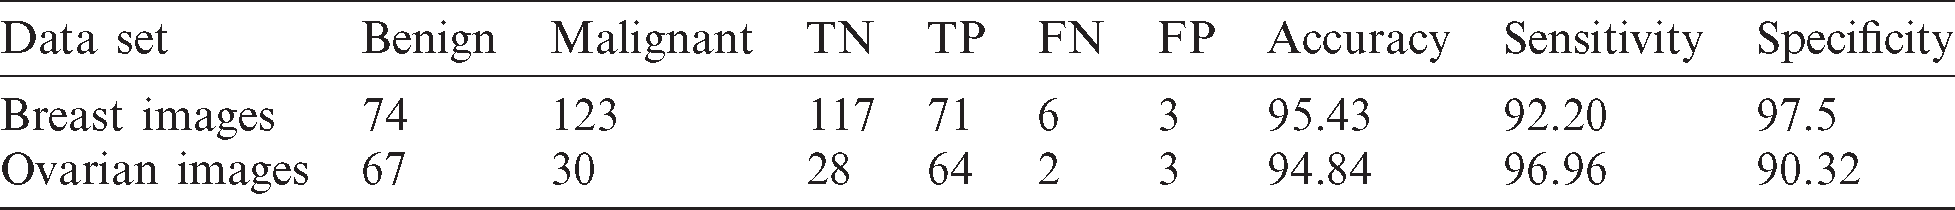
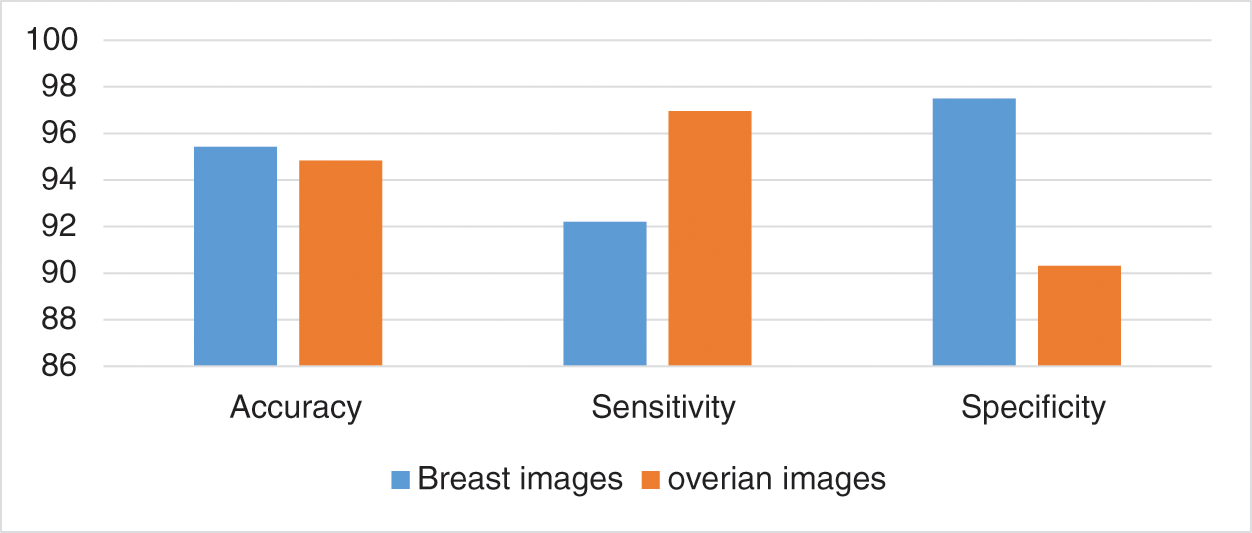
Figure 12: Accuracy, sensitivity, and specificity in the second set of experiment
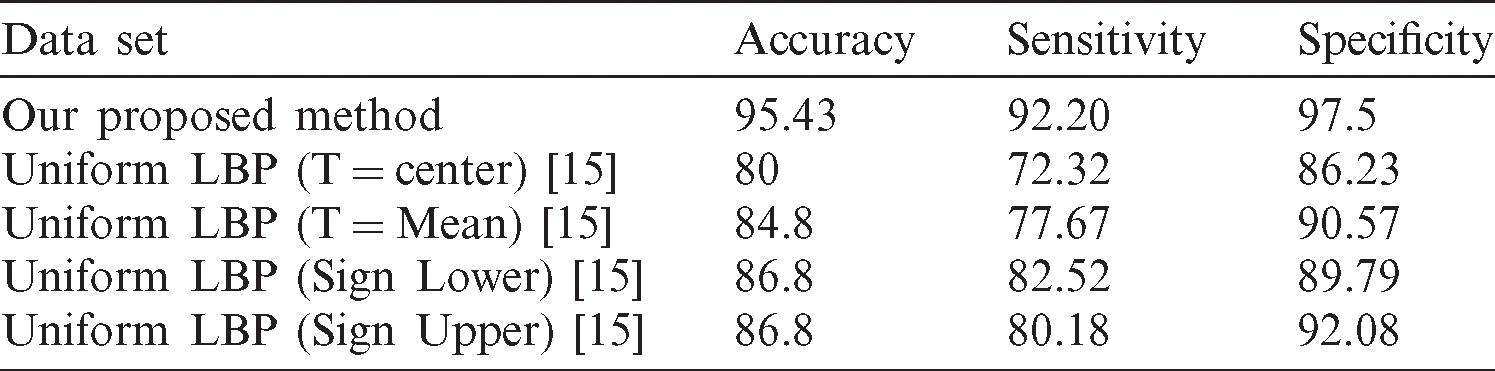
Normally, the benchmarking is carried out either through the use of a standard dataset or the utilization of methods utilized to the same problem domain or application. Moreover, the benchmarking is achieved utilizing the best and modern approaches for our case studies cancers segmentation and classification based on Viola–Jones model existed in the literature. Our proposed method achieved better accuracy with other methods. Tab. 4 involves different benchmarking approaches for several processes.
Table 4: The proposed method is compared with other methods, and selection criteria of the comparison scheme
The main components affecting the yield of the region growing in US images are fully automated US segmentation and the choice of the same measurements in the initial segmentation. Fully automated segmentation for ovarian tumor remains a difficult task and challenging issue. Thus, numerous ultrasound images in our database has been done for this purpose, with a particularly challenging process that may ruin the features extracted. There are two limitations related to the tumor edge (i.e., missing and poor border), which have been used in in our study to develop a new Viola–Jones model to segment ultrasound images for ovarian and breast cancer cases and compute the number of malignant cases. This model deals with US cases, in which a distinction exists between the background texture and ROI.
This study developed a Viola–Jones model to enable the segmentation of breast and ovarian cancer ultrasound images. The results showed that the new approach was able to achieve significant improvements in terms of tumor segmentation for benign and malignant cases, with varying shapes and sizes of tumor. In different types of image analysis procedures, one of the most important steps involves the accuracy and automation of tumor segmentation. This is particularly true for the detection and diagnosis of ovarian and breast cancers. The hope is that the application of the proposed approach will result in more focus on the aforementioned areas. In particular, the objective is to develop and evaluate the efficiency of a new automated and computerized approach that is capable of analyzing gynaecological ultrasound images to detect and classify abnormal cases or objects that have an impact on the health of women. The computational examinations conducted in this study are motivated by the technological advancements in imaging technologies, advent of state-of-the-art models of data mining and machine learning, and image processing and analysis theories. The segmentation result of the proposed system with other existing techniques in breast cancer data set was 78.8%, while that in the ovarian tumor data set was 79.2%. In the classification results, we achieved 95.43% accuracy, 92.20% sensitivity, and 97.5 specificity we used the breast cancer images. For the ovarian tumor, we achieved 94.84% accuracy, 96.96% sensitivity, and 90.32% specificity. For future studies, the data set used should be increased with additional difficult cases, particularly in ovarian tumor cases using deep learning approaches.
Acknowledgement: The authors would like to acknowledge Fakulti Teknologi Maklumat dan Komunikasi, Centre for Research and Innovation Management, Universiti Teknikal Malaysia Melaka and Ministry of Education Malaysia for providing all facilities and support for this study.
Funding Statement: “This research received funding from Basque Country Government”
Conflicts of Interest: “The authors declare that they have no conflicts of interest to report regarding the present study.”
1 W. Wein, S. Brunke, A. Khamene, M. R. Callstrom and N. Navab. (2008). “Automatic CT ultrasound registration for diagnostic imaging and image-guided intervention,” Medical Image Analysis, vol. 12, no. 5, pp. 577–585. [Google Scholar]
2 L. Rundo, C. Militello, S. Vitabile, G. Russo, E. Sala et al. (2020). “A survey on nature-inspired medical image analysis: A step further in biomedical data integration,” Fundamenta Informaticae, vol. 171, no. 1–4, pp. 345–365.
3 M. K. Abd Ghani, M. A. Mohammed, N. Arunkumar, S. A. Mostafa, D. A. Ibrahim et al. (2020). “Decision-level fusion scheme for nasopharyngeal carcinoma identification using machine learning techniques,” Neural Computing and Applications, vol. 32, no. 3, pp. 625–638. [Google Scholar]
4 M. A. Mohammed, B. Al-Khateeb, A. N. Rashid, D. A. Ibrahim, M. K. Abd Ghani et al. (2018). “Neural network and multi-fractal dimension features for breast cancer classification from ultrasound images,” Computers & Electrical Engineering, vol. 70, pp. 871–882. [Google Scholar]
5 S. Asgari Taghanaki, K. Abhishek, J. P. Cohen and G. Hamarneh. (2020). “Deep semantic segmentation of natural and medical images: A review,” Artificial Intelligence Review, vol. 6, no. 1, pp. 14006. [Google Scholar]
6 D. Mahapatra, B. Bozorgtabar and R. Garnavi. (2019). “Image super-resolution using progressive generative adversarial networks for medical image analysis,” Computerized Medical Imaging and Graphics, vol. 71, pp. 30–39. [Google Scholar]
7 N. Arunkumar, M. A. Mohammed, M. K. Abd Ghani, D. A. Ibrahim, E. Abdulhay et al. (2019). “K-means clustering and neural network for object detecting and identifying abnormality of brain tumor,” Soft Computing, vol. 23, no. 19, pp. 9083–9096. [Google Scholar]
8 O. I. Obaid, M. A. Mohammed, M. K. Abd Ghani, S. A. Mostafa and F. Taha. (2018). “Evaluating the performance of machine learning techniques in the classification of wisconsin breast cancer,” International Journal of Engineering & Technology, vol. 7, pp. 160–166. [Google Scholar]
9 N. Arunkumar, M. A. Mohammed, S. A. Mostafa, D. A. Ibrahim, J. J. Rodrigues et al. (2020). “Fully automatic model-based segmentation and classification approach for MRI brain tumor using artificial neural networks,” Concurrency and Computation: Practice and Experience, vol. 32, no. 1, e4962. [Google Scholar]
10 J. R. England and P. M. Cheng. (2019). “Artificial intelligence for medical image analysis: A guide for authors and reviewers,” American Journal of Roentgenology, vol. 212, no. 3, pp. 513–519. [Google Scholar]
11 D. Blum, I. Liepelt-Scarfone, D. Berg, T. Gasser, C. la Fougère et al. (2019). “Alzheimer’s disease neuroimaging initiative, controls-based denoising, a new approach for medical image analysis, improves prediction of conversion to alzheimer’s disease with fdg-pet,” European Journal of Nuclear Medicine and Molecular Imaging, vol. 46, no. 11, pp. 2370–2379. [Google Scholar]
12 L. Fang, X. Wang and L. Wang. (2020). “Multi-modal medical image segmentation based on vector-valued active contour models,” Information Sciences, vol. 513, pp. 504–518. [Google Scholar]
13 Z. Zhang and Y. Han. (2020). “Detection of ovarian tumors in obstetric ultrasound imaging using logistic regression classifier with an advanced machine learning approach,” IEEE Access, vol. 8, pp. 44999–45008. [Google Scholar]
14 D. Q. Zeebaree, H. Haron, A. M. Abdulazeez and D. A. Zebari. (2019). “Machine learning and region growing for breast cancer segmentation,” in Int. Conf. on Advanced Science and Engineering, Duhok, Iraq, pp. 88–93. [Google Scholar]
15 D. Q. Zeebaree, H. Haron, A. M. Abdulazeez and D. A. Zebari. (2019). “Trainable model based on new uniform LBP feature to identify the risk of the breast cancer,” in Int. Conf. on Advanced Science and Engineering, Duhok, Iraq, pp. 106–111.
16 C. Mazo, C. Kearns, C. Mooney and W. M. Gallagher. (2020). “Clinical decision support systems in breast cancer: A systematic review,” Cancers, vol. 12, no. 2, pp. 369. [Google Scholar]
17 F. Shaikh, J. Dehmeshki, S. Bisdas, D. Roettger-Dupont, O. Kubassova et al. (2020). “Artificial intelligence-based clinical decision support systems using advanced medical imaging and radiomics,” Current Problems in Diagnostic Radiology. [Google Scholar]
18 B. J. Erickson, P. Korfiatis, Z. Akkus and T. L. Kline. (2017). “Machine learning for medical imaging,” Radiographics, vol. 37, no. 2, pp. 505–515. [Google Scholar]
19 L. Pizzuti, E. Krasniqi, C. Mandoj, D. Marinelli, D. Sergi et al. (2020). “Observational multicenter study on the prognostic relevance of coagulation activation in risk assessment and stratification in locally advanced breast cancer. Outline of the ARIAS Trial,” Cancers, vol. 12, no. 4, pp. 849. [Google Scholar]
20 B. Kaur, K. S. Mann and M. K. Grewal. (2017). “Ovarian cancer stage based detection on convolutional neural network,” in 2nd Int. Conf. on Communication and Electronics Systems, Coimbatore, India, pp. 855–859. [Google Scholar]
21 J. A. Watkins, S. Irshad, A. Grigoriadis and A. N. Tutt. (2014). “Genomic scars as biomarkers of homologous recombination deficiency and drug response in breast and ovarian cancers,” Breast Cancer Research, vol. 16, no. 3, pp. 211. [Google Scholar]
22 N. Harrington. (2007). “Segmentation of human ovarian follicles from ultrasound images acquired’ in vivo’ using geometric active contour models and a naïve bayes classifier,” Ph.D. dissertation. University of Saskatchewan, Canada. [Google Scholar]
23 M. Landgren, N. C. Overgaard and A. Heyden. (2013). “Segmentation of the left heart ventricle in ultrasound images using a region based snake,” in Medical Imaging: Image Processing, Florida, United States, vol. 8669, 866945. [Google Scholar]
24 J. L. Mateo and A. Fernández-Caballero. (2009). “Finding out general tendencies in speckle noise reduction in ultrasound images,” Expert Systems with Applications, vol. 36, no. 4, pp. 7786–7797. [Google Scholar]
25 R. Rodrigues, A. Pinheiro, R. Braz, M. Pereira and J. Moutinho. (2012). “Towards breast ultrasound image segmentation using multi-resolution pixel descriptors,” in Proc. of the 21st Int. Conf. on Pattern Recognition, Tsukuba, Japan, pp. 2833–2836. [Google Scholar]
26 A. Ciurte, X. Bresson, O. Cuisenaire, N. Houhou, S. Nedevschi et al. (2014). “Semi–supervised segmentation of ultrasound images based on patch representation and continuous min cut,” PLoS One, vol. 9, no. 7, pp. e100972. [Google Scholar]
27 D. B. Nelson, A. L. Hanlon, G. Wu, C. Liu and D. N. Fredricks. (2015). “First trimester levels of BV-associated bacteria and risk of miscarriage among women early in pregnancy,” Maternal and Child Health Journal, vol. 19, no. 12, pp. 2682–2687. [Google Scholar]
28 T. J. Hanchard. (2020). “Novel early first trimester ultrasound measures in the prediction of miscarriage, small-for-gestational age neonates and maternal hypertensive disorders,” Ph.D. dissertation. University of Sydney, Australia. [Google Scholar]
29 R. Deshpande, R. E. Ramalingam, N. Chockalingam, R. Naemi, H. Branthwaite et al. (2013). “An automated segmentation technique for the processing of foot ultrasound images,” in IEEE Eighth Int. Conf. on Intelligent Sensors, Sensor Networks and Information Processing, Melbourne, Australia, pp. 380– 383. [Google Scholar]
30 L. Li, Y. Fu, P. Bai and W. Mao. (2009). “Medical ultrasound image segmentation based on improved watershed scheme,” in 3rd Int. Conf. on Bioinformatics and Biomedical Engineering, Beijing, China, pp. 1–4. [Google Scholar]
31 S. Agrawal and P. Khatri. (2015). “Facial expression detection techniques: Based on viola and jones algorithm and principal component analysis,” Fifth Int. Conf. on Advanced Computing & Communication Technologies, Haryana, India, pp. 108–112. [Google Scholar]
32 J. Ma, F. Wu, T. A. Jiang, J. Zhu and D. Kong. (2017). “Cascade convolutional neural networks for automatic detection of thyroid nodules in ultrasound images,” Medical Physics, vol. 44, no. 5, pp. 1678– 1691. [Google Scholar]
33 P. S. Rodrigues. (2017). “Breast ultrasound image dataset,” Version 1, . [Online]. Available: https://data.mendeley.com/datasets/wmy84gzngw/1. [Google Scholar]
 | This work is licensed under a Creative Commons Attribution 4.0 International License, which permits unrestricted use, distribution, and reproduction in any medium, provided the original work is properly cited. |