DOI:10.32604/cmc.2020.013443
| Computers, Materials & Continua DOI:10.32604/cmc.2020.013443 | |
| Article |
Intelligent Prediction Approach for Diabetic Retinopathy Using Deep Learning Based Convolutional Neural Networks Algorithm by Means of Retina Photographs
1CSE Department, J.B. Institute of Engineering and Technology, Hyderabad, 500075, India
2School of Information Technology and Engineering, Vellore Institute of Technology, Vellore, 632014, India
3Department of Computer Science and Engineering, Anna University Regional Campus, Tirunelveli, 627007, India
4Department of Information Technology, National Engineering College, Kovilpatti, 628503, India
5Department of Software, Sejong University, 209 Neungdong-ro, Gwangjin-gu, Seoul, 05006, Korea
6Department of Computer Science and Engineering, Soonchunhyang University, Asan, 31538, Korea
*Corresponding Author: Yunyoung Nam. Email: ynam@sch.ac.kr
Received: 06 August 2020; Accepted: 15 September 2020
Abstract: Retinopathy is a human eye disease that causes changes in retinal blood vessels that leads to bleed, leak fluid and vision impairment. Symptoms of retinopathy are blurred vision, changes in color perception, red spots, and eye pain and it cannot be detected with a naked eye. In this paper, a new methodology based on Convolutional Neural Networks (CNN) is developed and proposed to intelligent retinopathy prediction and give a decision about the presence of retinopathy with automatic diabetic retinopathy screening with accurate diagnoses. The CNN model is trained by different images of eyes that have retinopathy and those which do not have retinopathy. The fully connected layers perform the classification process of the images from the dataset with the pooling layers minimize the coherence among the adjacent layers. The feature loss factor increases the label value to identify the patterns with the kernel-based matching. The performance of the proposed model is compared with the related methods of DREAM, KNN, GD-CNN and SVM. Experimental results show that the proposed CNN performs better.
Keywords: Convolutional neural networks; dental diagnosis; image recognition; diabetic retinopathy detection
Diabetic retinopathy conjointly is called diabetic diseases once the injury happens to the tissue layer because of polygenic disease [1]. It is a general illness that imitates up to 80% of all patients [2]. The analysis showed that a minimum of 90% of those latest cases might well be abridged if there have been correct and alert healing with the observation of the eyes [3]. An aged and individual has a polygenic disease with the probabilities of developing diabetic retinopathy. A huge quantity of adults having diabetes in the world is approximated to 366 million in 2011 and 552 million by 2030 [4]. The numeral figure of individuals with this kind a pair of polygenic disease is mounting in each country where 80% of individuals with the polygenic disease [5]. The current studies demonstrate an increasing dominance in rural areas [6]. Several patients do not have any clinically visible Diabetic Retinopathy (DR) premature once diagnosing; however, there are recognized structural variations in the retina with the induced amount of retinal bloodstream, augmented leukocyte devotion, clotting of vault membranes [7]. The hastiest clinically evident period of DR is non-proliferative diabetic retinopathy (NPDR) pigeonholed by the enlargement of microaneurysms [8].
The illness will reach restrained NPDR anywhere supplementary DR lesions grow, together with venous caliber variations and intra-retinal microvascular abnormalities [9]. The sternness and amount of those lesions have ensued in brutal NPDR, and retinal blood deliver progresses progressively more negotiation [10]. As a corollary, the non-perfused parts of the retina direct signals inspiring fresh blood vessel enlargement, according to proliferative diabetic retinopathy (PDR) [11]. The fresh blood vessels are square measure irregular, quickly frequently causing harsh visual loss. Diabetic Macular Edema (DME) [12] ensues when there is swelling with serious of the retina owing to the dripping of fluid from blood vessels inside the macula and may appear during any period of DR [13]. The succession from no retinopathy to PDR may obtain this slow rate that supports DR to be acknowledged and indulgenced at a preliminary phase [14]. Expansion and succession of DR are said to stage and management of the polygenic disease. DR in its initial type is usually well but flexible to healing [15]. The Initial healing of Diabetic Retinopathy Study [16] showed the treatment with optical device surgical operation that will quite fraction the danger of embryonic visual failure from PDR [17]. In common, classification is made by extorting the descriptions with the images monitored by recognizing the generated classes according to the input data [18]. In categorization, the extorted features enumerated with related to the particular disease [4]. The category-based extortion is used to analyze the particular disease [19].
The proposed method is utilized that the increment of the spatial resolution compared with the methods. It is automatically identified as the feature extraction for diabetic retinopathy. The validation and training errors have been identified whenever the total amount of iterations is increased. The Convolutional Neural Networks are the common computer vision methodology with fully connected networks with the dissimilar metrics. The fully connected layers can perform the classification of real-time images. The proposed method also used to reduce the computational cost in several parameters. The pooling layers are introduced to minimize the coherence within the adjacent layers. The classification has been achieved using the proposed method that utilized the processing power is required to learn the kernel values and reached the target value within the inference. The proposed method also identified the compound patterns in the adjacent Convolutional layers. The patterns are identified while the kernel has 100 percent matching. The feature loss factor is used to increase the label value. The methodology is based on the performance metrics of specificity and sensitivity for identifying glaucoma, our proposed methodology is used to perform the parameters of precision, recall and accuracy that will produce the highest amount of accuracy compared to the previous methodology. The pre-training technique is implemented into the selected local images to produce the result. But in our model, the pre-training technique is performed in more amounts of images that will increase the enhanced performance.
The contribution of the paper is
• A new model that uses the Convolutional Neural Network (CNN) to increase the accuracy of Retinopathy Diagnosis.
• The proposed algorithm is constructed to eliminate the feature extraction hurdles and also used to reduce the computational power to gather the highest amount of accuracy.
• The model is trained by different images of eyes that have retinopathy and those which do not have retinopathy.
• Experimental results confirmed the advantages of the new model.
The organization of the paper is as Section 2 demonstrates the related works that the existing methods are used to identify the diabetic retinopathy, Section 3 proposes the Convolutional neural networks with Max pooling layers framework and the pre-processing strategy, Section 4 explains the experiments with the comparative analysis for the proposed technique with the related techniques and finally, Section 5 concludes the paper.
Several methods are used to implement Diabetic Retinopathy (DR) detection from Retinal images. DR detection with retinal images used Machine Learning (ML) framework classification, which was lacked to define the level of DR identification [20]. The fundus images-based DR detection dealt with spatiotemporal images but took more time for execution [21]. Convolutional Neural Network (CNN) was used to classify the image based on the Random Forest (RF) classifier [22]. An innovative Deep Learning methodology was constructed for microaneurysm recognition [23]. An involuntary classification of blood vessels in fundus images was implemented with the novel technique in [24]. An established technique of diabetic retinopathy identification device was constructed with preprocessing [25]. A new methodology was implemented to finalize the identification of diseases [26]. Fundus images are utilized to identify the same [27]. Another methodology was used for diagnostic retinopathy [28]. The method is implemented for the discovery of the exudates in the color unpredictability and dissimilarity retinal images [29]. A lot of other techniques used classification algorithms like KNN [30], Random forest [31], SVM [32], Naïve Bayes [33] which do not best fit for the dataset that encloses images.
The specificity and sensitivity are observed for identifying diabetic retinopathy which is confirmed by the ophthalmologist panel. A large amount of images are validated in the real-time data set, the deep learning based algorithms are very useful to generate the specificity and sensitivity. The algorithm has been evaluated using the numbers within 0 to 1 for identifying the diabetic retinopathy with the probability and classifications. The operating curves have been plotted by contrasting the curve points and threshold value from the development set. The initial operating point is used to identify the specificity and the adjacent point is used to discover the sensitivity. The sensitivity with the highest value is the primary element for the screening tool [34]. The Diabetic Retinopathy has been undiagnosed in many occasions that will cause the preventable blindness. To reduce this, the robust diagnostic system has to be developed with automatic Diabetic Retinopathy screening with accurate diagnoses. The deep learning technique based diagnostic tool has been developed with automatic detection from the fundus images. The characteristic curve is the parameter to evaluate the precision and recall of every fundus images from the data set. An artificial intelligent related algorithm is utilized to process the fundus images which are observed from the diabetic patients [35].
The diabetic retinopathy is the measurement within the ocular biometry and refractive error. The population-related investigation is normally processed around the diabetic patients. The Early Treatment based study is completed and having clinically considerable threshold values [36]. The temporal retinal arteries are evaluated using the associations within the optic disc metrics. The curvature from the surface and the point of retinal vessel trunk are the positions to identify the refractive error. The angle is measured according to the images from the dataset. The linear regression with Bayes coefficients is utilized to analyze the covariance parameter within the spherical refractive error and mean variation. The optic nerve head is mainly concentrated on myopic patients. The optical coherence tomography has been implemented to the images for depth identification of retina [37]. The linear regression-based angular position is identified with the evidence for vein positions [38]. The glaucomatous optic neuropathy has been detected using an advanced deep learning system with improved specificity and sensitivity within the retinal fundus images. The various validated datasets were allowed to access the dissimilar image quality-related to fundus images; the population-related evaluation has been used to discover the diabetic retinopathy diagnosis [39], deep Convolutional neural networks [40], ant colony optimization [41].
Every image with the statistical information is trained with the neural models that can be capable of justifying the dissimilar usage of statistical methodology. The relationship within the Spherical Equivalent and blood vessel along with the functional diagnostic component like glaucoma is used to discover the parameter for the development of optical coherence tomography. The visual fields of all the patients are analyzed to discover the fixation loss using the OCT scan. The thickness of the retinal images that matches the relevant fundus images then the particular centre is excluded from the preprocessing state. The automation of identifying Diabetic Retinopathy into clinical approach will need to solve the barriers and it should address the ethical issues for identification; the proposed method is constructed to provide the solution for this kind of problems.
The main issue with the related methodologies is the pre-processing of the pattered images to improve the features. Enhancement of the images for extracting the features will be inaccurate to import the high value of resolution. Diabetic Retinopathy is a human eye disease that will be automatically detected using an efficient methodology. The Image resizing metric is one of the main issues for training images because of minimized computational power. The feature loss factor is in increasing value whenever the labels of the image may vary. To address this kind of problem, Convolutional Neural Network (CNN) is used with the dissimilar capacities in view of predicting and training the images. The proposed Convolutional Neural Network with fully connected layers is utilized to classify the images from the dataset which contains more than 45000 images. The images can be segregated into Training set and testing set. The proposed methodology is classified with the output classes and pixel values. The entire network is trained with Backpropagation methodology. The ReLU is constructed with feature maps and bias values. The optimized weight values are computed for generating the best methodology.
3.2 Convolution Neural Networks
The model is built using Keras and Tensor Flow as the backend. Tensor Flow is chosen as the backend due to better performance over Theano, and the ability to visualize the neural network using Tensor Board. For forecasting two categories, Eye Net utilizes three Convolutional layers, individually having a depth of 32. Max Pooling layer is implied after all three Convolutional layers with size (2, 2). After assembling, the data are nourished within a particularly dense layer of size 128, and lastly to the output layer, containing two Softmax nodes. A Convolutional Neural Network is a feed-forward artificial neural network that is connected where the pattern within its neurons is developed using the visual cortex so that individual neurons are organized with the overlapping regions within the visual field. It uses a complicated structure with the stacked layers to be adapted to identify the images. The constructed framework is used for multi-class classification that every feature is identified within the image. Fifteen layers have the weights whose 13 layers are Convolutional and the rests are entirely linked. Our proposed model enlarges the logistic regression value for the multinomial element. The Max-pool layer is framed using 3 Convolutional layers that need to improve accuracy. Each Convolutional layer is framed using the ReLU layer to increase the training space it is illustrated in Fig. 1.
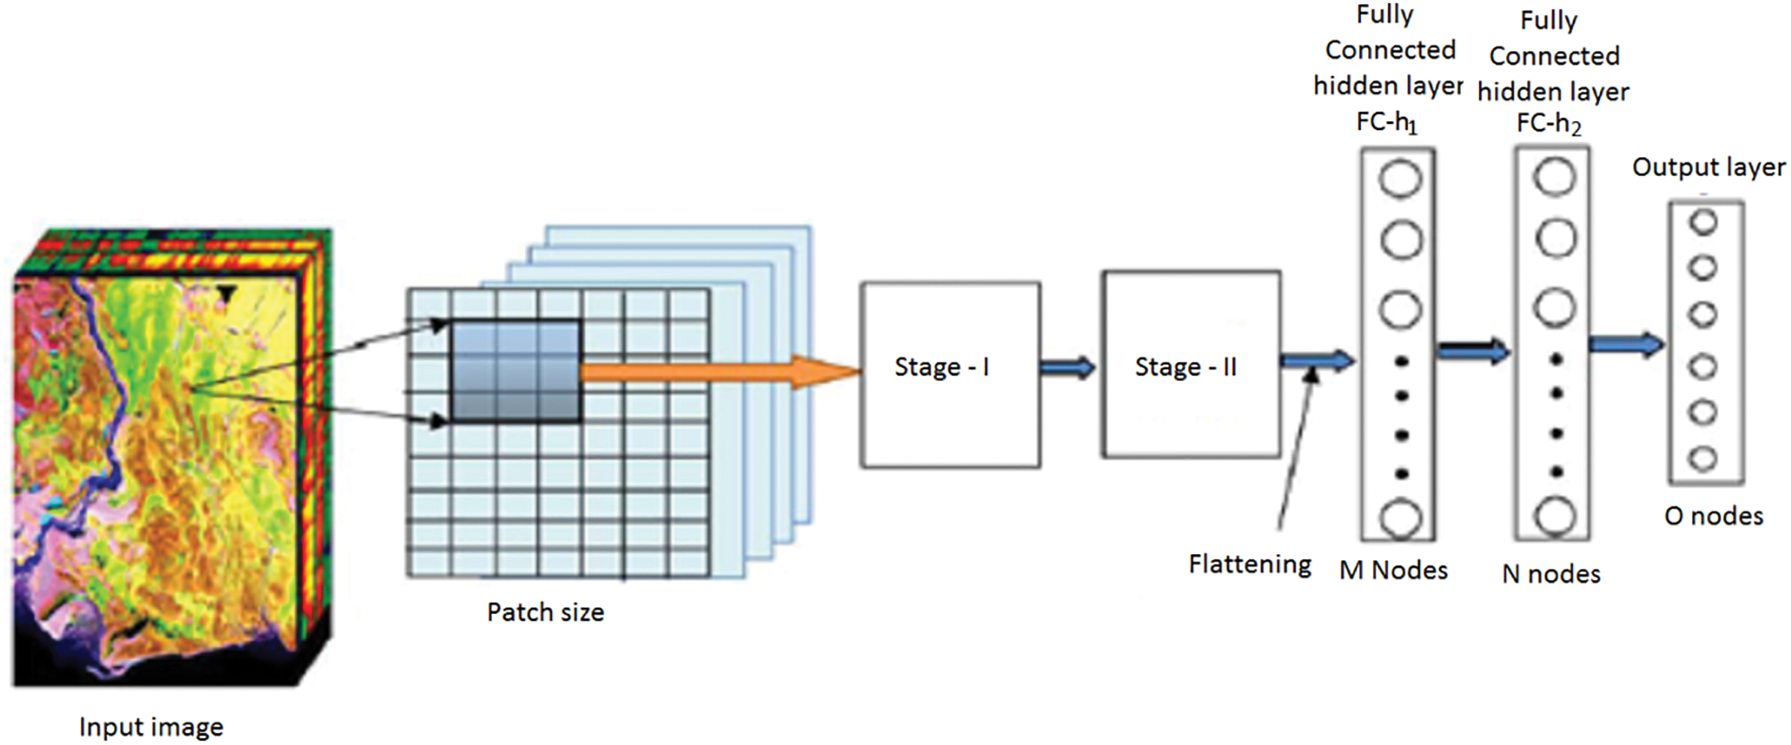
Figure 1: CNN Architecture
The CNN is the combination of the Convolutional layer and spatially related features to advance the classification performance. The architecture design contains the Fully Connected Layers. The output of this model is classified using the label classes  for particular pixels
 . The complete network is trained using the backpropagation algorithm with error handling methods. The filter for controlling Convolution layers and the weight for the Fully Connected Layers are completed based on the errors. The extraction is done using the
  based on the image sizes with spectral features extracted from the images. The adjacent pixel contains the patch and the connecting window for the adjacent patches. Finally, the patch contains a pixel to concentrate on the Maxpool layers. The human interaction system contains the complex values that integrate outputs for adjacent values and the Maxpool stages as the feature map and filters are illustrated in Fig. 2.
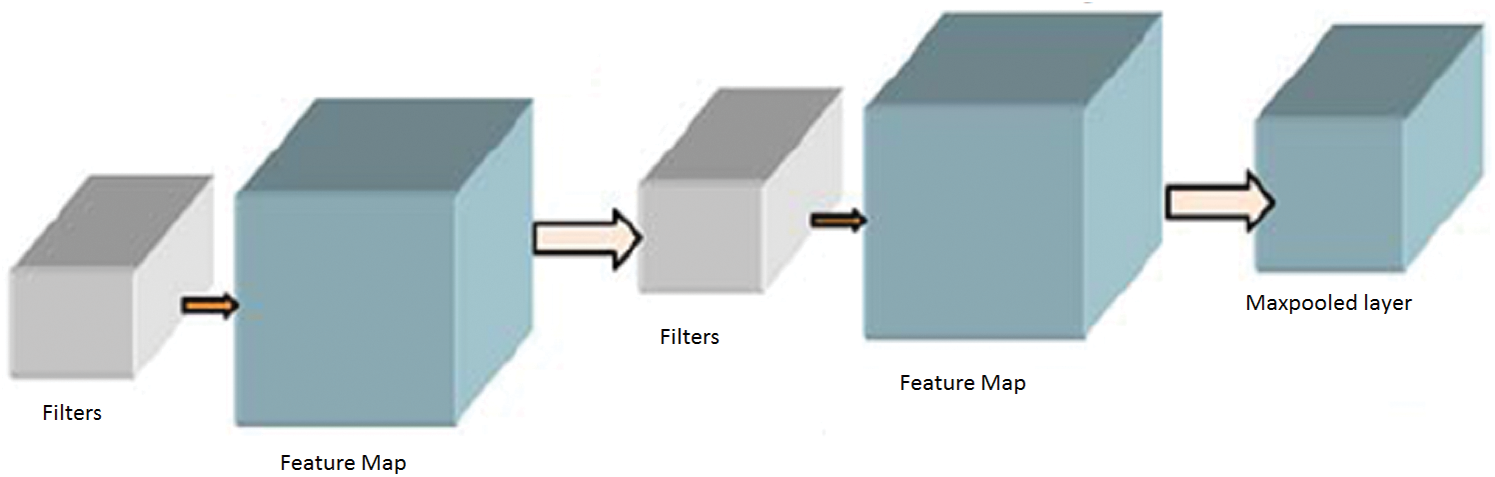
Figure 2: Max pooling stages
The complex values are invariant to the features and shared weights. The connection based on the correlation values is integrated with the generalization of the methodology. The ReLU formation for the activation function is denoted as  having the total amount of feature maps of the size
 . The initial convolution layer is demonstrated in Eq. (1).
The feature map for the Convolutional Layer is computed using Eq. (2).

The input image for classifying the computational resources is achieved using the zero-padding technique for filter value and kernel values. The computational speed and the total amount of class labels are essential for computing the Feature map for the input image. The filters for every Convolutional layer use depth and common edges for huge amount of feature maps for reducing the computational time and storage space. Therefore, the parameters are used to achieve stability for a particular problem. The pixels which are used to balance the operation of the input image are computed using the parameter stride. The filter shifts one pixel at a period whenever the single stride. Padding with zeros in the spatial based feature map is used in the input image. In the initial stage, the number of features captured from the 1st Convolutional layer will be the input to the next Convolutional layer. The Convolutional functions are deployed according to Eqs. (1) and (2). The output is generated from the 2nd Convolutional layer with feature maps of the max-pooling layer. Even though the operation is performed using the feature of the location in the Convolutional layer, the computational complexity of the entire feature map will reduce the accuracy of classification. The max-pooling operation can segregate the input feature value into a group of operations. So the highest value is computed from the feature map. The N × N matrix is used to compute the feature map using Eq. (3).
The next stages of the operations are equal to the initial stage of the Convolutional layer excluding the intensity of the feature maps. The output value of every stage has the spatial value and feature map. The feature map must consist of an initial level of features like simple operations. The prime importance of increasing the layers is to improve the visual impacts with the minimum amount of representation. The Fully Connected Networks are used to classify the features captured in the Convolutional layer. The hidden layers are used to generate the expected output of the max-pooling layer. The computation is performed using the hidden layer of Fully Connected Networks in Eqs. (4) and (5).
Convolutional Networks employs by moving small filters through the input image. This means the filters are re-used for recognizing patterns throughout the whole input image. This makes the Convolutional Networks much more authoritative than Fully-Connected networks with a similar number of variables. This, in turn, makes the Convolutional Networks quicker to train. The ReLU based Activation function is generated using the threshold value of zero with Eq. (6).

Likewise, the activated output values for the nodes in the adjacent layer are generated using the hidden layers. The output of the CNN layer is stopped at output layers contains the total amount of nodes that describe the assumed amount of class labels to be identified. The input pixel is categorized with a Softmax activation function. The input pixel is classified and compared with the probability output values and it is generated using Eq. (7).
where ,
,  ) is the input for the Softmax activation function for the output layer. The error within the assumed and the generated output is computed with the activation function. For the training stage, the derivation for getting the error value is computed using the weight function with the help of fully connected networks. The entropy miss function
  is implemented to find the probability function using Eq. (8).
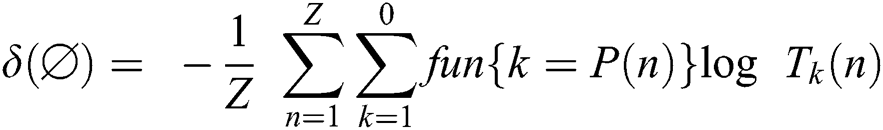
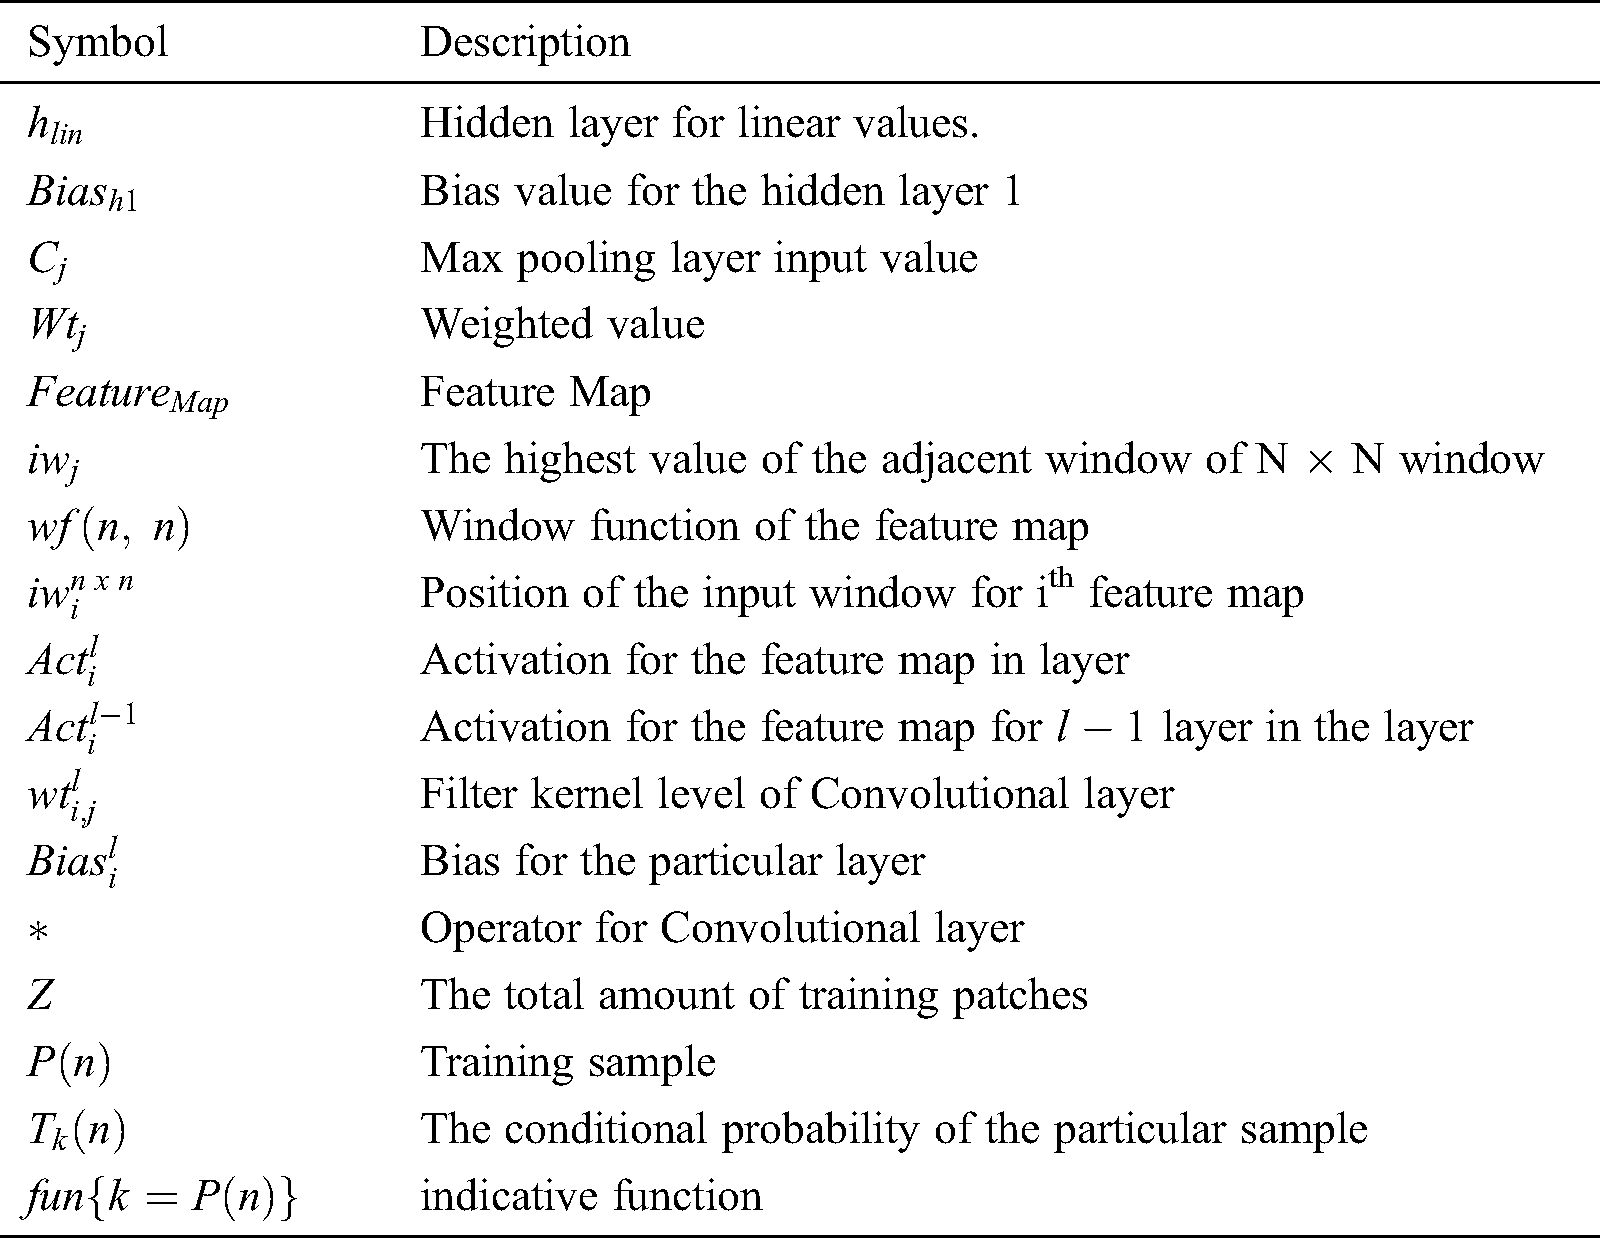
The symbols used to construct the proposed methodology are illustrated in Tab. 1.
Table 1: Symbols used in the proposed methodology
Step 1: Building the framework
i) Construct the CNN model in the process of the Convolutional layer with the hidden layers for getting better output.
ii) Apply filters to each layer with applied window size to every Maxpool layer.
iii) The ReLU activation function is the frame for each component of the Convolutional layer and hidden layer. Frame Softmax activation function for the output layer in Fully Connected Networks.
Step 2: Dataset preparation
i) The pixel values of the input image are normalized to produce the scaling with the value of  .
.
ii) According to the band computation, the patch image is computed for every pixel value. Read the truth value for every input pixel and organize them into the target class. Repeat the same procedure for every pixel in the input classification.
iii) Perform the shuffling operations within the pixels for each target class.
iv) Divide the total number of pixels into two parts where 75% is used for training and 25% is used for testing using Convolutional Neural Networks.
Step 3: CNN model initialization
i) Every filter kernel is used the fully connected networks with bias values and weight values for random units.
ii) The maximum number of epochs is utilized for training the batches with striding and zero padding concepts.
iii) The value of loss function is computed for further processing.
Step 4: Training process
i) For every epoch, the input value for every patch in the network is used to calculate the output layer values.
ii) For every output layer, calculate the conditional probability and loss function.
iii) Update the value of the weight of every network with the learning ratio and the kernel value for the input.
iv) Compute the backpropagation value for the Convolutional layer and hidden layers and the bias values for fully connected networks.
Step 5: Testing process
i) The patches for every testing sample are integrated into the Convolutional neural network to eliminate the weight of the patches.
ii) The errors for generating the classification are computed in every process.
iii) The process is terminated whenever the accuracy value is reached the threshold value.
Step 6: Implementing the Final output model
i) While producing the output value, the accuracy is the prime parameter. The usual parameters like learning ratio, cost function, number of filters in the Convolutional layers, Maxpooling value, total amount of hidden layers, size of the patches, combined layers formation.
ii) The produced output value while classification is in the Testing and Training process. The optimized weight values can be used for generating the best model.
The images were downloaded using the Kaggle CLI. Running this on an EC2 instance allows downloading the images in about 30 min. All images are then placed in their respective folders and expanded from their compressed files. In total, the original dataset totals 35 gigabytes. All images were scaled down to 256. Despite taking longer to train, the detail present in photos of this size is much greater than 128. Additionally, 403 images were dropped from the training set. Scikit-Image raised multiple warnings during resizing due to these images having no color space. Because of this, any images that were completely black were removed from the training data. All images were rotated and mirrored. Images exclusive of retinopathy were mirrored. Images that obligated retinopathy was mirrored and rotated with the following degrees such as 90, 120, 180, and 270. The first images illustrate two pairs of eyes, along with the black borders. After rotations and mirroring, the class difference is rectified; with a little thousand more images developing retinopathy. Overall, there are 106,386 images being processed by the neural network. The framework for the proposed methodology for image classification is demonstrated in Fig. 3.
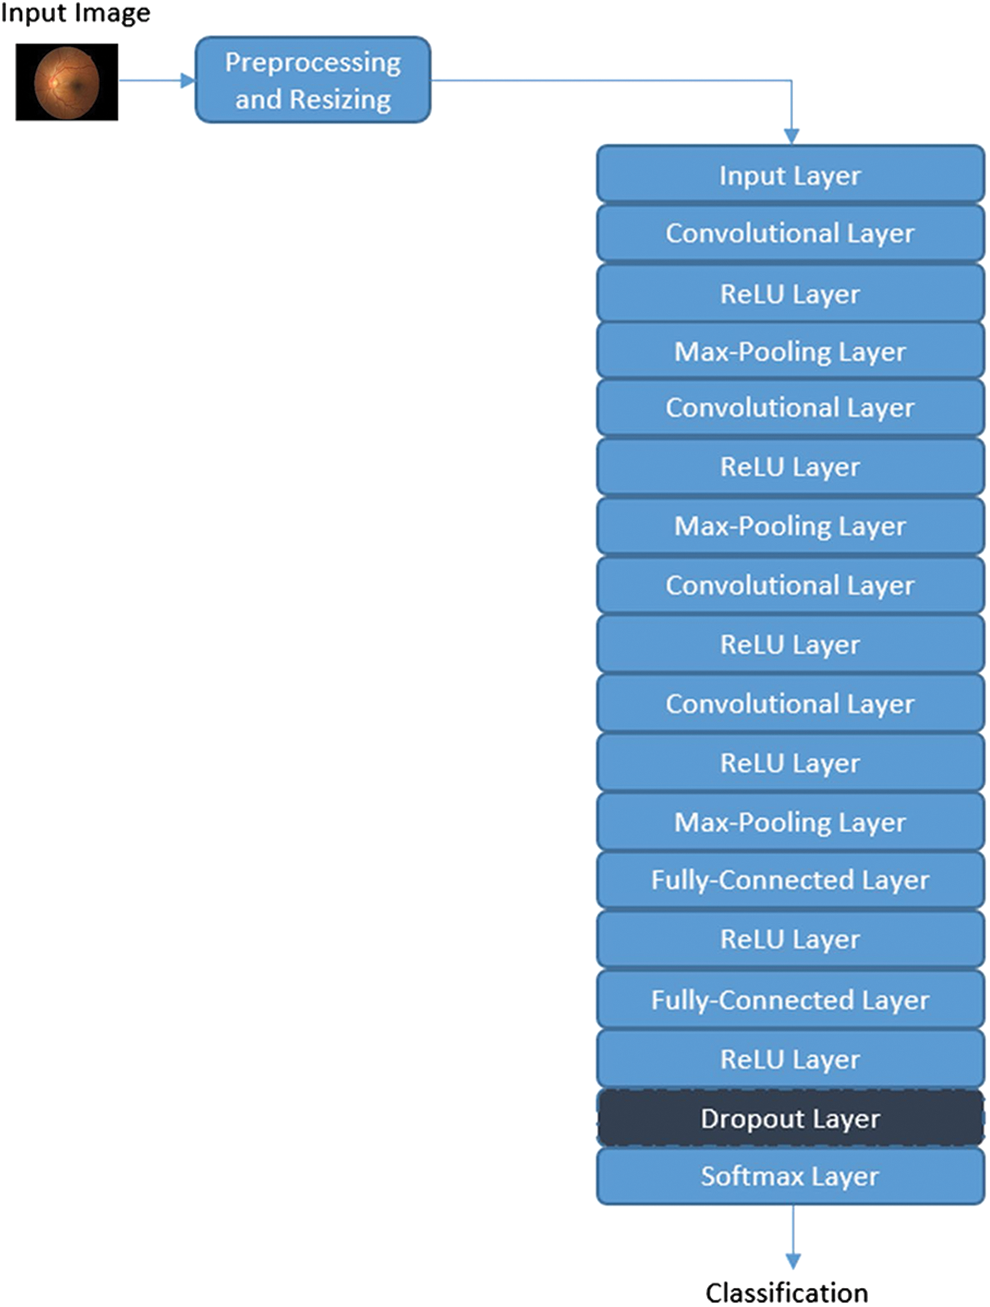
Figure 3: Framework for the proposed methodology
The proposed methodology uses the Convolutional Neural Network with the architecture of the layers for training and validating the accuracy level. Fig. 4 demonstrates all kinds of Retinopathy images.
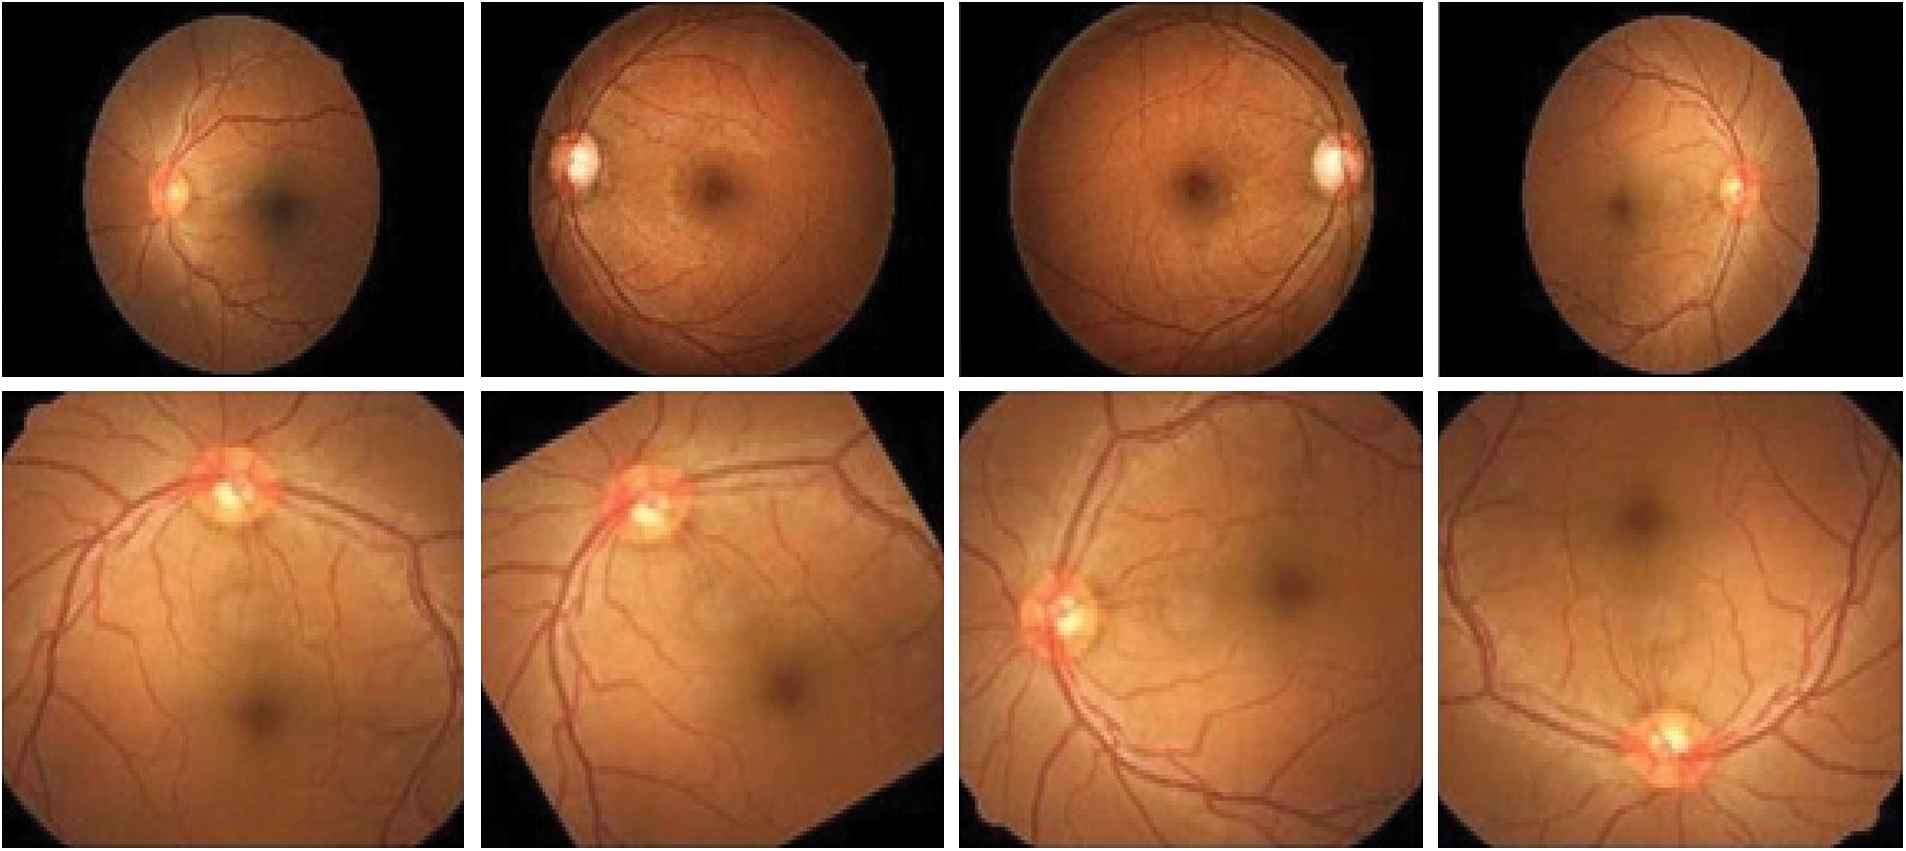
Figure 4: Eye Retinopathy images
The sharing of weight coefficient in Convolutional layers may minimize the number of parameters. It is much easy to identify the edges and other corners. The pooling layer is used to identify the location of the extracted images.
Kaggle Retinopathy detection dataset [42] is used to analysis the Retina images to compare with the existing methodologies and it is implemented in Python language. After pre-processing is done, the subsets of the dataset are divided into a training set and a testing set. The training set is with 45000 images, and the testing set contains nearly 8500 images. It is illustrated in Fig. 5.
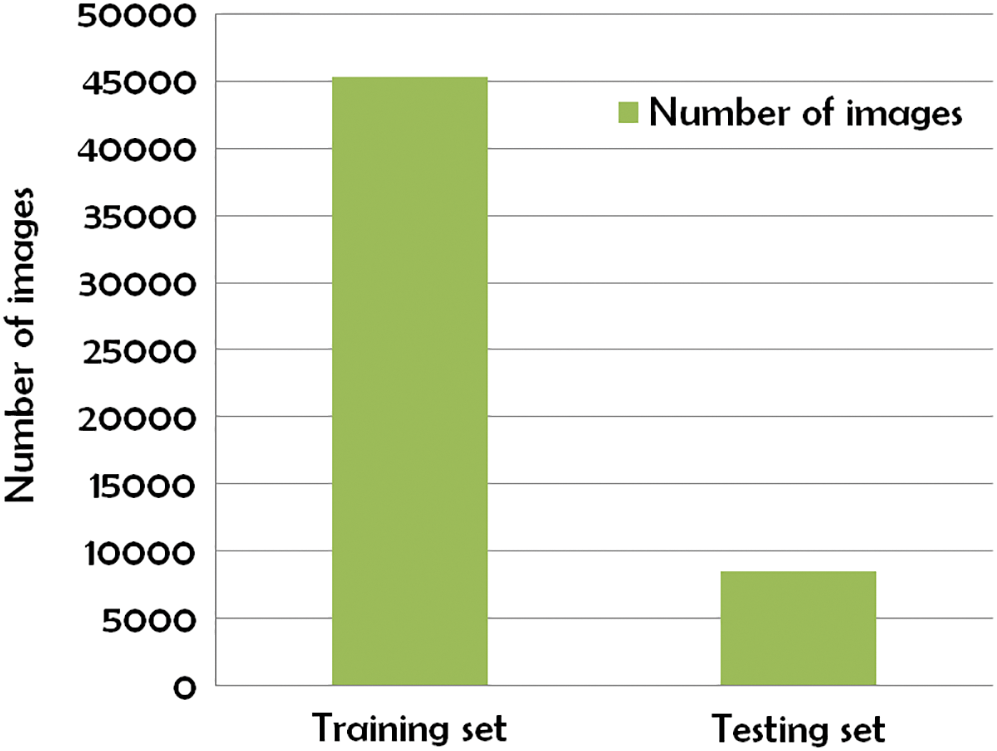
Figure 5: Subset of Kaggle Retinopathy detection dataset
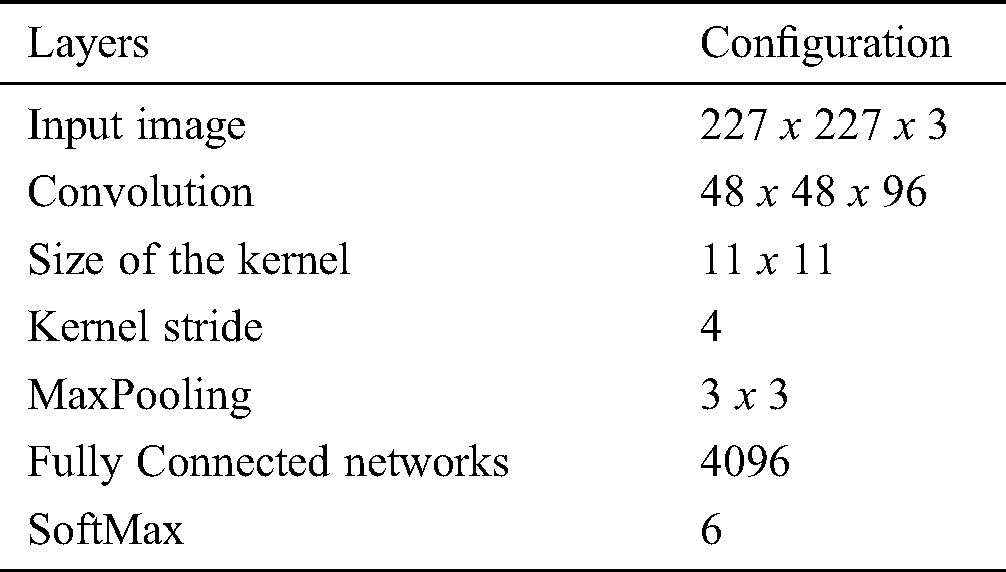
The proposed methodology is compared with the related methods namely KNN [30], GD-CNN [14], SVM [32] and DREAM [43]. Tab. 2 demonstrates the proposed methodology with Convolutional neural network layers and the related configurations.
Table 2: Configuration for layers
The simulation is conducted using Anaconda and comparative performance analysis is conducted. The prediction for the image with 4 types is illustrated in Fig. 6.
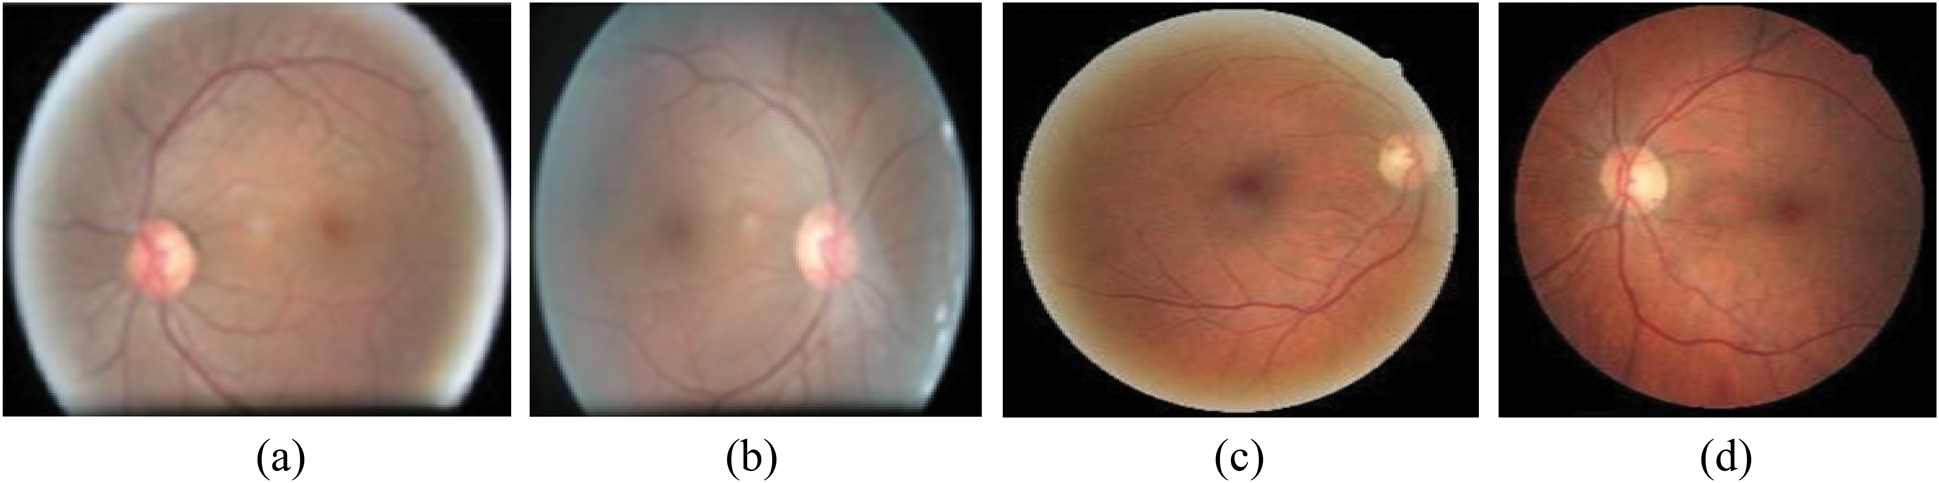
Figure 6: Prediction for the image. (a) Unclear in right side, (b) Unclear in left side, (c) Starting stage of right side, (d) Starting stage of left side
Prediction for the image is computed by showing the retinography starting stage with exploratory data analysis from the following Fig. 7. The EDA gives the full structure of DR identification when the new input inserted; it changes the Level labels for binary classification. Thus, either the person has a degree of retinopathy or not. Fig. 8 demonstrates the Accuracy with variables and values for the input image.
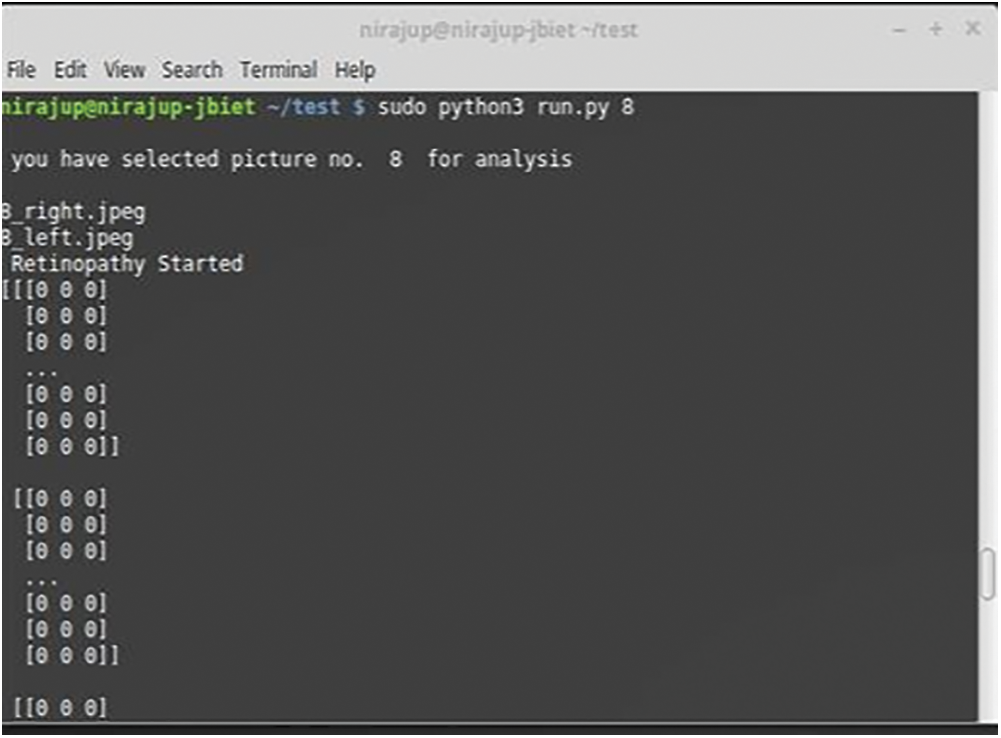
Figure 7: Retinopathy starting stage prediction
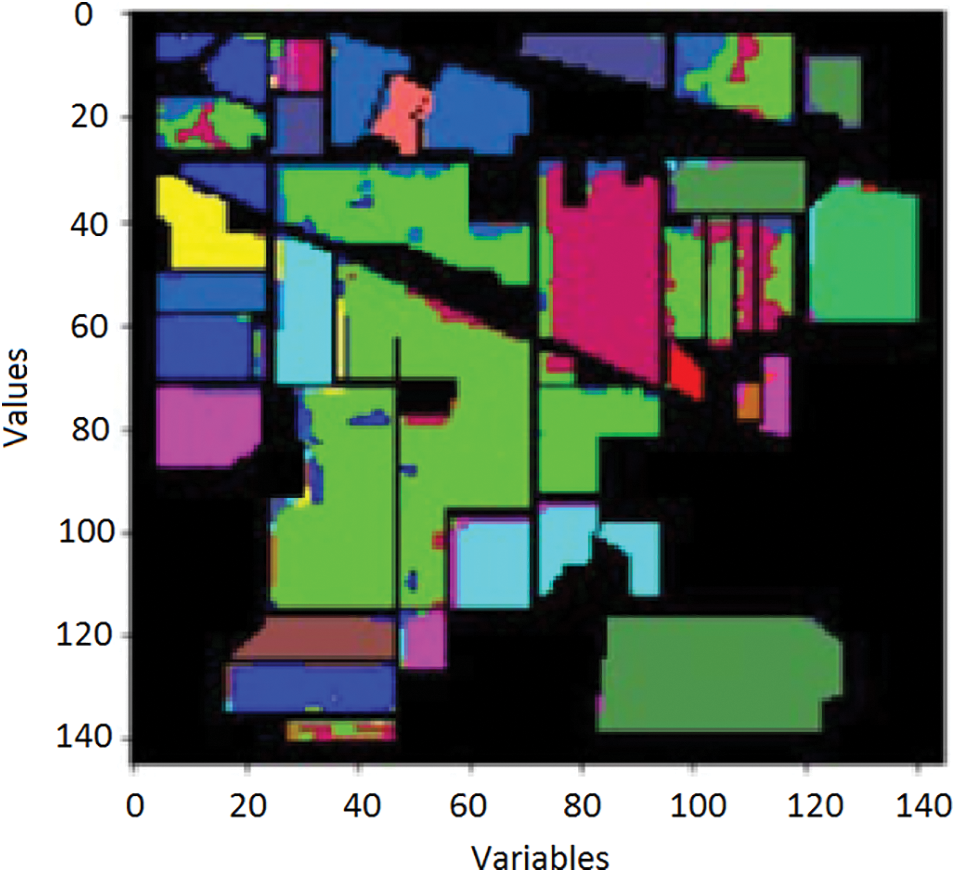
Figure 8: Accuracy with variables and values
Fig. 9 illustrates Exploratory Data Analysis (EDA). The classification performance is computed using the overall accuracy. There were several classes that have some known samples, like similarity images.
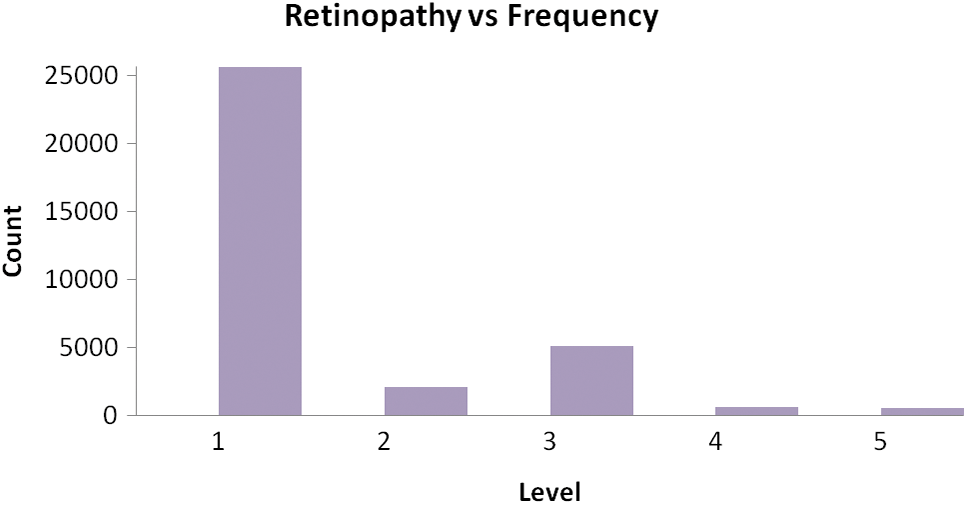
Figure 9: Exploratory Data Analysis (EDA)
To increase the number of training samples, the classes with the minimum number of samples are used for classification. The results generated from the experiments in several numbers of epochs. It is concluded that the more amount epochs are needed to improve the accuracy level. The accuracy for testing is minimum value concerning the training accuracy, the visual representation of the input image and the assumed image has been used with the period of 25 epochs. Fig. 10 demonstrates the Loss of training dataset. Fig. 11 illustrates the overall accuracy. Fig. 12 states that the Loss value for the dataset for retinopathy images that the predicted image that has the minimum amount of classification is implemented. The proposed algorithm has a better classification for high frequency-based input images. The overall accuracy is maintained through the proposed methodology for training is 98.45% and testing is 92.15%. The proposed methodology is compared with the related methods of DREAM, KNN, GD-CNN and SVM.
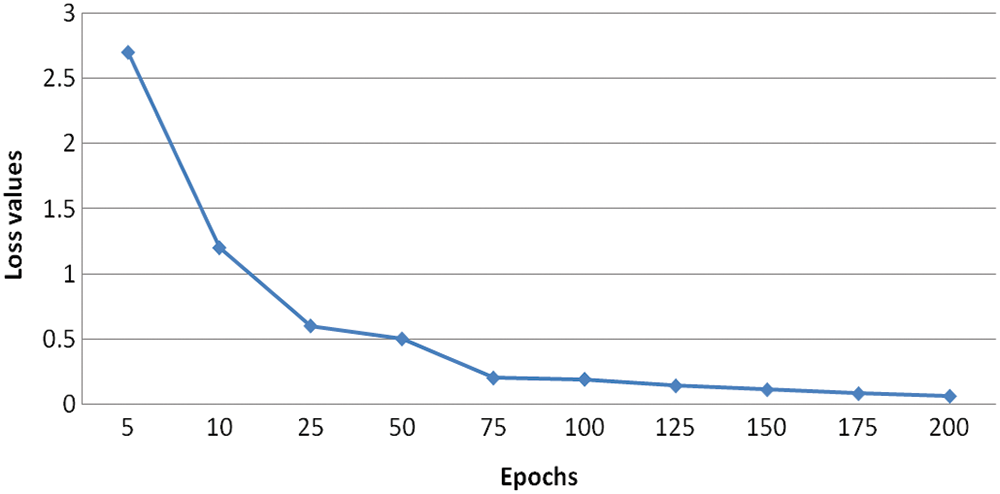
Figure 10: Loss of training dataset
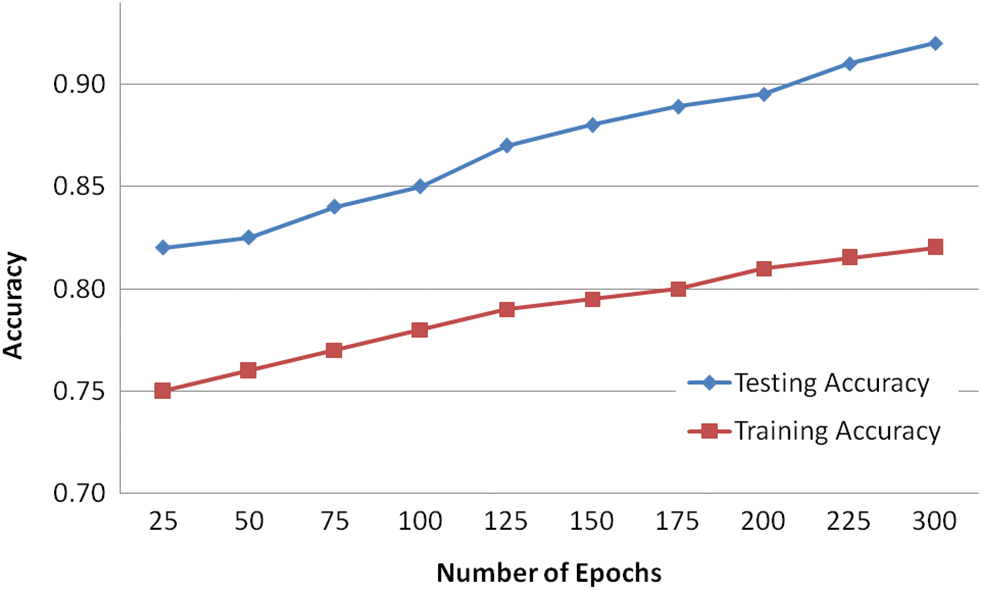
Figure 11: Overall accuracy
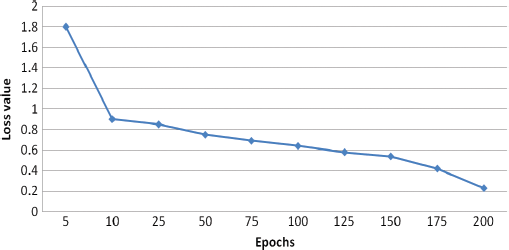
Figure 12: Loss value
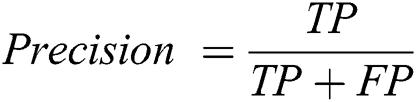
Precision is a measure that tells us what proportion of patients that we diagnosed are having retinopathy, actually had retinopathy. The predicted positives and the people actually having retinopathy are TP. The computation of Precision is demonstrated in Eq. (9).
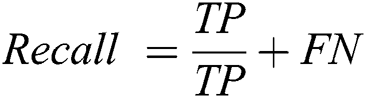
The recall is a measure that tells us what proportion of patients that actually had retinopathy was diagnosed by the algorithm as having retinopathy. The actual positives and the people diagnosed by the model having retinopathy are TP. The Recall is computed using Eq. (10).
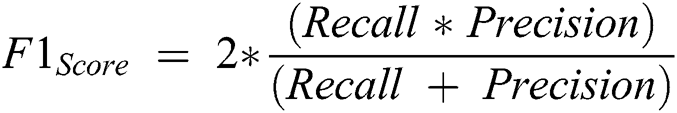
 is computed with the weighted average values of precision and recall parameters. Additionally, these parameters combine false positive and negative values. It is also used to identify the accuracy level within every class distribution. Accuracy is computed with similar values of false positives and negatives. It is computed using Eq. (11).
The precision value is measured that the proportion of the diagnosed Retinopathy from the input images. The results proved that the proposed method has an improved amount of percentage compared with the other models. The Recall is computed using the exact positive values for the actual diabetic Retinopathy.  is computed based on the weighted average of precision and recall metrics and the false positives and negative values are identified. The accuracy is computed based on the parameters of precision, recall and
  . The performance results showed that the proposed methodology is performed better. The Exploratory Data Analysis is computed based on the binary classification. The total amount of count is improved in every level. The loss of training dataset is reduced whenever the Epochs are increased, the overall accuracy of the Testing and Training are also measured in the total amount of Epochs. Another metric used to compare the methods is the iteration count in the training whenever the model has achieved a full accuracy level. The number of batches for validation and testing accuracy for the proposed methodology is 94.33% and 88.32%, respectively. The final metric used to compare the methods are the inclusion of the dropout layer within the Softmax classifier layer for validating the accuracy. The proposed methodology has achieved better performance compared to other methodologies. The results proved that the proposed methodology has improved performance compared to the performance metrics of Accuracy, Precision, Recall, Specificity and
  which are demonstrated in Fig. 13.
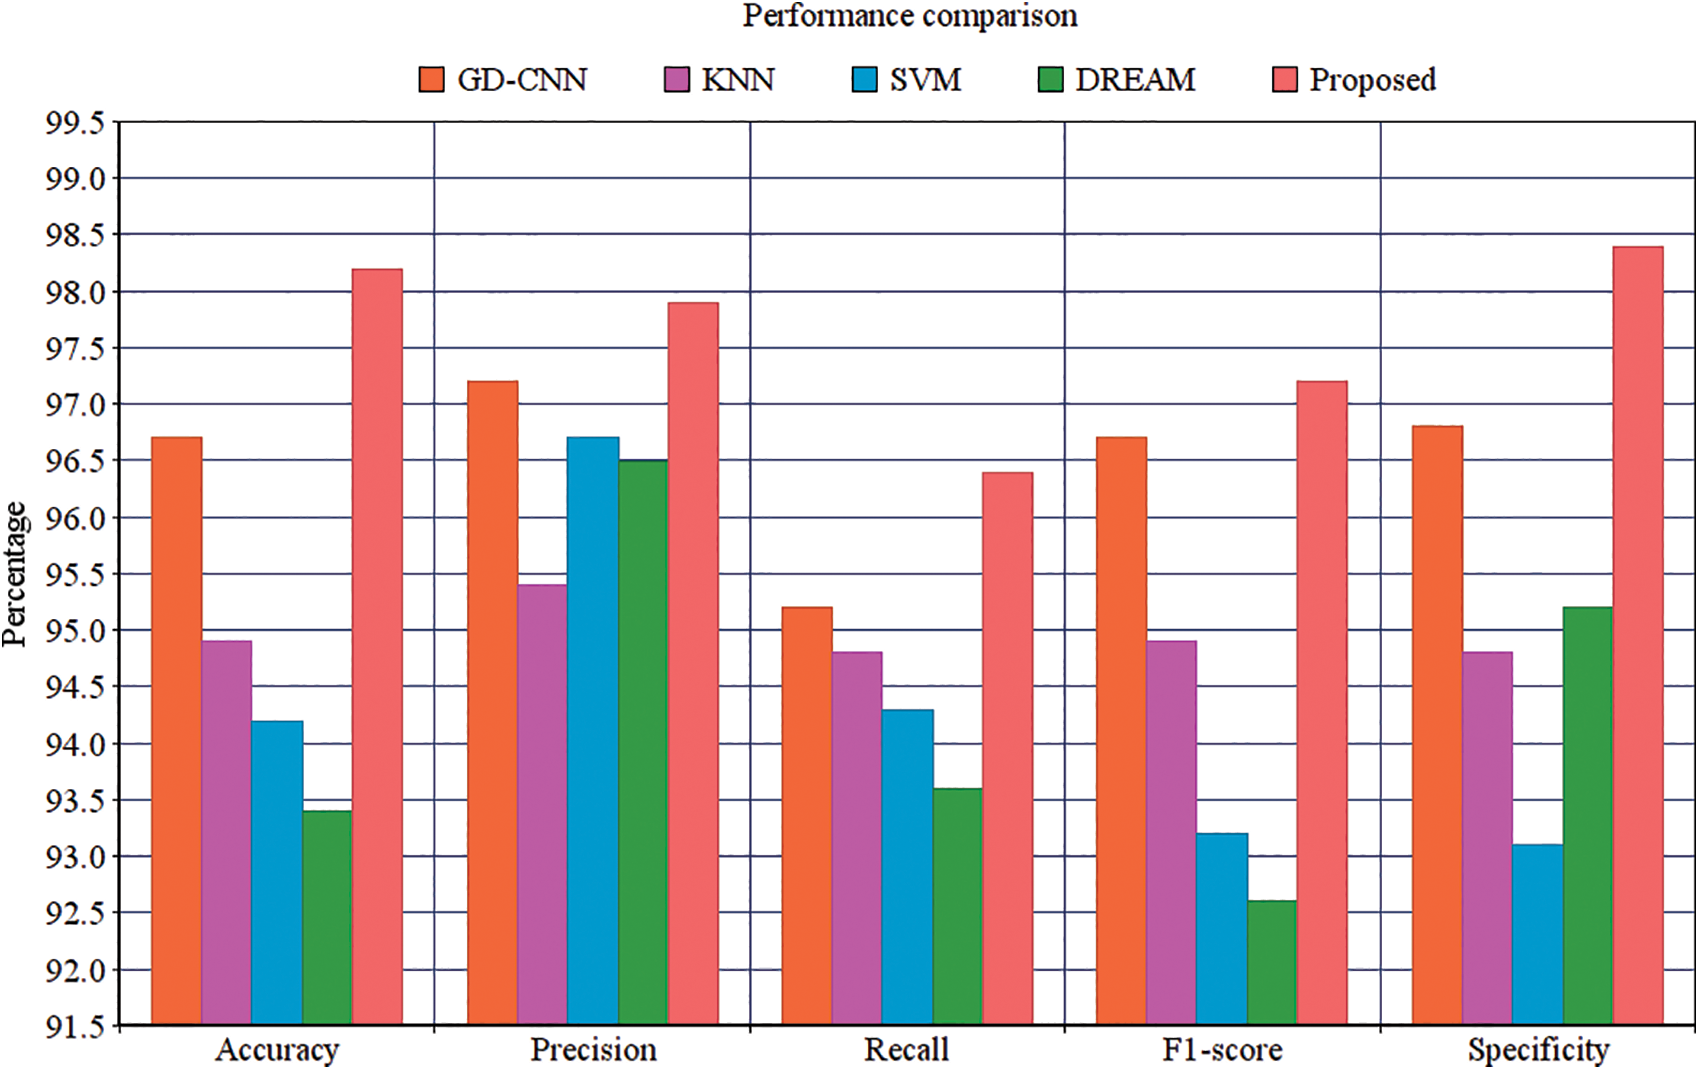
Figure 13: Performance comparison
It suggests that the proposed methodology has the improved Specificity compared with the related methods. The proposed Convolutional Neural Networks are constructed to compute the semantic data within the adjacent pixels. The proposed method is having the enhanced amount of quicker processing. It can process the large amount of training data for identifying the diabetic retinopathy. The hyper parameter tuning is successfully performed in every input image. The activation maps are organized with filter value. The rectangle is framed for every single patches, the input image is used to filter passes. A fully connected layer is developed to produce the output with every single node. The proposed method can extract the features automatically from the images and also the pre-trained function is not compulsory for classification. The classification is completed according to the clinical observations identified by the pathologic neovascularisation that the features of visibility using the proposed technique have enhanced the detection like retinal function using neural functions.
Practically, a medical expert can recognize diabetic retinopathy by the occurrence of lesions correlated with the vascular abnormalities instigated. This methodology is efficient, but its resource anxiety is tremendous. In this work, we propose a new model that uses the Convolutional Neural Network (CNN) to increase the accuracy of intelligent retinopathy prediction. It is utilized to analyze the pathogenesis to detect diabetic retinopathy. Experiments suggested better performance of the new model. The research work will be continually progressing. Instigating novel techniques, we expect to raise the accuracy of the technique as well as to enlarge it to different types of retinopathy and other eye diseases. We will be trying to use this model for more massive data sets. Other deep learning techniques will also be used in this paper. In Future, Enlargement of a neural model centered on detection principles and capability of the meticulous discovery of restrained lesions, just like specialists do, will be achieved.
Credit authorship statement: G. Arun Sampaul Thomas: Writing-original draft, Writing-review & editing, Y.Harold Robinson: Writing-original draft, Conceptualization, Data curation, Validation. E. Golden Julie: Writing-original draft, Conceptualization, Data curation, Validation.Vimal shanmuganathan: Conceptualization, Formal analysis, Writing-review & editing, Supervision. Seungmin Rho: Formal analysis, Supervision. Formal analysis, Writing-review & editing, Yunyoung Nam: Formal analysis, Supervision. Formal analysis, Writing-review & editing and funding.
Funding Statement: This research was supported by the MSIT(Ministry of Science and ICT), Korea, under the ICAN(ICT Challenge and Advanced Network of HRD) program(IITP-2020-0-01832) supervised by the IITP(Institute of Information & Communications Technology Planning & Evaluation) and the Soonchunhyang University Research Fund.
Conflicts of Interest: The authors declare that they have no conflicts of interest to report regarding the present study.
1. N. H. White, W. Sun, P. A. Cleary, W. V. Tamborlane, R. P. Danis et al. (2010). , “Effect of prior intensive therapy in type 1 diabetes on 10-year progression of retinopathy in the DCCT/EDIC: Comparison of Adults and Adolescents,” Diabetes, vol. 59, no. 5, pp. 1244–1253. [Google Scholar]
2. R. Klein and Klein Bek. (1995). Vision Disorders in Diabetes. Diabetes in America, Chapter 14, 2nd edition, pp. 293–338. [Google Scholar]
3. X. Zhang, Z. Li and C. C. Loy. (2017). “PolyNet: A pursuit of structural diversity in very deep networks,” in Proc. of the IEEE Conf. on Computer Vision and Pattern Recognition, Honolulu, HI, USA, pp. 3900–3908. [Google Scholar]
4. M. R. K. Mookiah, U. R. Acharya, H. Fujita, J. E. W. Koh, J. H. Tan et al. (2015). , “Local configuration pattern features for age-related macular degeneration characterization and classification,” Computers in Biology and Medicine, vol. 63, pp. 208–218. [Google Scholar]
5. V. Gulshan, L. Peng, M. Coram, M. C. Stumpe, D. Wu et al. (2016). , “Development and validation of a deep learning algorithm for detection of diabetic retinopathy in retinal fundus photographs,” JAMA, vol. 316, no. 22, pp. 2402–2410. [Google Scholar]
6. P. Burlina, K. D. Pacheco, N. Joshi, D. E. Freund, N. M. Bressler et al. (2017). , “Comparing humans and deep learning performance for grading AMD: A study in using universal deep features and transfer learning for automated AMD analysis,” Computers in Biology and Medicine, vol. 82, no. 3, pp. 80–86. [Google Scholar]
7. Z. Zhou, J. Shin, L. Zhang, S. Gurudu, M. Gotway et al.. (2017). , “Fine-tuning convolutional neural networks for biomedical image analysis: Actively and incrementally,” in Proc. of IEEE Conf. on Computer Vision and Pattern Recognition, Honolulu, HI, USA, pp. 4761–4772. [Google Scholar]
8. Z. Zhang, Y. Xie, F. Xing, M. McGough and L. Yang. (2017). “MDNet: a semantically and visually interpretable medical image diagnosis network,” in Proc. of IEEE Conf. on Computer Vision and Pattern Recognition, Honolulu, HI, USA, pp. 3549–3557. [Google Scholar]
9. D. Xiao, S. Yu, J. Vignarajan, D. An, M. Tay-Kearney and Y. Kanagasingam. (2017). “Retinal hemorrhage detection by rule-based and machine learning approach,” in Proc. of 39th Annual Int. Conf. of the IEEE Engineering in Medicine and Biology Society, Seogwipo, South Korea, pp. 660–663. [Google Scholar]
10. J. I. Orlando, E. Prokofyeva, M. D. Fresno and M. B. Blaschko. (2018). “An ensemble deep learning based approach for red lesion detection in fundus images,” Computer Methods and Programs in Biomedicine, vol. 153, pp. 115–127. [Google Scholar]
11. H. Ra, J. H. Park, J. U. Baek and J. Baek. (2020). “Relationships among retinal nonperfusion, neovascularization, and vascular endothelial growth factor levels in quiescent proliferative diabetic retinopathy,” Journal of Clinical Medicine, vol. 9, no. 5, pp. 1450–1462. [Google Scholar]
12. D. S. W. Ting, C. Y. Cheung, G. Lim, G. S. W. Tan, N. D. Quang et al. (2017). , “Development and validation of a deep learning system for diabetic retinopathy and related eye diseases using retinal images from multiethnic populations with diabetes,” JAMA, vol. 318, no. 22, pp. 2211–2223. [Google Scholar]
13. A. Krizhevsky, I. Sutskever and G. E. Hinton. (2012). “Imagenet classification with deep convolutional neural networks,” in Proc. of 26th Annual Conf. on Neural Information Processing Systems, Lake Tahoe, Nevada, USA, pp. 1097–105. [Google Scholar]
14. G. Huang, Z. Liu, L. Van De Maaten and K. Q. Weinberger. (2017). “Densely connected convolutional networks,” in Proc. of the IEEE Conf. on Computer Vision and Pattern Recognition, Honolulu, HI, USA, pp. 2261–2269. [Google Scholar]
15. A. Joly, H. Goëau, H. Glotin, C. Spampinato, P. Bonnet et al.,. (2015). “Multimedia life species identification challenges,” in Experimental IR Meets Multi-Linguality, Multimodality, and Interaction. Lecture Notes in Computer Science, J. Mothe, J. Savoy, J. Kamps, K. Pinel-Sauvagnat, G. Jones, E. San Juan, L. Capellato, N. Ferro, Cham: Springer. [Google Scholar]
16. N. E. Khalifa, M. H. Taha, A. E. Hassanien and I. Selim. (2018). “Deep galaxy v2: Robust deep convolutional neural networks for galaxy morphology classifications,” in IEEE Int. Conf. on Computing Sciences and Engineering, pp. 122–127. [Google Scholar]
17. S. Xie, R. Girshick and P. Dollár. (2017). “Aggregated residual transformations for deep neural networks,” in Proc. of the IEEE Conf. on Computer Vision and Pattern Recognition, Honolulu, HI, USA, pp. 5987–5995. [Google Scholar]
18. J. Hu, L. Shen and G. Sun. (2018). “Squeeze-and-excitation networks,” in Proc. of the IEEE Conf. on Computer Vision and Pattern Recognition, Salt Lake City, UT, USA, pp. 7132–7141. [Google Scholar]
19. Y.-P. Liu, Z. Li, C. Xu, J. Li and R. Liang. (2019). “Referable diabetic retinopathy identification from eye fundus images with weighted path for convolutional neural network,” Artificial Intelligence in Medicine, vol. 99, 101694. [Google Scholar]
20. M. Lin, Q. Chen and S. Yan, “Network in network.” [Online]. Available: http://arxiv.org/abs/1312.4400. [Google Scholar]
21. P. Costa, A. Galdran, A. Smailagic and A. Campilho. (2018). “A weakly supervised framework for interpretable diabetic retinopathy detection on retinal images,” in IEEE—Advanced Signal Proc. Methods in Medical Imaging, pp. 18747–18758. [Google Scholar]
22. K. M. Adal, P. G. Van Elten, J. P. Martinez, K. W. Rouwen, K. A. Vermeer et al. (2017). , “An automated system for the detection and classification of retinal changes due to red lesions in fundus images,” IEEE Transactions on Biomedical Engineering, vol. 65, no. 6, pp. 1382–1390. [Google Scholar]
23. S. Wang, Y. Yin, G. Cao, B. Wei, Y. Zheng et al. (2014). , “Hierarchical retinal blood vessel segmentation based on feature and ensemble learning,” Neurocomputing, vol. 149, pp. 708–717. [Google Scholar]
24. M. Haloi. (2015). “Improved microaneurysm detection using Deep Neural Networks.” Cornel University Library. arXiv: 1505. 04424. [Google Scholar]
25. M. Melinscak, P. Prentasic and S. Loncaric. (2015). “Retinal vessel segmentation using deep neural networks,” VISAPP, vol. 1, pp. 577–582. [Google Scholar]
26. L. Luo, D. Xue and X. Feng. (2020). “Automatic diabetic retinopathy grading via self-knowledge distillation,” Electronics, vol. 9, no. 9, pp. 1327–1337. [Google Scholar]
27. J. Lachure, A. V. Deorankar, S. Lachure, S. Gupta and R. Jadhav. (2015). “Diabetic retinopathy using morphological operations and machine learning,” in IEEE Int. Advance Computing Conf., Bangalore, India. [Google Scholar]
28. R. Priya and P. Aruna. (2012). “SVM and neural network based diagnosis of diabetic retinpathy,” International Journal of Computer Applications, vol. 41, no. 1, pp. 6–12. [Google Scholar]
29. S. Giraddi, J. Pujari and S. Seeri. (2015). “Identifying abnormalities in the retinal images using SVM classifiers,” International Journal of Computer Applications, vol. 111, no. 6, pp. 5–8. [Google Scholar]
30. D. Carlos, G. Pedronette, Y. Weng, A. Baldassin and C. Hou. (2019). “Semi-supervised and active learning through manifold reciprocal kNN graph for image retrieval,” Neurocomputing, vol. 340, no. 7, pp. 19–31. [Google Scholar]
31. H. Li, K. M. Lam and M. Wang. (2019). “Image super-resolution via feature-augmented random forest,” Signal Processing: Image Communication, vol. 72, pp. 25–34. [Google Scholar]
32. J. Cao, S. Wang, R. Wang, X. Zhang and S. Kwong. (2019). “Content-oriented image quality assessment with multi-label SVM classifier,” Signal Processing: Image Communication, vol. 78, pp. 388–397. [Google Scholar]
33. L. Jiang, L. Zhang, L. Yu and D. Wang. (2019). “Class-specific attribute weighted naive Bayes,” Pattern Recognition, vol. 88, pp. 321–330. [Google Scholar]
34. V. Gulshan, L. Peng, M. Coram, M. C. Stumpe and D. Wu. (2016). “Development and validation of a deep learning algorithm for detection of diabetic retinopathy in retinal fundus photographs,” Jama, vol. 316, no. 22, pp. 2402–2410. [Google Scholar]
35. R. Gargeya and T. Leng. (2017). “Automated identification of diabetic retinopathy using deep learning,” Ophthalmology, vol. 124, no. 7, pp. 962–969. [Google Scholar]
36. L. S. Lim, E. Lamoureux, S. M. Saw, W. T. Tay, P. Mitchell et al. (2010). , “Are myopic eyes less likely to have diabetic retinopathy?,” Ophthalmology, vol. 117, no. 3, pp. 524–530. [Google Scholar]
37. N. Baniasadi, M. Wang, H. Wang, M. Mahd and T. Elze. (2017). “Associations between optic nerve head-related anatomical parameters and refractive error over the full range of glaucoma severity,” Translational Vision Science & Technology, vol. 6, no. 4, pp. 9–19. [Google Scholar]
38. M. Wang, Q. Jin, H. Wang, D. Li, N. Baniasadi et al.,. (2018). “The interrelationship between refractive error, blood vessel anatomy, and glaucomatous visual field loss,” Translational Vision Science & Technology, vol. 7, no. 1, pp. 1–11. [Google Scholar]
39. H. Liu, L. Li, I. Michael Wormstone, C. Qiao, C. Zhang et al. (2019). , “Development and validation of a deep learning system to detect glaucomatous optic neuropathy using fundus photographs,” JAMA Ophthalmology, pp. 1–8. [Google Scholar]
40. R. Murugan, P. Roy and U. Singh. (2020). “An abnormality detection of retinal fundus images by deep convolutional neural networks,” Multimedia Tools and Applications, vol. 79, no. 33–34, pp. 24949–24967. [Google Scholar]
41. D. Devarajan, S. M. Ramesh and B. Gomathy. (2020). “A metaheuristic segmentation framework for detection of retinal disorders from fundus images using a hybrid ant colony optimization,” Soft Computing, vol. 24, no. 17, pp. 13347–13356. [Google Scholar]
42. Kaggle. Diabetic Retinopathy Detection. 2015. [Online]. Available: https://www.kaggle.com/c/diabetic-retinopathy-detection/data. [Google Scholar]
43. S. Roychowdhury, D. D. Koozekanani and K. K. Parhi. (2014). “DREAM: diabetic retinopathy analysis using machine learning,” IEEE Journal of Biomedical and Health Informatics, vol. 18, no. 5, pp. 1717–1728. [Google Scholar]
 | This work is licensed under a Creative Commons Attribution 4.0 International License, which permits unrestricted use, distribution, and reproduction in any medium, provided the original work is properly cited. |