DOI:10.32604/cmc.2020.013251
| Computers, Materials & Continua DOI:10.32604/cmc.2020.013251 | |
| Article |
An IoT-Cloud Based Intelligent Computer-Aided Diagnosis of Diabetic Retinopathy Stage Classification Using Deep Learning Approach
1Department of Computer Applications, Alagappa University, Karaikudi, 630001, India
2Faculty of Computers and Information, Mansoura University, Mansoura, 35516, Egypt
3Department of Project Management, Ho Chi Minh City Open University, Ho Chi Minh City, 7000000, Vietnam
*Corresponding Author: K. Shankar. Email: drkshankar@ieee.org
Received: 31 July 2020; Accepted: 11 September 2020
Abstract: Diabetic retinopathy (DR) is a disease with an increasing prevalence and the major reason for blindness among working-age population. The possibility of severe vision loss can be extensively reduced by timely diagnosis and treatment. An automated screening for DR has been identified as an effective method for early DR detection, which can decrease the workload associated to manual grading as well as save diagnosis costs and time. Several studies have been carried out to develop automated detection and classification models for DR. This paper presents a new IoT and cloud-based deep learning for healthcare diagnosis of Diabetic Retinopathy (DR). The proposed model incorporates different processes namely data collection, preprocessing, segmentation, feature extraction and classification. At first, the IoT-based data collection process takes place where the patient wears a head mounted camera to capture the retinal fundus image and send to cloud server. Then, the contrast level of the input DR image gets increased in the preprocessing stage using Contrast Limited Adaptive Histogram Equalization (CLAHE) model. Next, the preprocessed image is segmented using Adaptive Spatial Kernel distance measure-based Fuzzy C-Means clustering (ASKFCM) model. Afterwards, deep Convolution Neural Network (CNN) based Inception v4 model is applied as a feature extractor and the resulting feature vectors undergo classification in line with the Gaussian Naive Bayes (GNB) model. The proposed model was tested using a benchmark DR MESSIDOR image dataset and the obtained results showcased superior performance of the proposed model over other such models compared in the study.
Keywords: Deep learning; classification; Gaussian Naive Bayes; feature extraction; diabetic retinopathy
Internet of Things (IoT) refers to the practice of designing and molding Internet-connected Things through computer networks. The term ‘IoT’ signifies that instead of using smaller effective gadgets like laptop, tablet as well as smart phone, it is better to use a number of minimum efficient devices namely, wrist band, AC, umbrella, fridge and so forth. In this scenario, ‘Ubiquitous computing’ differs from IoT including a factor that IoT is established over a wider application of online connections. Further, the word ‘Thing’ refers to objects that exist in real-time applications and receive inputs from humans. It then converts the obtained data to Internet in order to perform data collection as well as computing tasks [1]. Here, IoT as well as Cloud Computing (CC) are given equal weightage while combining the above methodologies. The surveillance system has been designed by combining these two methods so as to monitor patients’ details in an effective manner even from remote site which remains helpful for doctors.
IoT model often supports CC to improve the function with respect to higher resource application, memory, power as well as computational ability. Furthermore, CC gains benefit from IoT by increasing its scope to manage real-world applications and to offer multiple services in the form of dynamic as well as distributed manner. The IoT-based CC would be expanded for developing new facilities and applications in a modern platform.
Here, Diabetic Retinopathy (DR) is considered as the major reason for blindness even for people under the age group of 18–25 years [2]. DR is one of the fatal complications that affect diabetic patients. Being a complicated disease, DR cannot be recovered at the initial stages whereas diagnosis at the primary stage is a mandatory one. But, it brings a notable complexity to the entire health care department in the form of less availability of expert physicians while it affects a lot of patients. Another crucial factor associated in the prediction of DR is Optic Disc (OD) that undergoes characterization under the application of increased contrast among circular-shaped areas [3]. Here, OD is employed as a benchmark as well as a frame that is used to diagnose critical eye diseases like glaucoma, and to verify the emergence of neovascularization at OD. In addition, it has been applied to highlight the alternate structures like fovea. In normal retina, the edge of the OD is clear and well-defined. Thus, it tends to develop automatic diagnostic system that helps in the primary detection of DR.
Multiple techniques and hand-engineered features have been proposed to overcome the challenges involved in efficient analysis of DR area in retinal fundus images. The hand-engineered features are often applied along with conventional Machine Learning (ML) models and it remains helpful in the diagnosis of DR functions. Various surveys have resulted in the application of classical techniques [4–7]. In the recent times, the presence of massive datasets as well as enormous computation are provided by the deployment of Graphics Processing Units (GPUs) which motivate on modeling the Deep Learning (DL) models. It displays a remarkable process in different computer vision operations as well as it also earned the desired success when compared with conventional hand-engineered-relied frameworks. Several DL-based techniques are designed to examine the retinal fundus images and to develop automated Computer-Aided Diagnosis (CAD) models for DR [8–22].
A novel technology was designed in the literature [8] to determine the disease intensity under cloud and IoT applications. This technique was applied to predict the seriousness of the illness. The above technology was deployed to take unique care of student’s and children’s health. In this study, a programmatic health information, termed as student data, was created with the help of reputed UCI Repository as well as sensors employed in medical domain. This was deployed also to forecast diverse ailments which have been influenced by student with severity. Followed by, several other classification models were applied to predict different types of diseases. The major application of this algorithm is the determination of prediction accuracy using few attributes like F-measure, specificity as well as sensitivity. Consequently, it is evident that the presented technique outperformed with respect to prediction accuracy when compared with previous methodologies.
A review on CC and IoT methods was performed in the literature [9] along with a focus on security problems. Furthermore, a list was also developed for the involvement of cloud with IoT. At last, it inferred that the involvement of CC in processing IoT improvises the functions. A new multi-layer cloud method was modelled in the study [10] to enable efficient and logical communications across the identical services offered by several vendors in modern home. As an inclusion, ontology was employed to solve the heterogeneity problem that is projected in a layered cloud environment. Further, it is also helpful in addressing the data representation, knowledge as well as heterogeneity, and labelled security model used in ontology to support security as well as privacy conservation while processing the interoperation.
A scalable and novel three tier structure was proposed in the study [11] to record more amount of sensor information. Initially, Tier-1 takes care of the data collection while the Tier-2 focuses on storing the collected sensor data in CC. Finally, a new predictive method was deployed to detect the heart diseases. An effective intelligence method in car camera surveillance was presented in Chen et al. [12] which leveraged mobile CC technique. It is able to predict the things present in videos at the time of driving and decides the selective portion of videos which has to be saved in cloud to record the local storage space of a system. This method consists of data gathering, recognition and training stages. Consequently, the above model achieved the best prediction performance.
A novel cloud-dependent parallel ML technique was proposed by the researchers [13] for the purpose of machinery prognostics. Random Forest (RF) classifier method was used that is generally preferred in dry milling processes. Furthermore, a similar RF technique was deployed by applying MapReduce and was employed on Amazon Cloud. From the study results, it can be inferred that the RF classification model is capable of providing accurate predictive results. Ghulam Muhammad et al. [14] conducted a study to observe the voice pathology of human beings under cloud and IoT applications. This paper revealed the possibility of presented voice pathology. Furthermore, a novel local binary pattern relied detection system was projected to forecast the voice pathology inside the observing technique. Hence, the predicting system attained the best classification accuracy when compared with previous alternate methods.
An internet-based observation method named ‘Healthcare Industrial IoT’ was proposed in the study [15], which is mainly applied to monitor the health. The proposed method had the potential of examining the patients’ health details to avoid fatal incidents. Therefore, it gathered the essential details of the patients using sensors as well as medical facilities. But, the proposed method was integrated to eliminate clinical errors whereas different similarities were found by applying security rules like watermarking as well as signal improvements. A smart and collaborative security technique was proposed in Islam et al. [16] to reduce the risk factors present in IoT-based healthcare platform. Additionally, the proposed technique was defined with advanced techniques in IoT healthcare. A specific investigation was conducted to provide an overview of state-of-the-art network environment, applications as well as commercial increments in IoT-relied healthcare solutions.
A modern clinical analysis system known to be neuro-fuzzy temporal data presentation method was presented in the previous study [17] to detect and diagnose diverse types of deadly diseases. Kakria et al. [18] employed a novel online health care observation technology to monitor the remote heart patients often using mobile phones and wearable sensors. Subsequently, Kim et al. [19] established a technique to monitor the emergency scenario under the application of content of motion tracking disease patients. Some other models are also found in Jebaseeli et al. [20]. Roychowdhury et al. [21] developed a new DREAM: Diabetic Retinopathy Analysis Using Machine Learning model which investigates the fundus images with varying illumination and fields of view. The severity level of DR can be generated by the use of ML models such as Gaussian Mixture model (GMM), k-nearest neighbor (kNN), support vector machine (SVM), and AdaBoost. Among the classifiers, GMM and kNN are found to be effective while classifying bright and red lesions respectively. Adal et al. [22] has developed a robust and flexible method to automatically detect the longitudinal retinal modifications because of small red lesions through the utilization of the normalized fundus images. It reduces the illumination differences and enhances the contrast level of small retinal features. DR related variations are then detected depending upon the diverse intensity and shape features using SVM model.
Though several works have been carried out to diagnose the disease remotely using IoT and cloud platform, there is still a need to develop effective models to diagnose DR. The contribution of the study is given here. This study introduces a new IoT and cloud-based DL model for healthcare diagnosis of DR. The proposed model incorporates different processes namely data collection, preprocessing, segmentation, feature extraction and classification. First, an IoT-based data collection process where an IoT head mounted camera (IoT headset) is used to capture the fundus image. In the preprocessing stage, the contrast level gets improved using the Contrast Limited Adaptive Histogram Equalization (CLAHE) model. Next, the preprocessed image is segmented using Adaptive Spatial Kernel distance measure based Fuzzy c-means clustering (ASKFCM) model. Afterwards, the deep Convolution Neural Network (CNN) based Inception v4 model is applied as a feature extractor and the resultant feature vectors undergo classification in line with the Gaussian Naïve Bayes (GNB) model. The proposed model was tested using a benchmark DR image dataset and the obtained results showcased the superior performance of the proposed model over other compared methods.
The rest of the sections are arranged as follows. Section 2 details the proposed model in a clear way. Section 3 deals with the simulation analysis while the Section 4 draws the conclusion.
The overall process of the proposed work is shown in the Fig. 1. The proposed work operates on mainly three layers such as data link, transport and application layer. The data collection process takes place at the transport layer.
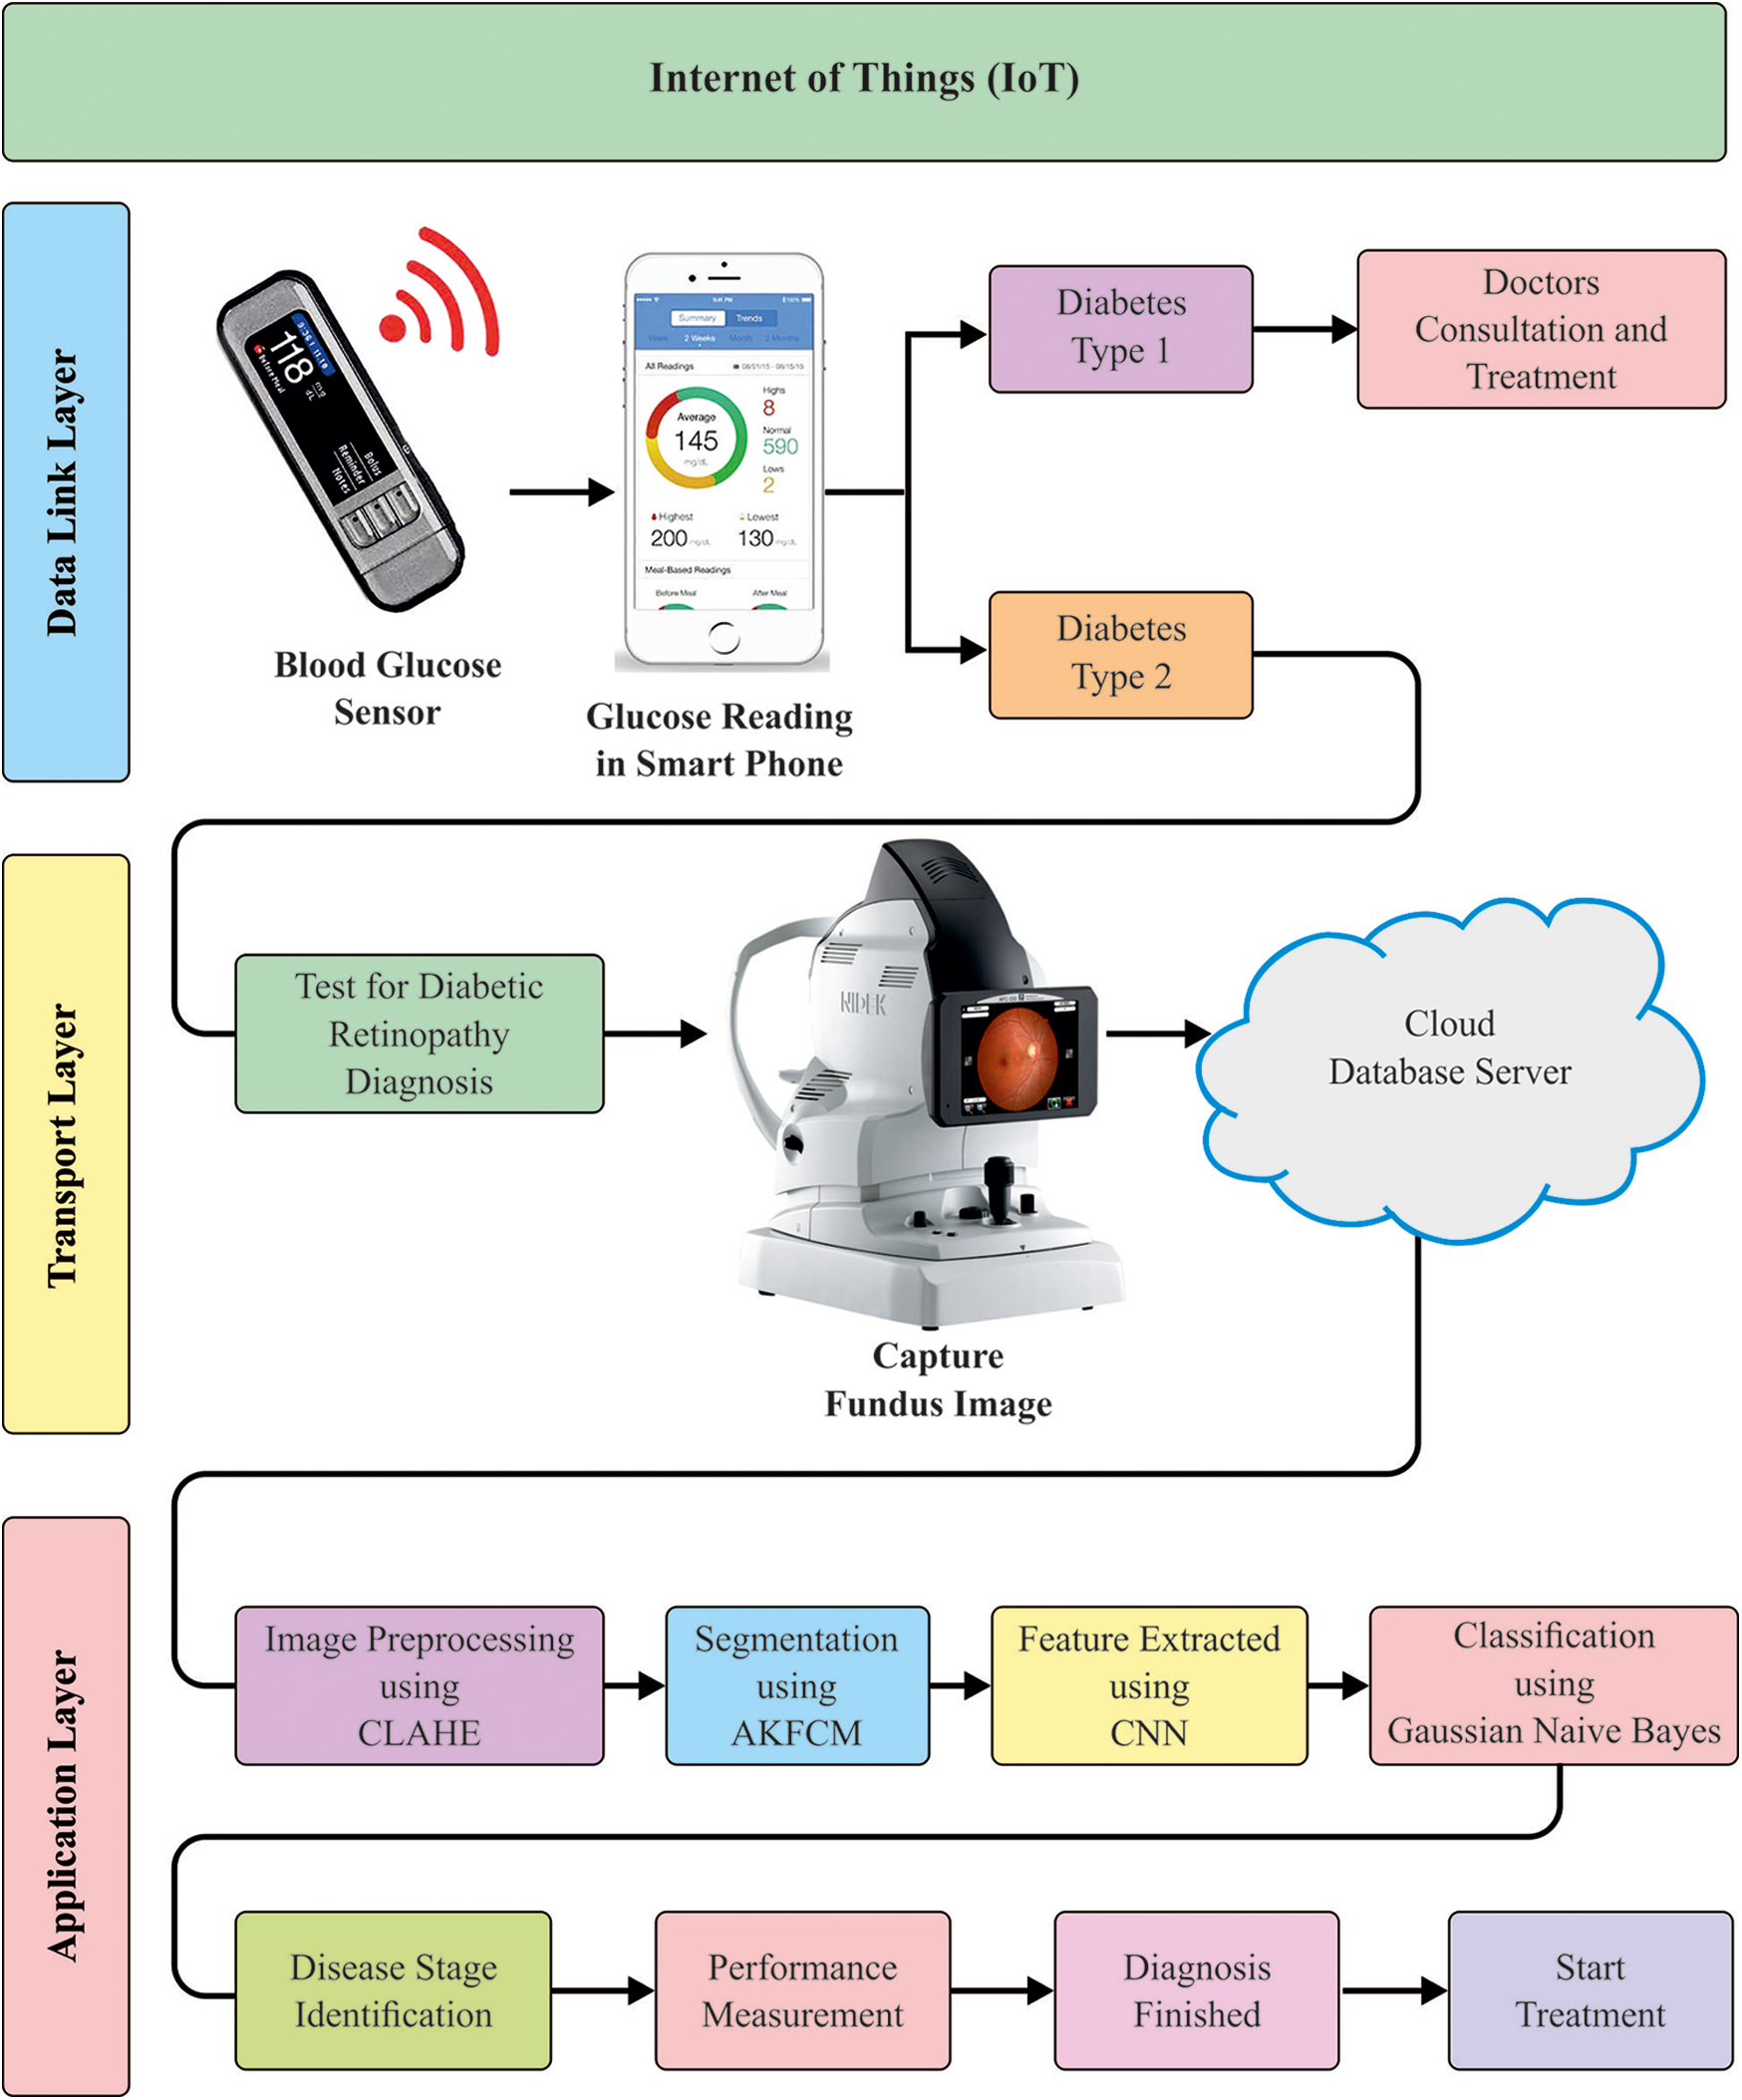
Figure 1: The overall process of the proposed model
At first, the patient utilizes the blood glucose sensor to measure the glucose level present in the blood. It is connected to a smart phone which easily classifies whether the patient suffers from Type I diabetes or Type II diabetes. When the patient has been diagnosed with Type I diabetes, the patient is then recommended to consult a doctor and undergo treatment. In other case, i.e., if the patient suffers from Type II diabetes, the diagnosis for DR is done. In the diagnosis process, the fundus image is captured using IoT enabled head mounted camera. It provides easier and fast access to DR remote screening and decrease the drawbacks of classical eye examination. At the same time, the proposed disease diagnosis model also gets executed in the cloud and the corresponding outcome, i.e., whether the patient suffers from DR or not, is provided to the user as output.
The external as well as working processes of effective IoT network have three layers such as data link layer, network layer and application layer.
1) Data link layer
Initially, the data link layer is composed of fundus images dataset, which are derived from patient details. It is mainly used for analysis with the help of transport layer. In order to test this methodology, MESSIDOR DR Dataset is applied. It includes a set of approximately 1,200 color fundus images with annotations in Excel file.
2) Network/Transport/Communication layer
Here, a cloud Server network is presented to host the applications. This layer can be used to transmit the data among the tools as well as to reduce the delay time. Further, it also allows the user to monitor the patient’s details which are recorded in databases.
3) Application layer
This layer comprises a Graphical User Interface (GUI) including DR application that has been combined with Python Programming in order to determine the fundus images. The application layer enables the patients to upload fundus images for analysis [20]. Hence, the GUI application consists of the actual disease diagnosis model which is explained in the following subsections.
2.2 CLAHE-Based Pre-Processing
CLAHE model is highly efficient in biomedical image analysis and is primarily used to improve the contrast level of the image. This technique requires a set of two input variables namely, dimension of a sub window and clip limit. In this process, the CLAHE model identifies the grid size of a window and the grid values are also found from an uppermost left corner area of the image where the computation begins from initial index of a window. Then, the size of the region  and clip limitsare calculated from a generalized value of the image. For all grid points, the histogram of region
  around the images is determined. Later, the histogram which is present beyond the level of evaluated clip limits is clipped and the Cumulative Distributive Function (CDF) is estimated. The CDF is estimated for pixel along with the values derived from 0 to 255. Later, for every pixel, the four nearest neighboring grid points have to be found. By applying the intensity rate, i.e., the pixel index as well as the mapping functions of the four grid points, CDF measures are measured. Subsequently, the contextual pixel N and the newly created pixel are interpolated. The same process is followed by transmitting the window to image. Though the process is terminated, it still attains the final index of a window. CLAHE technique cannot save the histogram that outstrips the clip limit; however, it can reorganize in an equal manner for all the histogram bins. Therefore, the projected CLAHE model improves the segmentation outcome of the fundus image.
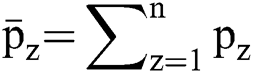
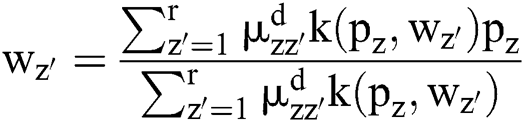
The developed ASKFCM framework employs kernel technology to manipulate a spatial neighborhood data. It constructs the patterns of feature space for a simple clustering as it amplifies the conversion of patterns to feature space. Thus, ‘n’ data point of an input image, including D dimension, is denoted in terms of  . Moreover, the first batch of the cluster centres are presented with respect to
  is assumed to be the degree of fuzzy membership function of
  , d manages the size of clustering fuzziness as well as it weighs the exponential factor of fuzzy membership function,
 is considered to be a neighbourhood pixel data and
  implies the adjacent pixel mean which is derived from
  . It can be defined by
The objective function of a Gaussian FCM (GFCM) can be represented as

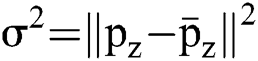
The Gaussian kernel distance can be elucidated by,
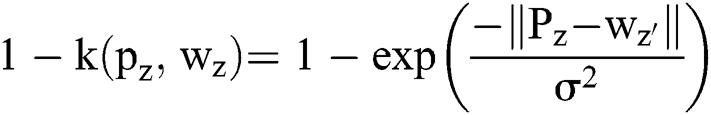
 refers to the SD of the dispersing attribute.
Substituting the Euclidean distance  in Eq. (2) with the application of Gaussian kernel distance in Eq. (5), it can be presented as
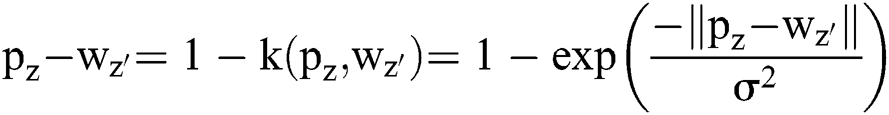
The objective function of Gaussian Kernel distance value based FCM (GKFCM) is,

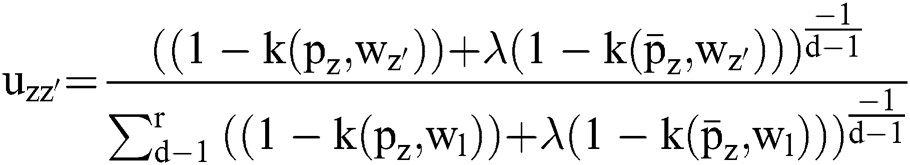
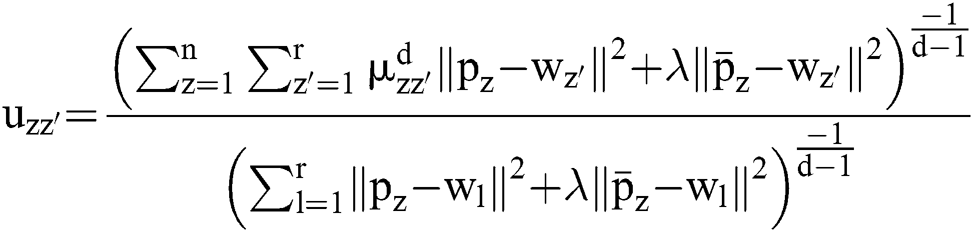
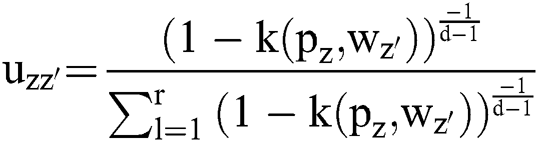
The divided retinal blood vessel image is presented in feature space. FCM helps to arrange and combine the relevant data points as clusters, which results in gradual minimization of cost function since it is based on the pixels’ distance of cluster centres in feature space. In case of a non-linear map,  signifies that the data points pointed in a feature dimension space are converted to greater dimensional feature space. A spatial function joins the spatial membership functions of an adjacent pixel. Therefore, it replaces the kernels of membership function presented in the Eqs. (11) and (8).

In the Eq. (11),  represents the non-linear type of mapping data to feature space that exist in kernel
  , where
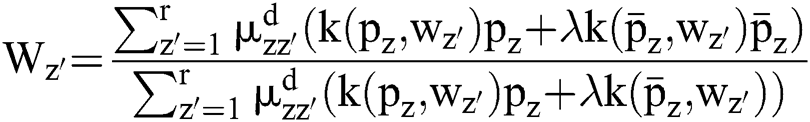
 Then, the objective function of the reduced SGKFCM can be defined by

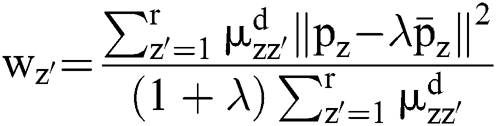
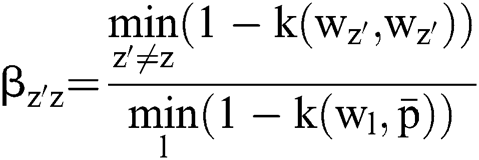
Any pixel present in the nearby image consists of same feature data that has been connected with maximum possibility. Thus, the spatial correlation of nearby pixel is an imperative feature of dense application at the time of segmenting images. Also, the variable  influences the clustering outcome. An alternate parameter
 manages the adjacent pixels cluster as well as it eliminates the dissimilar effect when the segmentation is being carried out. When the dataset of a cluster is high, then the
  value would be maximum. The robustness of cluster centre could be computed using
 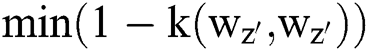 and
and 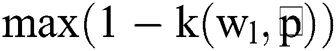 notations. Therefore, the objective function of bias has been modelled and reduced under the application of ASKFCM. Hence, the objective function can be expressed as,

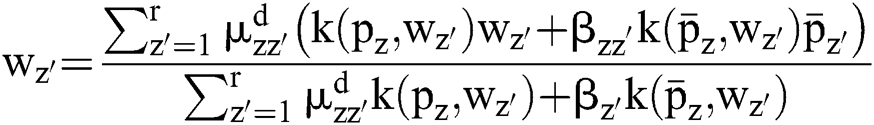
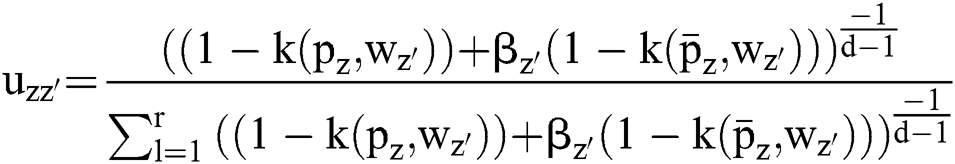
The objective function given in the Eq. (15) can be deployed to evaluate the quality of segmenting dataset keen of clusters. The processing of the proposed clustering technique generates an optimal portion with respect to reduction of weights present inside the cluster. Next to this, the spatial features improve the possibility of adjacent pixel along with relevant features at the time of clustering process. Hence, the experimented outcomes denote that a set of two parameters α and β are the most significant portions of clustering simulation outcome. Based on the practical results, it is evident that the newly projected ASKFCM along with spatial kernel data tend to enhance the computation when compared with alternate traditional FCM models in the absence of spatial data.
2.4 CNN-Based Feature Extraction
CNN differs right starting from convolutional process to the analysis of  pooling layers and the way of nets getting training. As shown in the Fig. 2, the network is composed with five layers of weights such as input layer, conv layer C1,
  pooling layer M2, full connection layer F3, as well as the output layer. Here,
  denotes every trainable attribute (weight measures),
  and
and  where
where  implies the parameter set between
 as well as
  th layer.
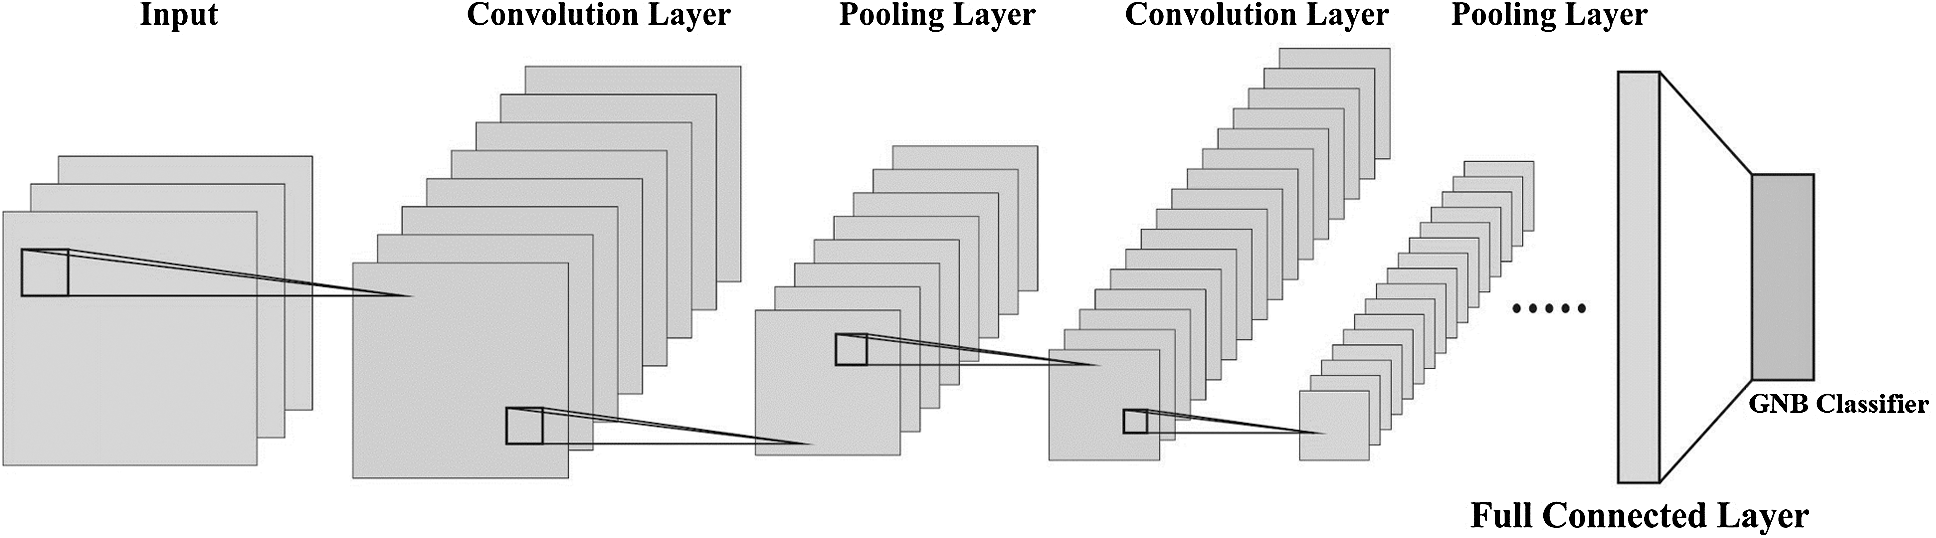
Figure 2: The architecture of CNN based feature extraction model
In DR, every DR pixel sample can be considered as a 2 - dimensional image which has an equal height of 1, since 1D audio inputs are applied in audio analysis. Hence, the size of an input layer for  , and
, and  signify the band count. The initial hidden conv layer C1 extracts
  input data including 20 kernels of size
 . Followed by this, is the layer C1 which has
  nodes, while
 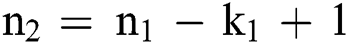 . It is comprised of
 training parameters between the layer C1 and input layer. The
  pooling layer M2 is assumed to be a second hidden layer, and the kernel size is
  . The layer M2 consists of
  nodes, and
  The fully connected layer F3 contains a set of
 nodes whereas
  shows the readable parameters from current layer to layer M2. Subsequently, the output layer is comprised of
  nodes, and
  trainable parameters from present layer and layer F3. Thus, the structure of the projected CNN classification contains a set of
 trained parameters.
The classification of a particular DR pixel needs a relevant CNN including an aforementioned parameter, where  and
and  denote a spectral channel size as well as the count of external classes of a dataset, correspondingly. Practically, k1 might be
  , whereas
  could be the values among 30 and 40 as well as
  remains fixed to 100. Hence, the options could be optimal and efficient for a common HIS information. From this structure, it is clearly pointed that the layers C1 and M2 can be observed as trainable feature extractors for input DR data, while layer
  can be assumed as a trainable classification for feature extractor. In this work, the CNN based Inception v4 model is applied as the feature extractor [23]. The final outcome of sub sampling is an original feature of actual information.
Typically, it can be handled with frequent parameters from Naive Bayes (NB) classifier which tends to apply Gaussian distributions to present the likelihoods of features constrained on the classes. Therefore, every parameter is described using Gaussian PDF by,
The Gaussian PDF consists of a shape of every bell that can be expressed below.
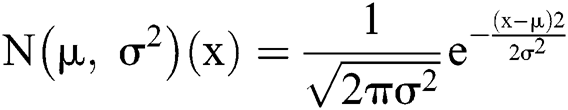
where  represents mean and
  implies variance. In NB, the required parameter should be in the order of n(k), where
  denotes the attribute count whereas
  implies a number of classes. Particularly, a normal distribution
 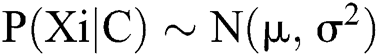 for all continuous attributes must be defined. Hence, the variables associated with these normal distributions could be derived using,
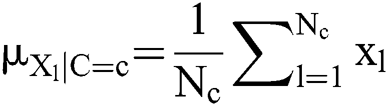
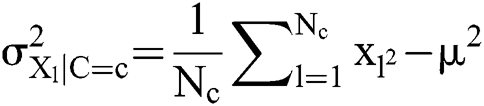
where  denotes the count of instance where
  whereas
  represents the number of overall examples applied in training. By estimating
  for every class, it becomes simple by applying relevant frequencies in the form of,
Finally, the classifier outcome by the proposed model is notified to the user using the cloud database server and smart phones.
For experimentation purposes, a benchmark MESSIDOR DR Dataset was used which had a total of 1,200 color fundus images with annotations in Excel file [24]. The details related to the dataset is shown in the Tab. 1 and the images can be graded into different levels namely level 1, level 2 and level 3. Fig. 3 shows some of the sample test DR images. The parameters involved in the simulation process are learning rate: 0.0001, momentum: 0.9, batch size: 128 and epoch count: 140.
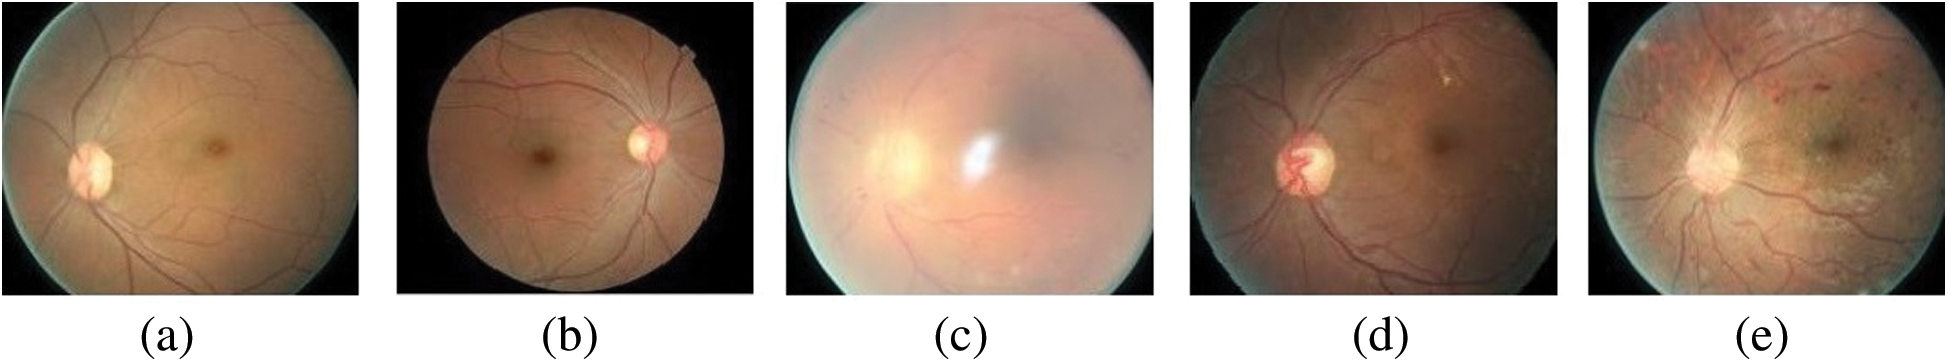
Figure 3: The sample images of DR a) normal b) mild c) moderate d) severe d) proliferative
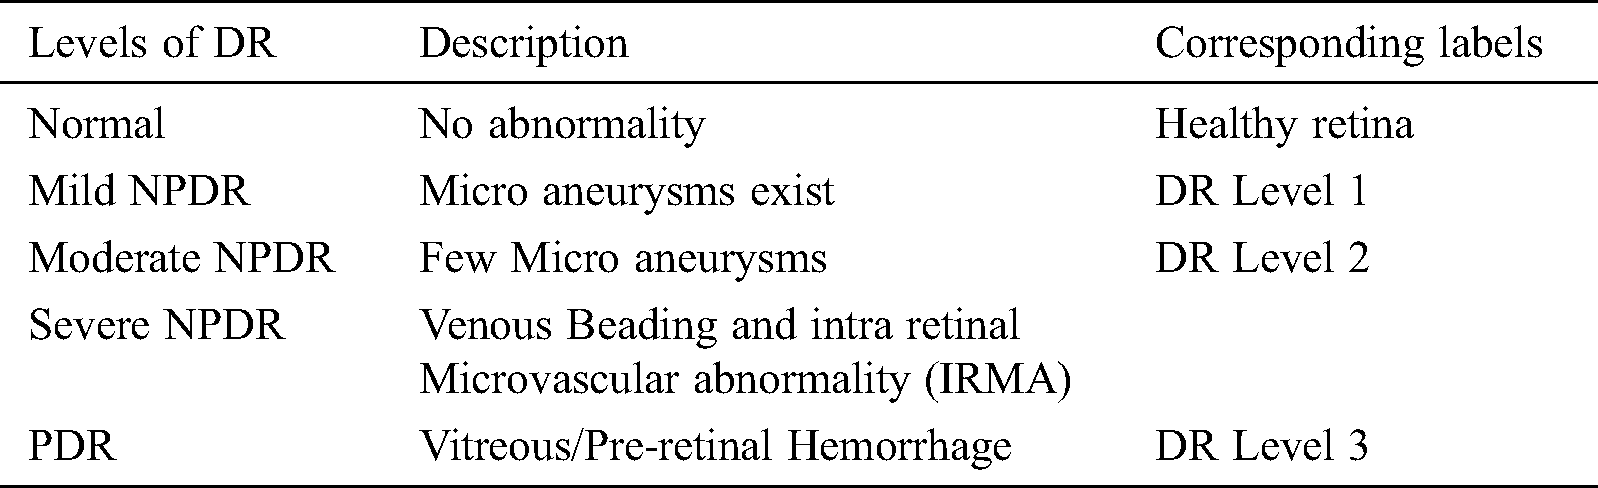
Fig. 4 shows the sample visualization results of the DR images attained under segmentation and classification processes [25]. As shown in the table, it can be inferred that the input image shown in Fig. 4a got properly segmented and classified into DR_Level 3 as depicted in the Figs. 4b and 4c respectively.
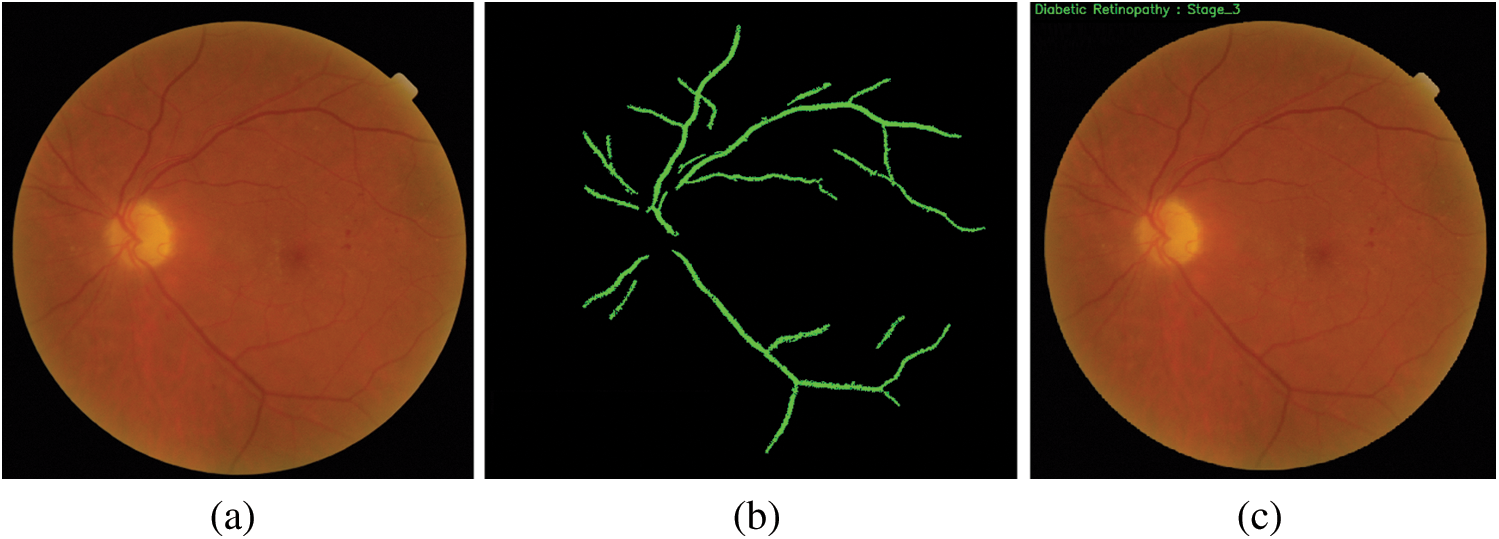
Figure 4: a) Original image b) segmented image c) classified image
The results achieved by the projected model in classifying the DR images are listed in Tab. 2. The first column in the table denotes the DR level types namely, normal, level 1, level 2 and level 3. The second column shows the original image whereas the third and fourth columns represent the corresponding segmented and classified images. By looking into the table, it can be inferred that the normal input image present in the second row of the table is correctly classified as Normal. Similarly, the level 1 input image present in the third row of the table is correctly classified as level 1. Likewise, the level 2 input image present in the fourth row of the table is accurately classified as level 2. In the same way, the level 3 input image present in the fifth row of the table is perfectly classified as level 3.
Table 2: Sample visualization results

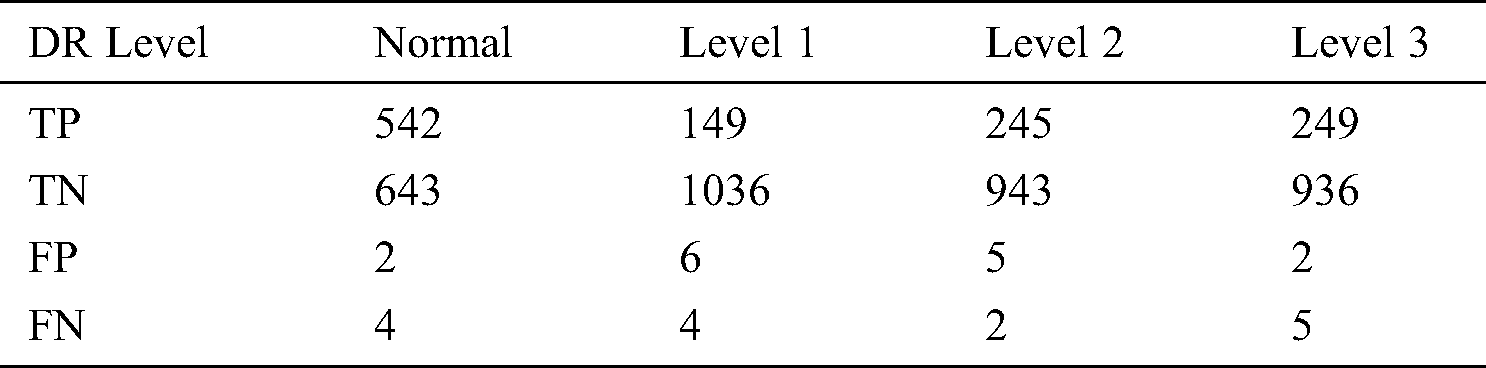
Tab. 3 provides the confusion matrix generated by the proposed model on the applied DR images. The table values highlighted that the proposed model clearly classifies a set of 542 images as Normal, 149 images as Level 1, 245 images as Level 2, and 249 images as Level 3 respectively. Afterwards, the generated confusion matrix was manipulated and the values were examined interms of True Positive (TP), True Negative (TN), False Positive (FP) and False Negative (FN) as shown in the Tab. 4. These values are applied to determine the classification performance.
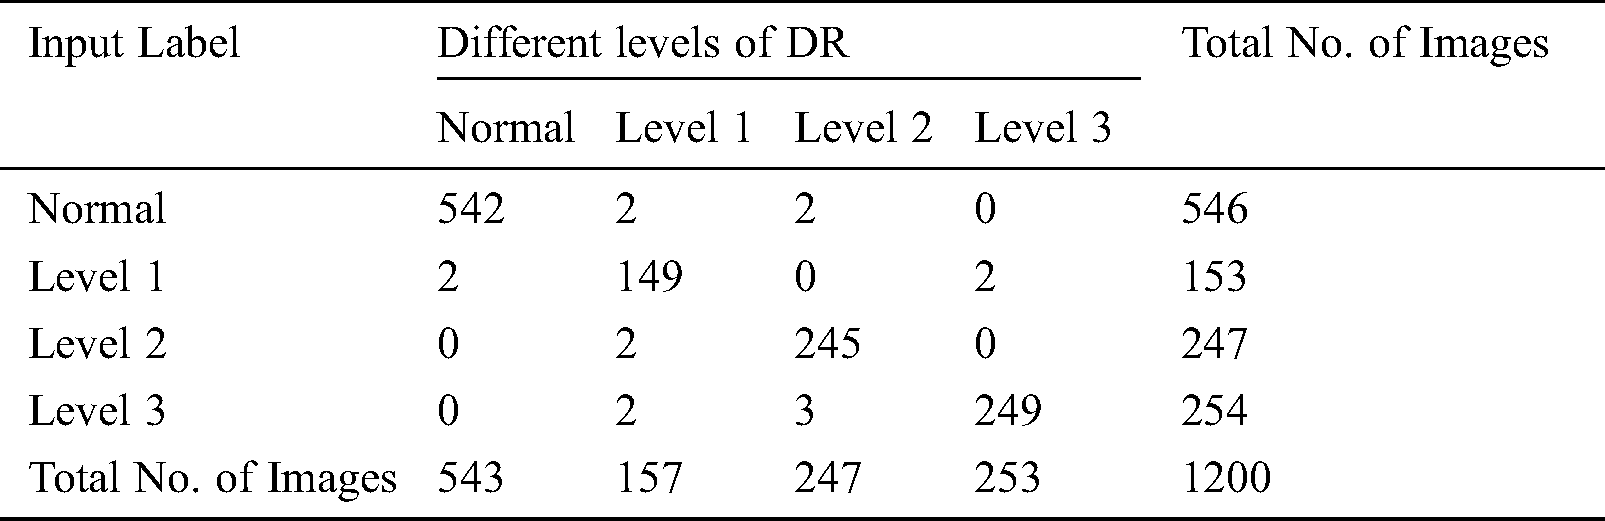
Table 4: Manipulations from confusion matrix
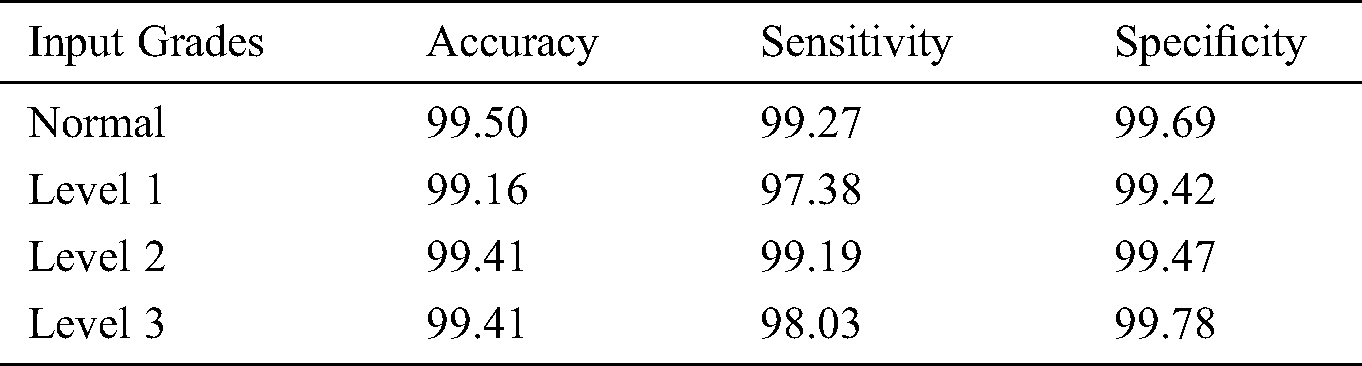
Tab. 5 and Fig. 5 provides a detailed performance of the proposed model on the applied dataset. The proposed model properly classifies the input DR images into Normal class with the maximum accuracy of 99.50%, sensitivity of 99.27% and specificity of 99.69%. At the same time, the input images are classified into level 1 images with the maximum accuracy of 99.16%, sensitivity of 97.38% and specificity of 99.42%. In the same way, the input images are classified into level 2 images with the maximum accuracy of 99.41%, sensitivity of 99.19% and specificity of 99.47%. Simultaneously, the input images are classified into level 3 images with the maximum accuracy of 99.41%, sensitivity of 98.03% and specificity of 99.78% respectively. These higher values indicated that the proposed model has effectively classified the applied DR images.
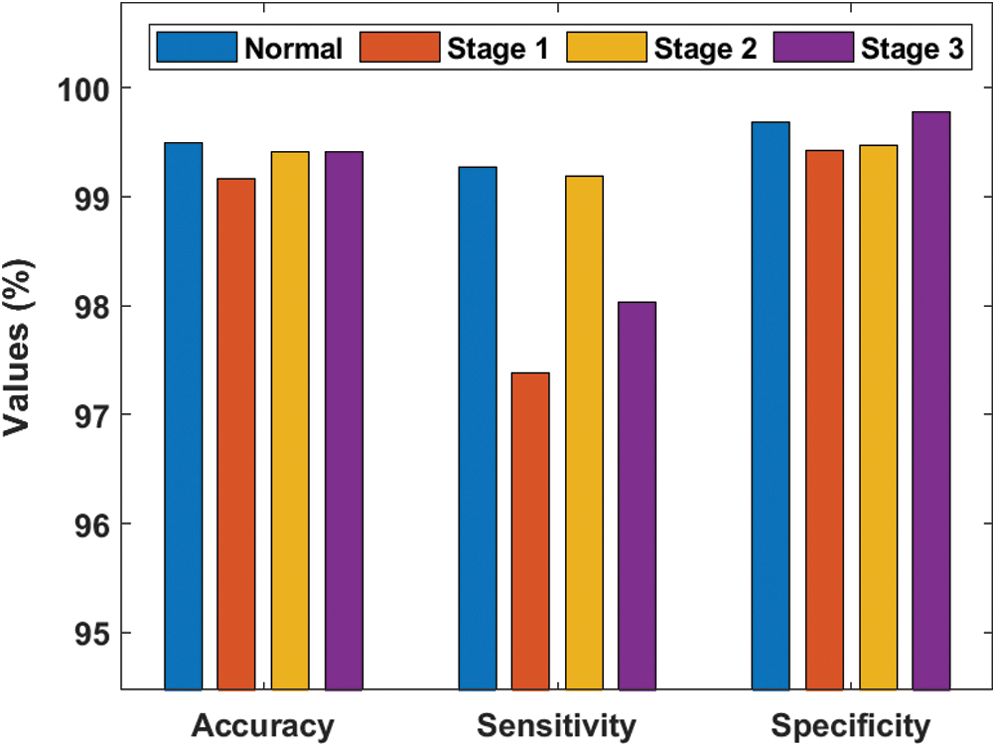
Figure 5: Classifier results offered by proposed model on DR images
Table 5: Performance measures of test images with different DR levels
A detailed comparison of the results achieved by distinct DR classification models [26–27] conducted and shown in Tab. 6. Fig. 6 shows the accuracy analysis for the proposed and existing models on the applied DR images. From the results, it can be inferred that the AlexNet is the ineffective classifier model with the least accuracy value of 89.75%. Following this, the ResNet model also exhibited poor classifier outcome with a minimum accuracy of 90.4%. At the same time, the VggNet-16, VggNet-19 and GoogleNet models achieved moderate classifier outcome and closer accuracy values of 93.17%, 93.73% and 93.36% respectively. In line with this, the VggNet-s model tried to achieve manageable results and ended up with a moderate accuracy of 95.68%. Besides, the M-AlexNet model offered a near optimal classifier outcome with the accuracy value of 96%. At the same time, the synergic deep learning (SDL) and deep neural network with moth search optimization (DNN-MSO) algorithms have reached to a competitive near accuracy values of 99.28% and 99.12% respectively. However, the proposed model showed significantly better classification results over the compared methods by achieving a maximum accuracy of 99.37%.
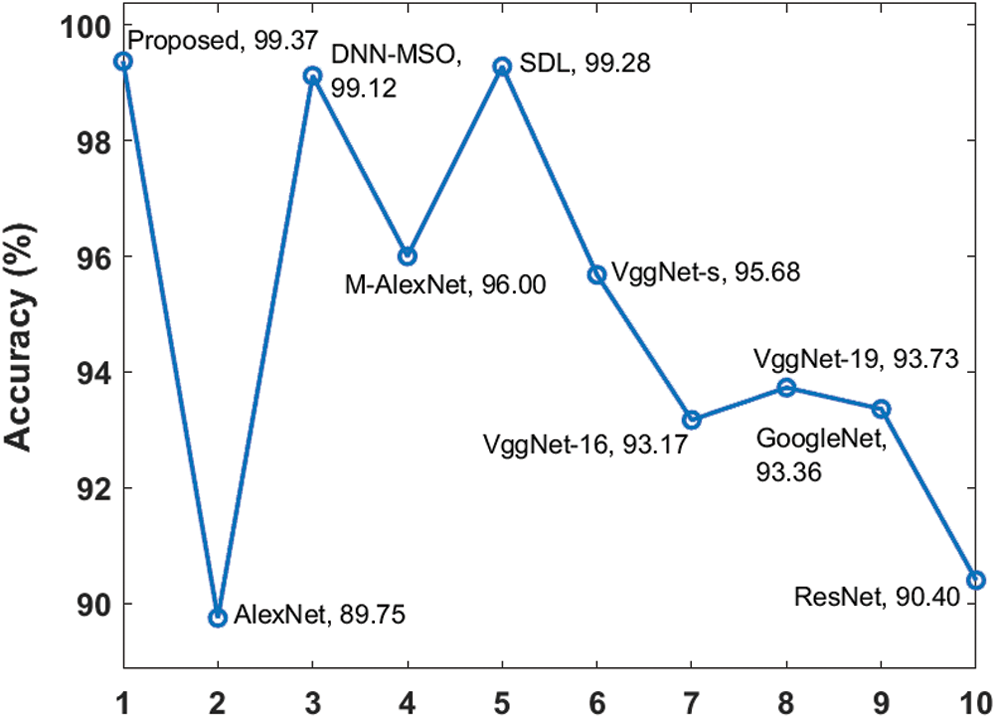
Figure 6: Accuracy analysis of diverse models on DR images
Table 6: Performance measures of test images with various models
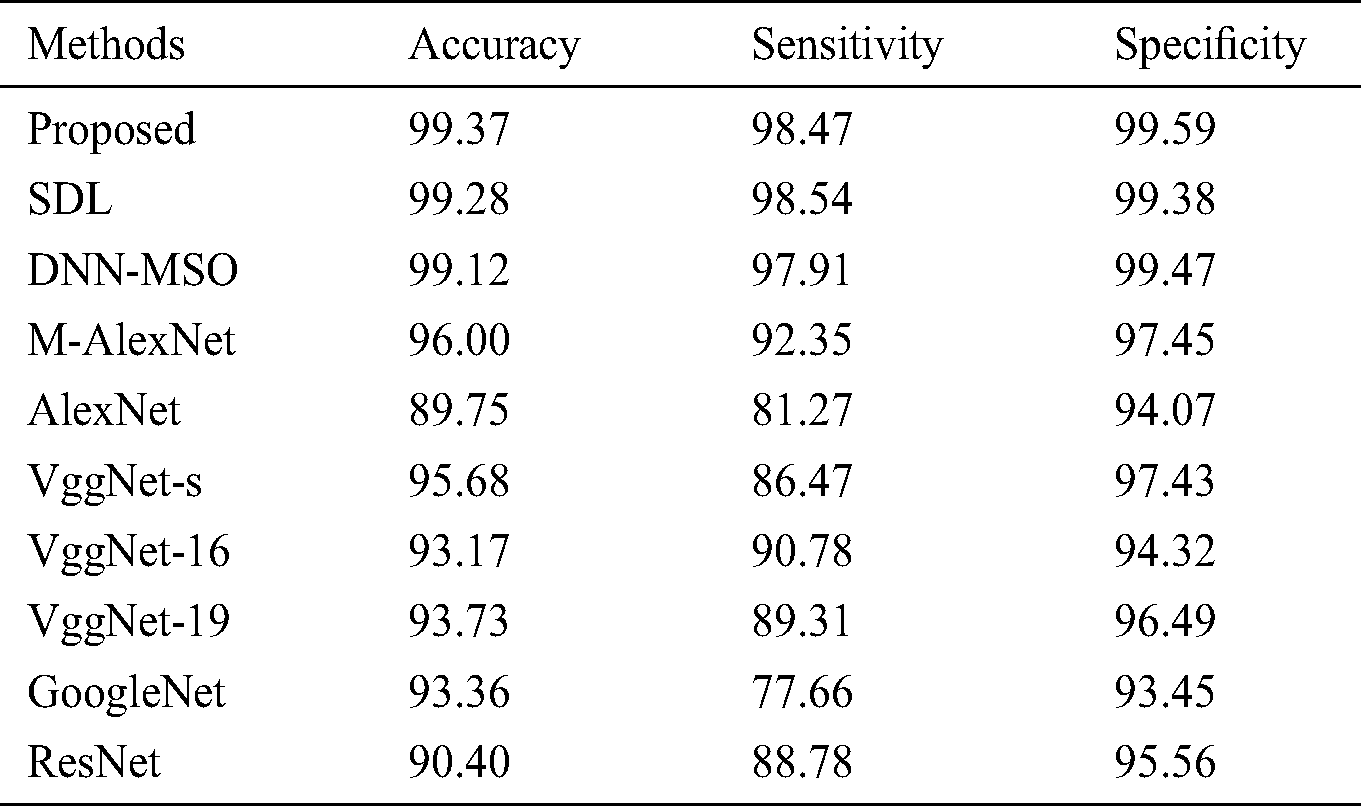
Fig. 7 illustrates the sensitivity analysis for the proposed and existing approaches on test DR input images. It can be inferred that the GoogleNet exhibited the least classification performance with a minimal sensitivity of 77.66%. The AlexNet model outperformed GoogleNet and offered slightly higher sensitivity of 81.27%. The ResNet model achieved a slightly higher sensitivity value of 88.78%. In line with this, both VggNet-19 and VggNet-16 models achieved moderate classifier outcome with closer sensitivity values of 89.31% and 90.78% respectively. Moreover, the M-AlexNet, SDL and DNN-MSO models offered a closer classifier outcome with the sensitivity value of 92.35%, 98.54% and 97.91% respective. The proposed model offered the extraordinary classifier results with a maximum sensitivity value of 98.47%.
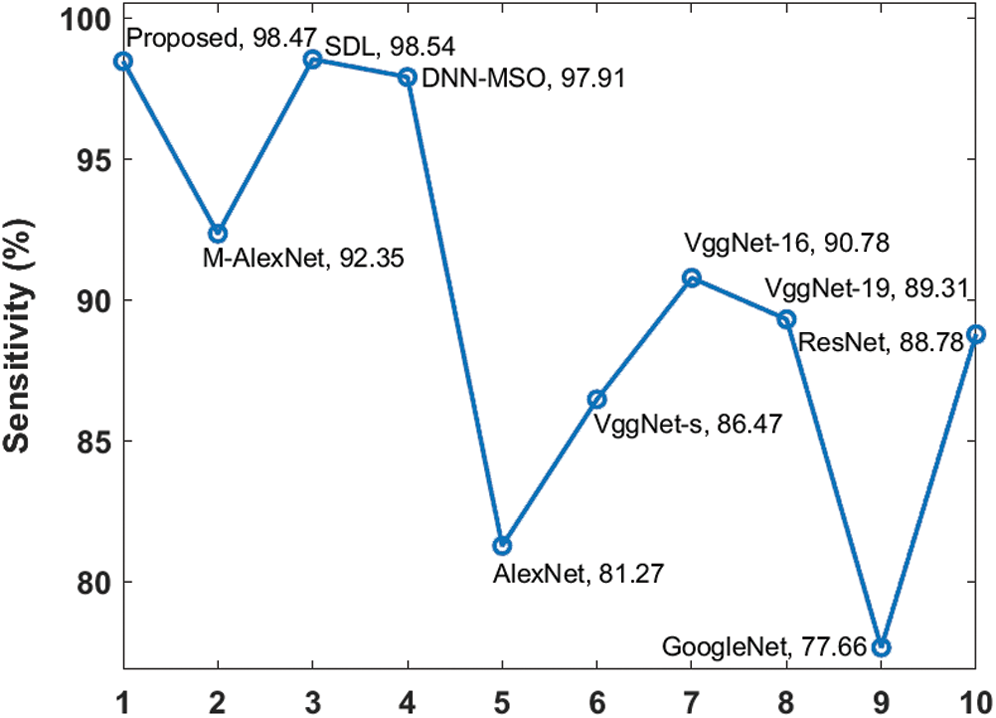
Figure 7: Sensitivity analysis of diverse models on DR images
Fig. 8 illustrates the specificity analysis for the proposed and existing approaches on test DR input images. From the figure, the inference is as follows. GoogleNet exhibited the least classification performance with 93.45% minimal specificity value whereas the VggNet-16 model outperformed the GoogleNet by achieving a slightly higher specificity of 94.32%. Compared to the models above, a slightly higher specificity value of 94.07% was achieved by AlexNet model. In line with this, both ResNet and VggNet-19 models achieved moderate classifier outcome and closer specificity values of 95.56% and 96.49% respectively. Moreover, both M-AlexNet and VggNet-s models offered a near optimal classifier outcome with specificity values of 97.45% and 97.43% respectively. Though the SDL and DNN-MSO models have attained competitive results with the specificity of 99.38% and 99.47%, it failed to outperform the proposed method. However, the proposed model offered surprising classifier results with a maximum specificity value of 99.59%.
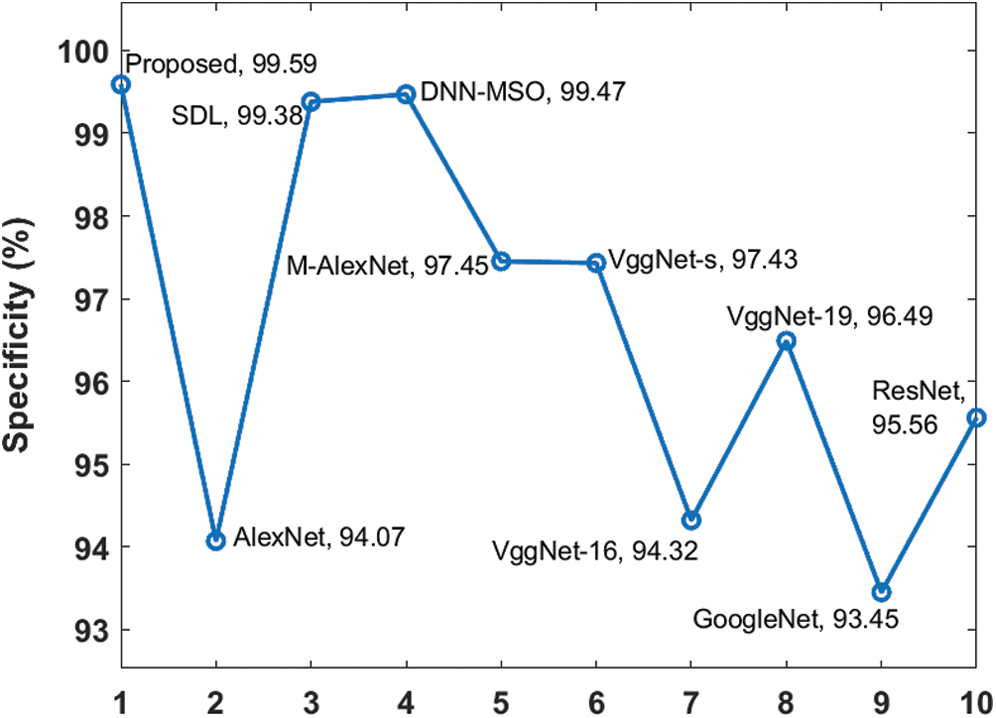
Figure 8: Specificity analysis of diverse models on DR images
The above mentioned figures and tables inferred that the proposed model offered effective DR classification with the maximum sensitivity of 98.47%, specificity of 99.59% and accuracy of 99.37% respectively. Therefore, the proposed model can be applied in real time diagnosis for the classification of DR. The usage of CLAHE based preprocessing, ASKFCM based segmentation, CNN based feature extraction has formed the basis of improved classification results by GNB model.
In this study, a new IoT and cloud-based DR disease diagnosis and classification model was proposed. At first, the patient utilizes the blood glucose sensor to measure the glucose level present in the blood. To conduct diagnosis, the fundus image is captured using an IoT enabled head mounted camera and stored in the cloud database server. At the same time, the proposed disease diagnosis model also gets executed at the cloud and the corresponding outcome is provided to the user as output, i.e., whether the patient suffers from DR or not. The proposed diagnosis model is composed of several processes namely data collection, preprocessing, segmentation, feature extraction and classification. The proposed model was tested using a benchmark DR MESSIDOR image dataset. The experimental outcome stated that the proposed model offered effective DR classification with a maximum sensitivity of 98.47%, specificity of 99.59% and accuracy of 99.37% respectively. In future, the proposed model can be deployed in real time diagnosis to assist diabetic patients and doctors for effective DR diagnosis.
Funding Statement: This work is financially supported by RUSA–Phase 2.0 grant sanctioned vide Letter No. F. 24-51/2014-U, Policy (TNMulti-Gen), Dept. of Edn. Govt. of India, Dt. 09.10.2018.
Conflicts of Interest: The authors declare that they have no conflicts of interest to report regarding the present study.
1. P. M. Kumar, S. Lokesh, R. Varatharajan, G. C. Babua and P. Parthasarathy. (2018). “Cloud and IoT based disease prediction and diagnosis system for healthcare using Fuzzy neural classifier,” Future Generation Computer Systems, vol. 86, pp. 527–534. [Google Scholar]
2. M. R. K. Mookiah, U. R. Acharya, C. K. Chua, C. M. Lim, E. Y. K. Ng et al.. (2013). , “Computer-aided diagnosis of diabetic retinopathy: A review,” Computers in Biology and Medicine, vol. 43, no. 12, pp. 2136–2155. [Google Scholar]
3. O. Faust, U. R. Acharya, E. Y. K. Ng, K. H. Ng and J. S. Suri. (2012). “Algorithms for the automated detection of diabetic retinopathy using digital fundus images: A review,” Journal of Medical Systems, vol. 36, no. 1, pp. 145–157. [Google Scholar]
4. R. F. Mansour. (2017). “Evolutionary computing enriched computer-aided diagnosis system for diabetic retinopathy: A survey,” IEEE Reviews in Biomedical Engineering, vol. 10, pp. 334–349. [Google Scholar]
5. J. Almotiri, K. Elleithy and A. Elleithy. (2018). “Retinal vessels segmentation techniques and algorithms: A survey,” Applied Sciences, vol. 8, no. 2, pp. 1–31. [Google Scholar]
6. A. Almazroa, R. Burman, K. Raahemifar and V. Lakshminarayanan. (2015). “Optic disc and optic cup segmentation methodologies for glaucoma image detection: A survey,” Journal of Ophthalmology, vol. 2015, no. 7, pp. 1–28. [Google Scholar]
7. N. Thakur and M. Juneja. (2018). “Survey on segmentation and classification approaches of optic cup and optic disc for diagnosis of glaucoma,” Biomedical Signal Processing and Control, vol. 42, pp. 162–189. [Google Scholar]
8. P. Verma and S. K. Sood. (2018). “Cloud-centric IoT based disease diagnosis healthcare framework,” Journal of Parallel and Distributed Computing, vol. 116, pp. 27–38. [Google Scholar]
9. C. Stergiou, K. E. Psannis, B. G. Kim and B. Gupta. (2018). “Secure integration of IoT and cloud computing,” Future Generation Computer Systems, vol. 78, no. 3, pp. 964–975. [Google Scholar]
10. M. Tao, J. Zuo, Z. Liu, A. Castiglione and F. Palmieri. (2018). “Multi-layer cloud architectural model and ontology-based security service framework for IoT-based smart homes,” Future Generation Computer Systems, vol. 78, no. 3, pp. 1040–1051. [Google Scholar]
11. P. M. Kumar and U. D. Gandhi. (2018). “A novel three-tier internet of things architecture with machine learning algorithm for early detection of heart diseases,” Computers & Electrical Engineering, vol. 65, pp. 222–235. [Google Scholar]
12. C. H. Chen, C. R. Lee and W. C. H. Lu. (2017). “Smart in-car camera system using mobile cloud computing framework for deep learning,” Vehicular Communications, vol. 10, pp. 84–90. [Google Scholar]
13. D. Wu, C. Jennings, J. Terpenny and S. Kumara. (2016). “Cloud-based machine learning for predictive analytics: Tool wear prediction in milling,” in 2016 IEEE Int. Conf. on Big Data, Washington, DC, USA, pp. 2062–2069. [Google Scholar]
14. G. Muhammad, S. M. M. Rahman, A. Alelaiwi and A. Alamri. (2017). “Smart health solution integrating IoT and cloud: A case study of voice pathology monitoring,” IEEE Communications Magazine, vol. 55, no. 1, pp. 69–73. [Google Scholar]
15. M. S. Hossain and G. Muhammad. (2016). “Cloud-assisted Industrial Internet of Things (IIoT) – enabled framework for health monitoring,” Computer Networks, vol. 101, pp. 192–202. [Google Scholar]
16. S. M. R. Islam, D. Kwak, M. H. Kabir, M. Hossain and K. S. Kwak. (2015). “The internet of things for health care: A comprehensive survey,” IEEE Access, vol. 3, pp. 678–708. [Google Scholar]
17. R. Sethukkarasi, S. Ganapathy, P. Yogesh and A. Kannan. (2014). “An intelligent neuro fuzzy temporal knowledge representation model for mining temporal patterns,” Journal of Intelligent & Fuzzy Systems, vol. 26, no. 3, pp. 1167–1178. [Google Scholar]
18. P. Kakria, N. K. Tripathi and P. Kitipawang. (2015). “A real-time health monitoring system for remote cardiac patients using smartphone and wearable sensors,” International Journal of Telemedicine and Applications, vol. 2015, no. 11, pp. 1–15. [Google Scholar]
19. S. H. Kim and K. Chung. (2015). “Emergency situation monitoring service using context motion tracking of chronic disease patients,” Cluster Computing, vol. 18, no. 2, pp. 747–759. [Google Scholar]
20. T. J. Jebaseeli, C. A. D. Durai and J. D. Petera. (2018). “IOT based sustainable diabetic retinopathy diagnosis system, sustainable Computing,” Informatics and Systems. [Google Scholar]
21. S. Roychowdhury, D. D. Koozekanani and K. K. Parhi. (2013). “DREAM: Diabetic retinopathy analysis using machine learning,” IEEE Journal of Biomedical and Health Informatics, vol. 18, no. 5, pp. 1717–1728. [Google Scholar]
22. K. M. Adal, P. G. van Etten, J. P. Martinez, K. W. Rouwen, K. A. Vermeer et al.. (2017). , “An automated system for the detection and classification of retinal changes due to red lesions in longitudinal fundus images,” IEEE Transactions on Biomedical Engineering, vol. 65, no. 6, pp. 1382–1390. [Google Scholar]
23. C. Szegedy, V. Vanhoucke, S. Ioffe, J. Shlens and Z. Wojna. (2016). “Rethinking the inception architecture for computer vision,” in 2016 IEEE Conf. on Computer Vision and Pattern Recognition, Las Vegas, NV, USA, pp. 2818–2826. [Google Scholar]
24. Datset. [Online]. Available: http://www.adcis.net/en/third-party/messidor/. [Google Scholar]
25. T. Shanthi and R. S. Sabeenian. (2019). “Modified Alexnet architecture for classification of diabetic retinopathy images,” Computers & Electrical Engineering, vol. 76, pp. 56–64. [Google Scholar]
26. K. Shankar, E. Perumal and R. M. Vidhyavathi. (2020). “Deep neural network with moth search optimization algorithm based detection and classification of diabetic retinopathy images,” SN Applied Sciences, vol. 2, no. 4, pp. 1–10. [Google Scholar]
27. K. Shankar, A. R. W. Sait, D. Gupta, S. K. Lakshmanaprabu, A. Khanna et al.. (2020). , “Automated detection and classification of fundus diabetic retinopathy images using synergic deep learning model,” Pattern Recognition Letters, vol. 133, pp. 210–216. [Google Scholar]
 | This work is licensed under a Creative Commons Attribution 4.0 International License, which permits unrestricted use, distribution, and reproduction in any medium, provided the original work is properly cited. |