DOI:10.32604/cmc.2020.012251
| Computers, Materials & Continua DOI:10.32604/cmc.2020.012251 | |
| Article |
Self-Management of Low Back Pain Using Neural Network
1ASET, Amity University Uttar Pradesh, Noida, 201301, India
2Department of Information Technology, College of Computer and Information Sciences, Majmaah University, Majmaah, 11952, Saudi Arabia
3Computer Science Department, Community College, King Saud University, Riyadh, Saudi Arabia
*Corresponding Author: Mohammed Alshehri. Email: ma.alshehri@mu.edu.sa
Received: 22 June 2020; Accepted: 10 September 2020
Abstract: Low back pain (LBP) is a morbid condition that has afflicted several citizens in Europe. It has negatively impacted the European economy due to several man-days lost, with bed rest and forced inactivity being the usual LBP care and management steps. Direct models, which incorporate various regression analyses, have been executed for the investigation of this premise due to the simplicity of translation. However, such straight models fail to completely consider the impact of association brought about by a mix of nonlinear connections and autonomous factors.In this paper, we discuss a system that aids decision-making regarding the best-suited support system for LBP, allowing the individual to avail of reinforcement and improvement in its self-management. These activities are monitored with the help of a wearable sensor that helps in their detection and their classification as those that soothe or aggravate LBP and hence, should or should not be performed. This system helps the patients set their own boundaries and milestones with respect to suitable activities. This system also does windowing and feature extraction. The present study is an empirical and comparative analysis of the most suitable activities that patients suffering from low back pain can select. The evaluation shows that the system can distinguish between nine common daily activities effectively and helps self-monitor these activities for the efficient management of LBP.
Keywords: Low back pain; neural networks; sensor; classification; time series
Low back pain [LBP] [1] is the most common health problem in all age groups. At one point or the other, as many as 90% people have suffered from this disorder. LBP is more pervasive in European nations as compared to other countries. The foremost condition in nonspecific LBP is seen in primary care. Mostly, general practitioners observe the muscular-skeletal situation and advise bed rest, resulting in man-days lost and loss to the economy. The cost to economies due to low back pain has been estimated in different studies. As per one study, the cost is around 1.65–3.22% of all health expenditures [2], and as per another, it is 0.4–1.2% of GDP in the European Union [3]. The cost, which is indirect due to substantial absence from work, has been approximately $50 billion in the USA and around $11 billion in the U.K. With bed rest and forced inactivity observed at the individual level, LBP is largely managed within the comforts of one’s home. A carefully selected list of dos and don’ts, including stretching exercises for strengthening, are recommended to avoid long time inactivity.
This model allows users to be aware of their activities [4], and helps manage them [5] by consulting with a specialist doctor so that proper action can be taken once the analysis is done. The data is recorded with a wearable sensor, which helps in the detection of the actions performed by the individual. The activities are recognized in real-time and the model shows how the system records information about the events. The patients are also advised not to be sedentary for an extended period. The notification regarding the activities is sent to alert the user.
The routine activities are recorded and summarized at the end of the day. In these records, the duration of operations and the counts of steps are included. Then these recorded activities are compared to the recommended exercises. Finally, feedback is generated to inform the user about his activities.
2 Activity Recognition Exploration
Recognition of sensor-based activities is gaining heightened interest in the area of fitness. Sensor data can help in computing various physical activities [6–9] of an individual. A sensor is worn around a person’s wrist, and the input is received from the tri-axial accelerometer. These technologies are designed to motivate people about physical health. It can be a creative way to encourage physical activities [10] and make individuals more aware of their everyday physical actions, with the aim of health improvement. The system provides guidelines based on the analysis of a person’s daily activities according to his back pain situation. It helps by alerting the individuals with respect to activities that should or should not be performed. Tri-axial features of the accelerometer sensor measure the changes in acceleration in 3D space.
For accurate activity recognition, some of the sensors include accelerometers, magnetometers, and gyroscopes. While the gyroscope and accelerometer are quite efficacious for the recognition of activities when used individually, the magnetometer is not quite. Other sensors are used to measure heart rate, light and temperature. Hence, all these are used in conjugation with the accelerometer rather than independently.
The combination of accelerometer and sensor types is placed at different points. Some of the studies have also proposed the use of accelerometer multiplicity. Outside the laboratory, settings have a minimal practical use. Some improvements have been reported by the use of multiple sensors for activity recognition [11], which have not justified the inconvenience yet. The use of an accelerometer is explicable because of the point where it is placed [12]. Thigh, hip, back, wrist, and ankle are examples of these body points. The wrist is considered to be the position where the highest accuracy has been reported for ambulation and upper body activities. Hence, this location was chosen for our system. There are several approaches for extracting data, including extraction statistics like mean, standard deviation, and percentiles. The frequency feature, which is derived by applying the fast fourier transforms (FFT) to the raw data, is transformed into information.
Further steps are required after the results of FFT coefficients to ensure reliable results. Application of discrete cosine transform (DCT) to the raw accelerometer data as a feature has been reported.
The Selfback [13] dataset is an activity recognition [14,15] system that allows 9 activity sets, which have been recorded by the accelerometer, including 6 ambulatory and 3 sedentary activities. These were performed by 33 participants who volunteered from Sadiq Sani, Nirmalie Wiratunga, Kay Cooper Robert Gordon University, Aberdeen, U.K., the data donated on 2020-06-15.
Data were recorded with two tri-axial accelerometers sampling at 100 Hz, mounted on the dominant side wrist, and the thigh of the participants. Activity AX3 3-Axis Logging Accelerometer Sensors were used with a sampling frequency of 100 Hz range. Each participant performed an activity for approximately 3 min. The dataset had a sensor modality named “w” for wrist and “t” for thigh, with an additional one where two sensor modalities were merged using timestamp named “wt” for wrist and thigh. Data collection concentrated on the activities provided in Tab. 1.
Table 1: Details of activities used in the data collection script
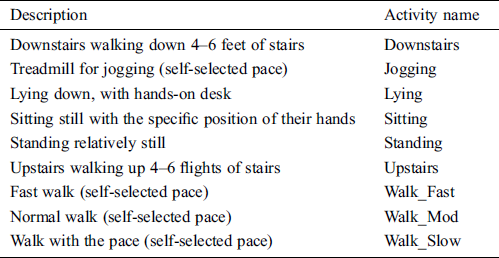
It is represented as the range of healthy activities performed by most people. The measurements of strolling, normal or fast, were recorded for the accurate estimation of the intensity of the activities performed by the user. The intensity of the activities was essential to measure because it helps to provide the necessary guidelines. The participant was guided for activities like sitting and lying. The study suggested the duration of each activity for the individual. It also detailed the position of hands, either on the desk or not.
4 Activity Monitoring Using Feedforward Artificial Neural Network
The model of the artificial neuron was proposed by McCulloch and Pitts, generalized later in several ways [16]. The most popular approach is: the neuron computes the weighted sum of n inputs, adds a threshold value, and then applies an activation function to the result to compute the output, as shown in Fig. 1.
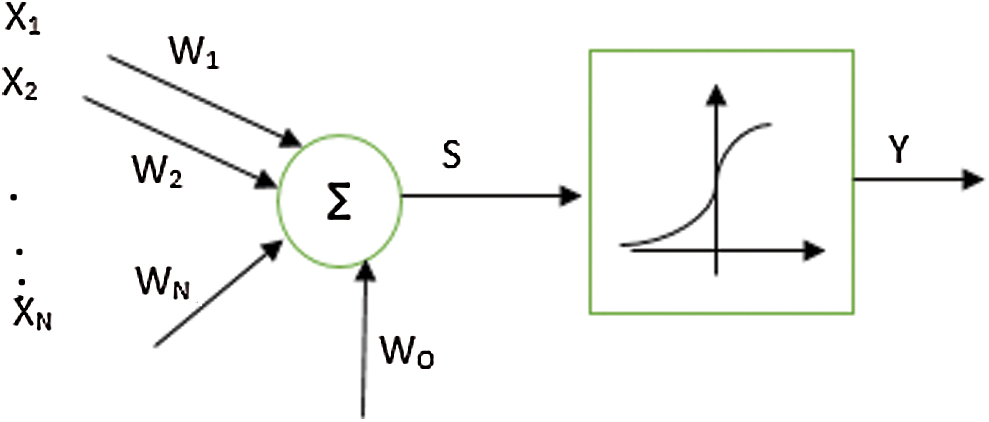
Figure 1: Artificial neuron
The neuron computes the weighted sum of n inputs, adds a threshold value, and then applies an activation function to the result to compute the output as per Eq. (1).

The most commonly used activation function is the sigmoid function, defined as Eq. (2).

The nonlinearity of this function is essential for the robustness of the neural networks model. Also, the function scales the output within the 0–1 range.
The previously described perceptron can classify only linear separable input vectors (XOR being the classic counterexample). It has been proven since 1969 by Minsky and Papert, with declining research interest in the field of neural networks. In order to solve the problem, a multilayer perceptron was used, but it was not known how to update the weights of hidden (intermediate) layers. The updating rule for the weights (briefly described below) was discovered in the late 80s, forming the basis of the boom in the field of neural networks.
The majorly used architecture for neural networks is the multilayer perceptron, where each neuron is connected to all the neurons from the previous layer. The only exception is the first layer, whose units only repeat their inputs. In Fig. 2, we exemplify the most common approach, with one single hidden layer (proven theoretically to be enough).
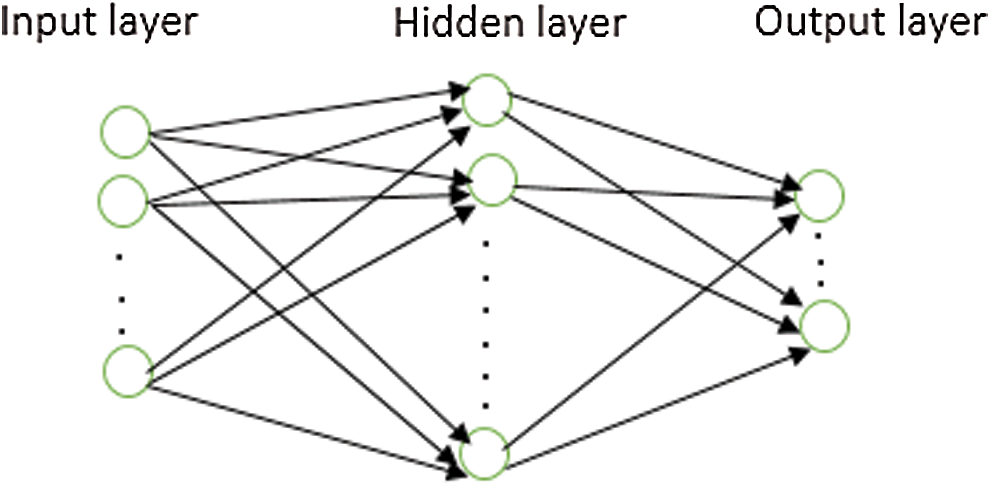
Figure 2: Architecture for neural networks is the multilayer perceptron
In the forward step, Eq. (1) is applied for each neuron, first for the hidden layer [17] and then for the output layer (therefore, the name “feedforward”) to obtain the output value. In the case of supervised learning, we also have the desired output for each input vector. Therefore, the representation error E that appears can also be computed (defined as standard Euclidian distance between obtained output and desired output vectors). The learning rule falls in the category of “error-correction rules”. The most general rule to update a weight w (from any layer) is given in Eq. (3).

where E is the error (as a function of w), and η is the learning rate. The evolution is opposite to the gradient of the error, thereby decreasing the error. Even if not plausible from the biological point of view, it looks like the error propagates back through the network (in the backward step) and updates the weights, hence the name “backpropagation” for the learning algorithm. The forward and backward steps are repeated until the error is reduced sufficiently. Sometimes, to increase the chance of finding the global minima, a (selectable) fraction of Δw from the previous step of the learning is added to the Δw for the current step (the added part known as the momentum term) [18].
Results achieved through the multilayer perceptron are given in this section. The weights and the threshold values for different sigmoid nodes are also given in Tabs. 2 and 3.
Table 2: Generated sigmoid node and threshold values
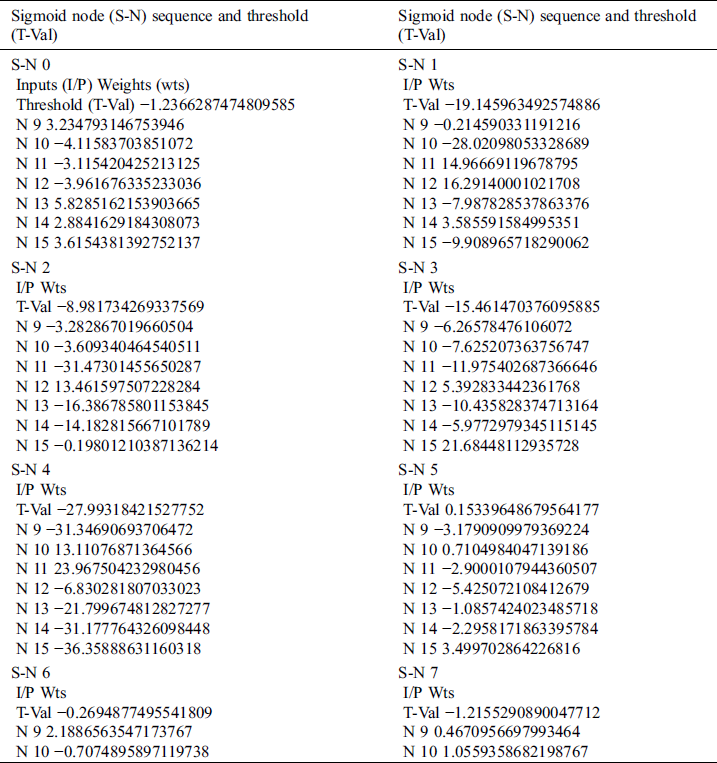
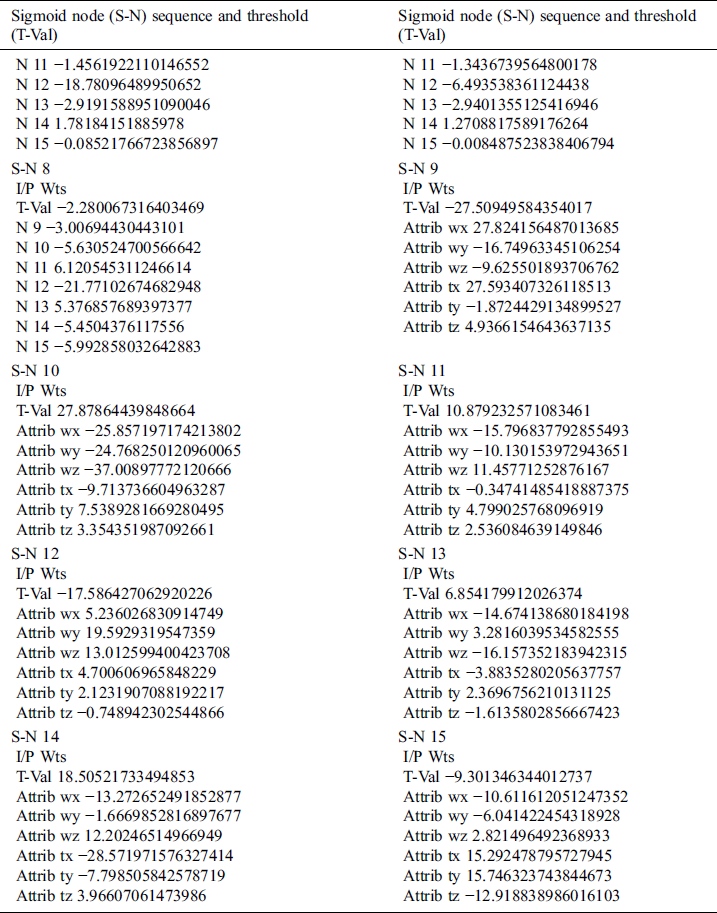
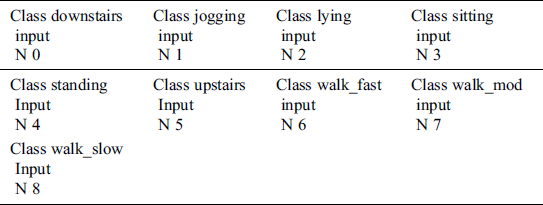
Table 3: Class input node details
@attribute wx real [−1.203125, 0.109375]
@attribute wy real [−1.84375, −0.140625]
@attribute wz real [−0.0625, 1.03125]
@attribute tx real [−3.1875, −0.109375]
@attribute ty real [−1.828125, 0.796875]
@attribute tz real [−1.46875, 0.96875]
@attribute Class
The critical thought is to assemble a partial decision tree rather than an entirely investigated one [19,20]. An incomplete choice tree is a standard choice tree that contains branches to indistinct sub-trees. In order to create such a tree, the development and pruning activities are coordinated to locate a “steady” sub-tree that can be rearranged no further [21]. Once the sub-tree is discovered, tree-building stops and a solitary standard is perused off.
Some partial rules [15,16] generated by the model with respect to different classes are listed below:
wy > −0.203125 AND wy > −0.078125: sitting (1002.0)
wx > 0.03125: lying (1001.0)
wz > 0.53125 AND wy > −0.734375 AND wx > −0.90625 AND wy > −0.65625: jogging (894.0)
tz > 0.21875 AND tx <= −0.9375 AND tx > −1 AND ty > −0.140625 AND ty <= 0 AND wy <= −0.765625 AND wx > −0.59375 AND wz > 0.234375 AND wy <= −0.796875: standing (938.0/1.0)
wy > −0.609375 AND wz <= 0.3125 AND tx > −0.9375 AND wx > −0.359375 AND wy > −0.546875: downstairs (37.0)
wy > −0.609375 AND wz <= 0.3125 AND tx > −0.953125 AND wx > −0.359375 AND tz > −0.203125: downstairs (10.0/1.0)
wy > −0.609375 AND wz <= 0.3125 AND tx > −0.9375 AND ty <= −0.28125 AND wx <= −0.375: downstairs (33.0/1.0)
wy > −0.609375 AND wz <= 0.3125 AND tx > −0.953125 AND wz <= −0.078125 AND tz <= 0.203125: downstairs (19.0)
wy > −0.609375 AND wz <= 0.3125 AND tx > −0.953125 AND tx <= −0.65625 AND wx <= −0.34375 AND ty <= 0.375 AND wx > −0.8125 AND tz > −0.25 AND wy <= −0.53125: upstairs (35.0)
wy > −0.625 AND wz <= 0.296875 AND tx > −0.953125 AND wx > −0.359375 AND tx <= −0.5625: walk_fast (3.0)
To evaluate the performance of the model, self-back dataset utilized the data of 33 participants and when we combined the wrist and thigh modalities together, every object was found to contain approximately 7000 transactions. Thus, total transactions were 33 * 7000 = 231000 per activity, with total 9 activities available. Therefore, the total transactions came out to be 231000 * 9 = 2079000. A sample of this dataset was used to evaluate the performance.
The monitoring model evaluated on different types of parameters and the measurement [22] are as follows
Kappa statistic 0.802
Mean absolute error 0.0427
Root mean squared error 0.1864
Relative absolute error 21.6042%
Root relative squared error 59.3007%
Coverage of cases (0.95 level) 87.9982%
Mean rel. region size (0.95 level)
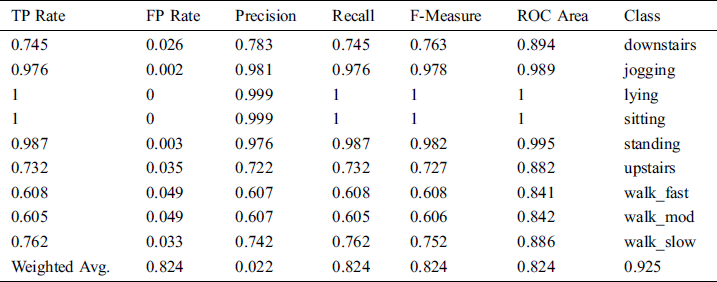
5.1 Monitoring Accuracy by Class
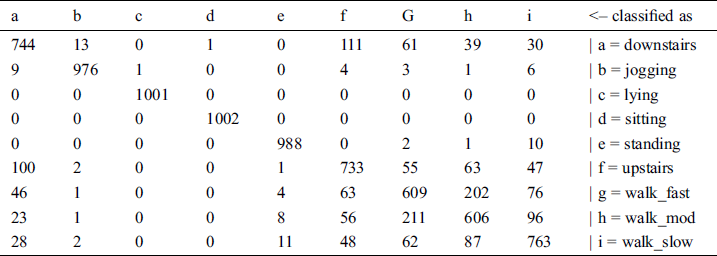
5.2 Confusion Matrix
This paper focuses on activity monitoring and recognition in the self-management of low back pain using artificial neural networks. This system helps in providing guidelines about the activities to be performed. It also helps to monitor these activities. The input is sent to the model through the wrist and thigh sensors. Activity is monitored from the parameter values achieved using a feedforward Artificial Neural Network. Different sigmoid nodes have been generated for accurately classifying the activity modalities. Partial classification rules have also been generated for productive activity classification. More than 250 rules have been generated, few of which have been included in this paper. Monitoring evaluation shows different evaluation parameters and the system performance, including Kappa statistic, mean absolute error, and root mean squared error. Class-wise accuracy is also monitored, and results show improved efficiency of the system.
Future research needs to investigate procedures for perceiving a more significant arrangement of dynamic exercises utilizing continuous learning and semi-managed approaches. More number of sensors need to be used to measure movement activities accurately. A fine balance needs to be struck between the quantity and quality of sensors, and their impacts on the human body in detail, given the sensitivity of employing human subjects directly in such examinations.
8 Class Distribution and Analysis of 3-Axis Accelerometer Logging
The analysis of the dataset has been represented in this section through Figs. 3–15 to get efficient results and class distribution in the wrist and thigh accelerometer sensors.
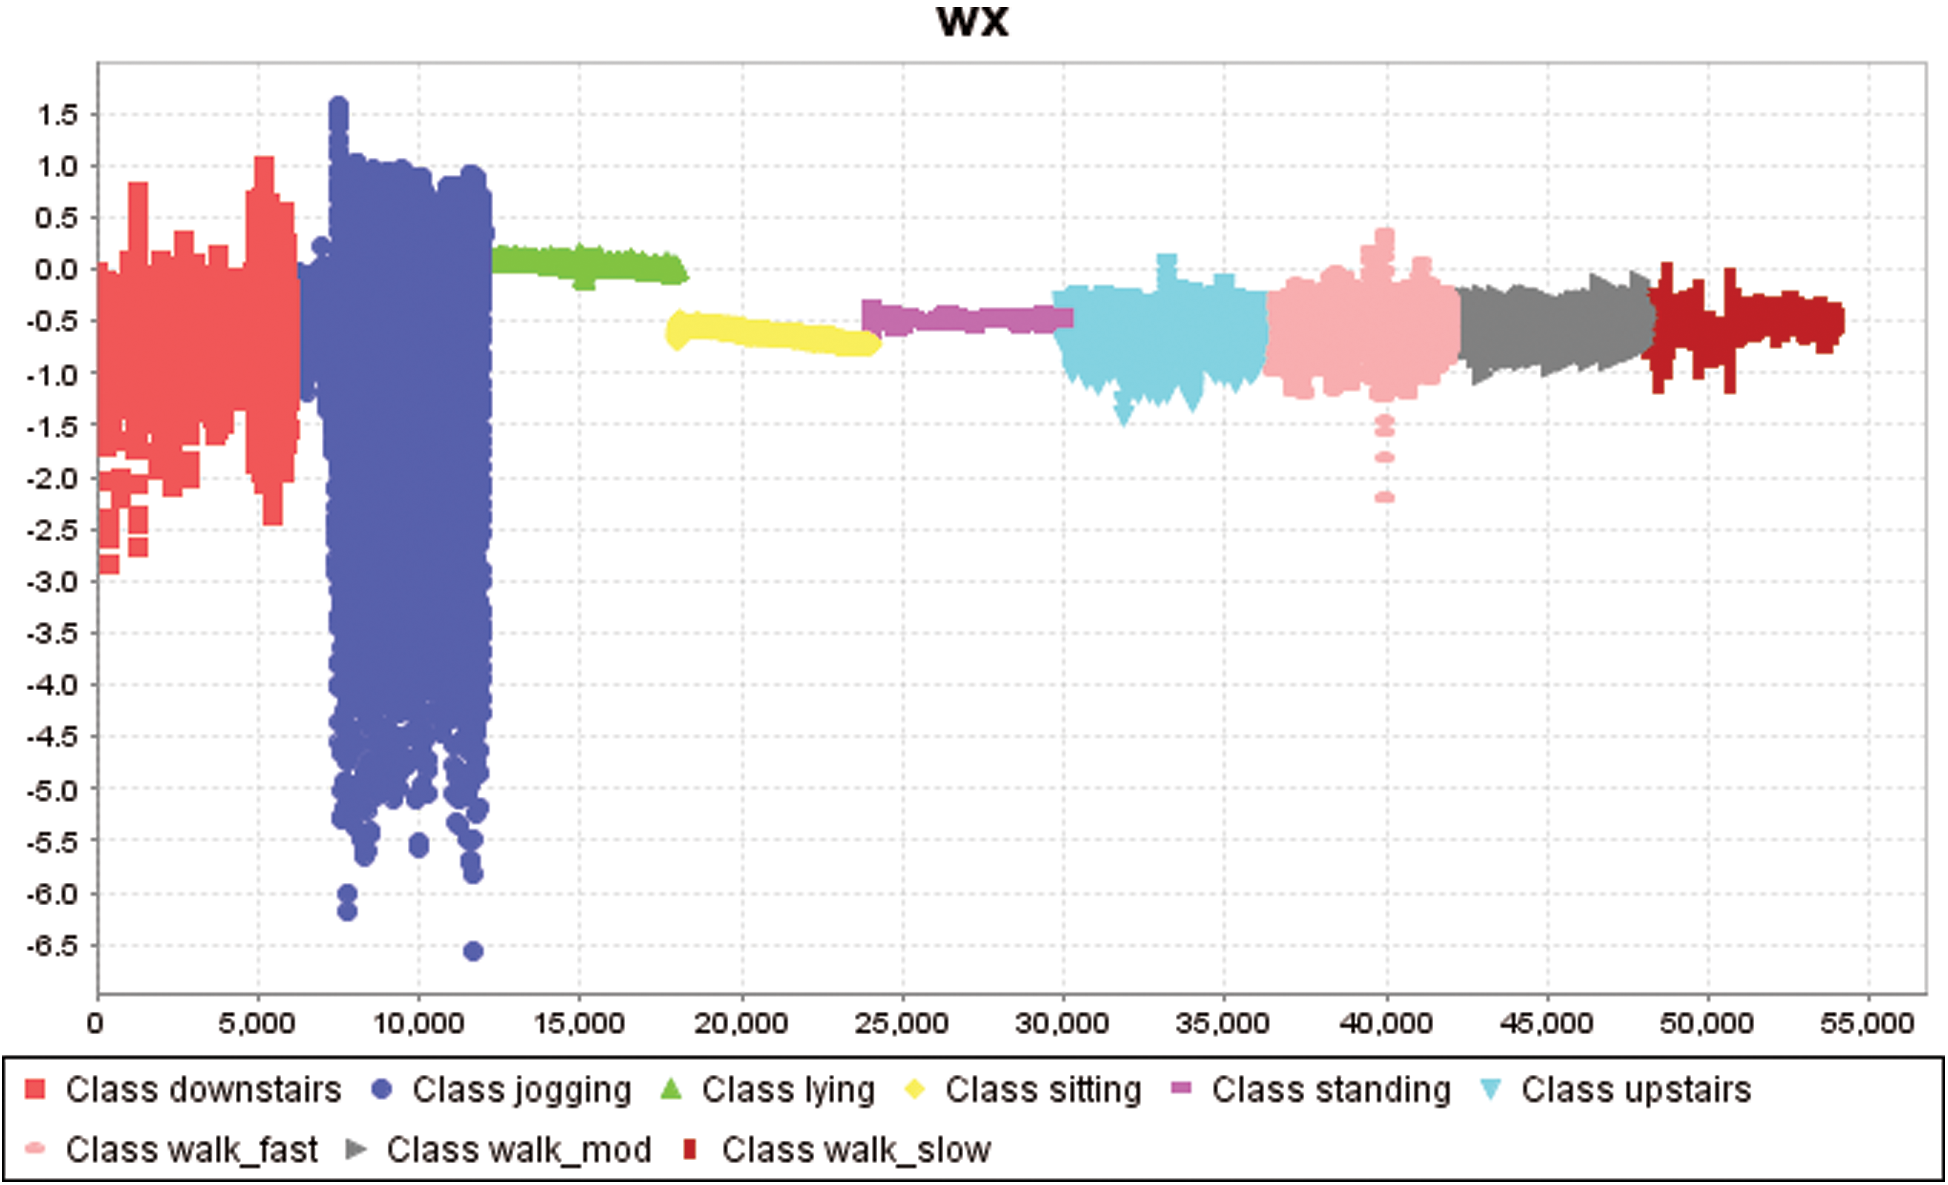
Figure 3: Class distribution in 3-axis accelerometer logging wrist x value
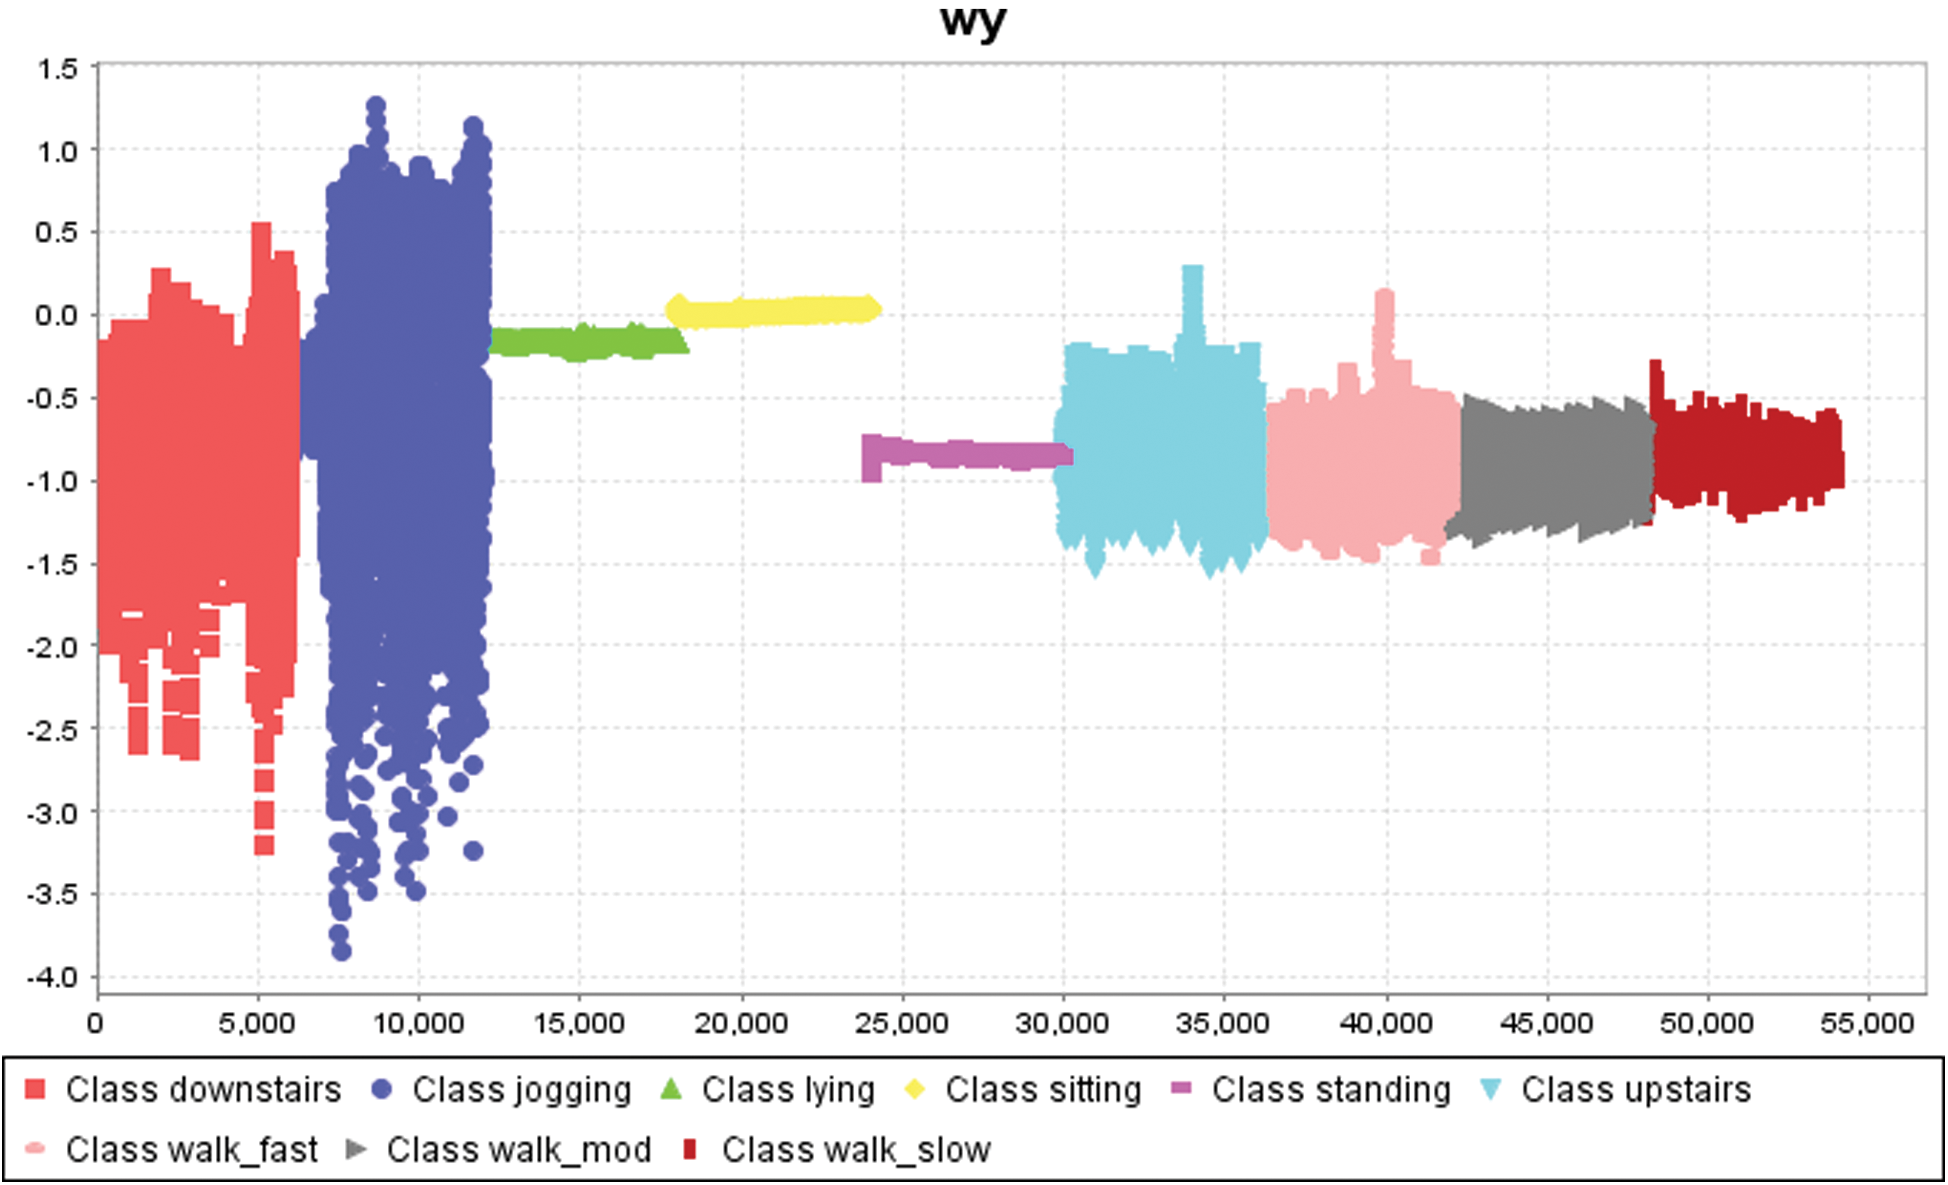
Figure 4: Class distribution in 3-axis accelerometer logging wrist y value

Figure 5: Class distribution in 3-axis accelerometer logging wrist z value
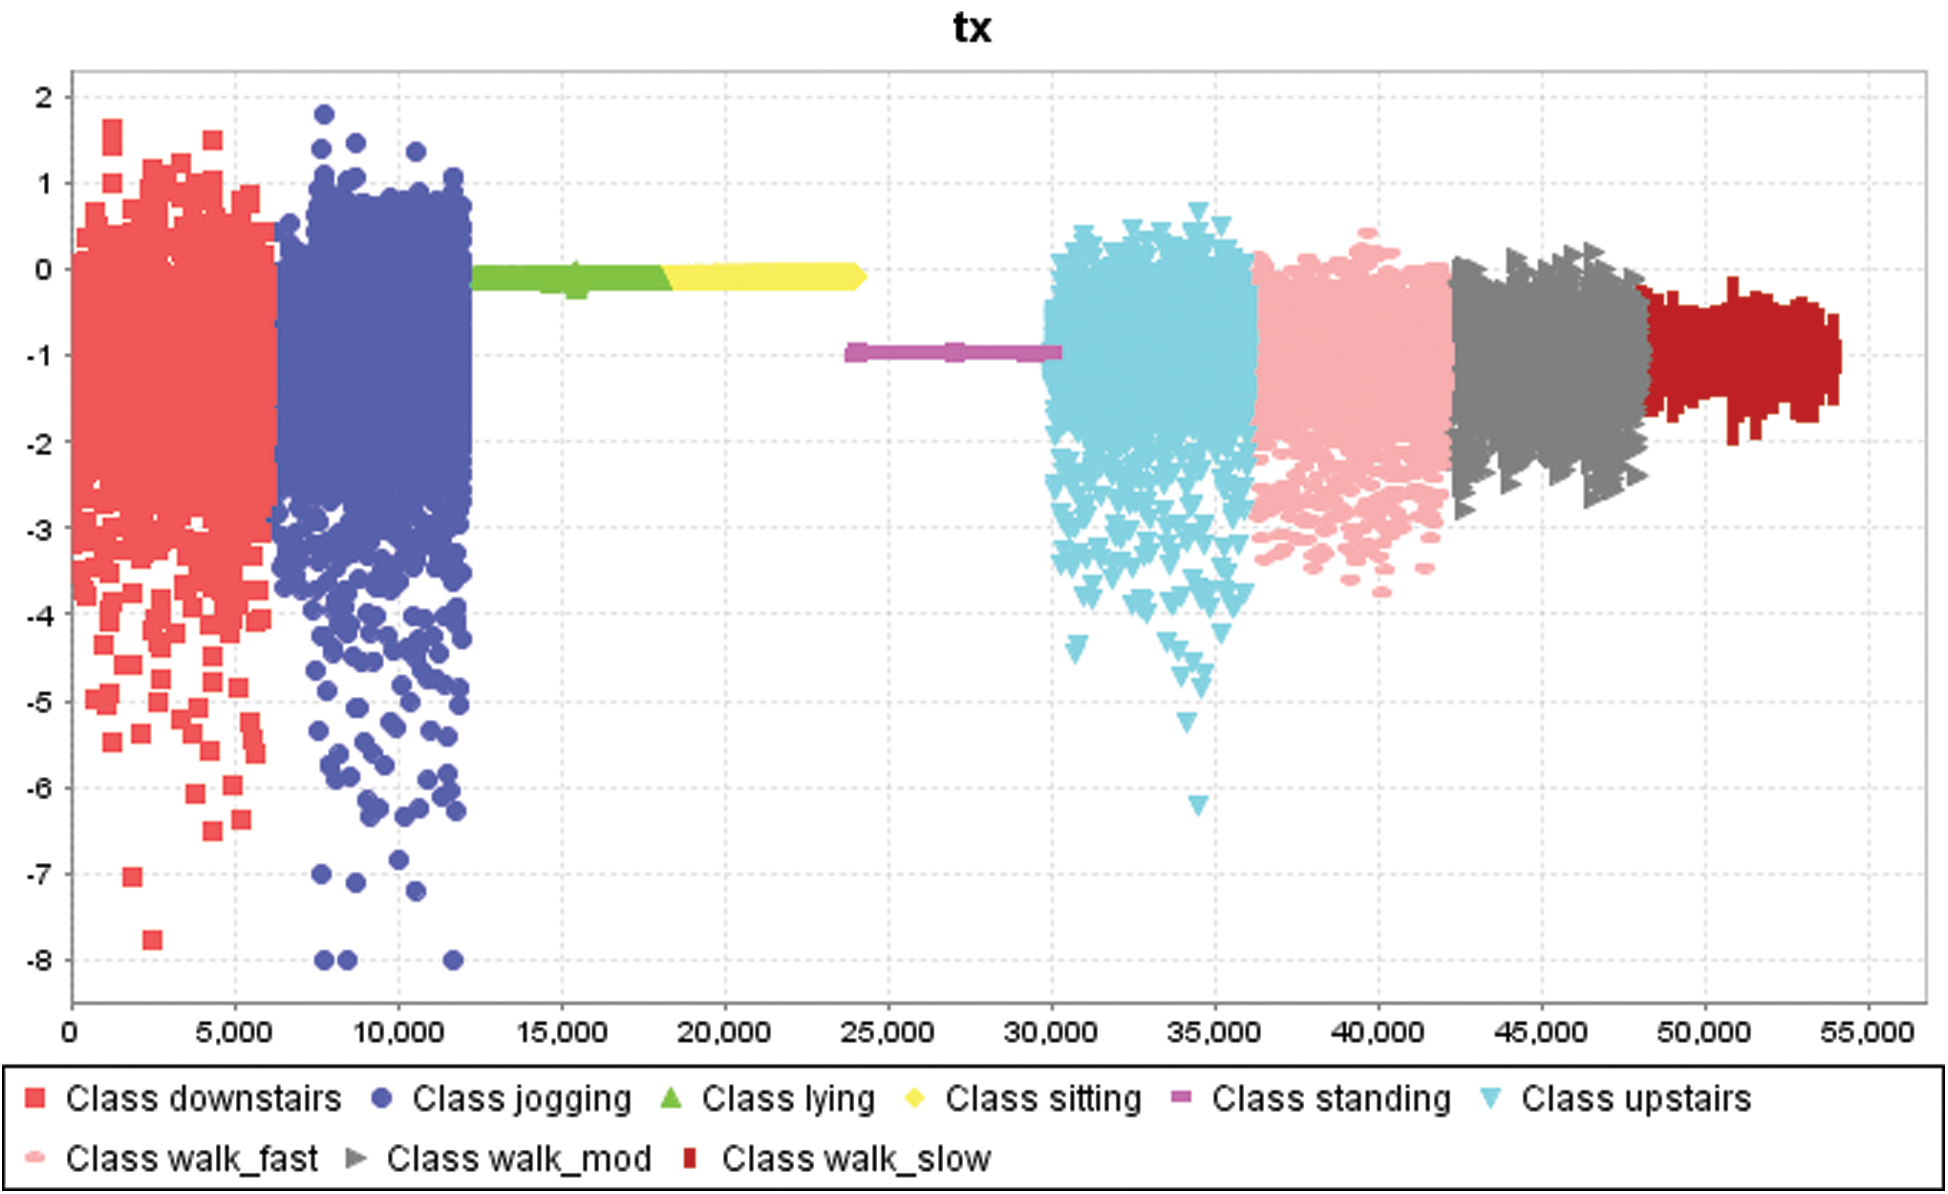
Figure 6: Class distribution in 3-axis accelerometer logging thigh x value
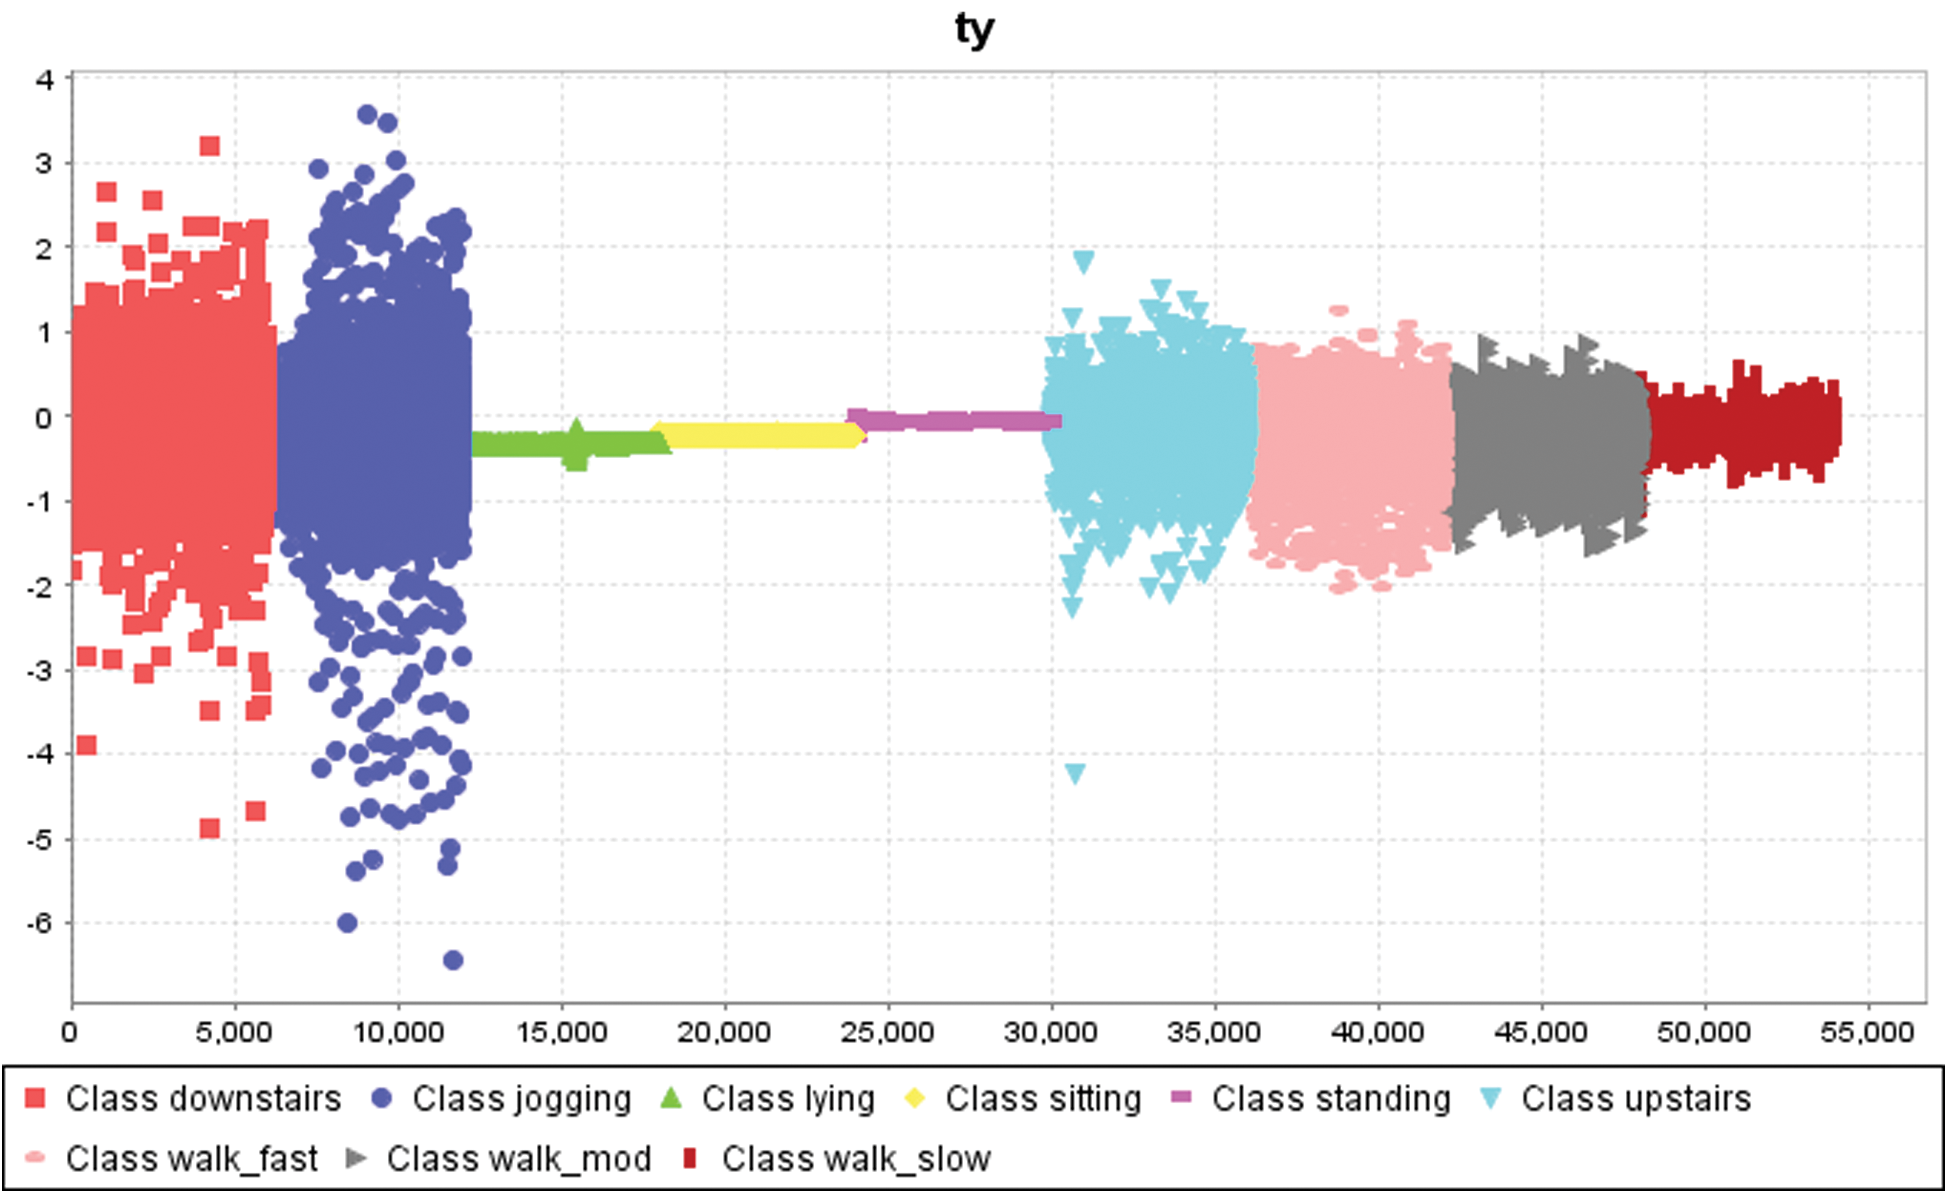
Figure 7: Class distribution in 3-axis accelerometer logging thigh y value
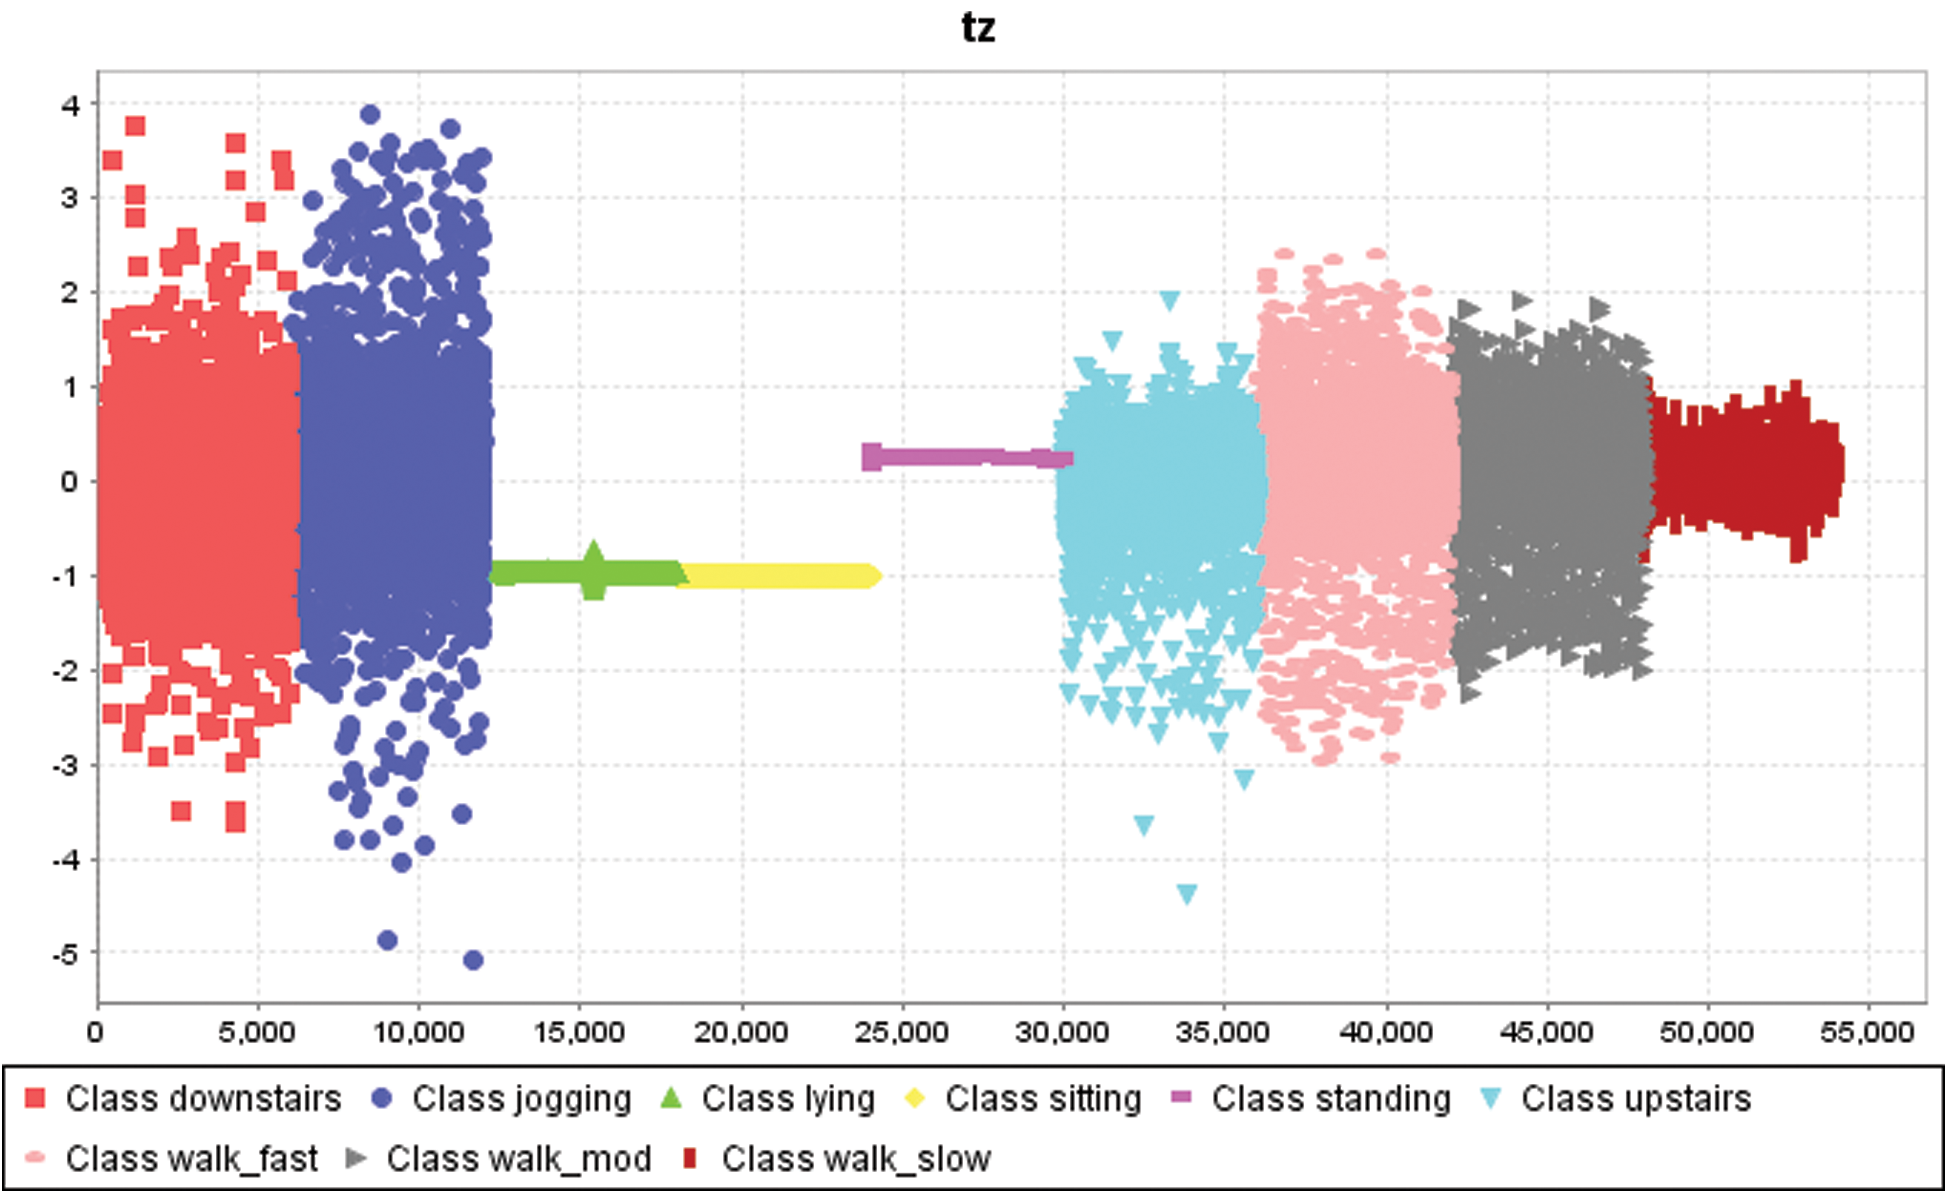
Figure 8: Class distribution in 3-axis accelerometer logging thigh z value
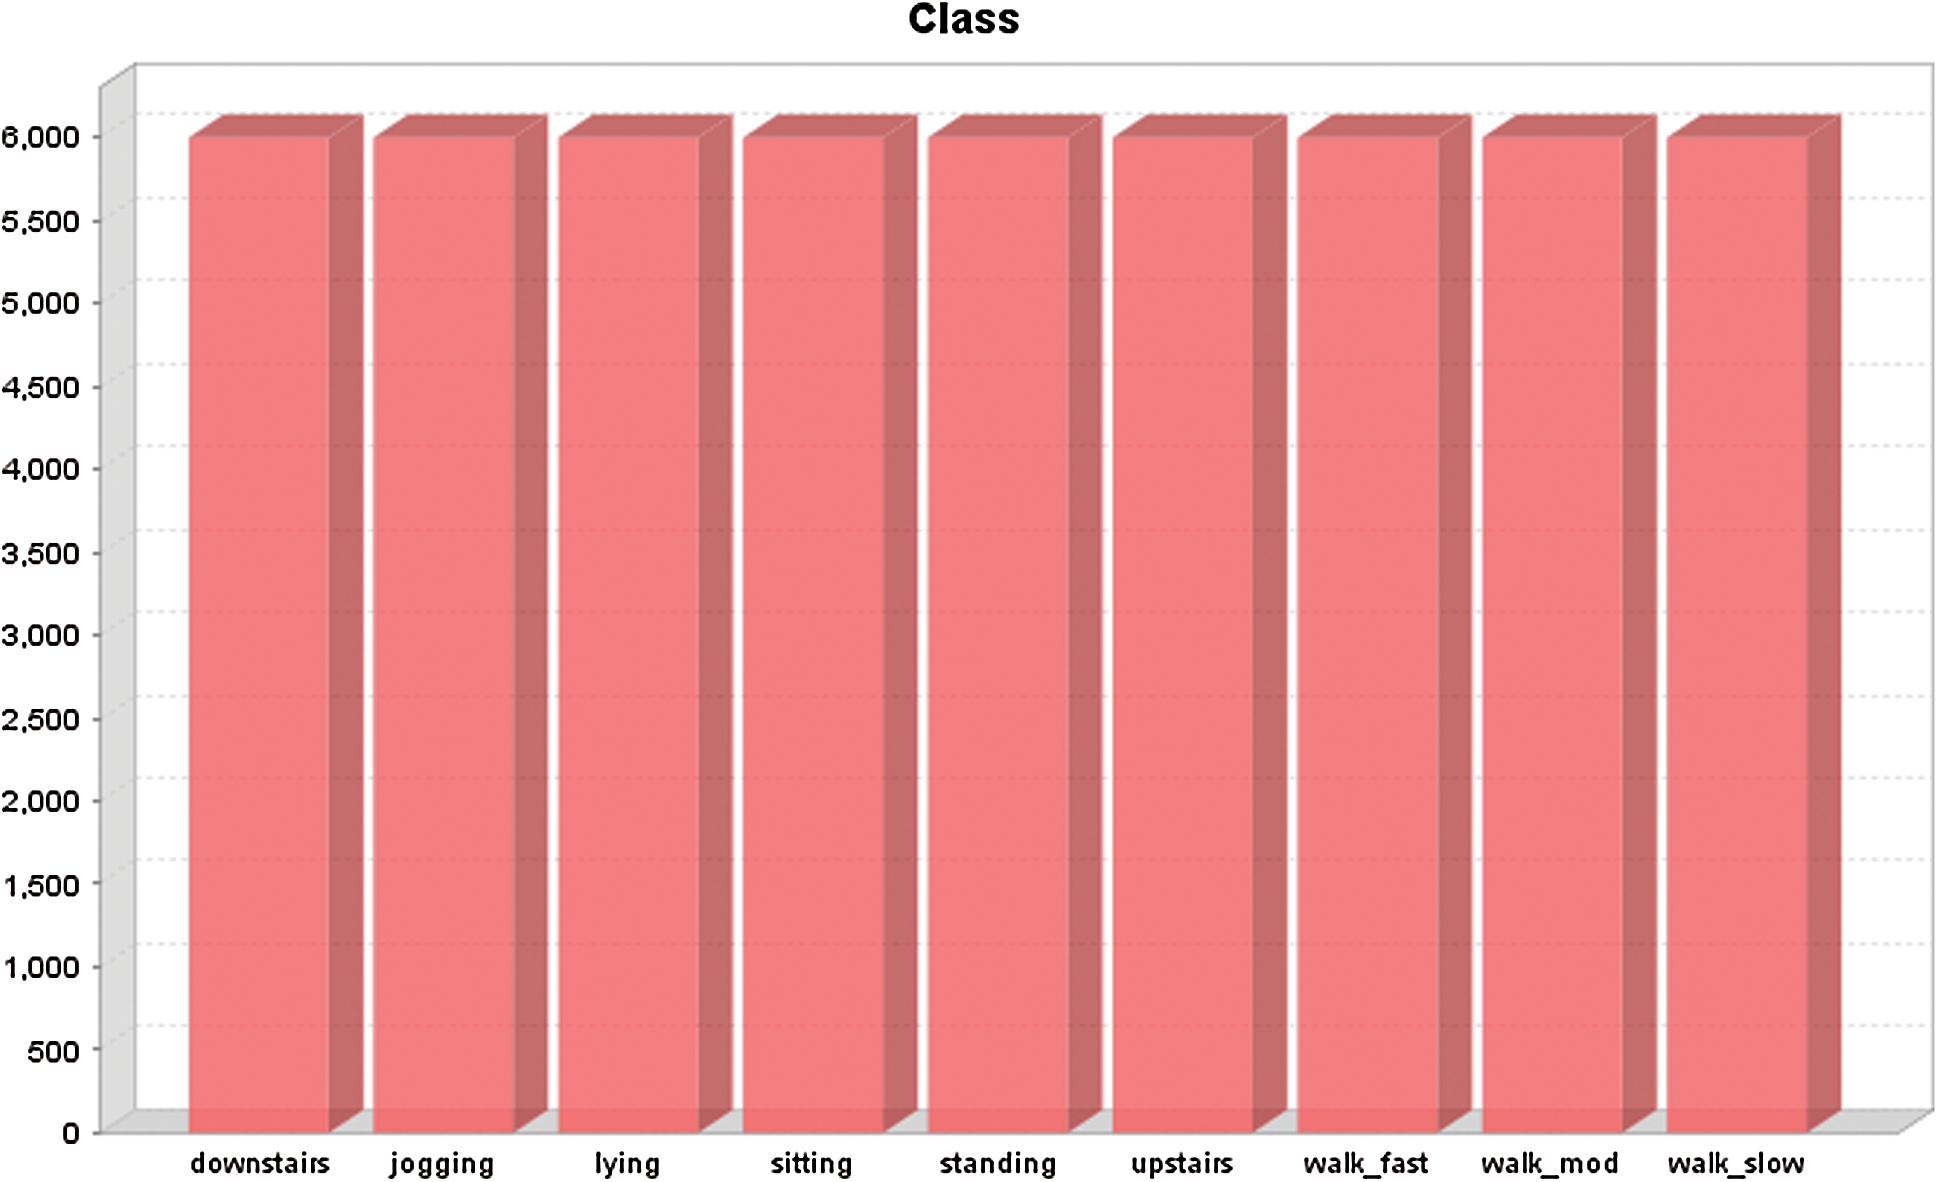
Figure 9: Class distribution in a dataset of a participant
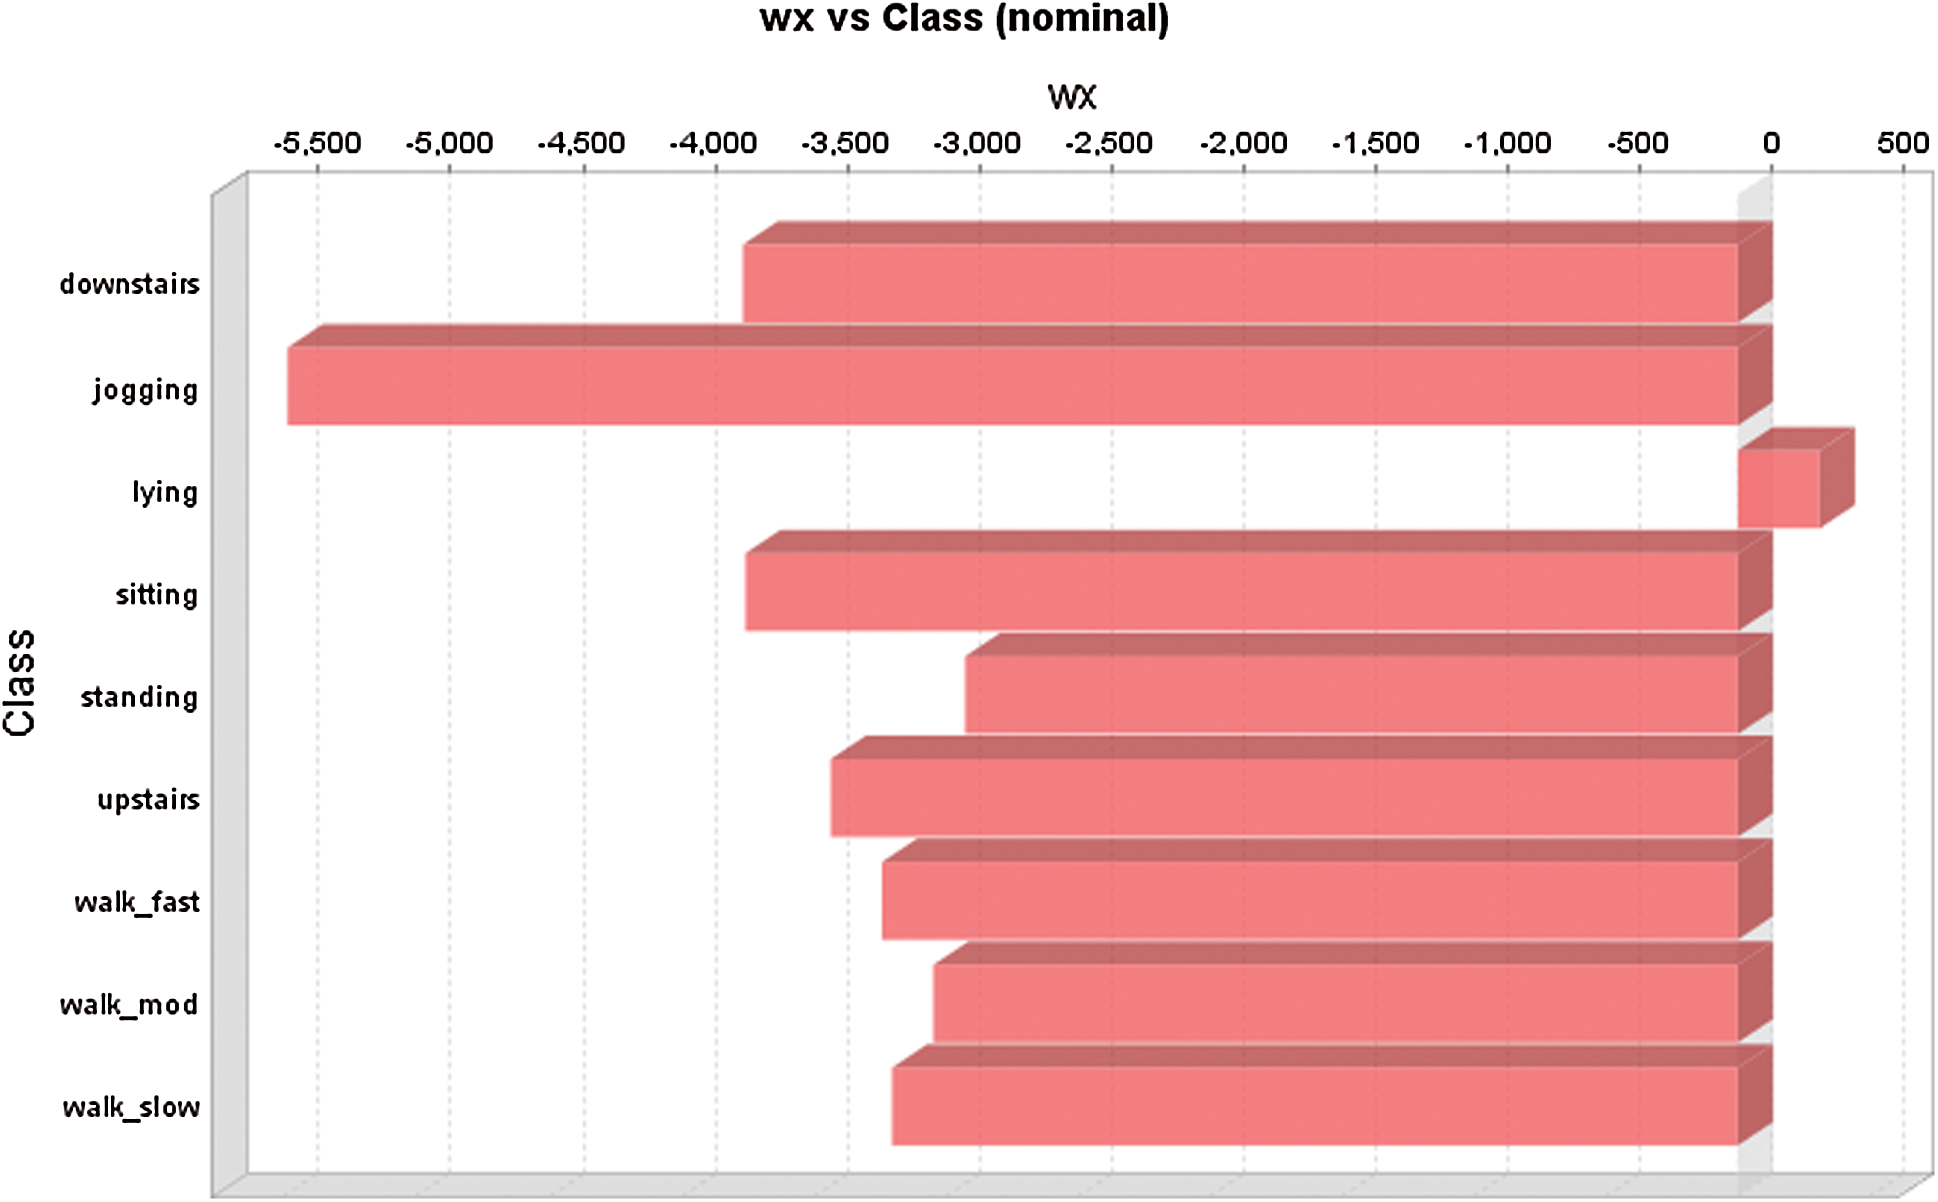
Figure 10: Class distribution with respect to 3-axis accelerometer logging wrist x value
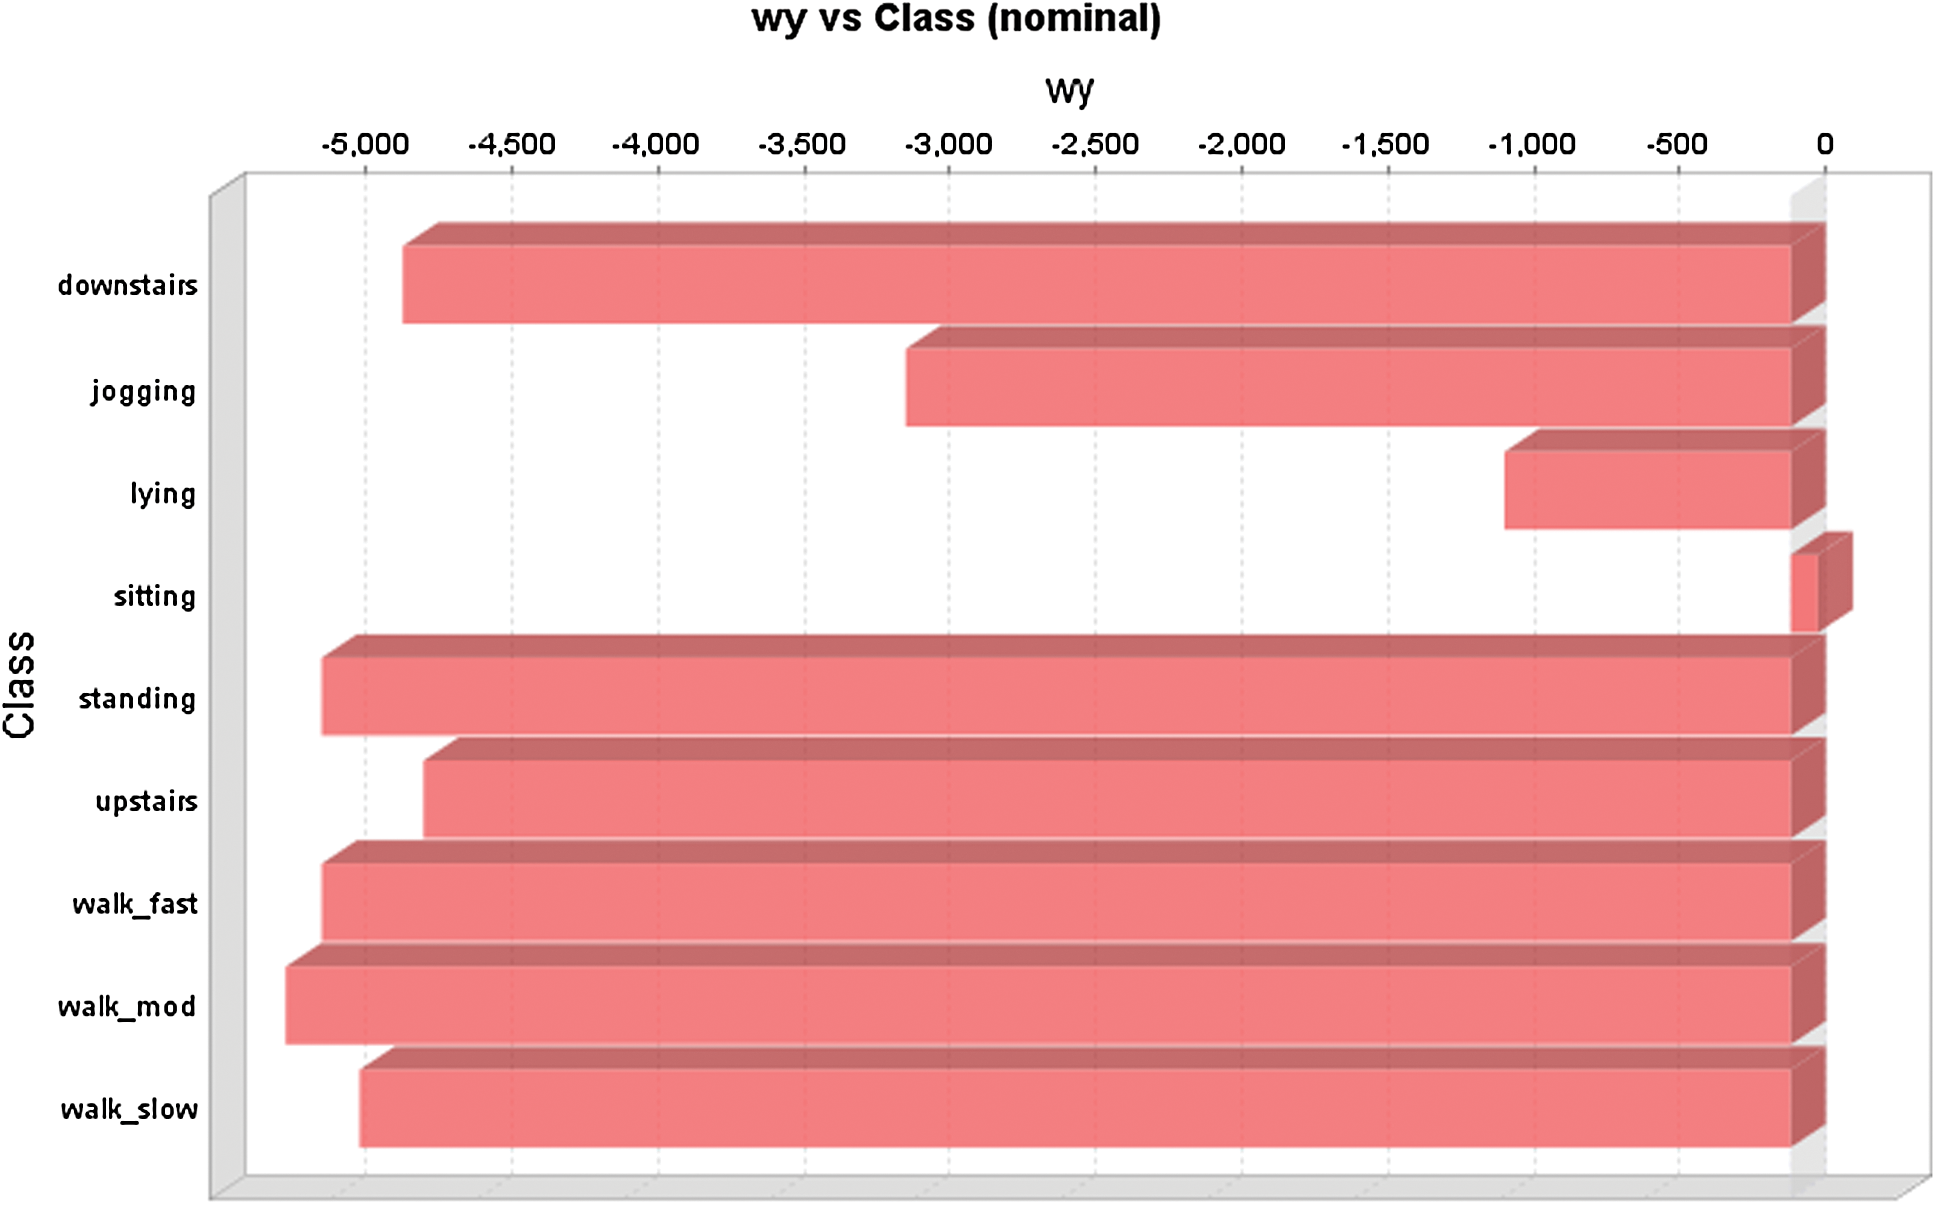
Figure 11: Class distribution concerning 3-axis accelerometer logging wrist y value
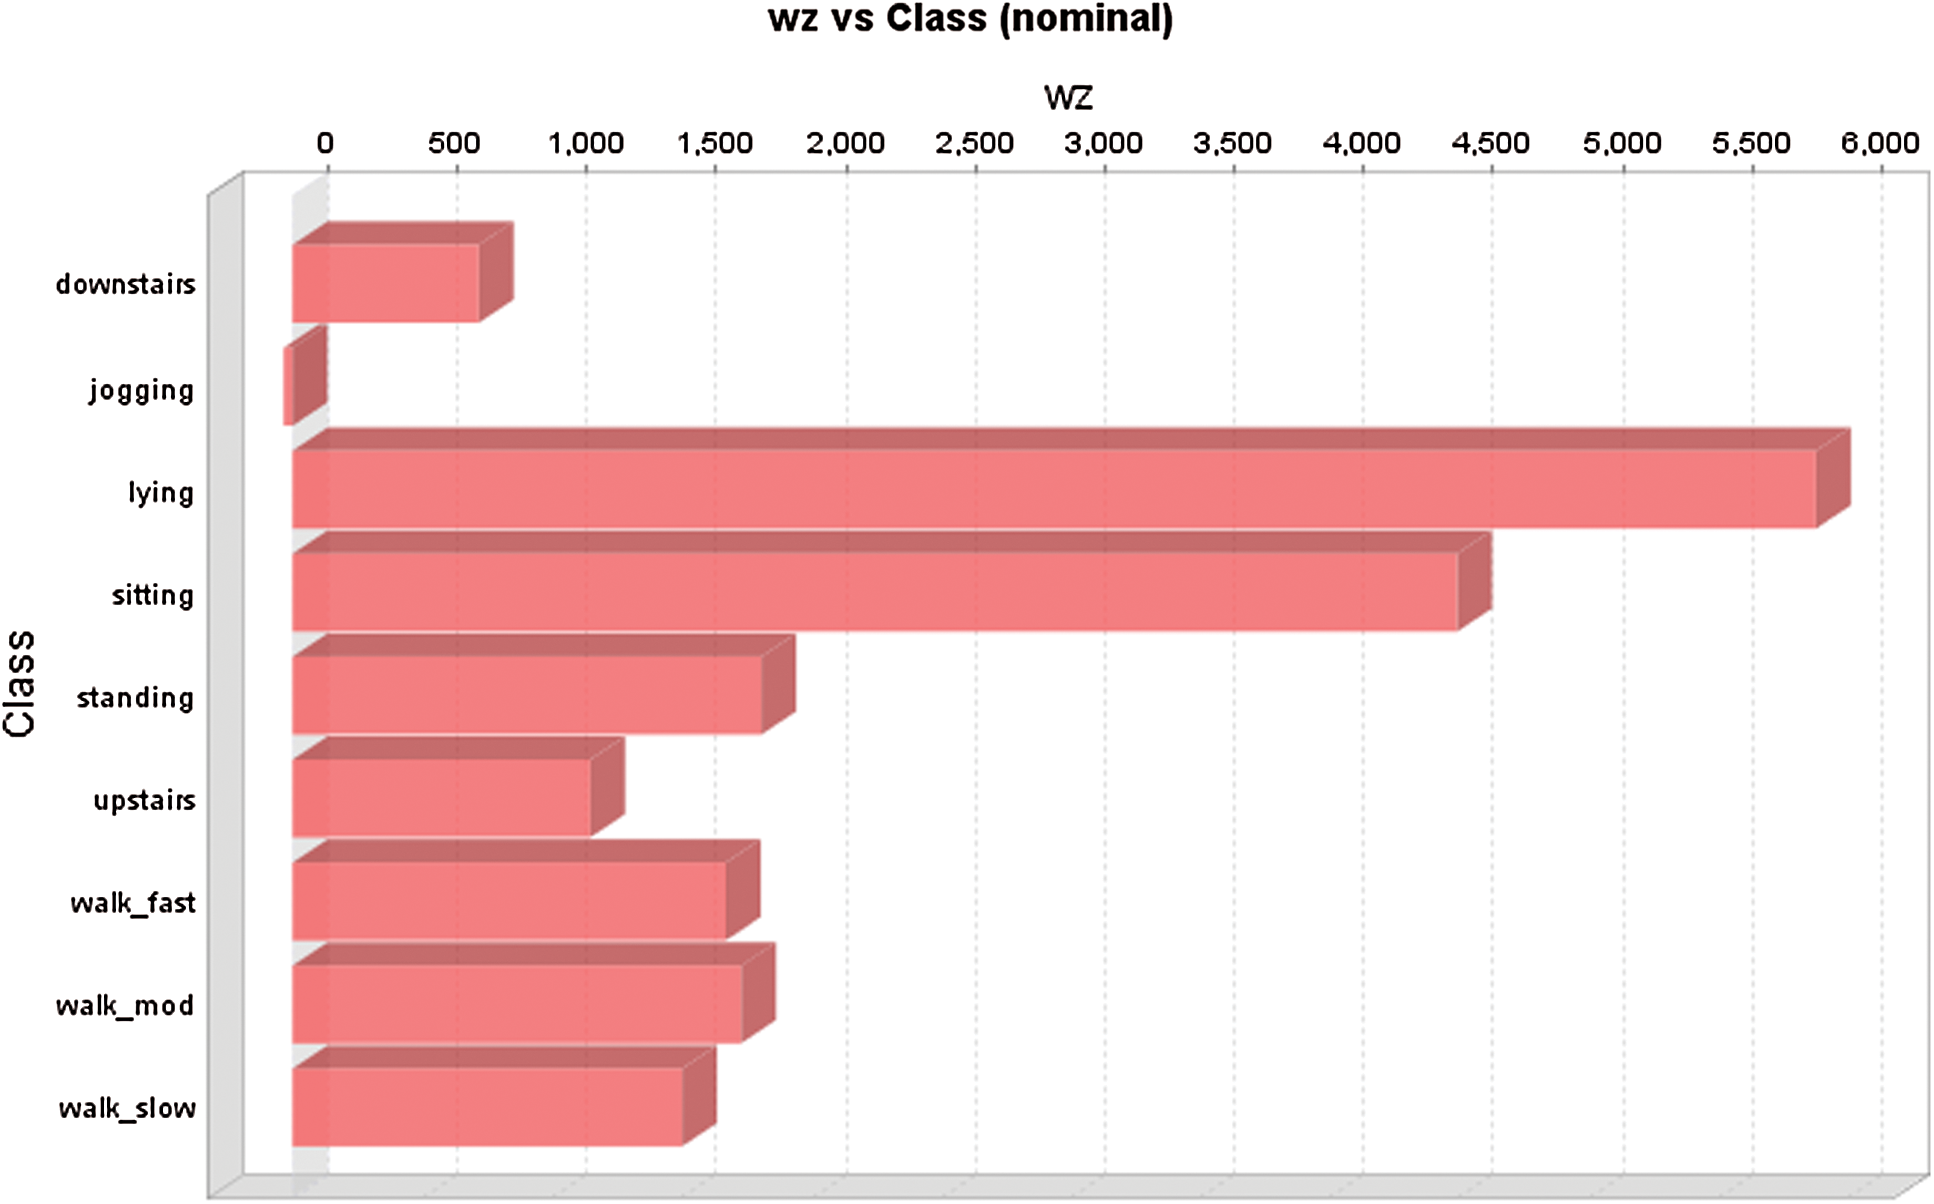
Figure 12: Class distribution concerning 3-axis accelerometer logging wrist z value
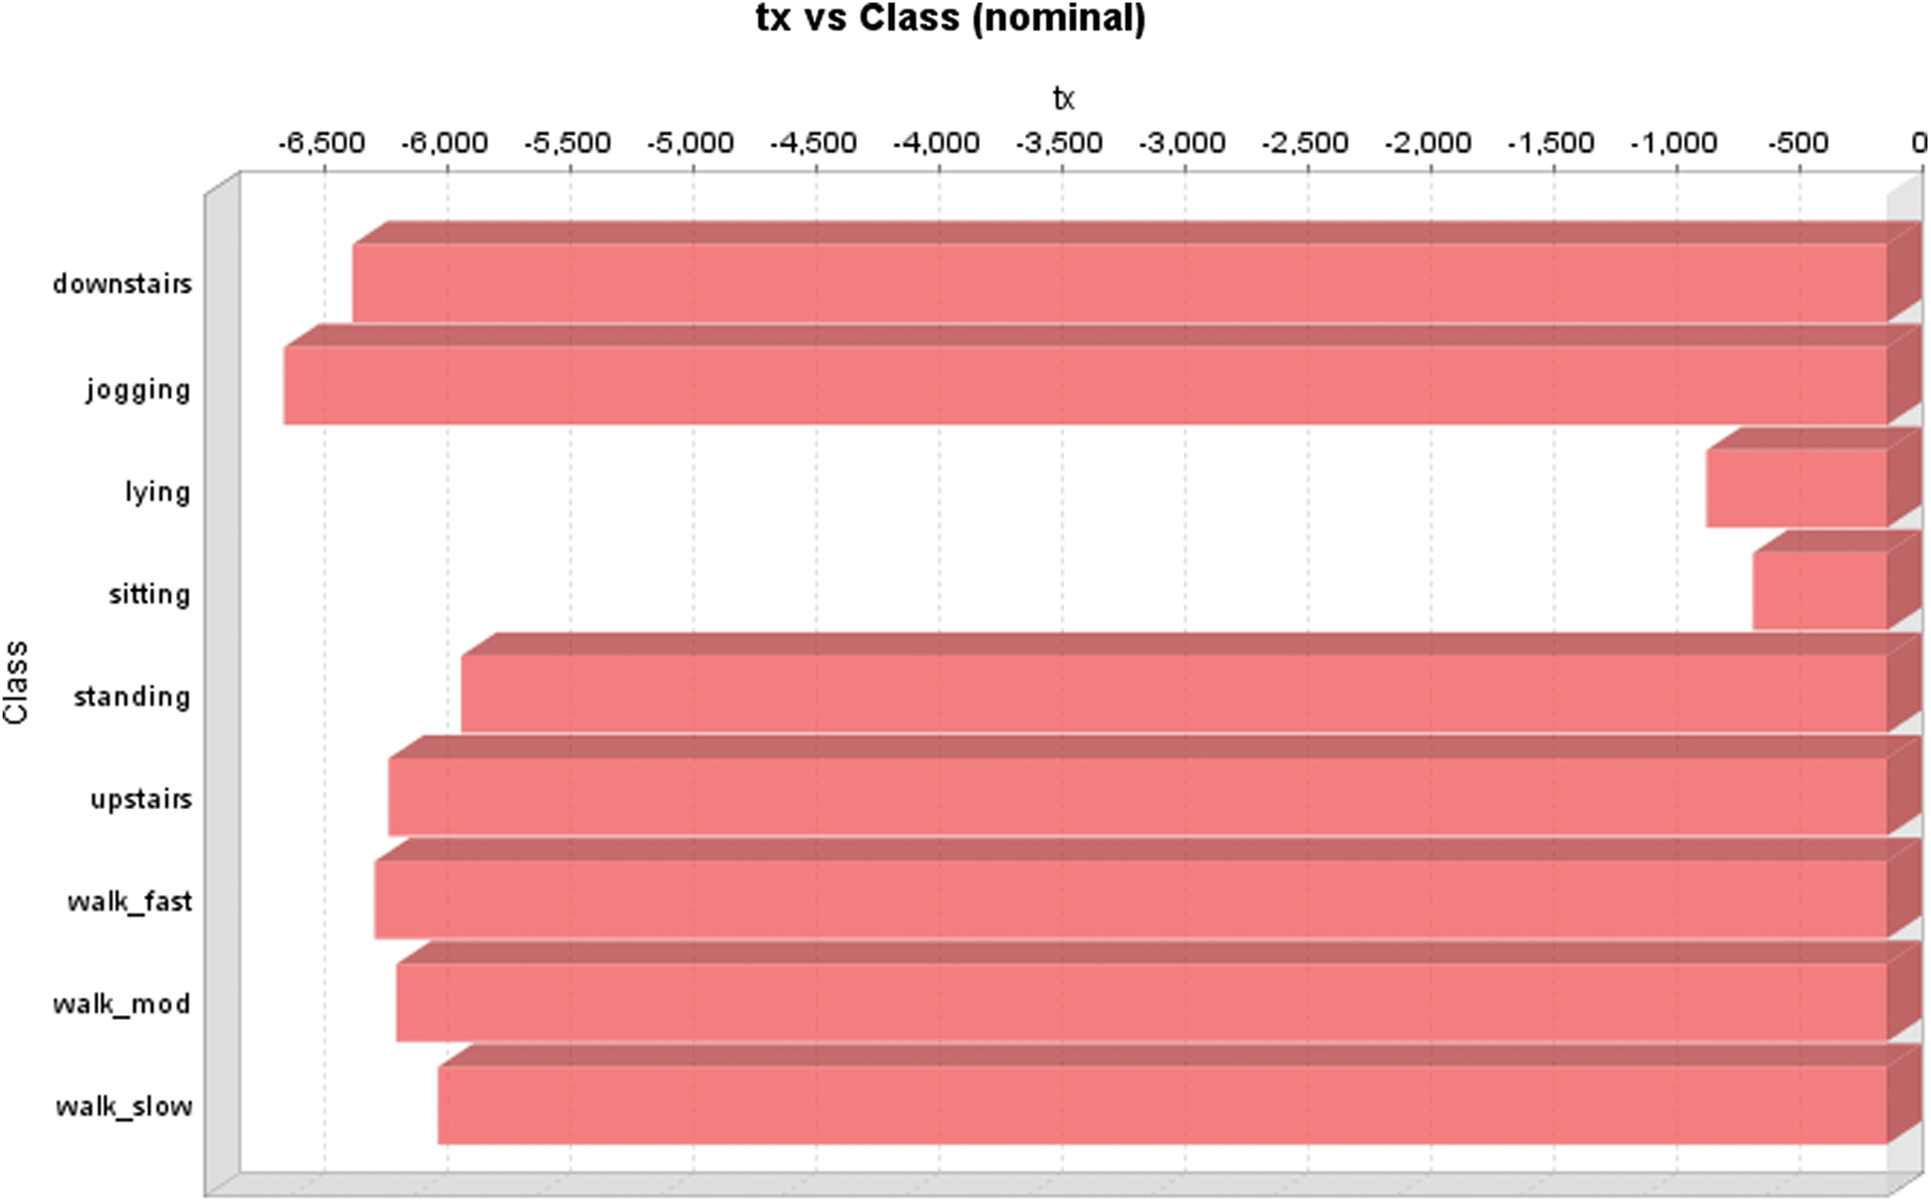
Figure 13: Class distribution concerning 3-axis accelerometer logging thigh x value
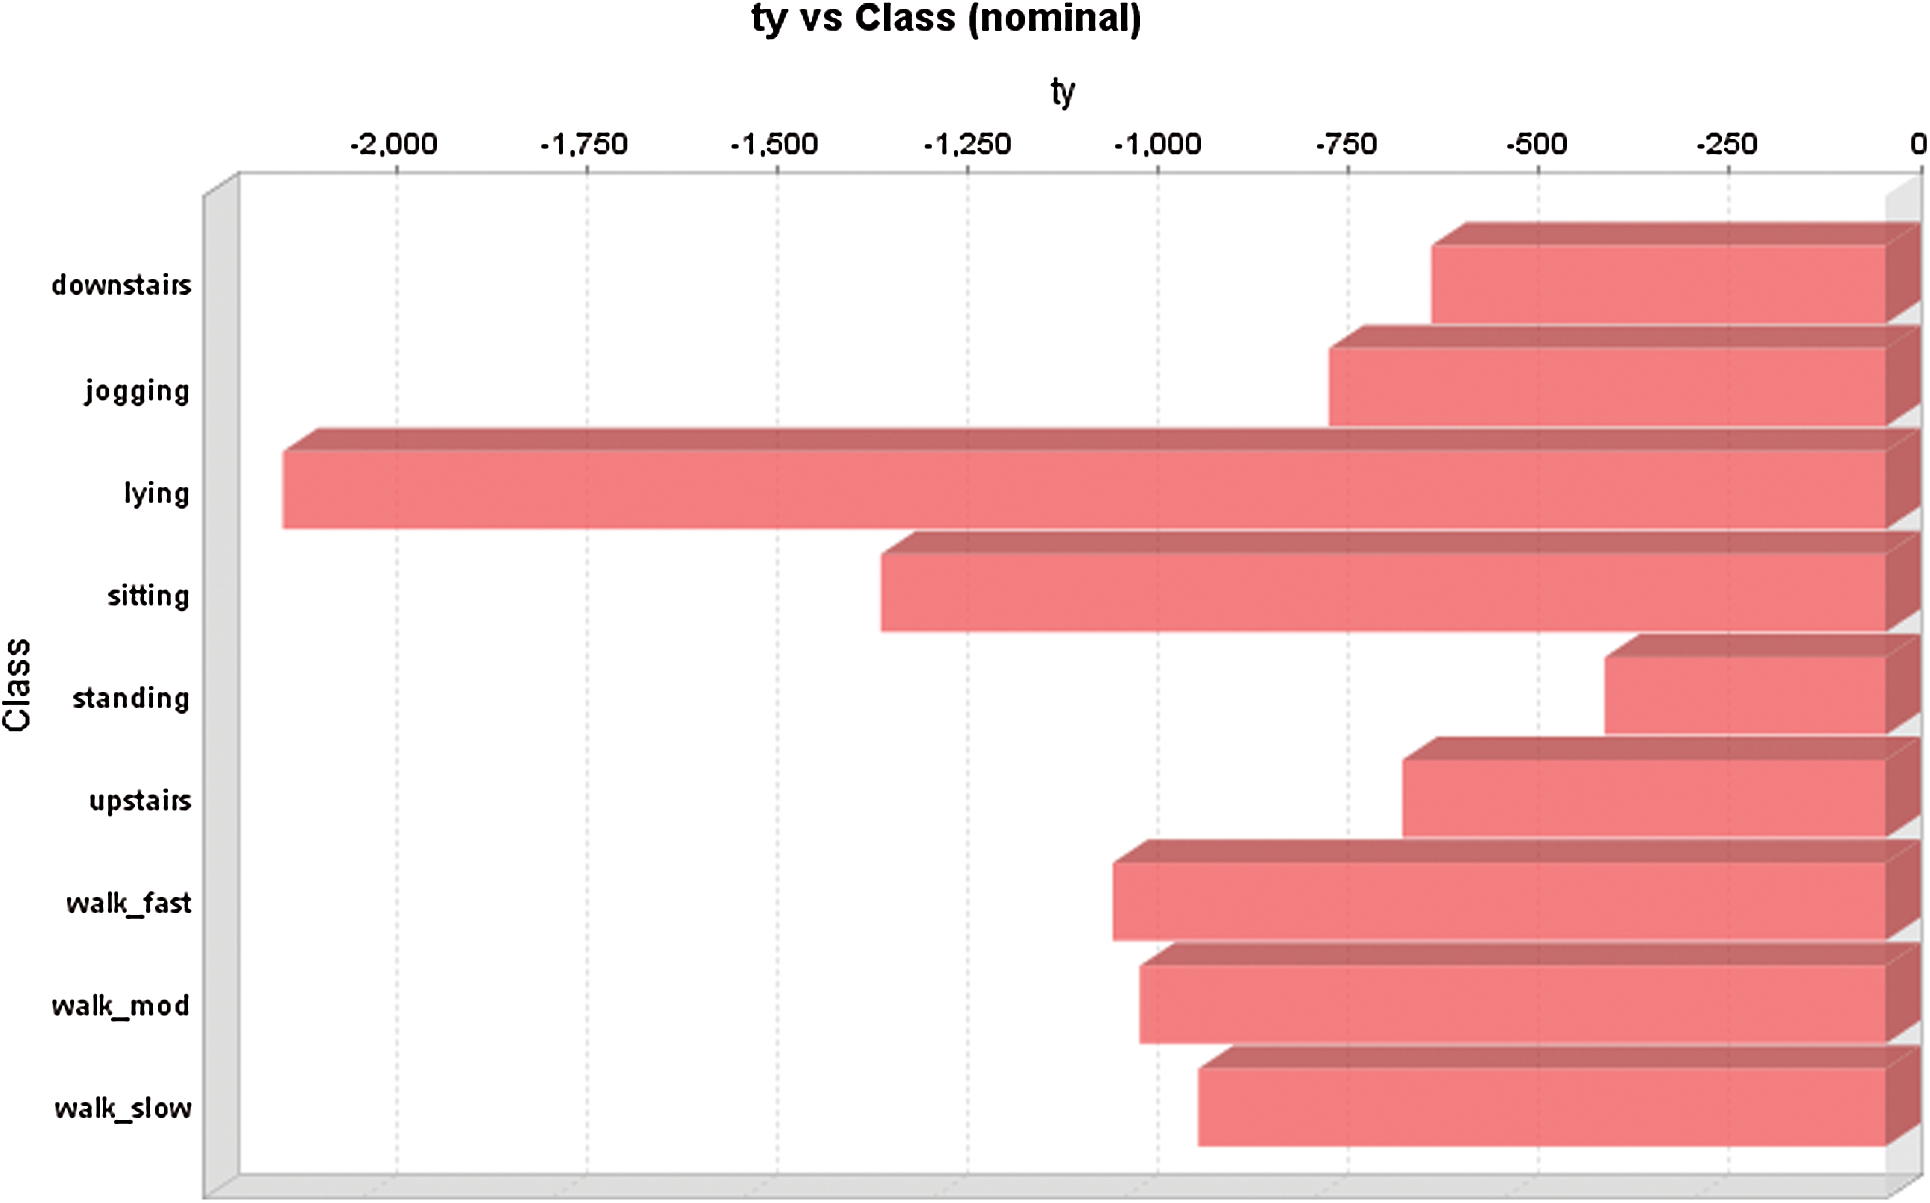
Figure 14: Class distribution concerning 3-axis accelerometer logging thigh y value
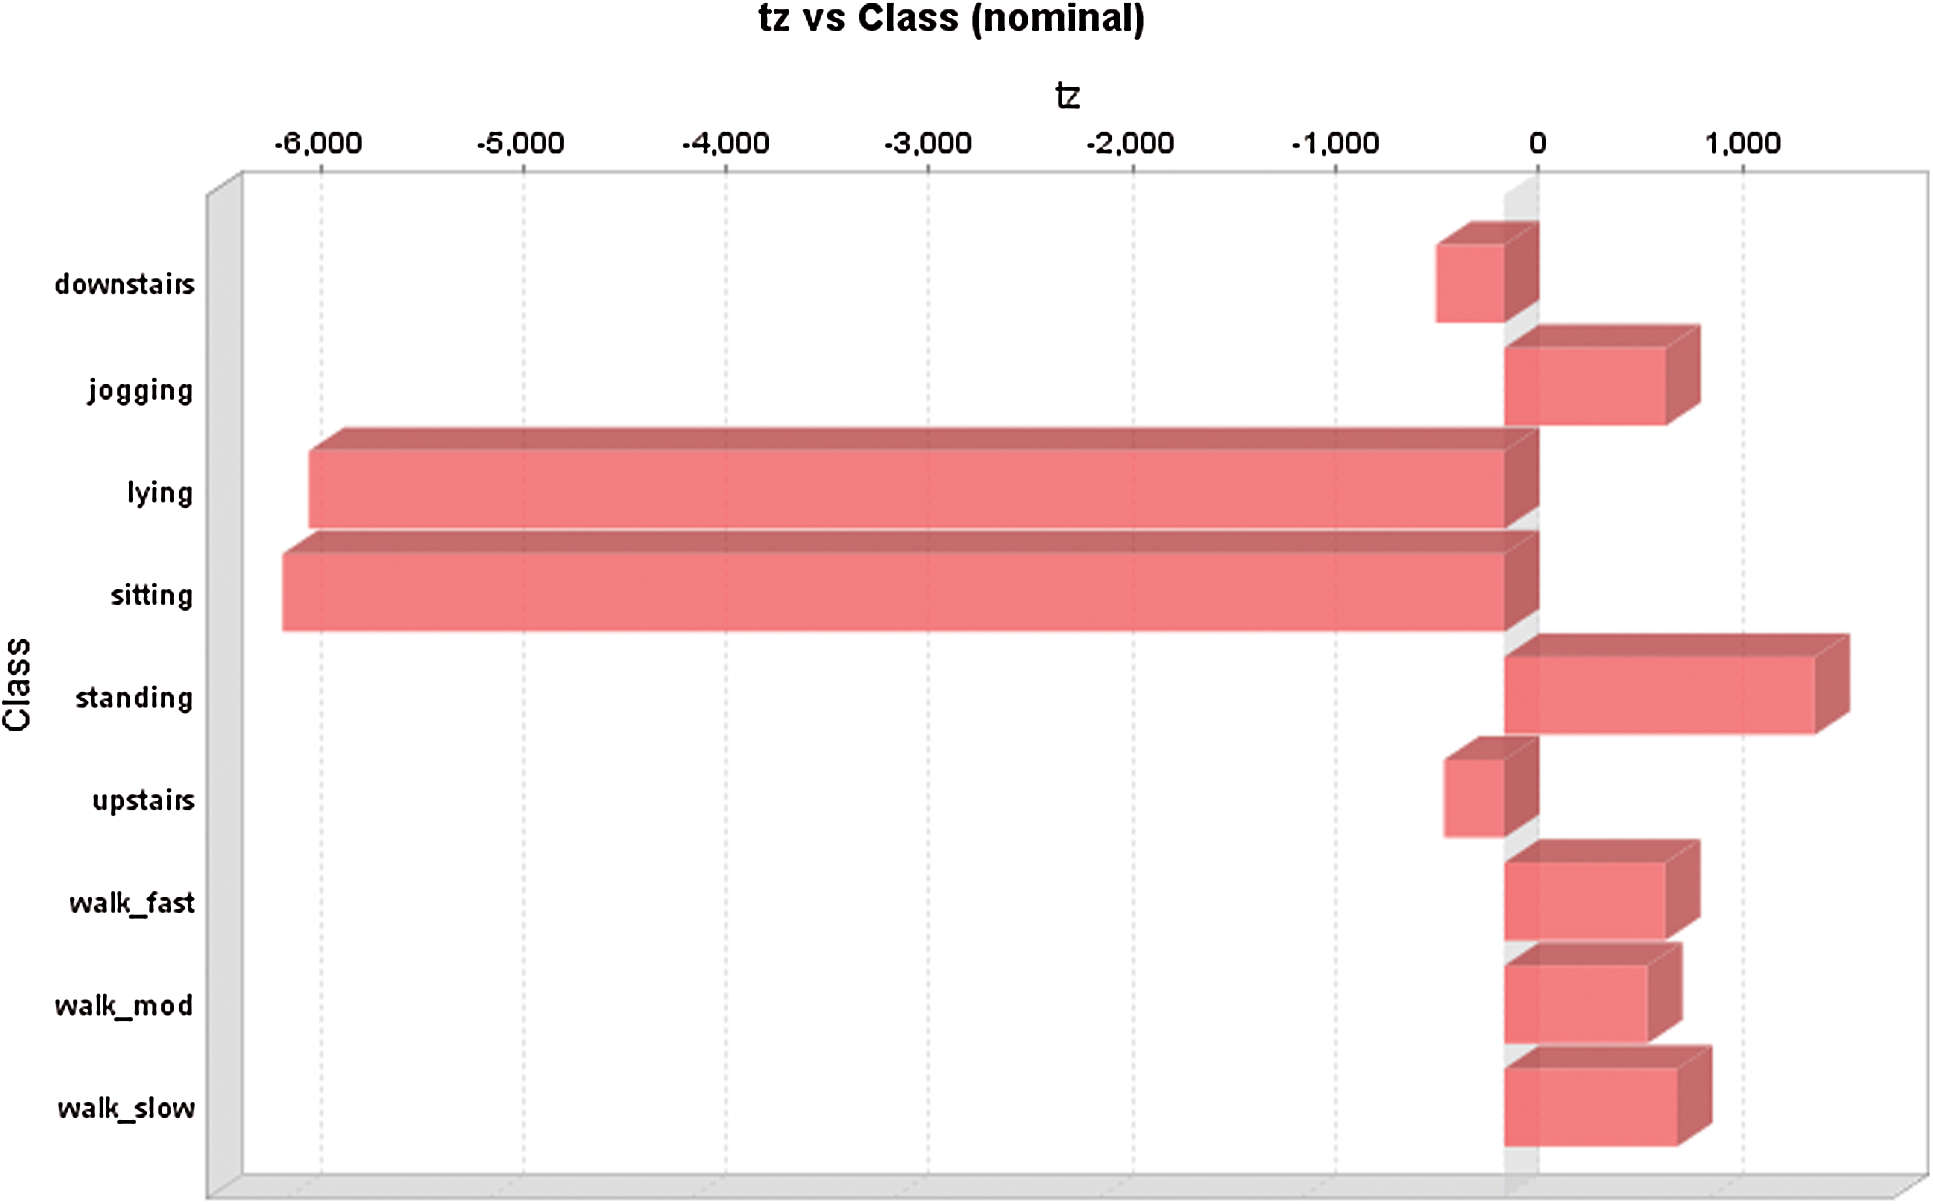
Figure 15: Class distribution concerning 3-Axis Accelerometer Logging thigh z value
Acknowledgement: The authors would like to express their heartfelt thanks to the editors and anonymous referees for their most valuable comments and constructive suggestions, which led to significant improvements in the earlier version of the manuscript.
Funding Statement: The authors extend their appreciation to the Deanship of Scientific research at Majmaah University for funding this work under project No. RGP-2019-26.
Conflicts of Interest: The authors declare that they have no conflicts of interest to report regarding the present study.
References
1R. Buchbinder, B. Blyth, L. Arch, P. Brooks, A. Woolf. (2013). et al., “Placing the global burden of low back pain in context. ,” Best Practice & Research: Clinical Rheumatology, vol. 27, no. (5), pp, 575–589, .
2Y. Tu, Y. Lin, J. Wang and J. U. Kim. (2018), “Semi-supervised learning with generative adversarial networks on digital signal modulation classification. ,” Computers, Materials & Continua, vol. 55, no. (2), pp, 243–254, . [Google Scholar]
3O. Lara and M. Labrador. (2013), “A survey on human activity recognition using wearable sensors. ,” Communications, Surveys & Tutorials, IEEE, vol. 15, no. (3), pp, 1192–1209, . [Google Scholar]
4M. Abel, J. Hannon, D. Mullineaux and A. Beighle. (2011), “Determination of step rate thresholds corresponding to physical activity intensity classifications in adults. ,” Journal of Physical Activity and Health, vol. 8, no. (1), pp, 45–51, . [Google Scholar]
5V. Ahanathapillai, J. D. Amor, Z. Goodwin and C. J. James. (2015), “Preliminary study on activity monitoring using an android smart-watch. ,” Healthcare Technology Letters, vol. 2, no. (1), pp, 34–39, . [Google Scholar]
6D. Figo, P. C. Diniz, D. R. Ferreira and J. M. Cardoso. (2010), “Preprocessing techniques for context recognition from accelerometer data. ,” Personal and Ubiquitous Computing, vol. 14, no. (7), pp, 645–662, . [Google Scholar]
7L. Gao, A. Bourke and J. Nelson. (2014), “Evaluation of accelerometer based multi-sensor versus single sensor activity recognition systems. ,” Medical Engineering & Physics, vol. 36, no. (6), pp, 779–785, .
8K. P. Jordan, U. T. Kadam, R. Hayward, M. Porcheret, C. Young. (2010). et al., “Annual consultation prevalence of regional musculoskeletal problems in primary care: An observational study. ,” BMC Musculoskeletal Disorders, vol. 11, no. (1), pp. 1–10, .
9U. Maurer, A. Smailagic, D. P. Siewiorek and M. Deisher. (2006), “Activity recognition and monitoring using multiple sensors on different body positions. ,” in Proc. Wearable and Implantable Body Sensor Networks, BSN: IEEE, pp, 4, . [Google Scholar]
10M. Shoaib, S. Bosch, O. D. Incel, H. Scholten and P. J. Havinga. (2014), “Fusion of smartphone motion sensors for physical activity recognition. ,” Sensors, vol. 14, no. (6), pp, 10146–10176, . [Google Scholar]
11P. Sharma and K. Saxena. (2017), “Application of fuzzy logic and genetic algorithm in heart disease risk level prediction. ,” International Journal of System Assurance Engineering and Management, vol. 8, no. (2), pp, 1109–1125, . [Google Scholar]
12Y. Zheng, W. K. Wong, X. Guan and S. Trost. (2013), “Physical activity recognition from accelerometer data using a multi-scale ensemble method. ,” AAAI’13: Proc. of the Twenty-Seventh AAAI Conf. on Artificial Intelligence, pp. 1575–1581, . [Google Scholar]
13S. Sani, N. Wiratunga, S. Massie and K. Cooper. (2016), “SELFBACK-activity recognition for self-management of low back pain. ,” in Proc. ICITAAI, Cham: Springer, pp, 281–294, . [Google Scholar]
14A. Mannini, S. S. Intille, M. Rosenberger, A. M. Sabatini and W. Haskell. (2013), “Activity recognition using a single accelerometer placed at the wrist or ankle. ,” Medicine and Science in Sports and Exercise, vol. 45, no. (1), pp, 2193–2207, . [Google Scholar]
15P. Sharma, K. Saxena and R. Sharma. (2015), “Diabetes mellitus prediction system evaluation using C4.5 rules and partial tree. ,” in Proc. 4th ICRITO, India: IEEE, pp, 1–6, . [Google Scholar]
16R. Samikannu, R. Ravi, S. Murugan and B. Diarra. (2020), “An efficient image analysis framework for the classification of glioma brain images using CNN approach,” Computers, Materials & Continua, vol. 63, no. (3), pp, 1133–1142, . [Google Scholar]
17D. Morariu, R. Creţulescu and M. Breazu. (2017), “The weka multilayer perceptron classifier. ,” International Journal of Advanced Statistics and IT&C for Economics and Life Sciences, vol. 7, no. (1), [Google Scholar]
18F. Wang, L. L. Zhang, S. W. Zhou and Y. Y. Huang. (2019), “Neural network-based finite-time control of quantized stochastic nonlinear systems. ,” Neurocomputing, vol. 362, pp, 195–202, . [Google Scholar]
19T. M. Li, H. C. Chao and J. M. Zhang. (2019), “Emotion classification based on brain wave: A survey. ,” Human-Centric Computing and Information Sciences, vol. 9, no. (1), pp, 550, . [Google Scholar]
20Y. T. Chen, J. J. Tao, L. Y. Liu, J. Xiong, R. L. Xia. (2020). et al., “Research of improving semantic image segmentation based on a feature fusion model. ,” Journal of Ambient Intelligence and Humanized Computing, [Google Scholar]
21F. Yu, L. Liu, L. Xiao, K. L. Li and S. Cai. (2019), “A robust and fixed-time zeroing neural dynamics for computing time-variant nonlinear equation using a novel nonlinear activation function. ,” Neurocomputing, vol. 350, pp, 108–116, . [Google Scholar]
22W. Wang, Y. T. Li, T. Zou, X. Wang, J. Y. You. (2020). et al., “A novel image classification approach via Dense-MobileNet models. ,” Mobile Information Systems, vol. 2020, pp, 1–8, . [Google Scholar]
 | This work is licensed under a Creative Commons Attribution 4.0 International License, which permits unrestricted use, distribution, and reproduction in any medium, provided the original work is properly cited. |