DOI:10.32604/cmc.2020.011937
| Computers, Materials & Continua DOI:10.32604/cmc.2020.011937 | |
| Article |
Nonlinear Time Series Analysis of Pathogenesis of COVID-19 Pandemic Spread in Saudi Arabia
1College of Computer and Information Sciences, Majmaah University, Majmaah, 11952, Saudi Arabia
2Maharaja Agrasen Institute of Technology, Guru Gobind Singh Indraprastha University, Delhi, 110086, India
3Non-Linear Dynamics Research Laboratory, GGS Indraprastha University, Delhi, 110078, India
*Corresponding Author: Shivam Bhardwaj. Email: bhardwajshivam2kk@gmail.com
Received: 06 June 2020; Accepted: 11 July 2020
Abstract: This article discusses short–term forecasting of the novel Corona Virus (COVID-19) data for infected and recovered cases using the ARIMA method for Saudi Arabia. The COVID-19 data was obtained from the Worldometer and MOH (Ministry of Health, Saudi Arabia). The data was analyzed for the period from March 2, 2020 (the first case reported) to June 15, 2020. Using ARIMA (2, 1, 0), we obtained the short forecast up to July 02, 2020. Several statistical parameters were tested for the goodness of fit to evaluate the forecasting methods. The results show that ARIMA (2, 1, 0) gave a better forecast for the data system. COVID 19 data followed quadratic behavior, and in the long run, it spreads with a high peak. It is concluded that COVID-19 will follow secondary shock waves, and it is strongly advisable to maintain social distancing with all safety measures as the pandemic situation is not in control.
Keywords: COVID-19; short-term forecast; ARIMA; GIS
Coronaviruses (CV) are RNA viruses that are respiratory pathogens. Coronavirus transmission is defined as zoonotic, i.e., between animals and people. They can cause benign seasonal illnesses like common cold as well as more severe public health emergencies like Middle East Respiratory Syndrome (MERS) and Severe Acute Respiratory Syndrome (SARS). However, the new strain of Coronavirus disease identified in 2019 has been reported for the first time in human beings [1]. The first case of COVID-19 was declared on December 31, 2019, in Wuhan, China, with several cases of ‘pneumonia due to unknown causes’ following in quick succession, marking the outbreak of the novel coronavirus disease. In a few weeks, the virus spread rapidly throughout China and worldwide. The Chinese authorities had to lock down Wuhan on January 23, 2020, to contain the viral transmission, but by that time, approximately 5 million persons had already left Wuhan [2,3] with an estimated reproduction number >1 (range 2.6–4.7), early reports predicted a potential Coronavirus outbreak [4]. This novel Coronavirus was named COVID-19 by WHO on February 11, 2020.
Healthcare systems require an important prediction for disease to handle the corona pandemics and help others in finding recommendations in daily life to keep away from its spread. As per [5], the problem of two-layer nonlinearity coupled multiplex network problems with the application of Lyapunov stability theory has been proposed. The results verified by theoretical and numerical simulation are feasible and effective. The time-variant nonlinear equations have been solved to achieve faster convergence, which is independent of the initial states of the models [6]. The errors and nonlinearities in finite–time stability reduce by adopting the approximation ability of neural networks [7]. Recently, the paper [8] proposed an artificial intelligence to provide resource allocation and decision making the administrative authorities. The models also help to identify the critical cases based on the pathological reports but a limited size of 53 cases. The results have a high degree of accuracy.
Coronaviruses (CV) are RNA viruses that are respiratory pathogens. The first report of five hospitalized patients with pneumonia was on December 29, 2019. The numbers kept rising to 41 cases (January 2, 2020), 571 cases (January 22, 2020), 1975 cases (January 25, 2020) and 7734 cases (January, 30 2020), with a worldwide spread that included countries from Asian, European, North American and Australian continents. By February 7, 2020, a total of 31,161 peoples were reportedly infected, with more than 630 deaths in China alone [9]. The first 100,000 confirmed cases occurred in 3 months, but the next 100,000 happened only in the next 12 days [9]. On January 30, 2020, WHO declared COVID-19 as a public health emergency of international concern (PHEIC) [4]. As of June 04, 2020, WHO estimates 6,416,828 confirmed cases of COVID-19, including 382,867 deaths reported from 176 countries [10]. The total number of confirmed cases is rapidly rising, as reported by WHO (Fig. 1).
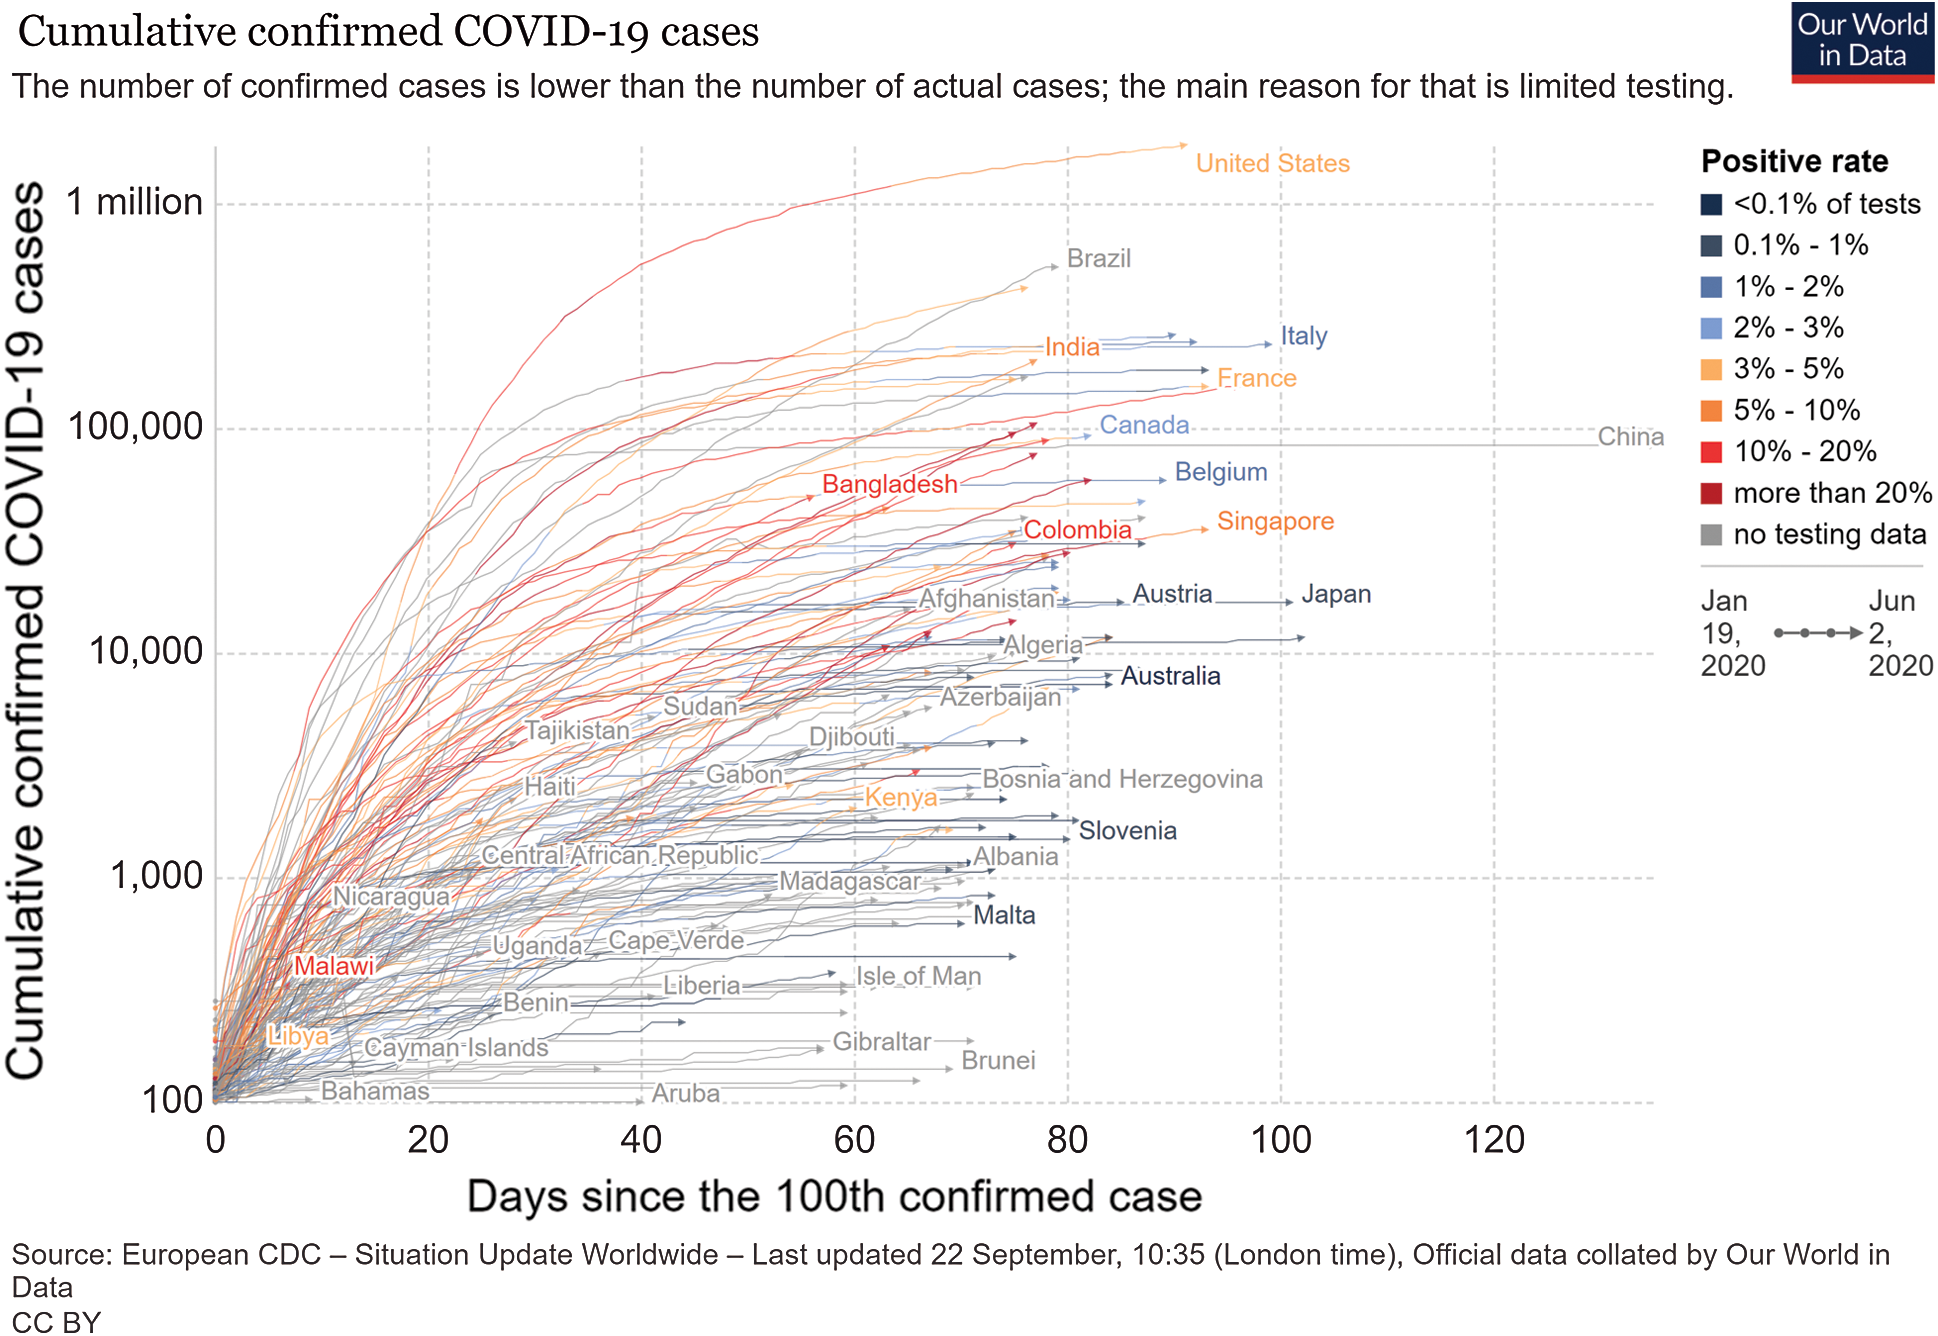
Figure 1: COVID-19 worldwide epidemic curve as reported by WHO
Coronavirus transmission is zoonotic, and once it enters human beings, person to person transmission takes over. Phylogenetic analysis implies that the COVID-19 is linked to the beta coronavirus genus, which attacks bats, human and certain wild mammal species [11]. Epidemiological investigations attributed SARS–CoV & MERS–CoV reservoirs to be civet cats and dromedary camels, respectively. However, possible animal sources of COVID-19 are under investigation. The first cases were found in a local wet market in Wuhan. Later, human-to-human spread occurred within families and among people with no history of contact to the wet animal market [12]. The transmission happens with direct contact or by droplets of coughing or sneezing from the infectious person. The human cellular receptor has been identified as angiotensin-converting enzyme 2 (ACE2) receptors, which bind to the SARS–CoV receptor-binding domain [13]. A study on nine pregnant women in their third trimesters found no evidence of vertical transmission to newborns [14]. Studies have estimated that the developing period of the virus lies within the range of one to fourteen days, with a median of five days. For 1,099 confirmed symptomatic patients, four days was the median lubrication period with two to seven days as the interquartile range [15]. WHO’s China fact–finding mission found that in Wuhan, the case-fatality rate was around 5.8%, as compared to 0.7% in the rest of China. One study calculated it to be at 2.2% [4]. Droplet transmission has been described as the primary mode of person to person transmission. These droplets are generated when an infected person coughs or exhales, which can either be inhaled by a nearby person or lands on nearby objects and surfaces. Others can then get infected by touching these surfaces and later touching their eyes, nose, or mouth. WHO & other health organizations’ ongoing research on COVID-19 transmission is underway and will divulge information on other environmental factors that contribute to it [10,15].
1.3 Symptomatology and Diagnoses
Asymptomatic infection is a possibility; however, its incidence is unknown. The risk of getting infected from an asymptomatic person is very low but possible. Many infected people experience mild symptoms, which include fever, fatigue, dry cough, anorexia, and myalgia. Fever is the most common symptom and can be present from the beginning or in later stages. Severe disease can present with dyspnea and pneumonia and may require hospital admission. Acute respiratory distress syndrome (ARDS) is a significant complication and can develop in a variable proportion of hospitalized patients, which may require mechanical ventilation. WHO reported that for the severely infected, the recovery time was three to six weeks whereas it was about two weeks for those with mild infections [15]. The criterion for suspicion of COVID-19 is prominent in patients suffering from fever and/or breathing problems (e.g., cough, dyspnea) with the following history in the last 14 days: either coming in close association with a confirmed or suspected COVID-19 case, including healthcare workers; residence in or travel to hotspot areas (e.g., China, South Korea, most of Europe [including Italy, Iran, Japan]) and potential exposure by attending events where COVID-19 cases have been reported. Centers for Disease Control and Prevention [CDC] endorses the collection of a nasopharyngeal swab specimen or sputum specimen (in patients with productive cough) to test for SARS–CoV–2. Diagnostic RNA sequence is detected by reverse-transcription polymerase chain reaction (RT–PCR) [16].
1.4 Prescribed Precautions & Containment Measures
The current coronavirus has higher transmissibility between people as compared to SARS–CoV–1, which is less adapted to humans. Thus, while it caused severe infection, it was not very easily transmissible from one person to another. COVID-19 is mostly transmitted in hospitals and common places. Given the ease of transmission, this new coronavirus is transmitted mostly in the community and hence, requires stringent measures including social isolation. Measures taken for public welfare can delay the spread and dissemination of the virus. Actions such as sociable distancing, and travel-related interventions can forge an individual’s protection. As of now, we have no cure or proper treatment for COVID-19. WHO recommends a whole set of preventive measures to be taken at the individual and global level, which include [17].
1.Maintenance of personal & hand hygiene: Regularly washing with soap and water or with a hand rub (alcohol-based). Avoid touching nose, eyes, and mouth. Following good respiratory hygiene (covering face while coughing & sneezing)
2.Avoiding crowds & close contact with ill individuals (a minimum distance of 1–2 meters).
3.Mask to be worn only if you are symptomatic (especially coughing) or are looking after a confirmed case of COVID-19.
4.Surface disinfection: Regular cleaning with disinfectant to kill the virus
5.Screening: At international checkpoints; people with symptoms suspicious of COVID-19 to be forbidden travel
6.Stay home in case you feel ill. If having a cough, difficulty breathing, or fever, seek medical attention.
7.Preventive measures, especially for those who have recently visited or are in a hotspot zone areas in the last 14 days. Home isolation for even in mild symptoms, until recovery.
The first case in Saudi Arabia was reported on March 2, 2020. The data up to June 18, 2020 were taken into consideration and based on short-term forecasting techniques the intensity of the pandemic was estimated up to July 02, 2020.
The different techniques and methodologies used for forecasting given in the flow chart as Fig. 2.
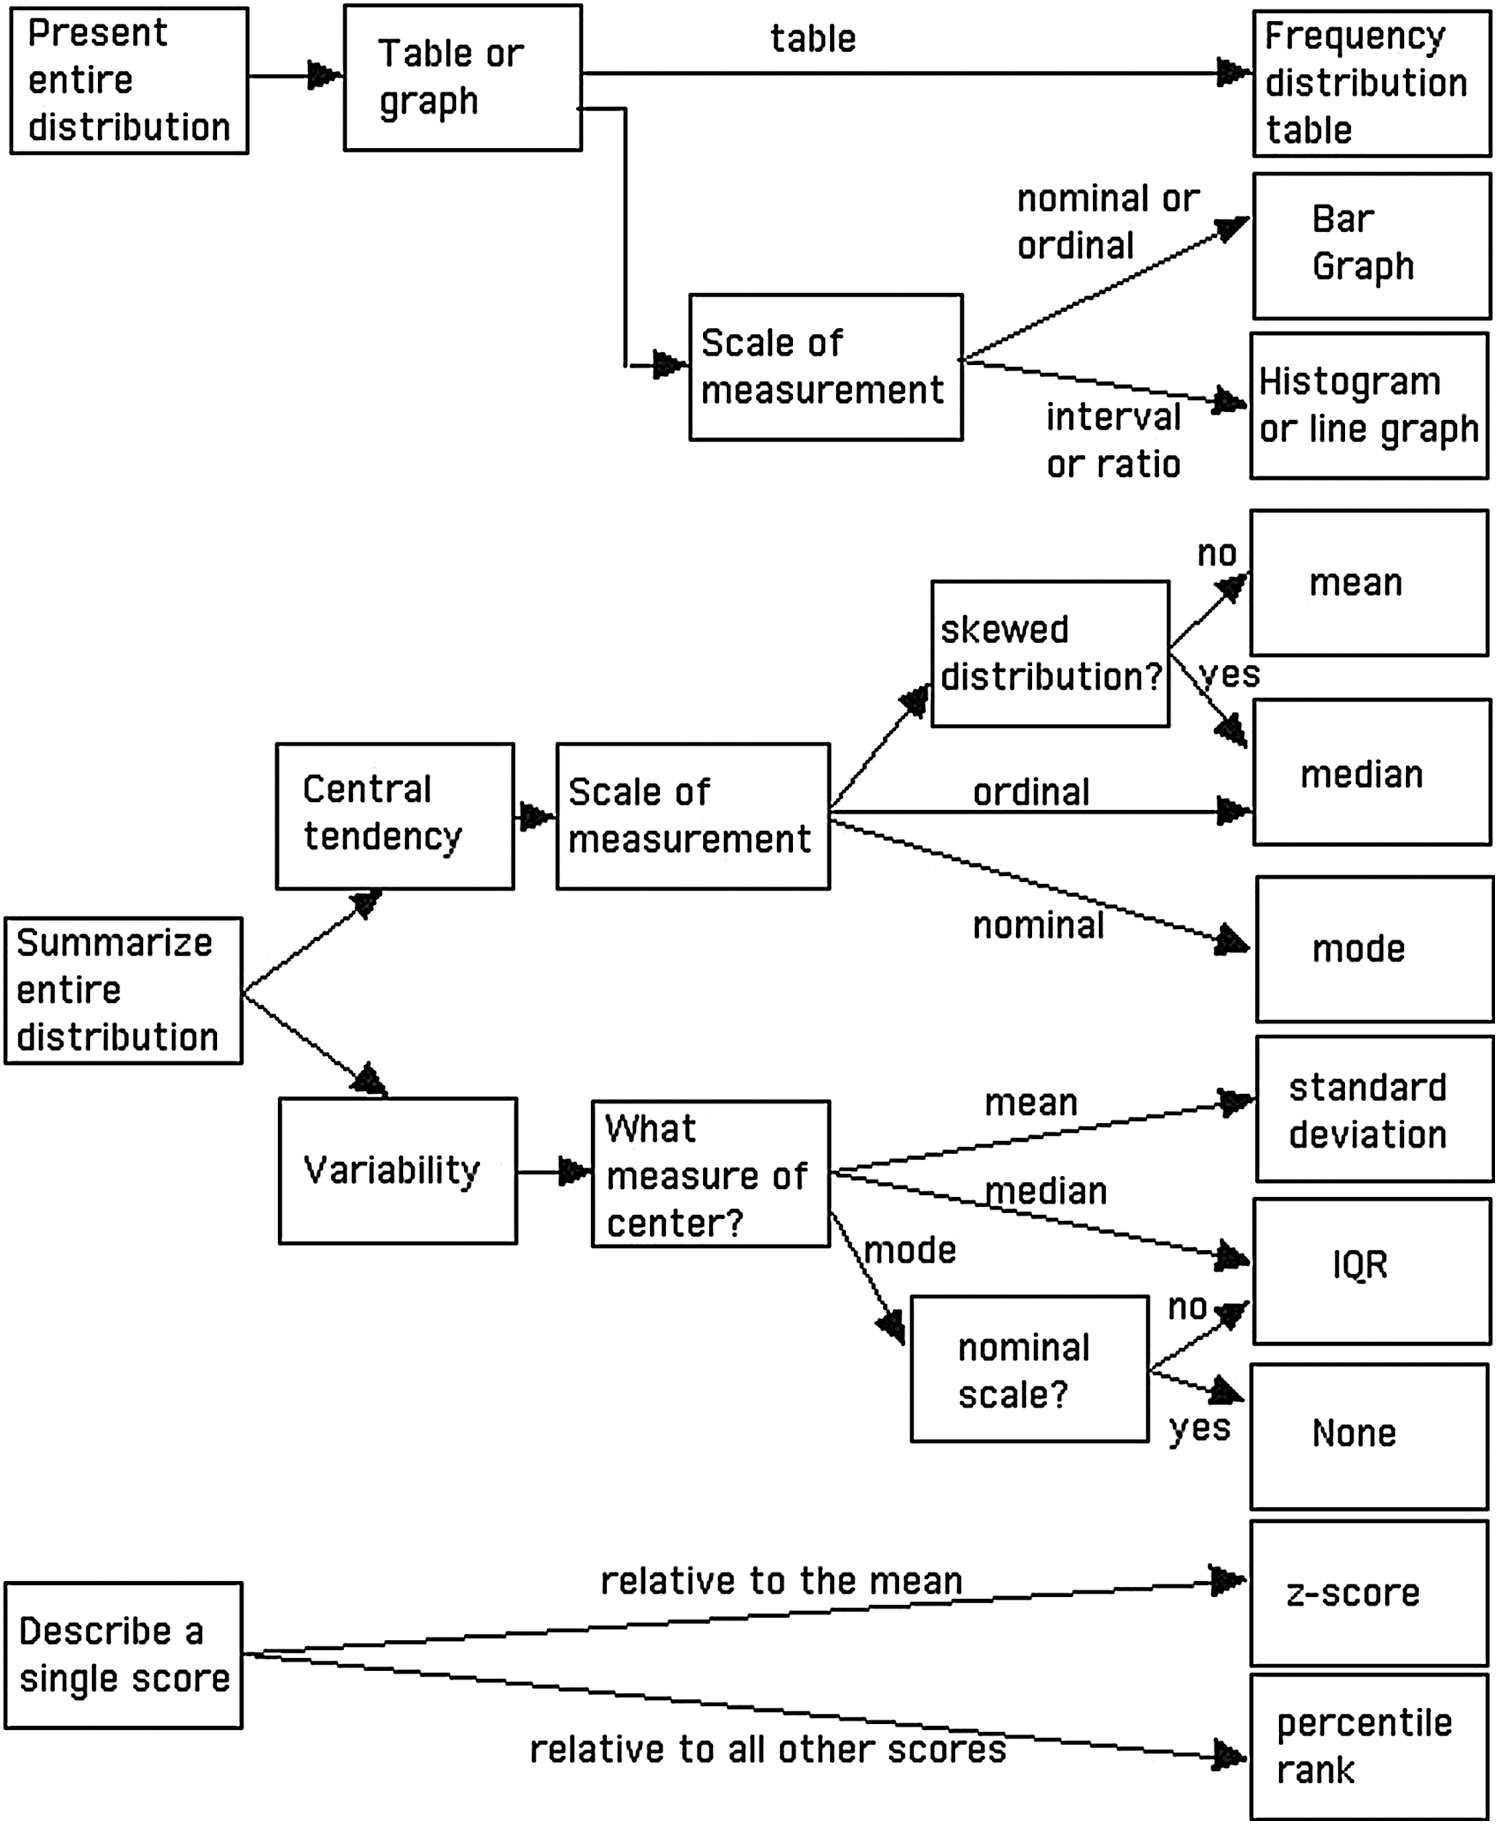
Figure 2: Descriptive analysis flow diagram
CFR is a ratio of cumulative deaths to cumulative confirmed cases of a specified disease over a period. It gives us a measure of the severity of the disease. It is used to study the impact of disease and effect of treatment in medicine; it is not constant and varies between population, time, treatment and patient care. CFR = (total deaths/total confirmed cases) *100
A set of observations  is defined as a time series if it possesses observations at a time t. It is a discrete-time series when it is observed at a fixed time interval. Time series analysis is utilized:
•To identify the characteristics showcased by a sequence of observations
•To predict future trends of a variable taken (Forecasting).
2.3 Autoregressive Integrated Moving Average (ARIMA)
 is defined for a non–negative integer
  if
if  which is derived from
  process. The observations set
  satisfies the varying equation:
  ,
,  where,
  and
and  are the polynomials of degrees
  and
and  in powers of
  , respectively, and
  does not have a zero in the unit interval
  .
.  , at
, at  for the order of d. The process is non-stationary if
  in this case, it reduces to a
  process. For the other case when d is nonzero, the polynomial trend of degree
  to
to  .
.  is an
is an  process if for some
 ,
,  . In this case,
  where,
 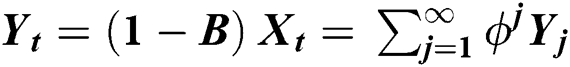 [18–30]. For long term behavior or random walk, the slanting approximation of AR [1] and AR [2] coefficients along with constant terms are approximated using the iterated equation:
3 Results and Discussions for Model Selection
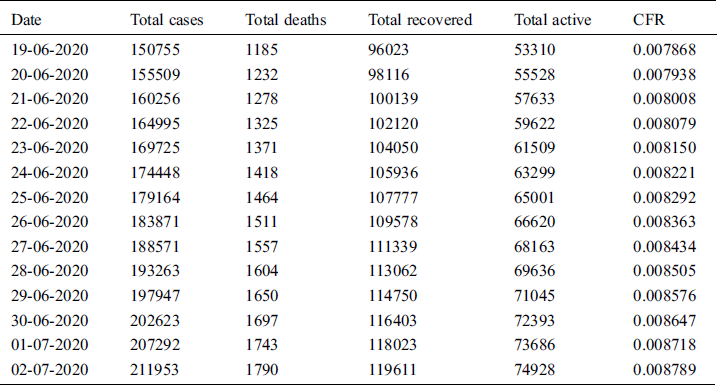
For long-term behavior, datasets of Saudi Arabia from March 2, 2020, to June 15, 2020 were analyzed. COVID-19 description of confirmed cases, active cases, recovered cases and death in different states of Saudi Arabia is shown in Fig. 3. Descriptive statistics are given in Tab. 1. Fig. 4 describes the trends of COVID-19 using a Q–Q plot with the details of correlation and the coefficient of determination. Time series of daily confirmed cases, the total confirmed cases, daily deaths, total deaths, daily recovered, and total recovered cases are shown in Fig. 5. Time series and trend analysis for CFR is shown in Fig. 6. Tab. 2 gives the details of the goodness of fit, whereas details of the AR (1) and AR (2) for the ARIMA (2,1,0) model are given in Tab. 3. Long-term forecasting using ARIMA (2,1,0) with residuals, ACF and PACF for daily confirmed cases, daily recovered cases, daily deaths, total confirmed cases, total deaths and total recovered cases are shown in Figs. 7–12, respectively. Fitting of the curve for forecast and trend analysis for total confirmed cases, total recovered cases, total deaths and CFR has been plotted in Fig. 13 with forecasting values in Tab. 4. The results show that the Saudi Arabian health authorities can take effective decisions to cater to the needs of the new cases and old cases needing immediate healthcare for the COVID-19 pandemic. The Riyadh and Jeddah regions are especially affected, showing exponential growth since May 28. The incidence of new cases is increasing, and the government should take immediate actions such as lock down and media awareness programs. The daily confirmed cases have increased to 3500–4000 over the last ten days. Meanwhile, the deaths have also increased to 900, which is the highest in the gulf countries. This pattern forces a thorough review of the strategies to control the pandemic in Saudi Arabia. The intensive care and prevention unit should work on full capacity. The criticality of the situation is immense and will remain so till curative and preventive measures are adequately in place.
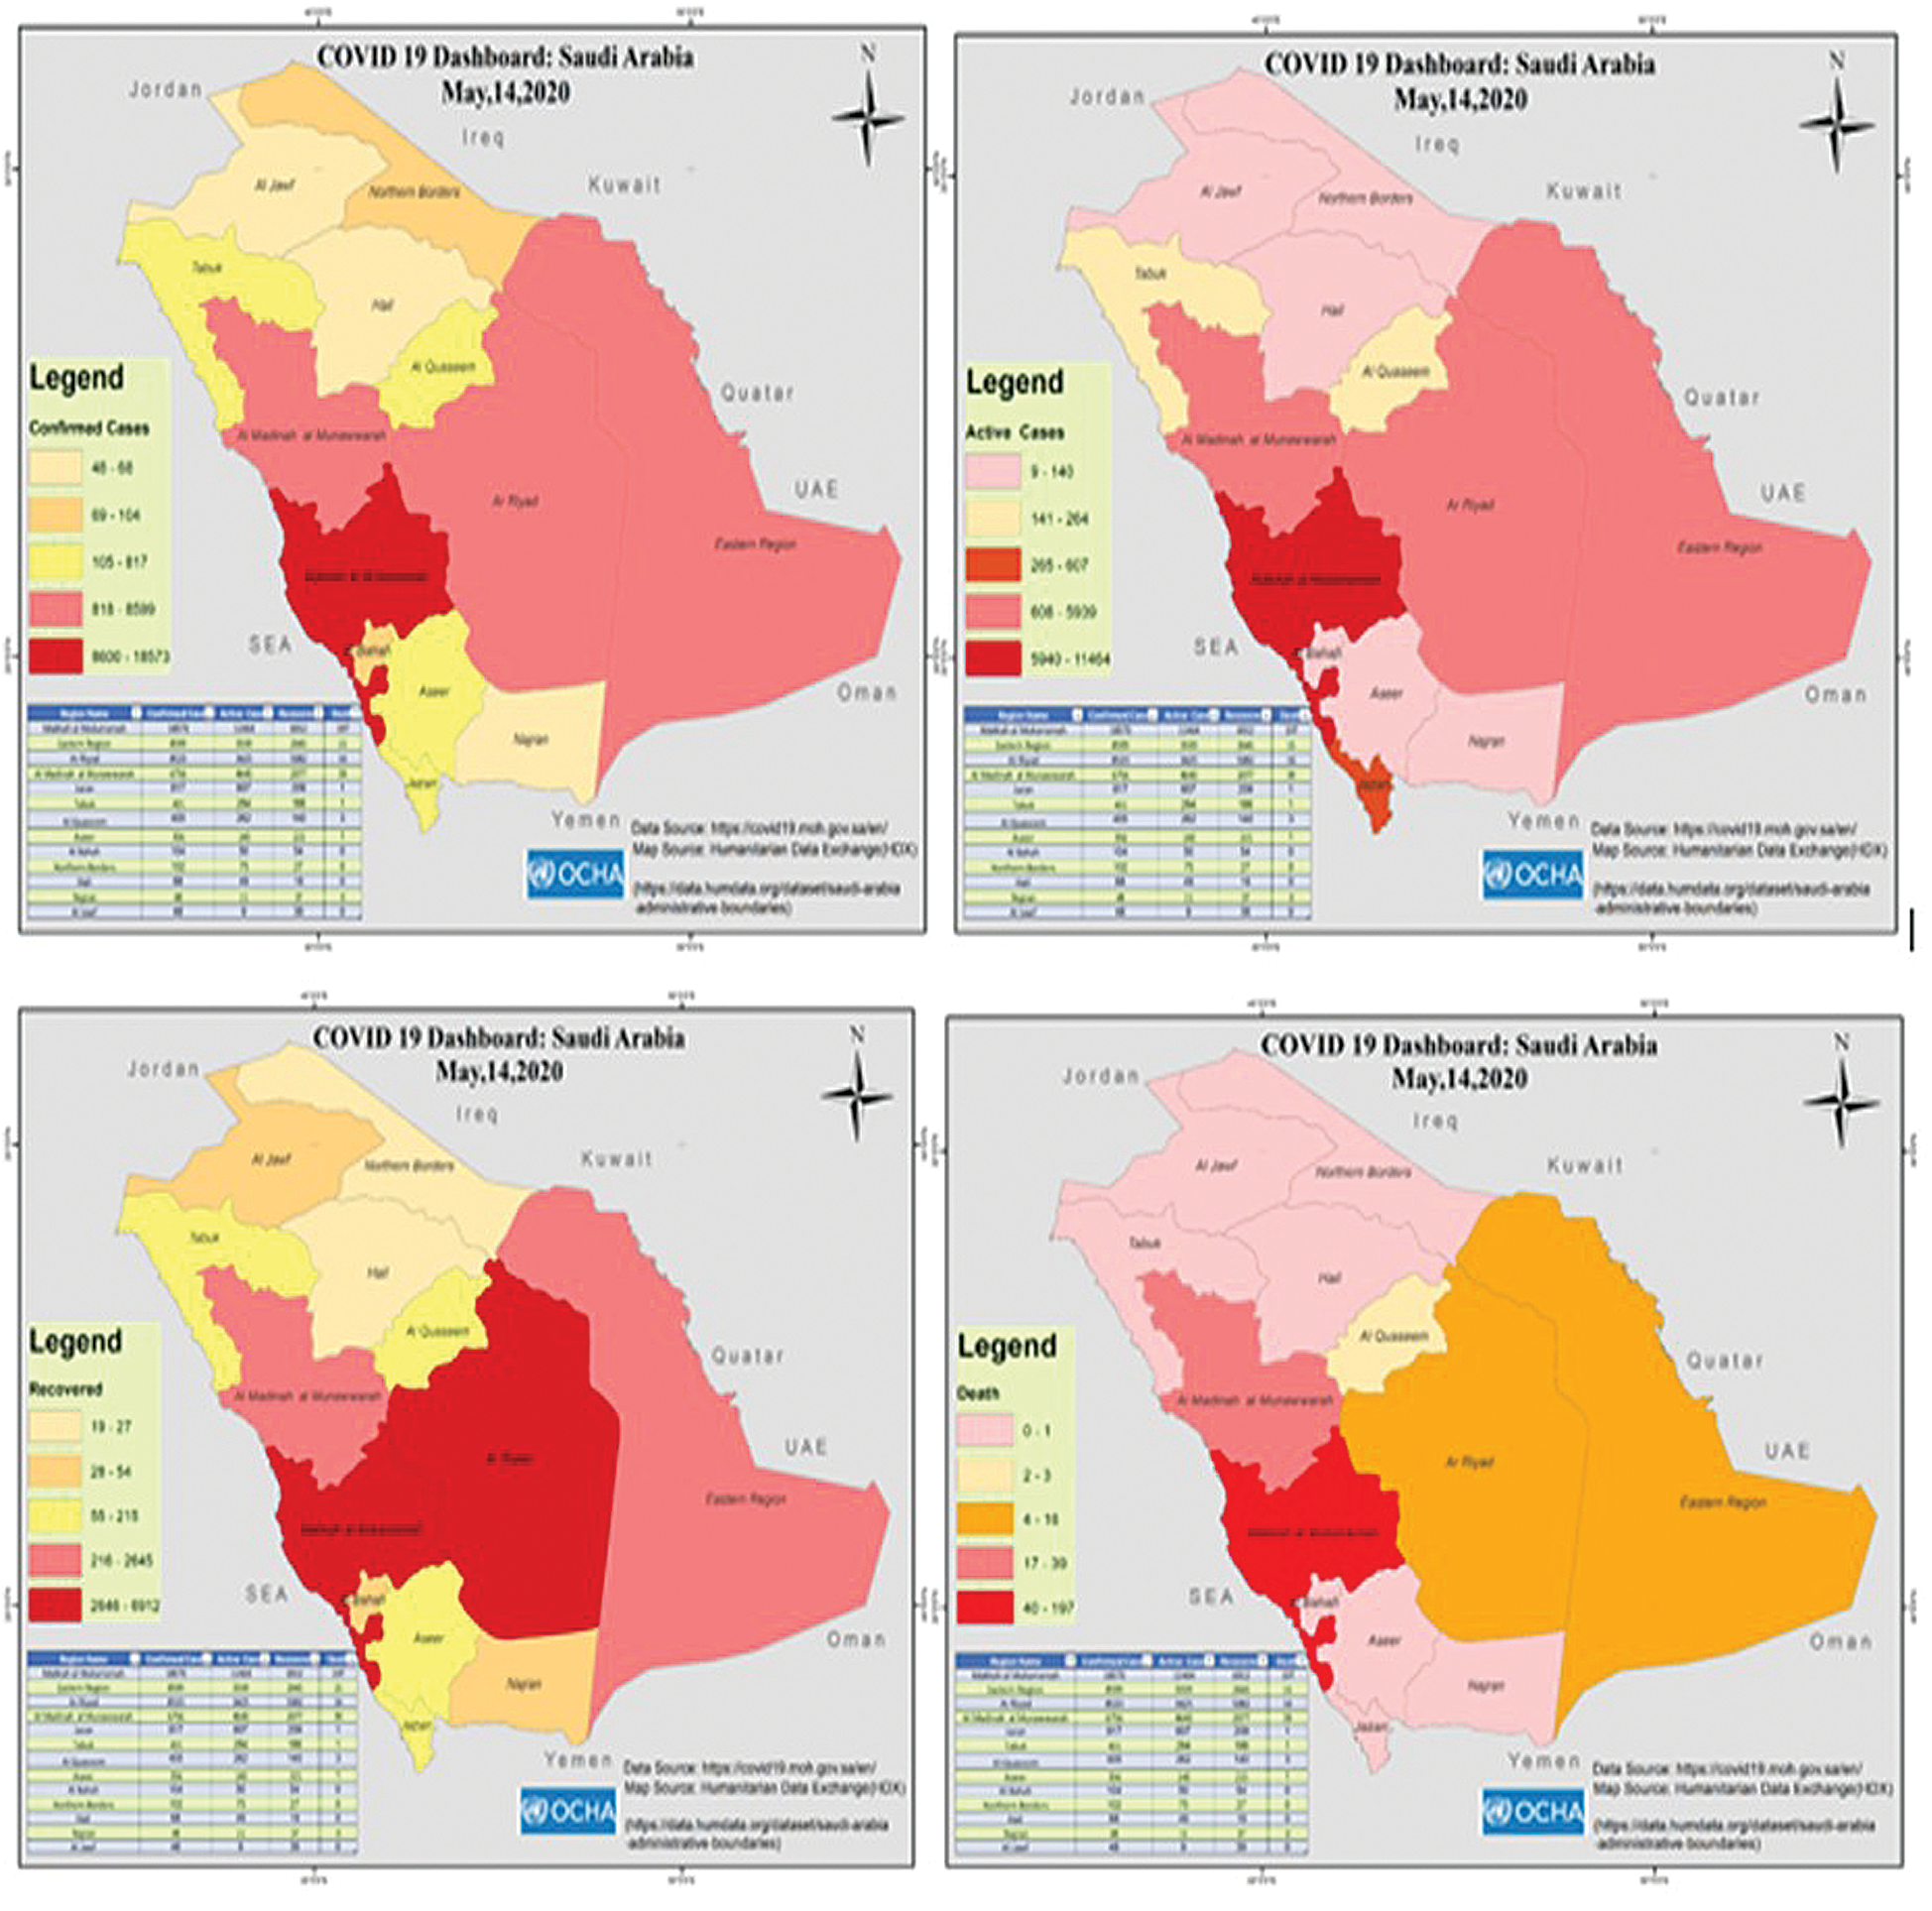
Figure 3: COVID-19 details for States of Saudi Arabia: Confirmed, active, recovered and death cases
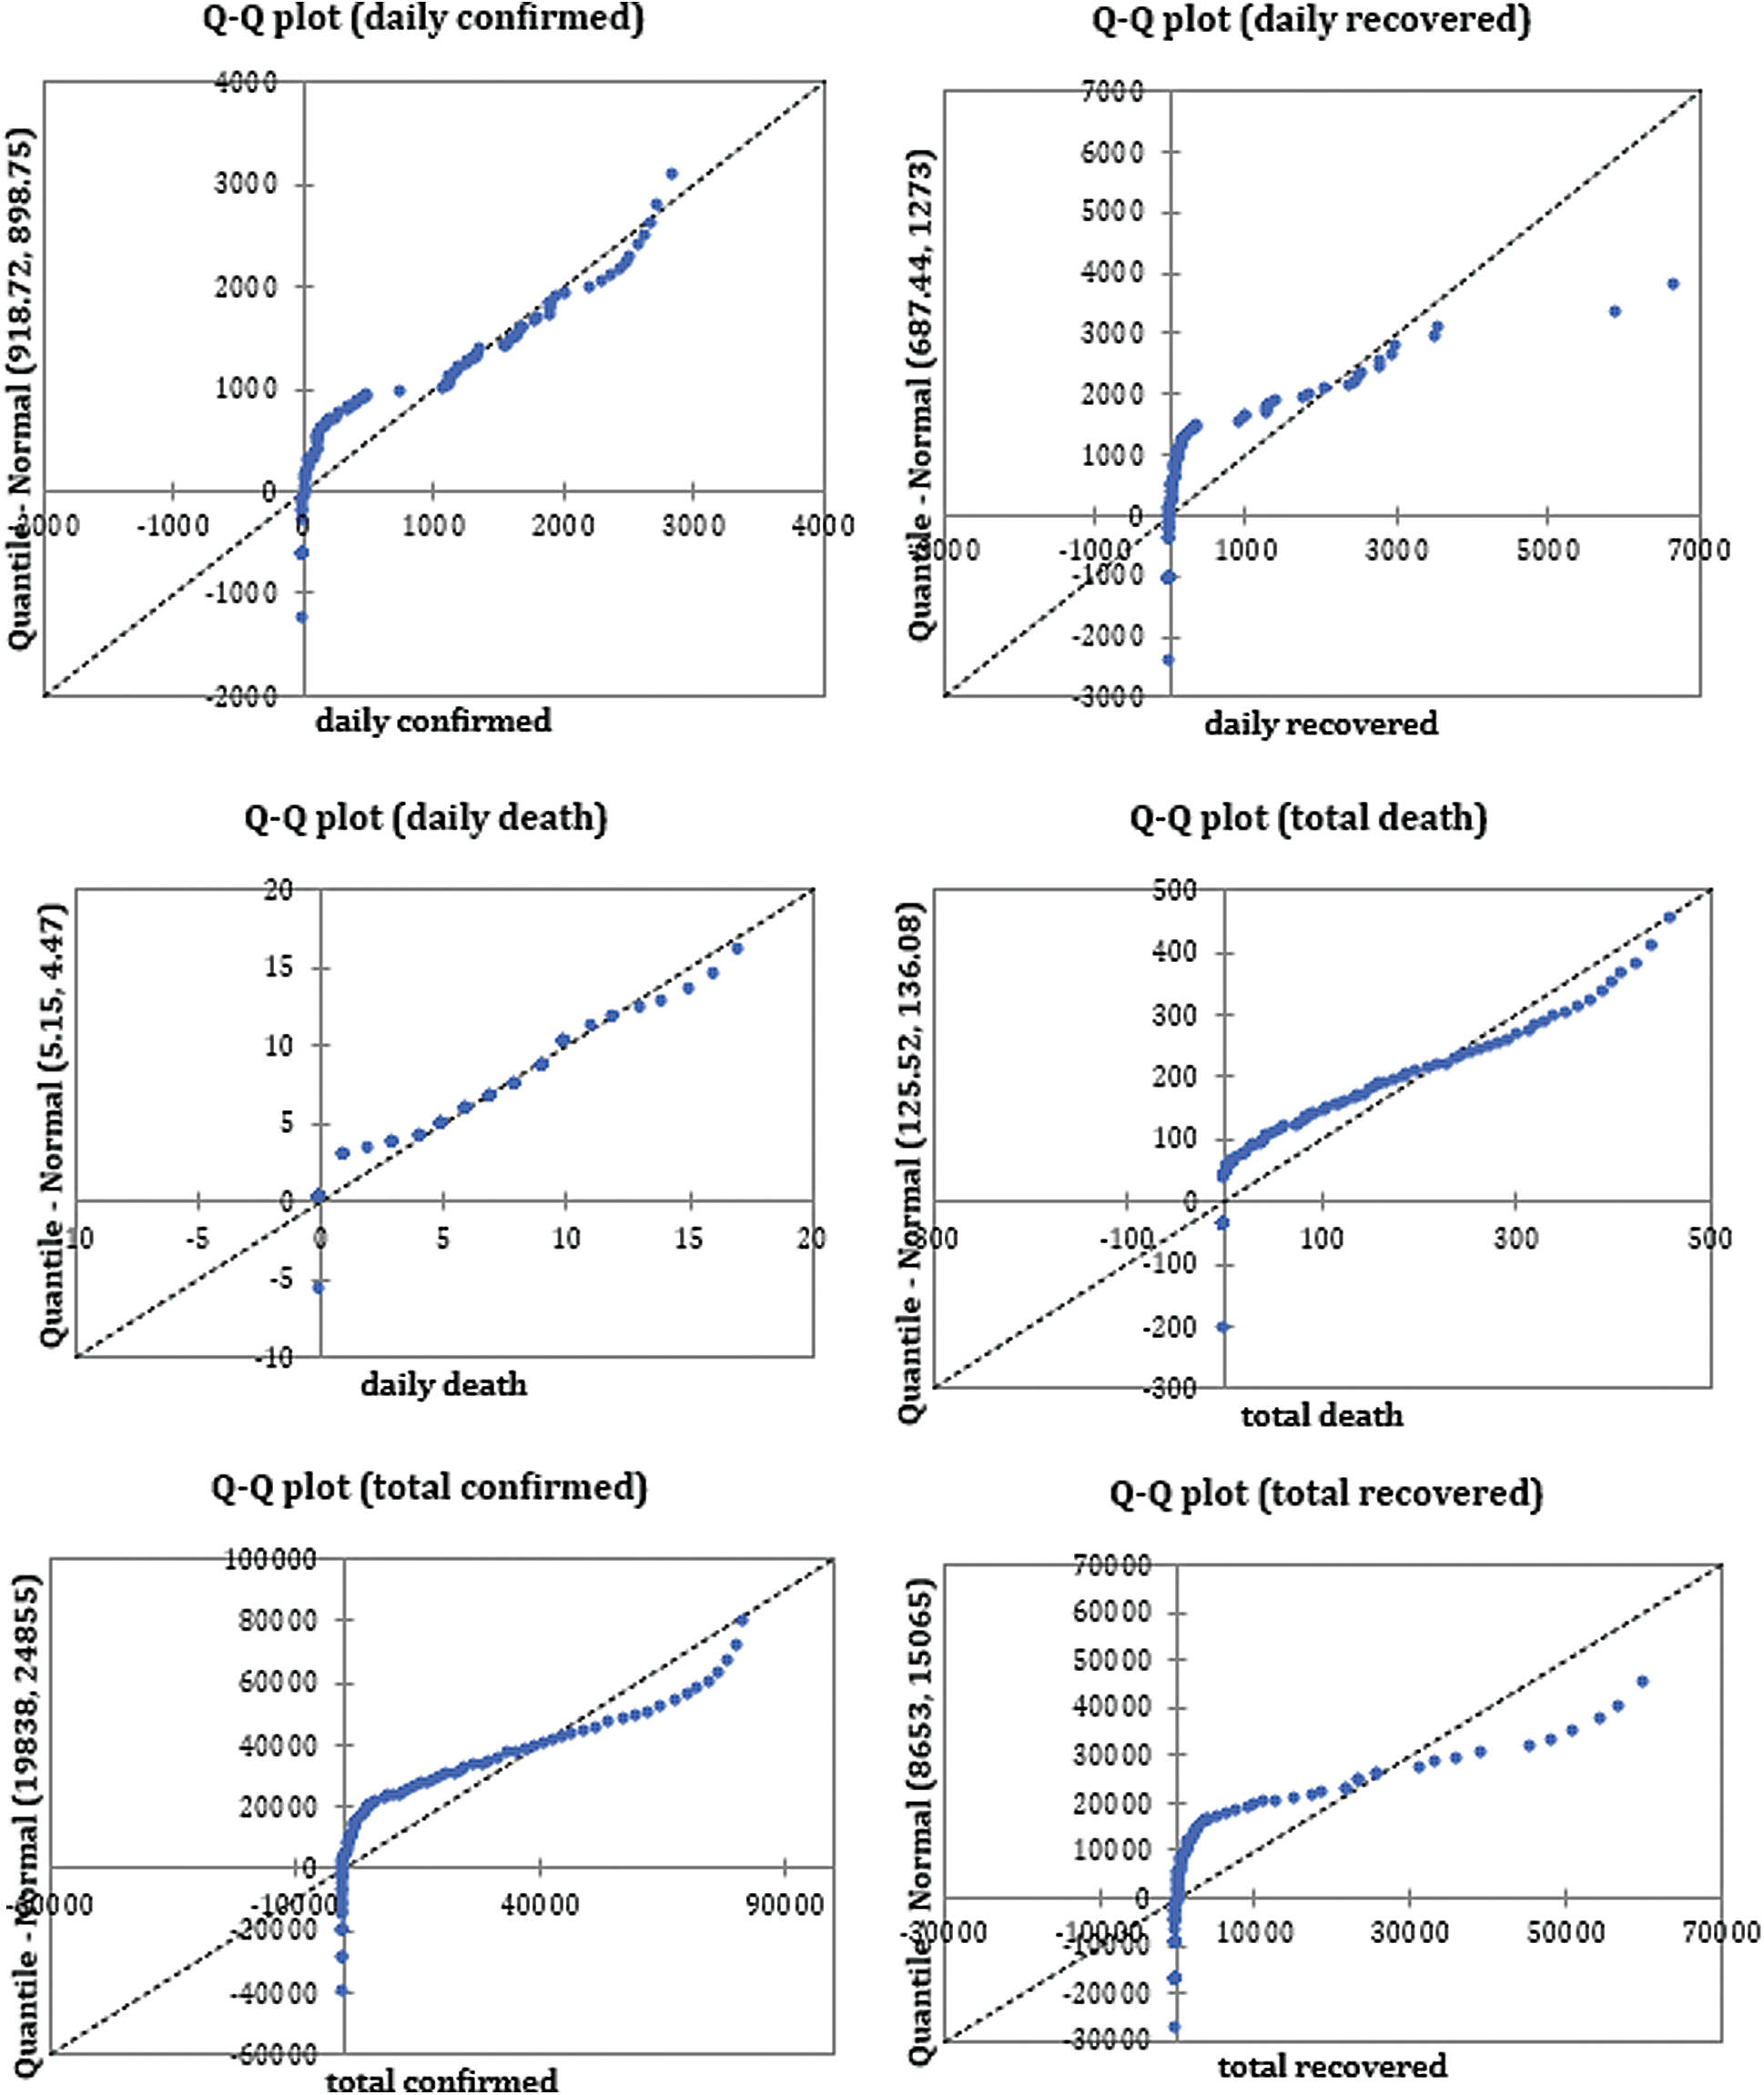
Figure 4: Q–Q plots for COVID 19 trends of Saudi Arabia
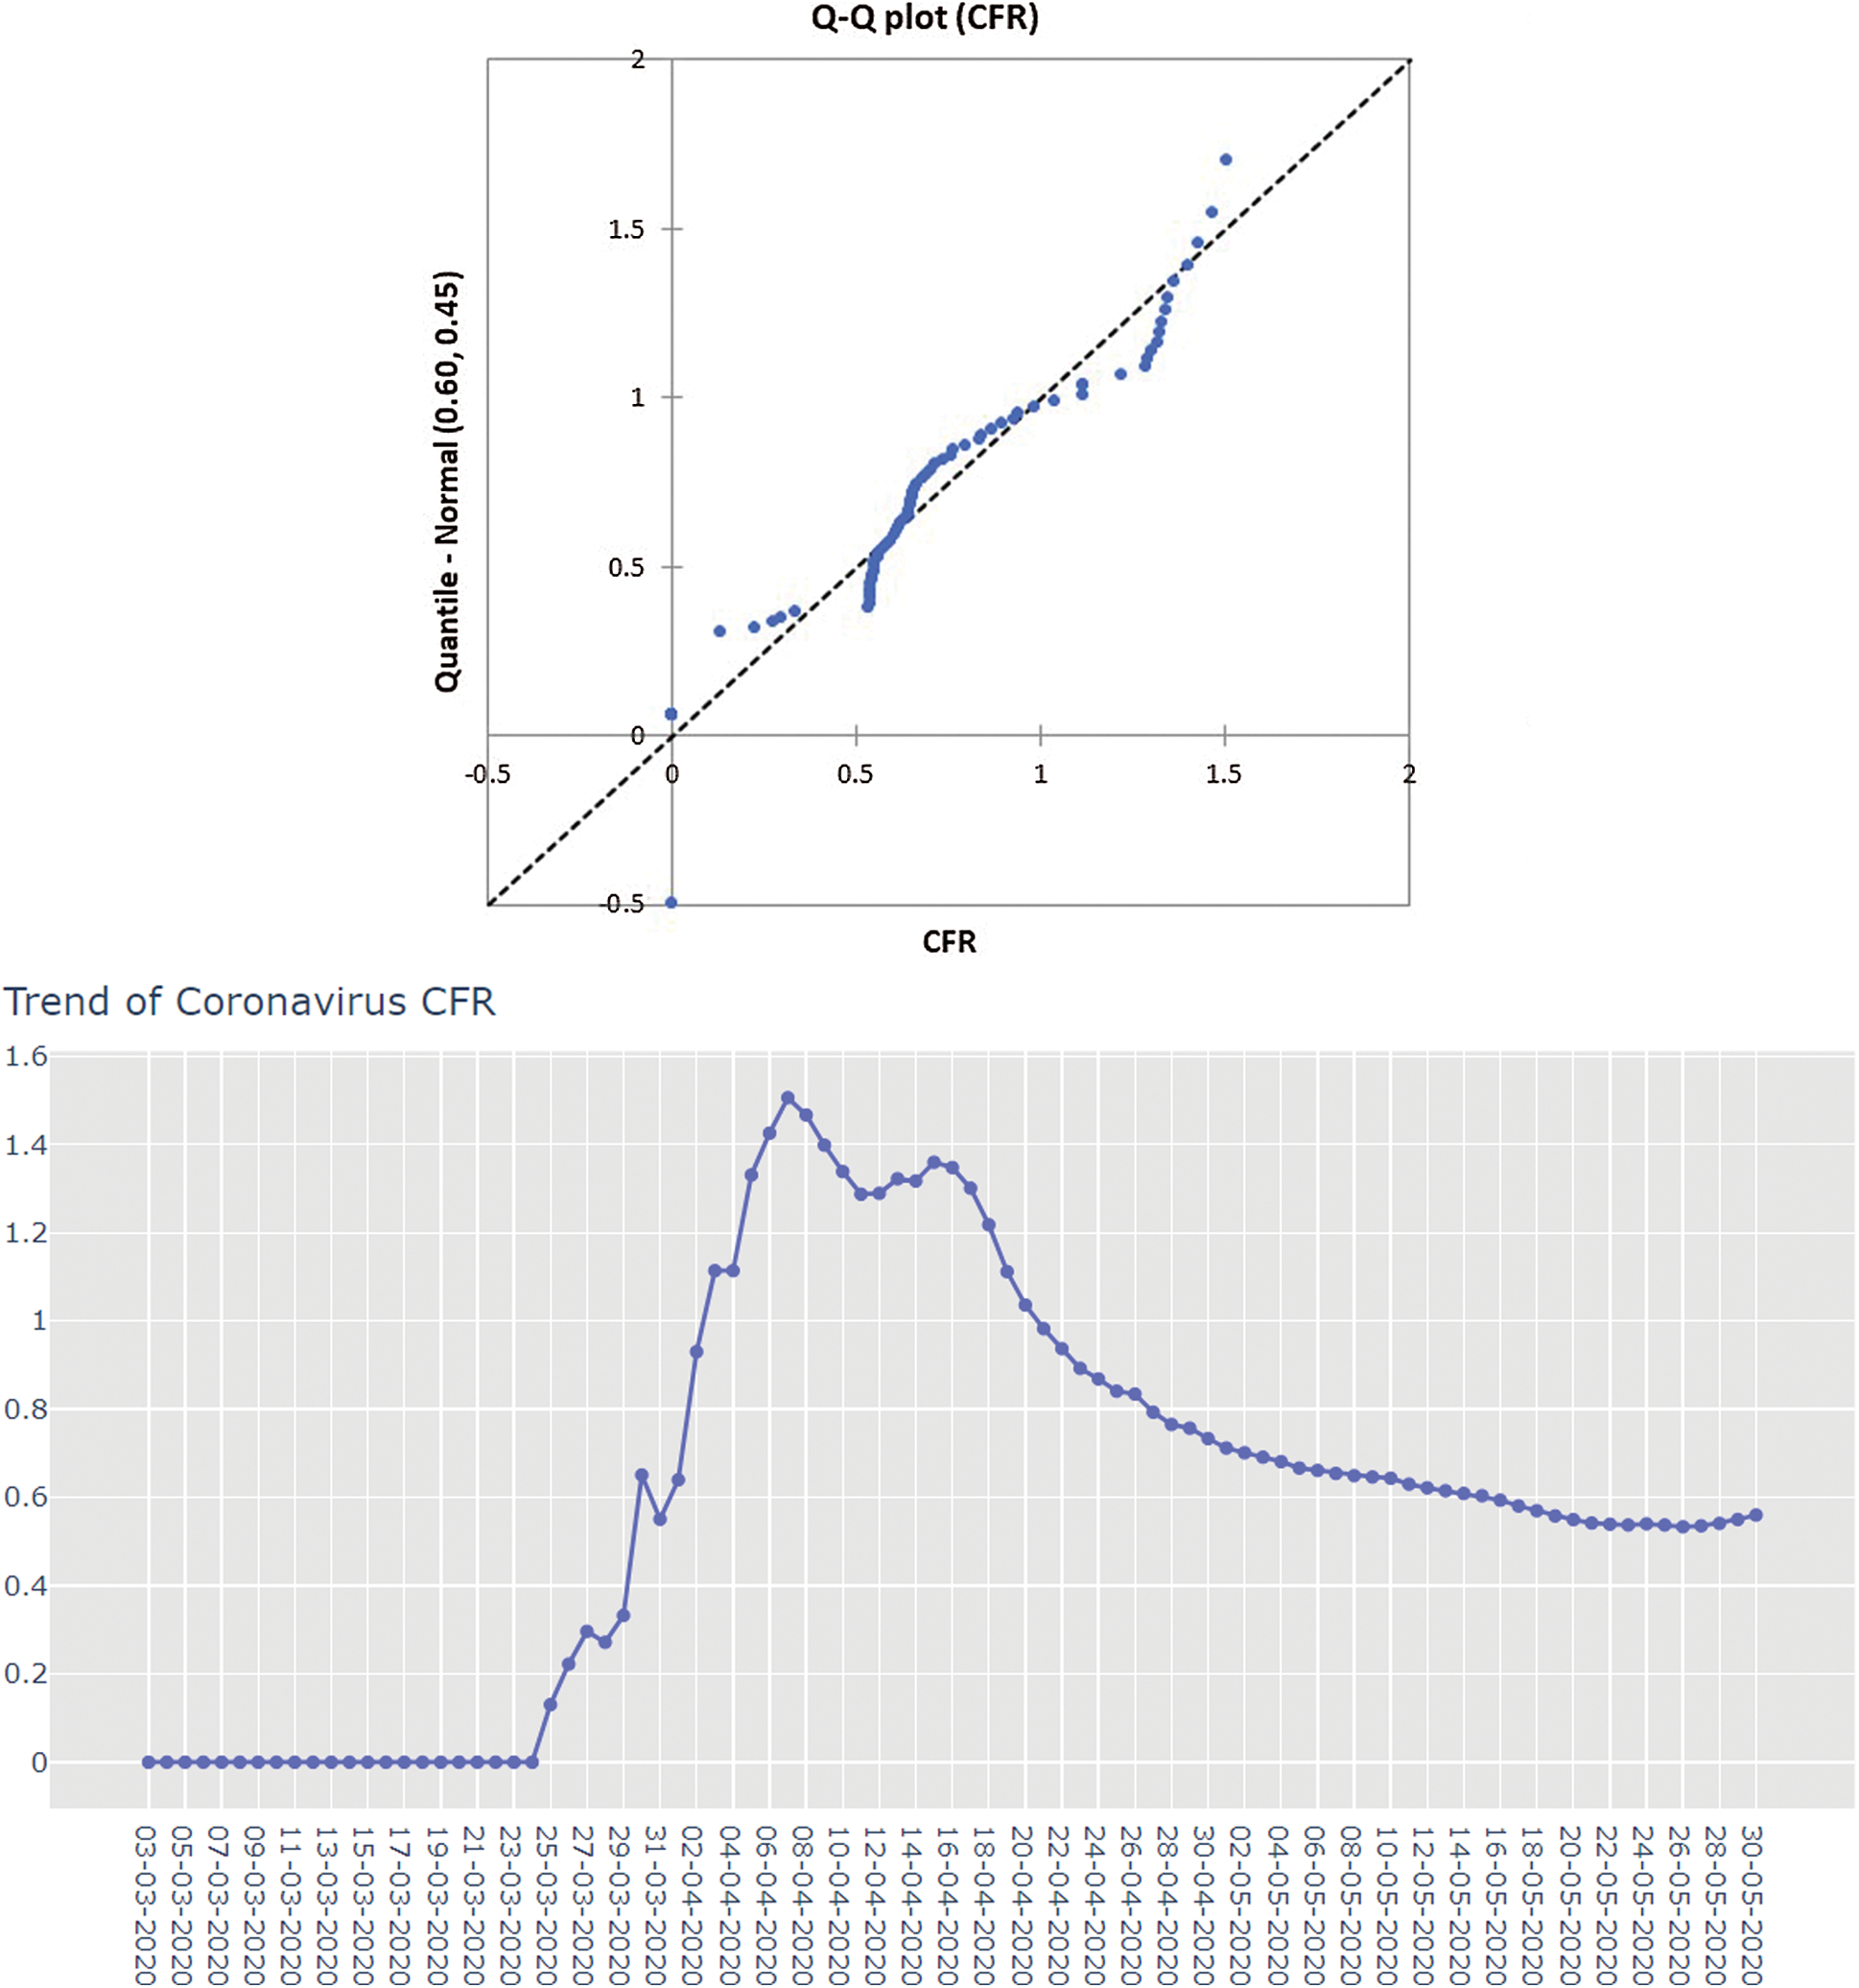
Figure 5: Time series and trend analysis for CFR in Saudi Arabia
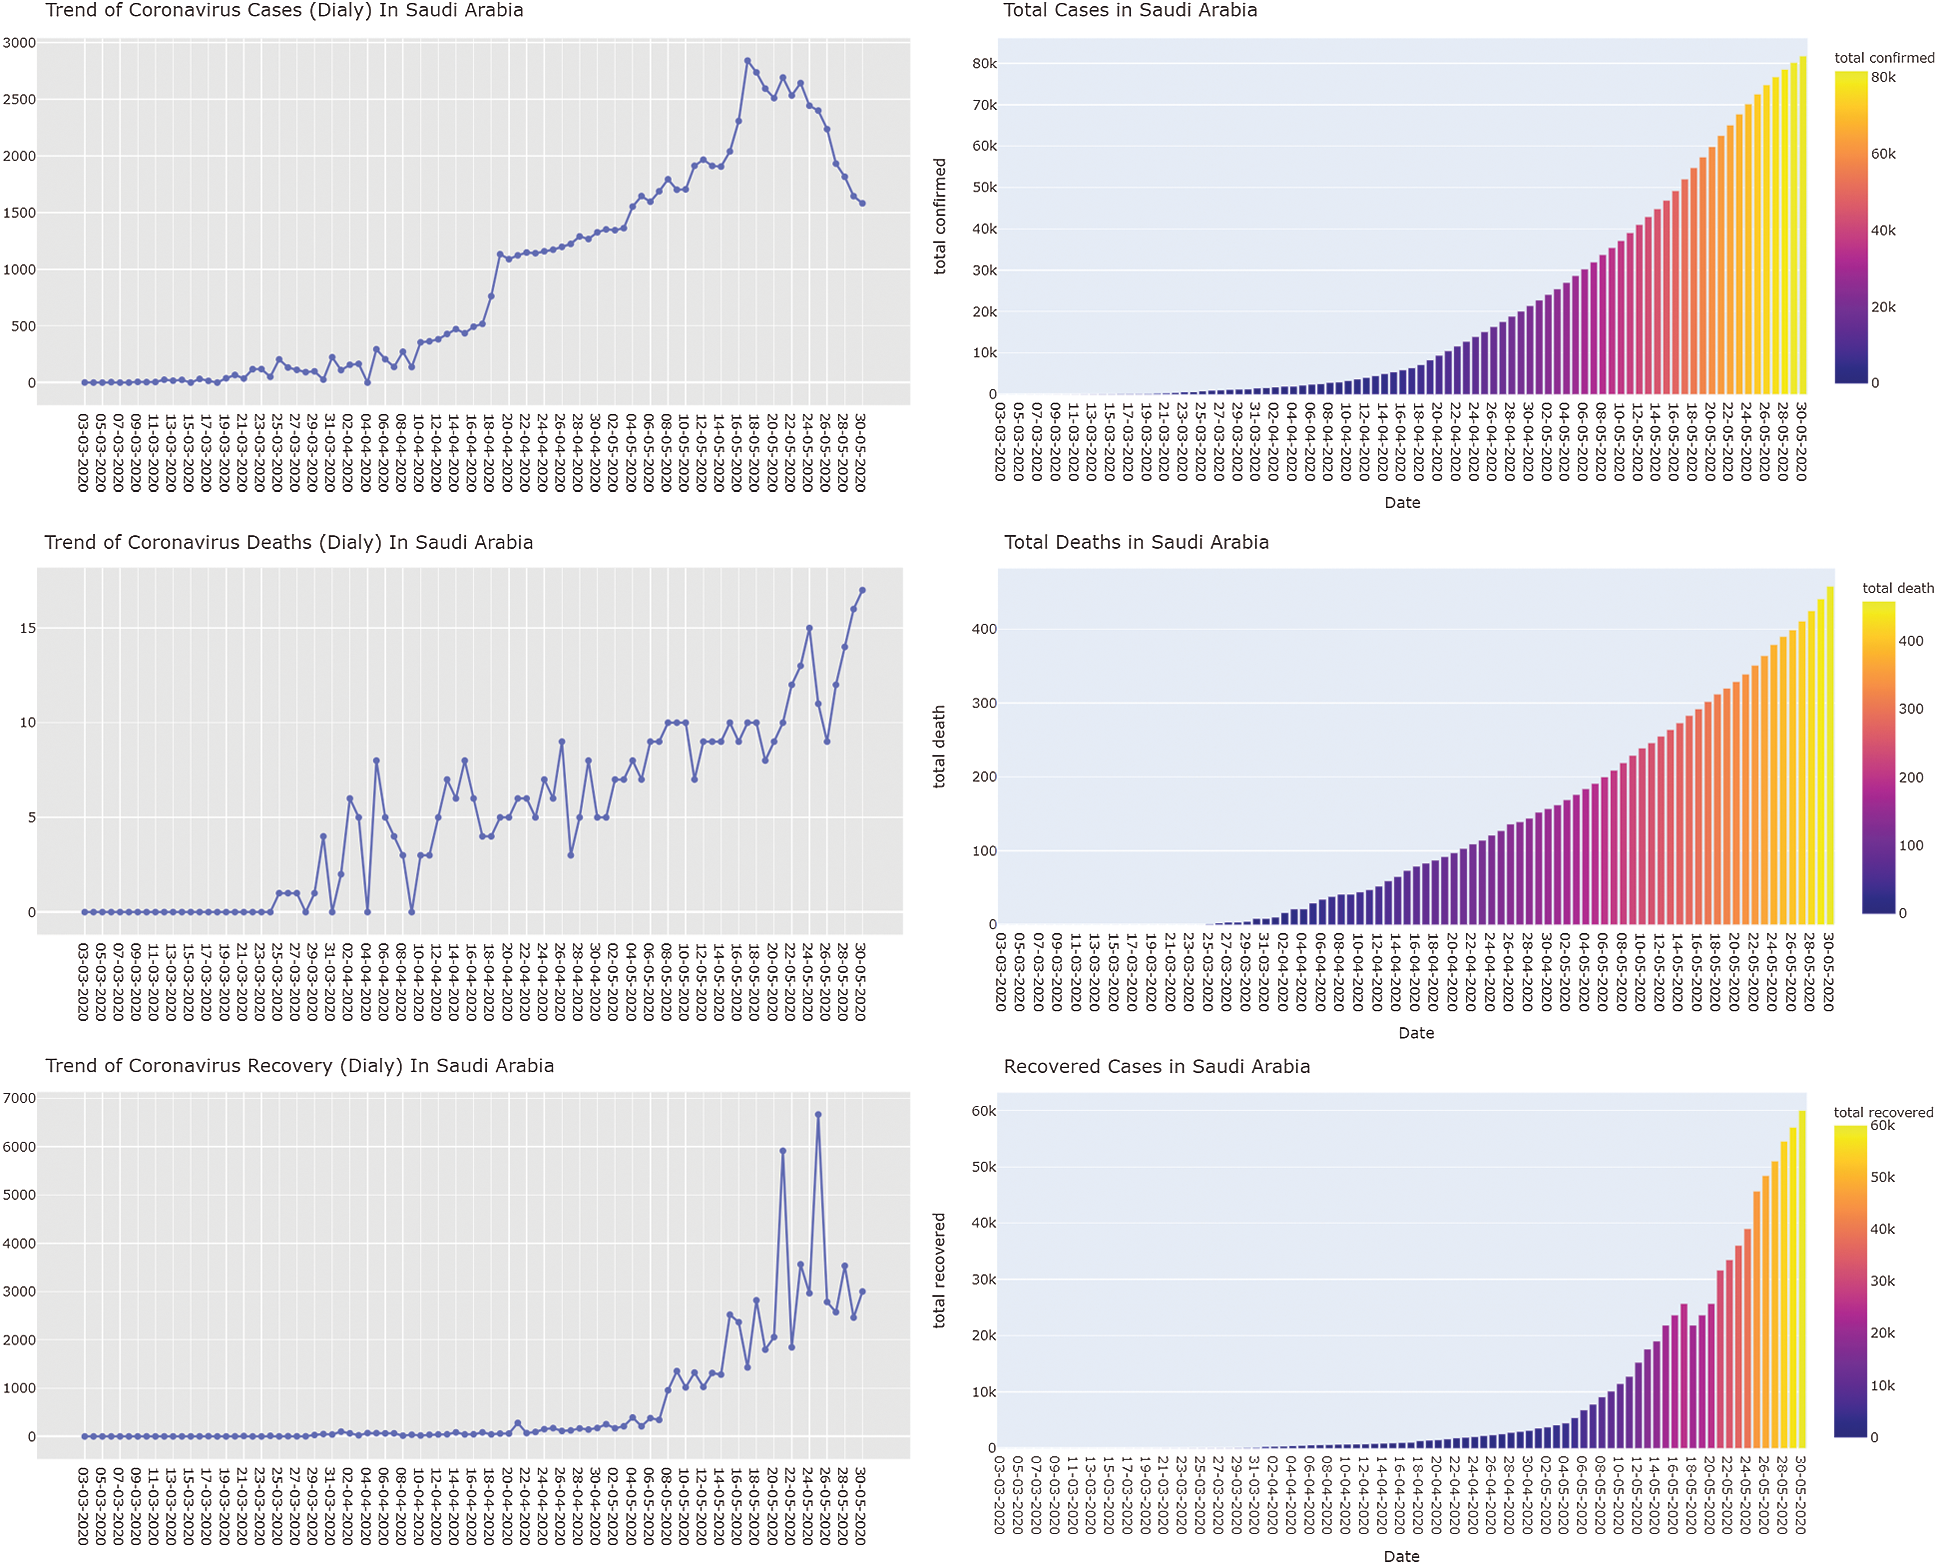
Figure 6: Time series for confirmed, and recovered cases and deaths
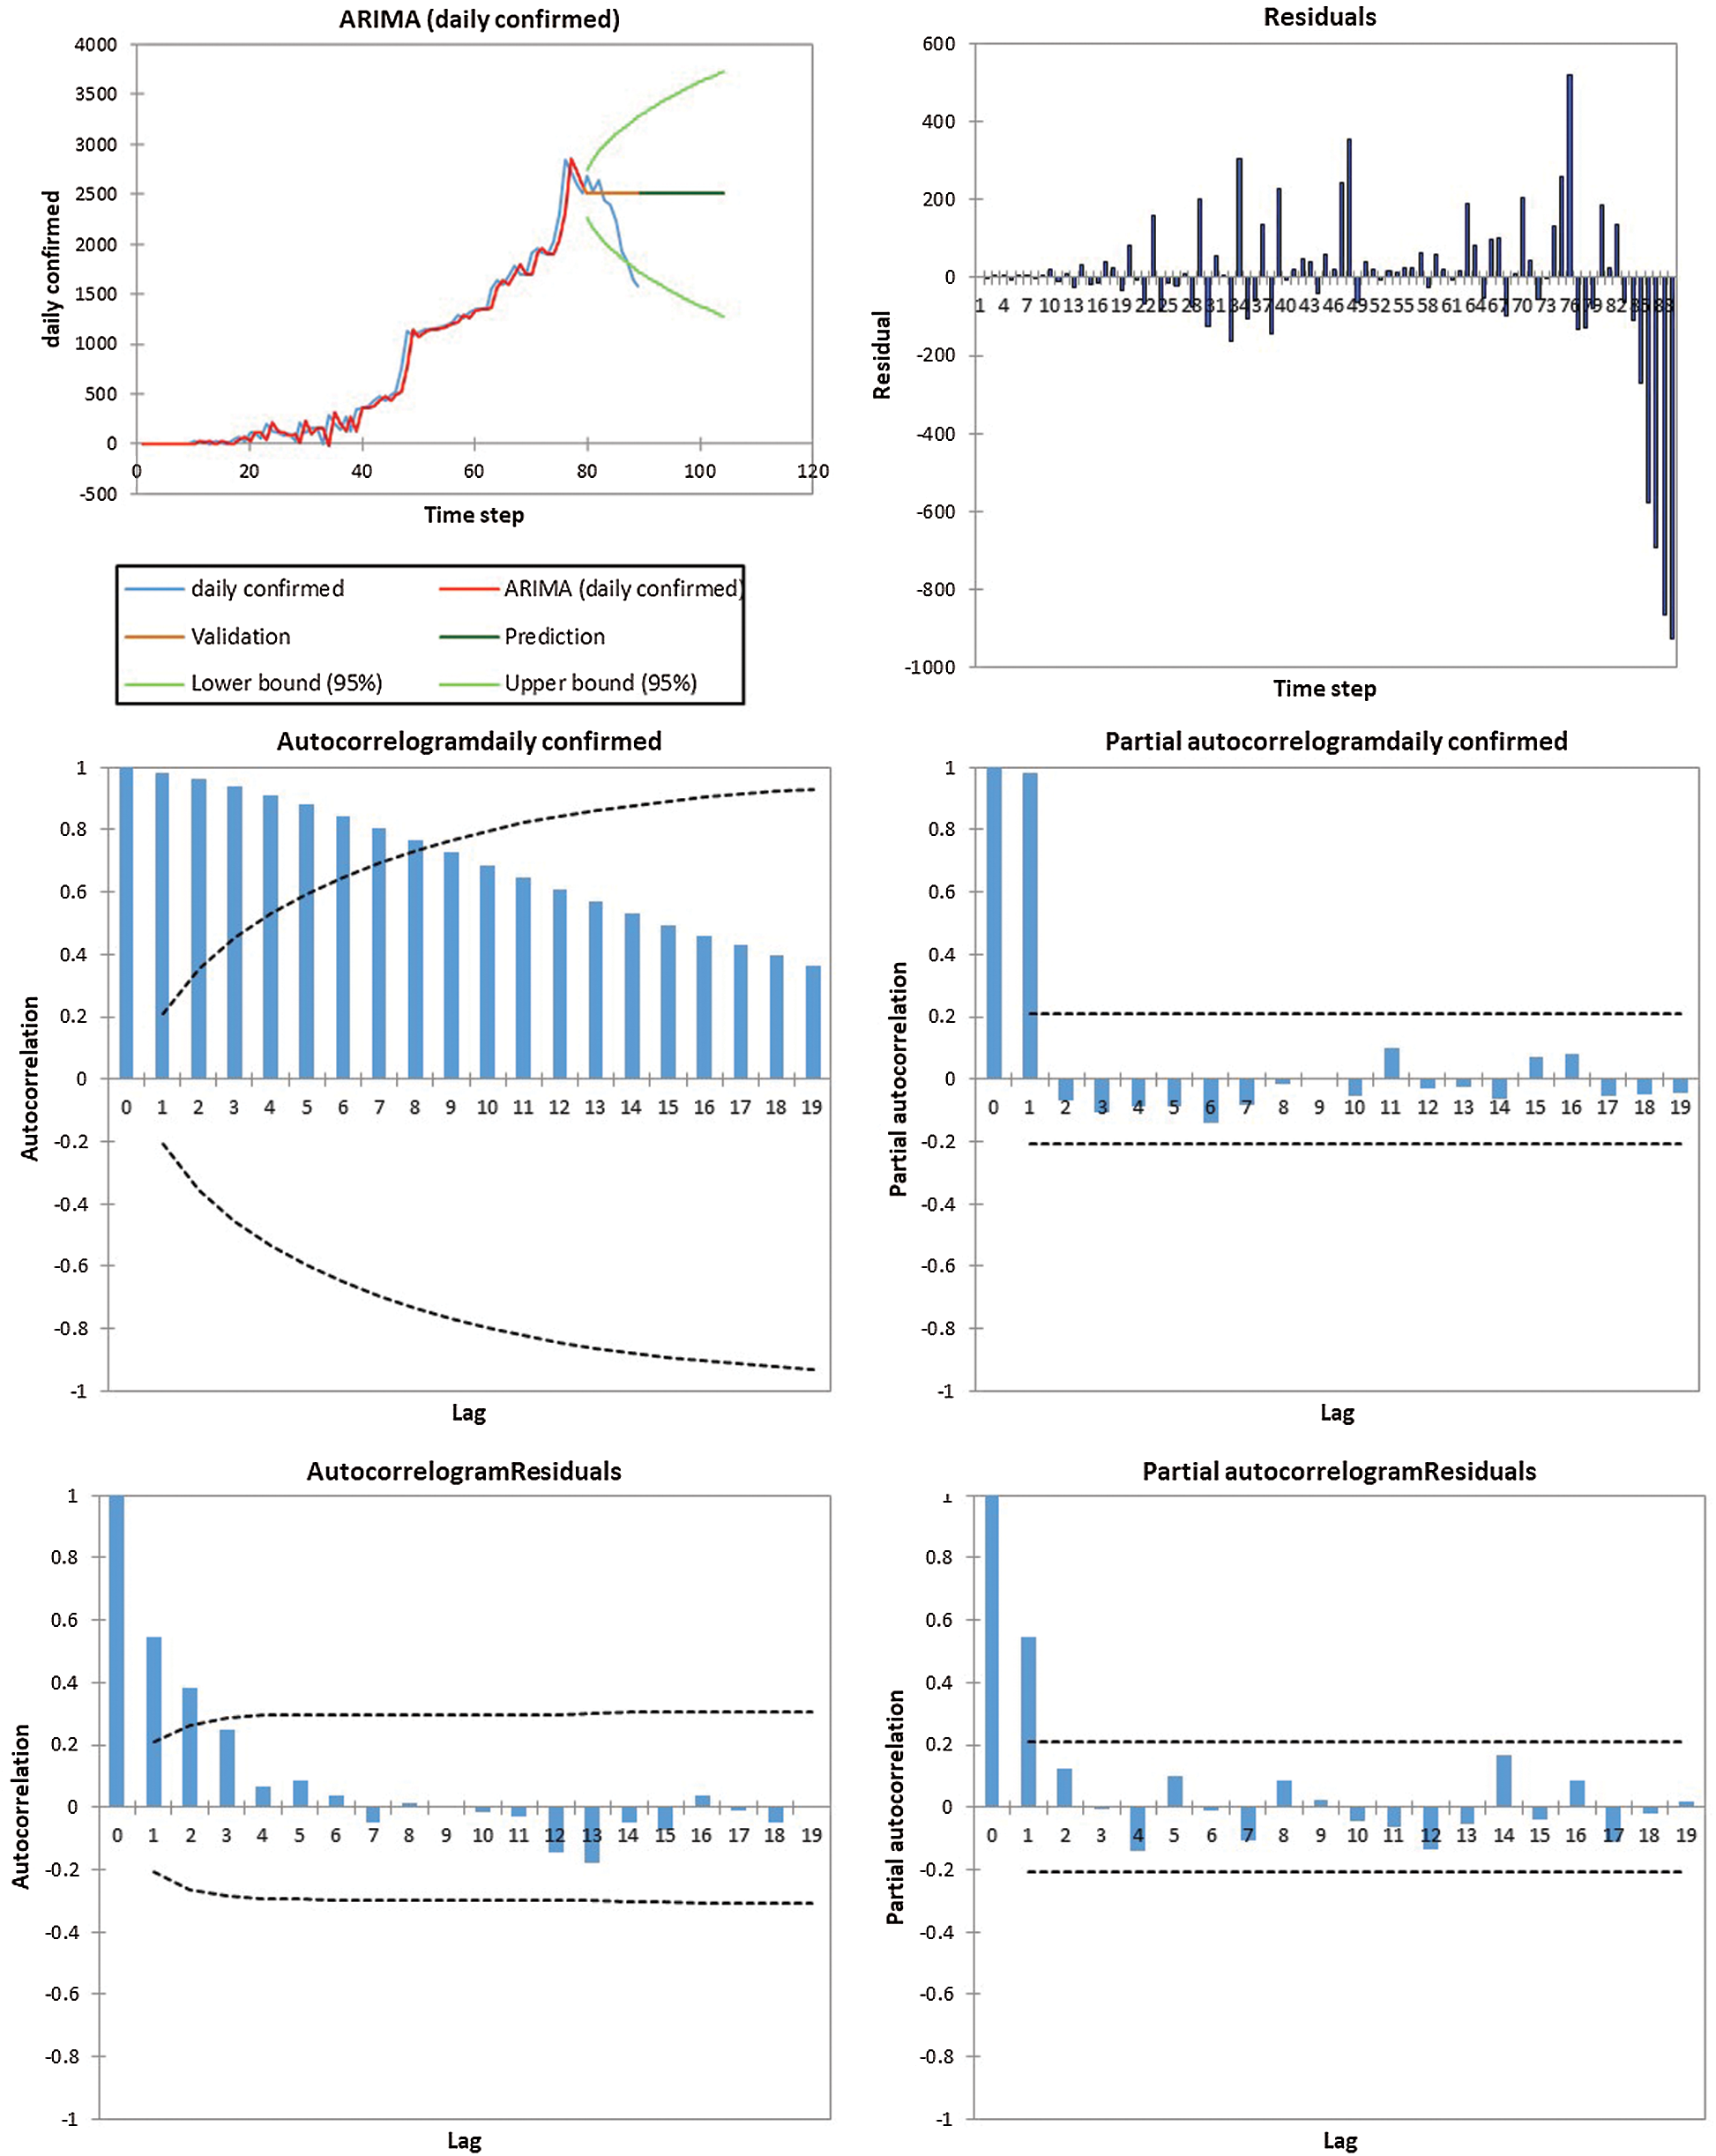
Figure 7: ARIMA (2,1,0) for daily confirmed cases
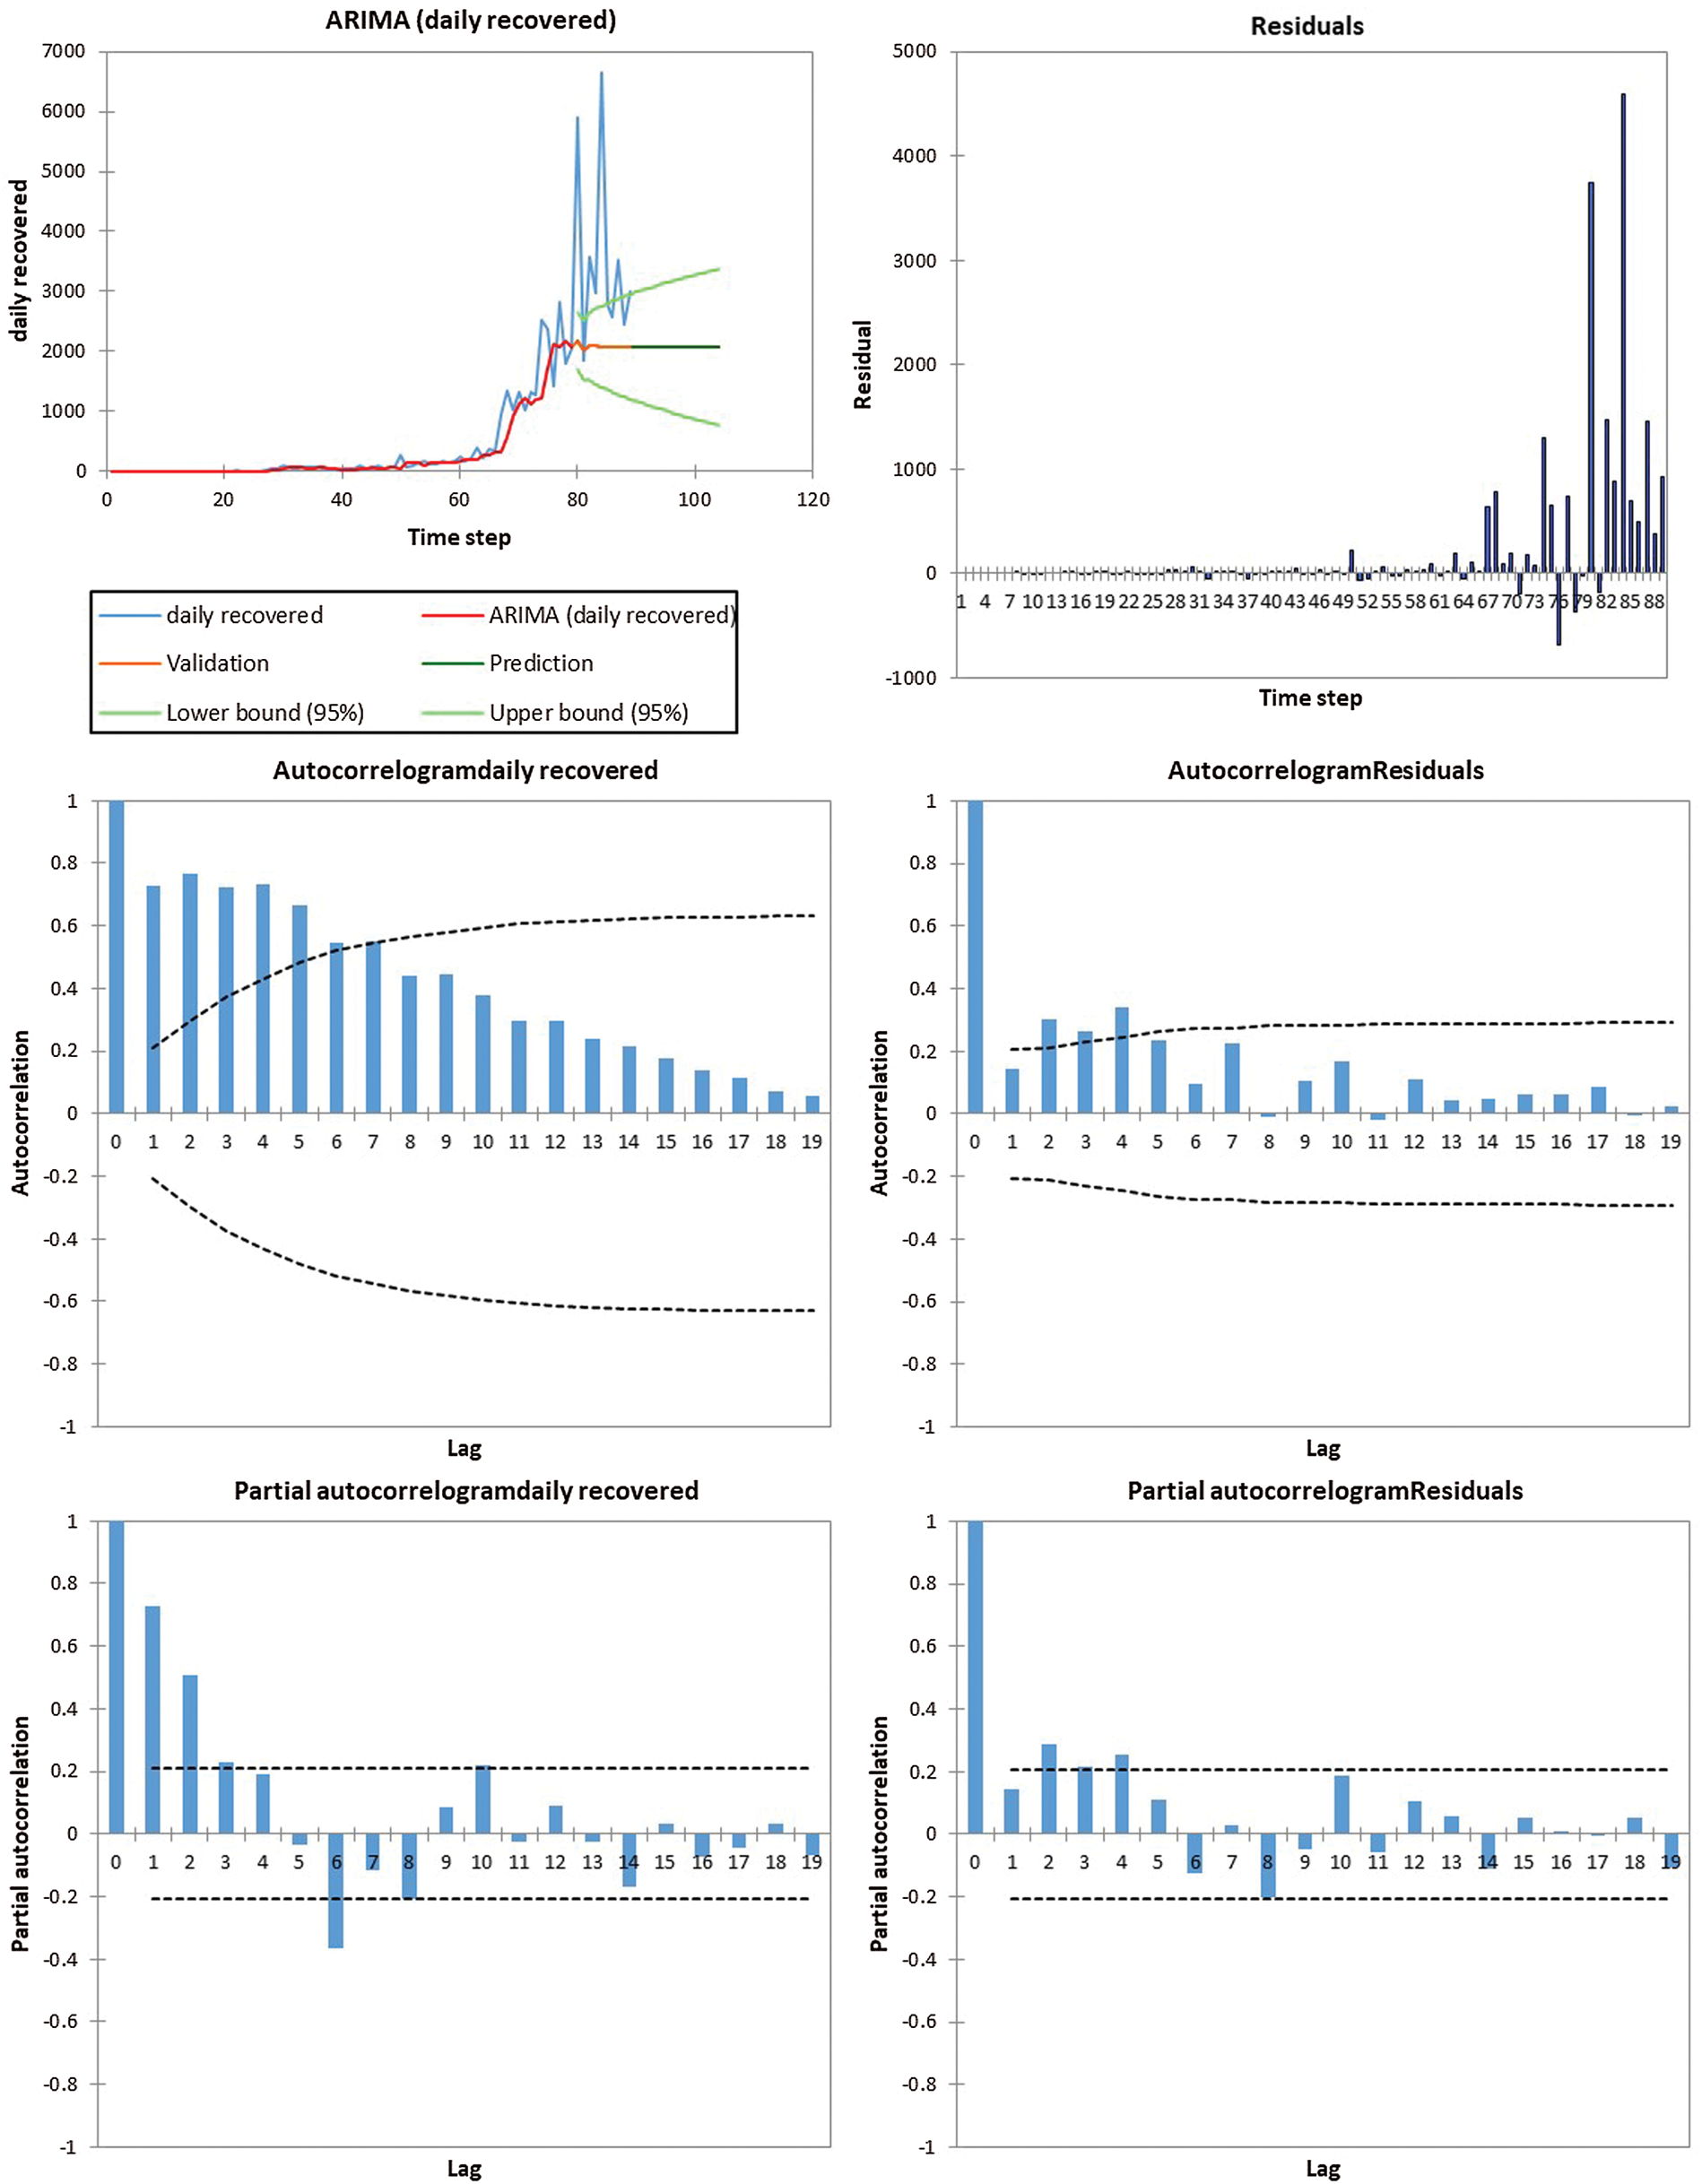
Figure 8: ARIMA (2,1,0) daily recovered cases
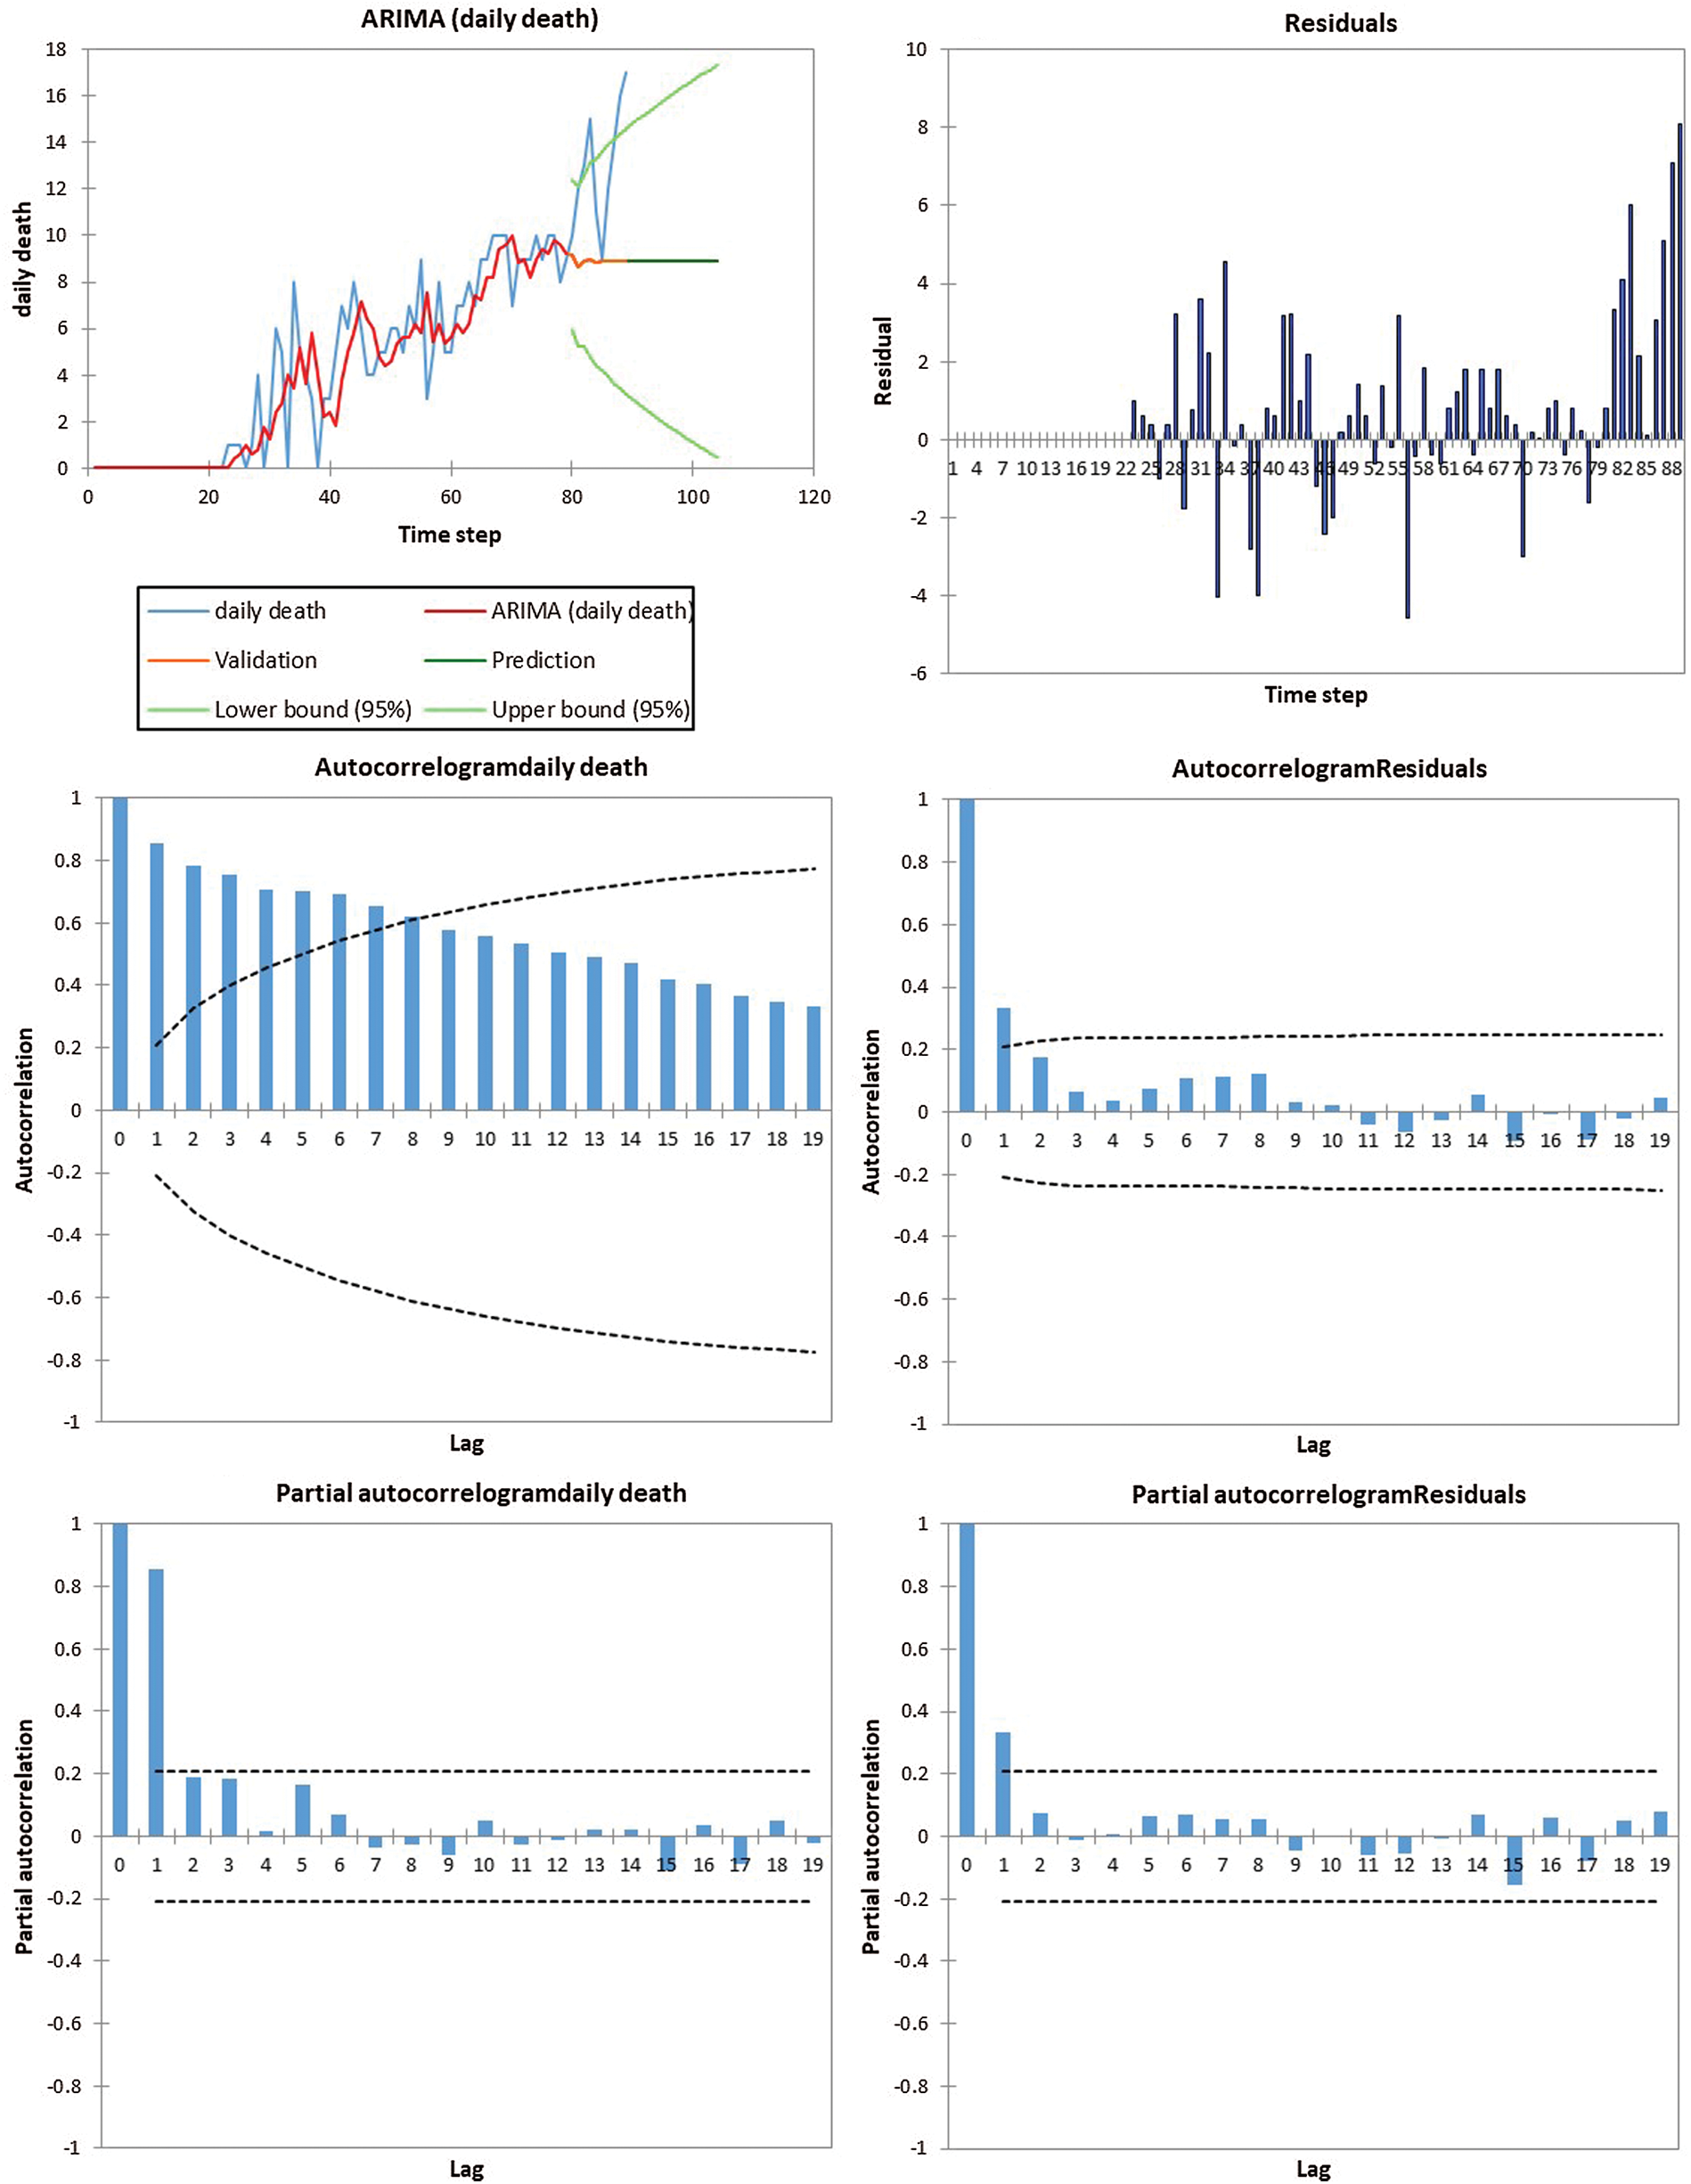
Figure 9: ARIMA (2,1,0) daily death cases
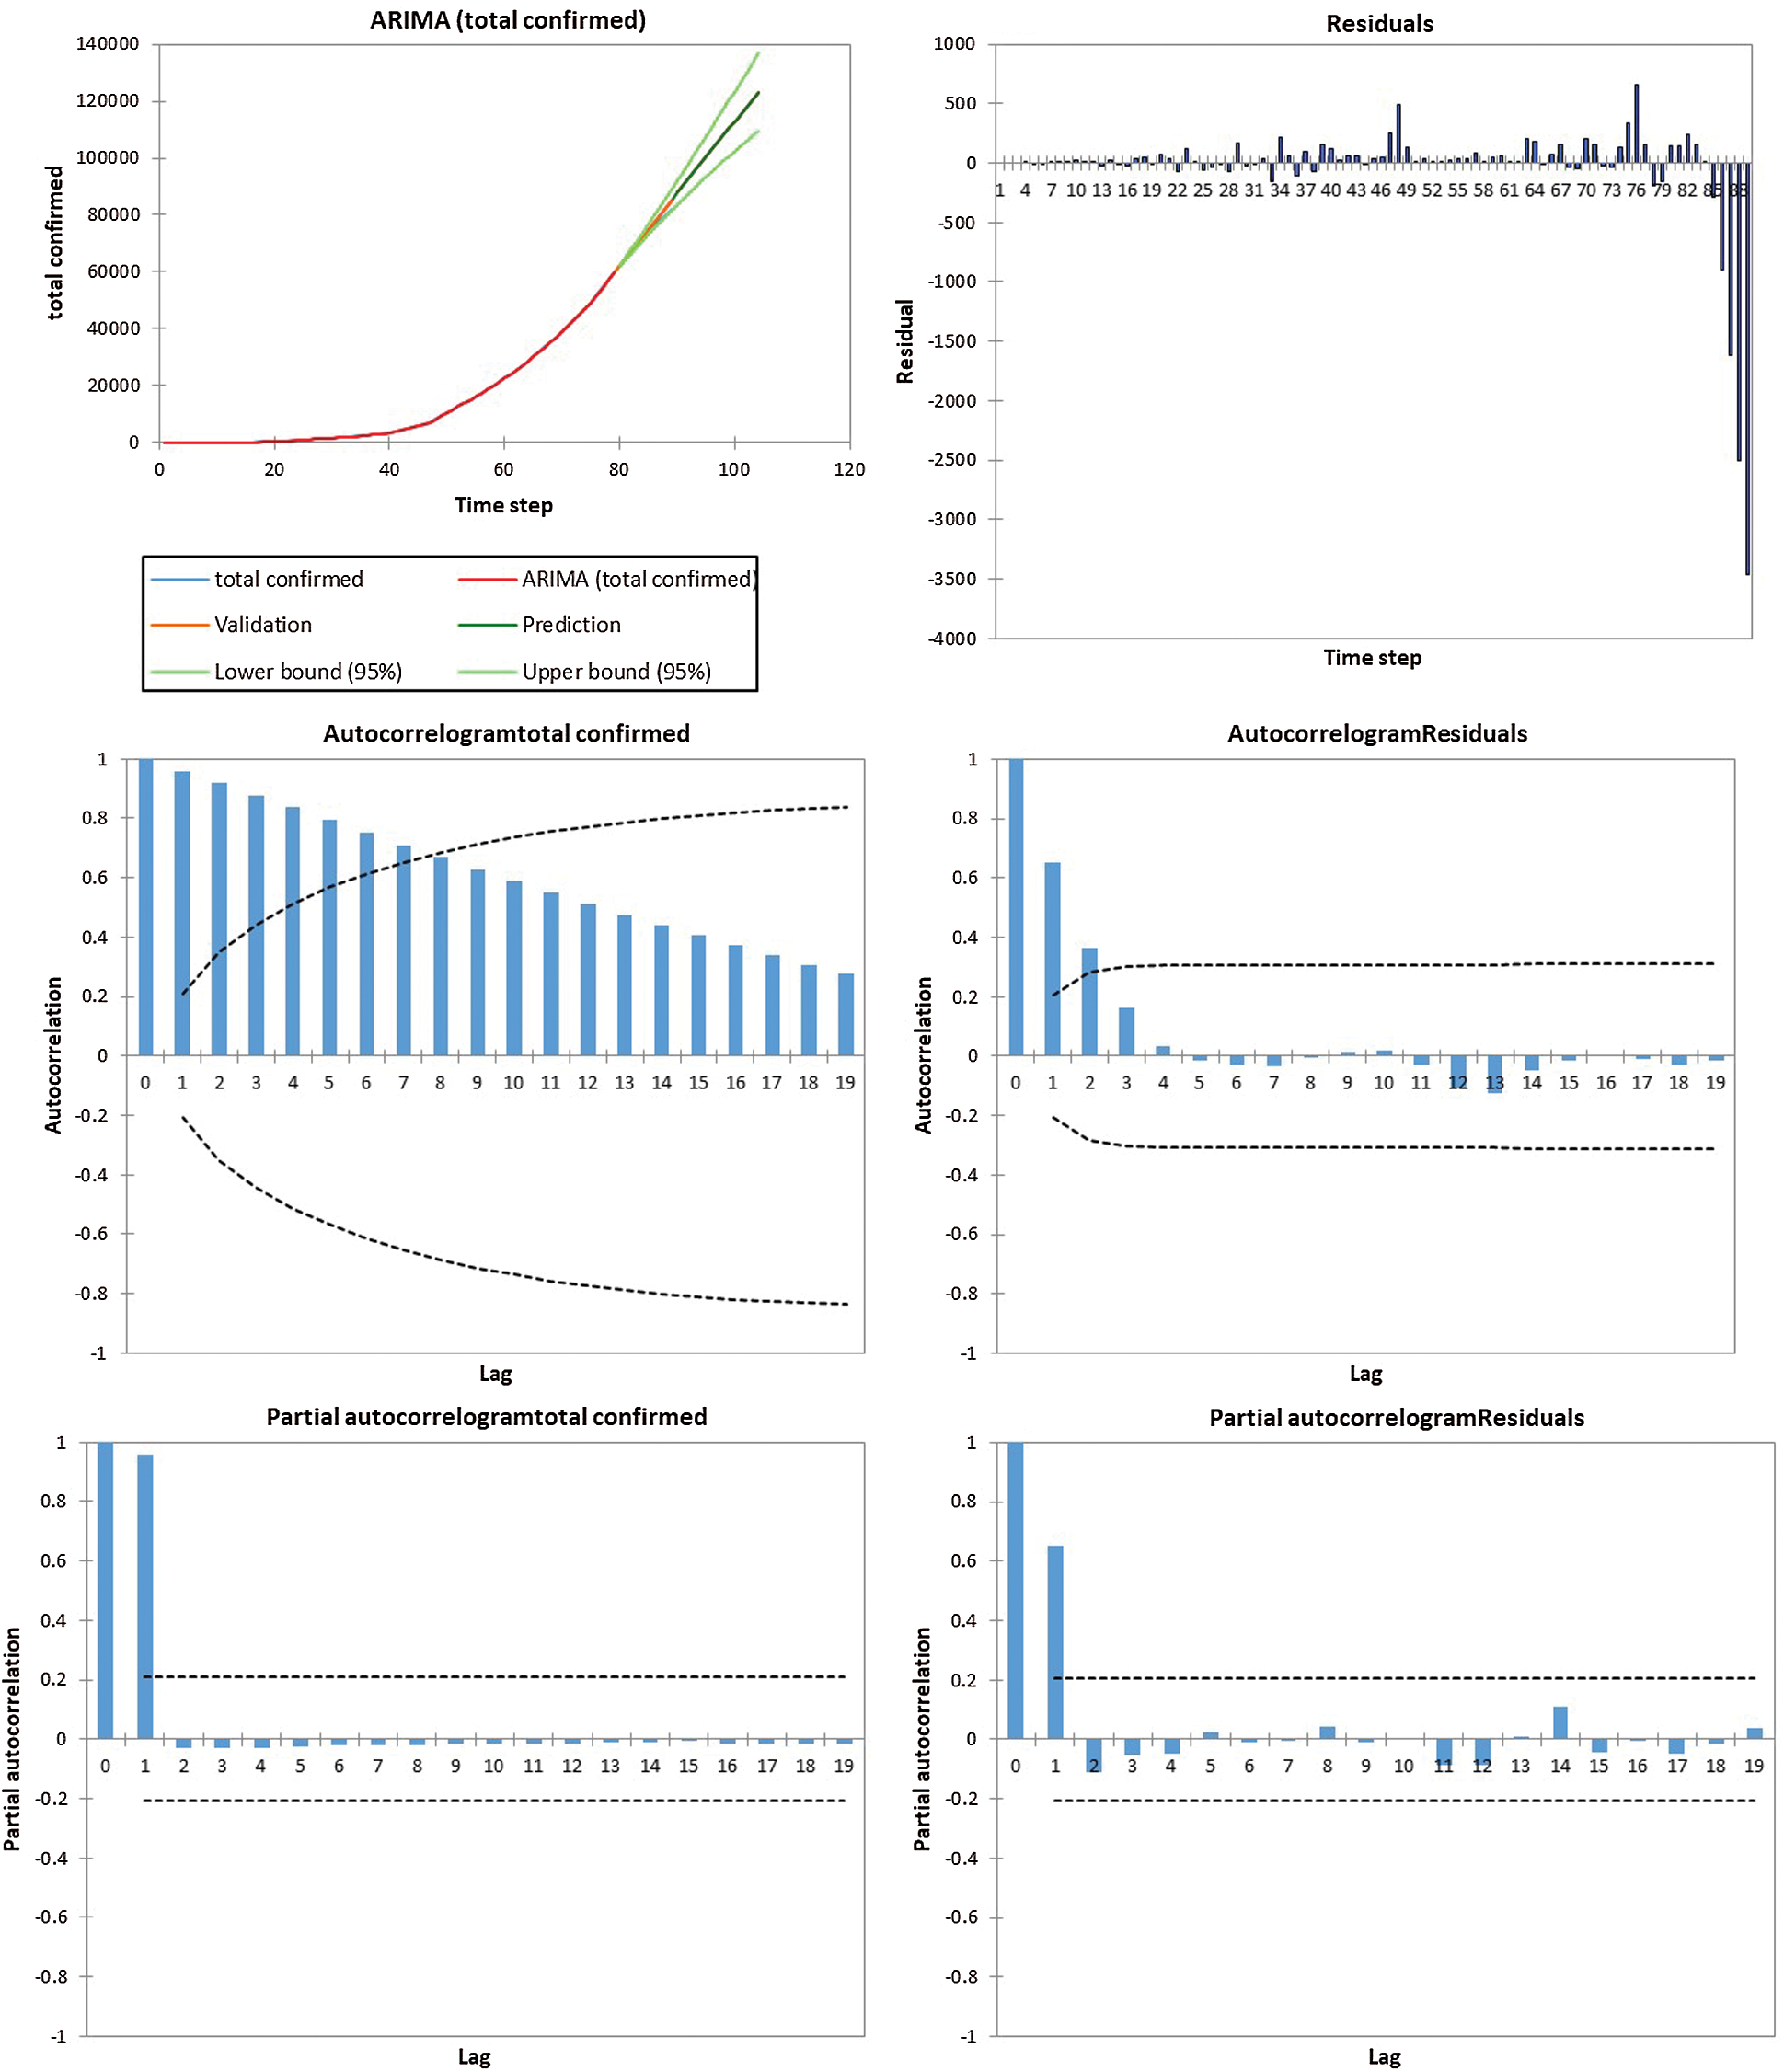
Figure 10: ARIMA (2,1,0) total confirmed cases
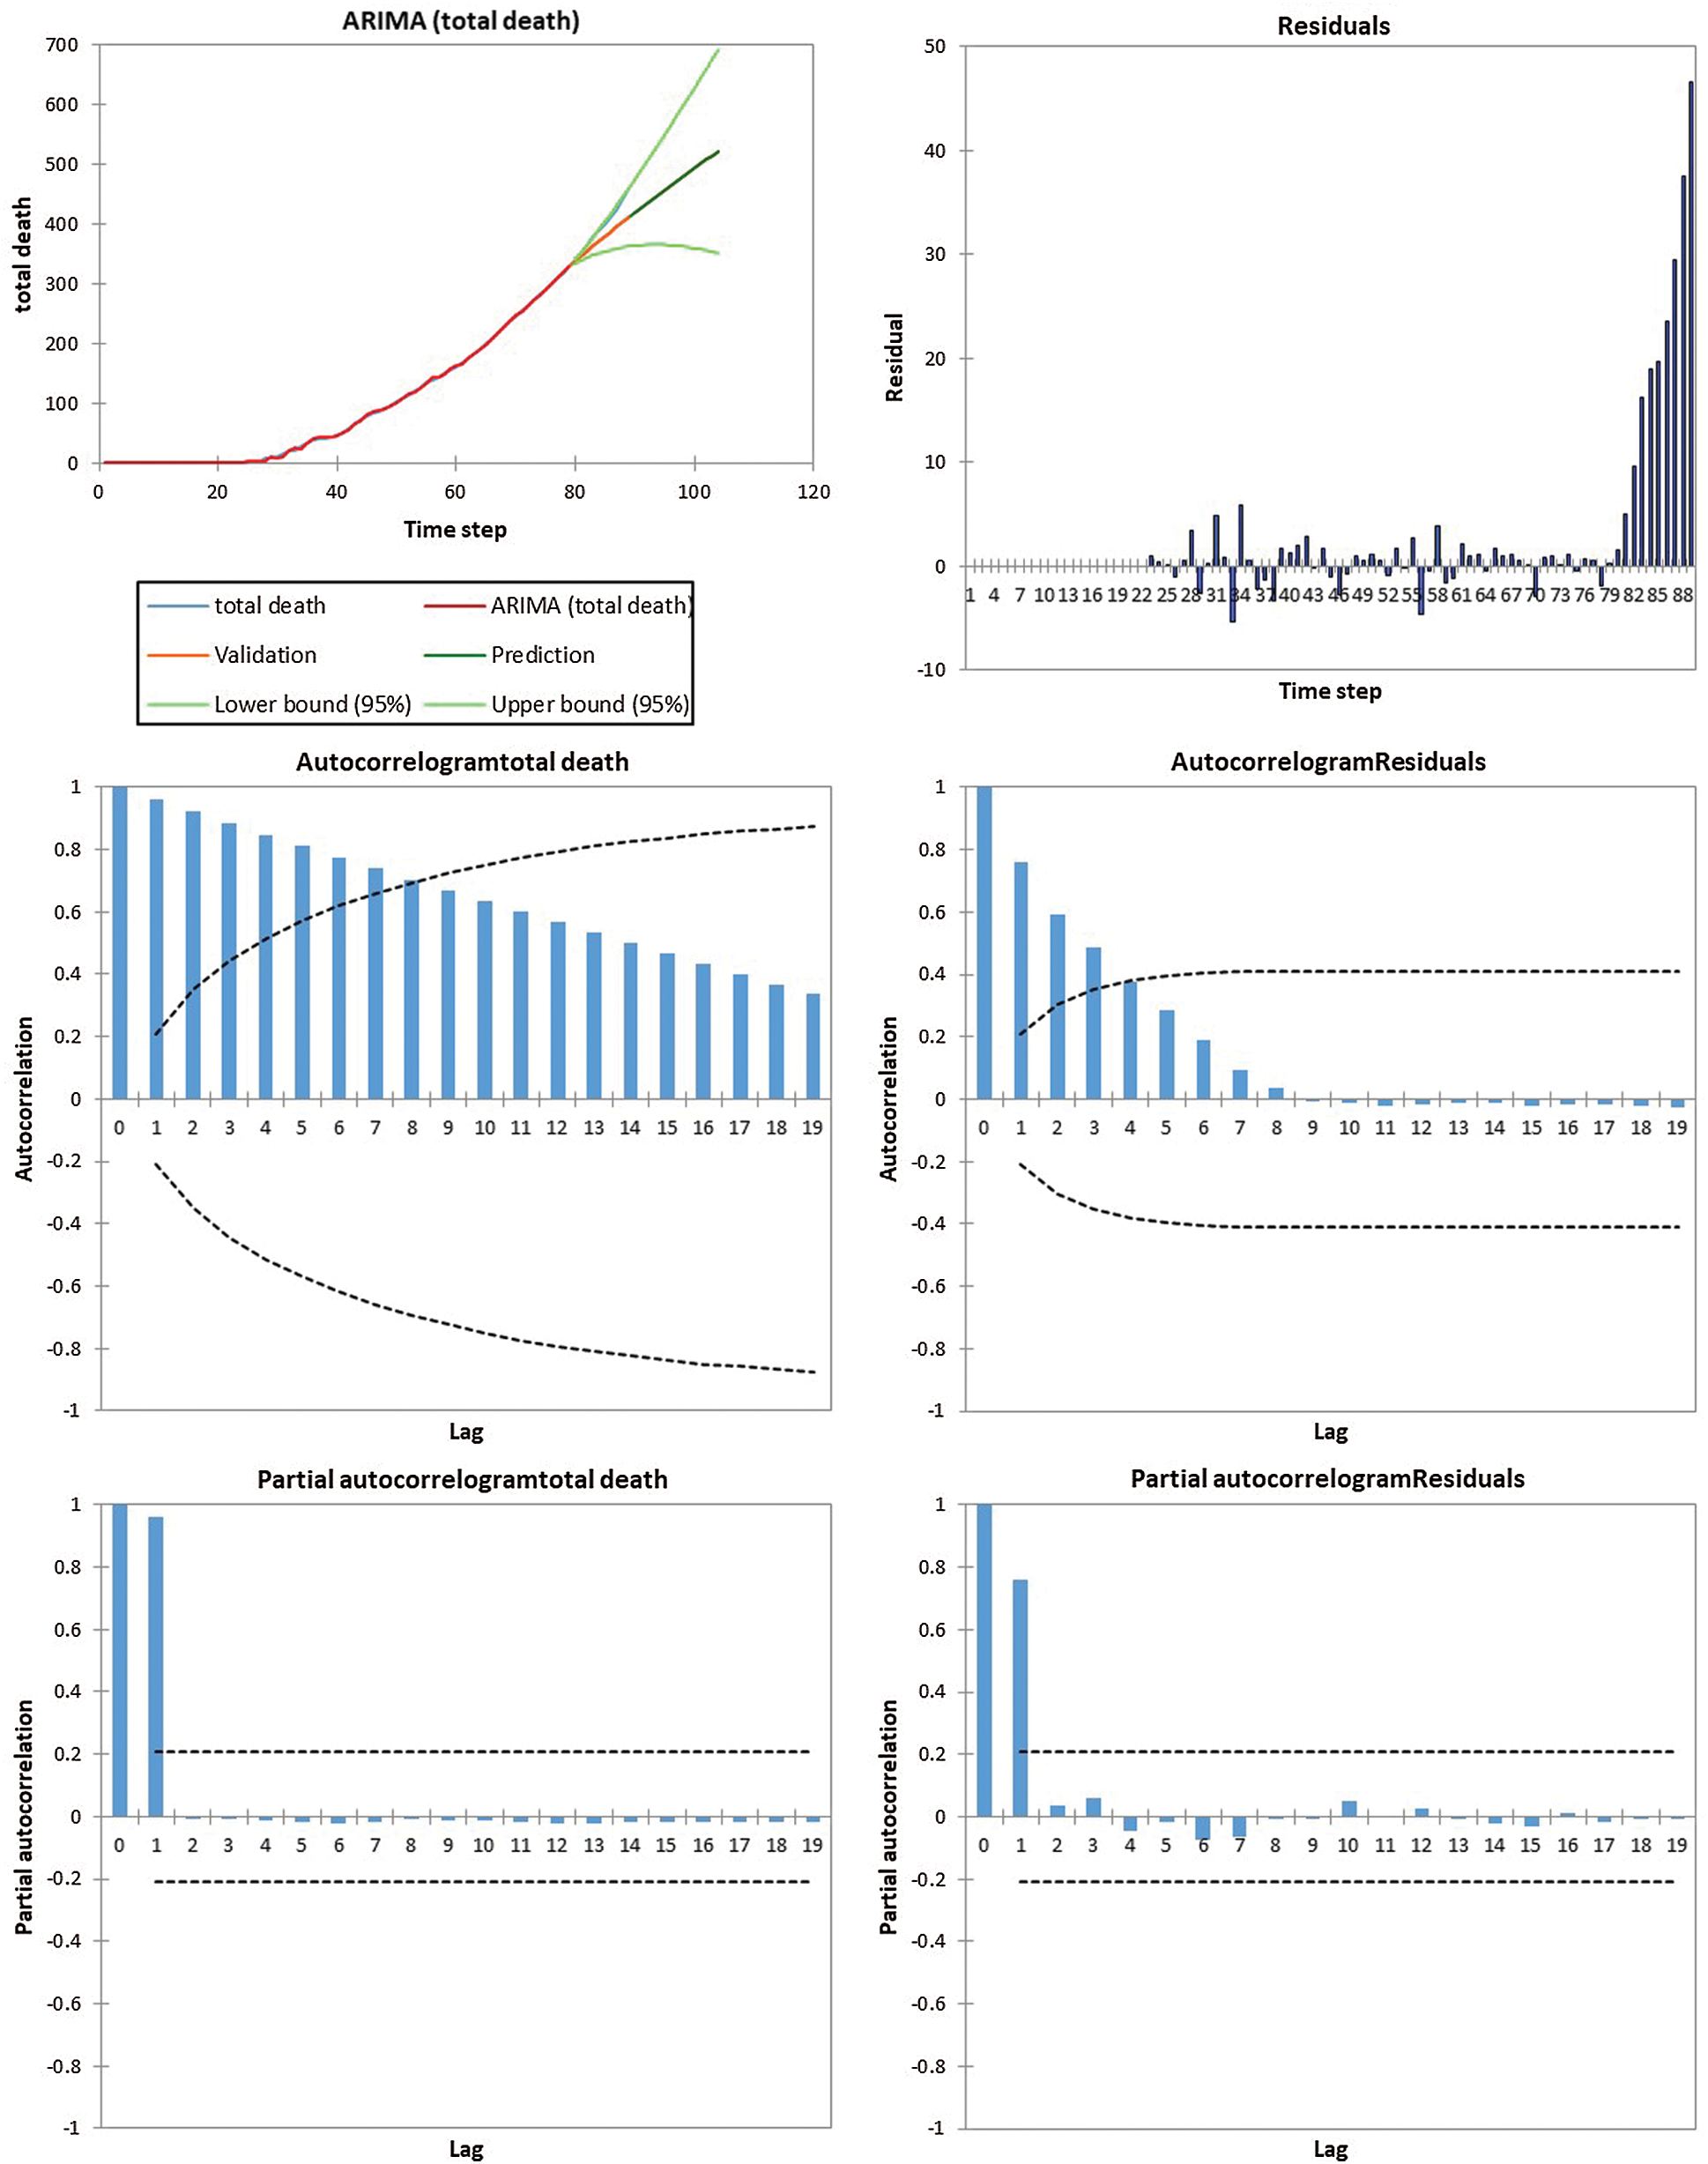
Figure 11: ARIMA (2,1,0) Total death cases
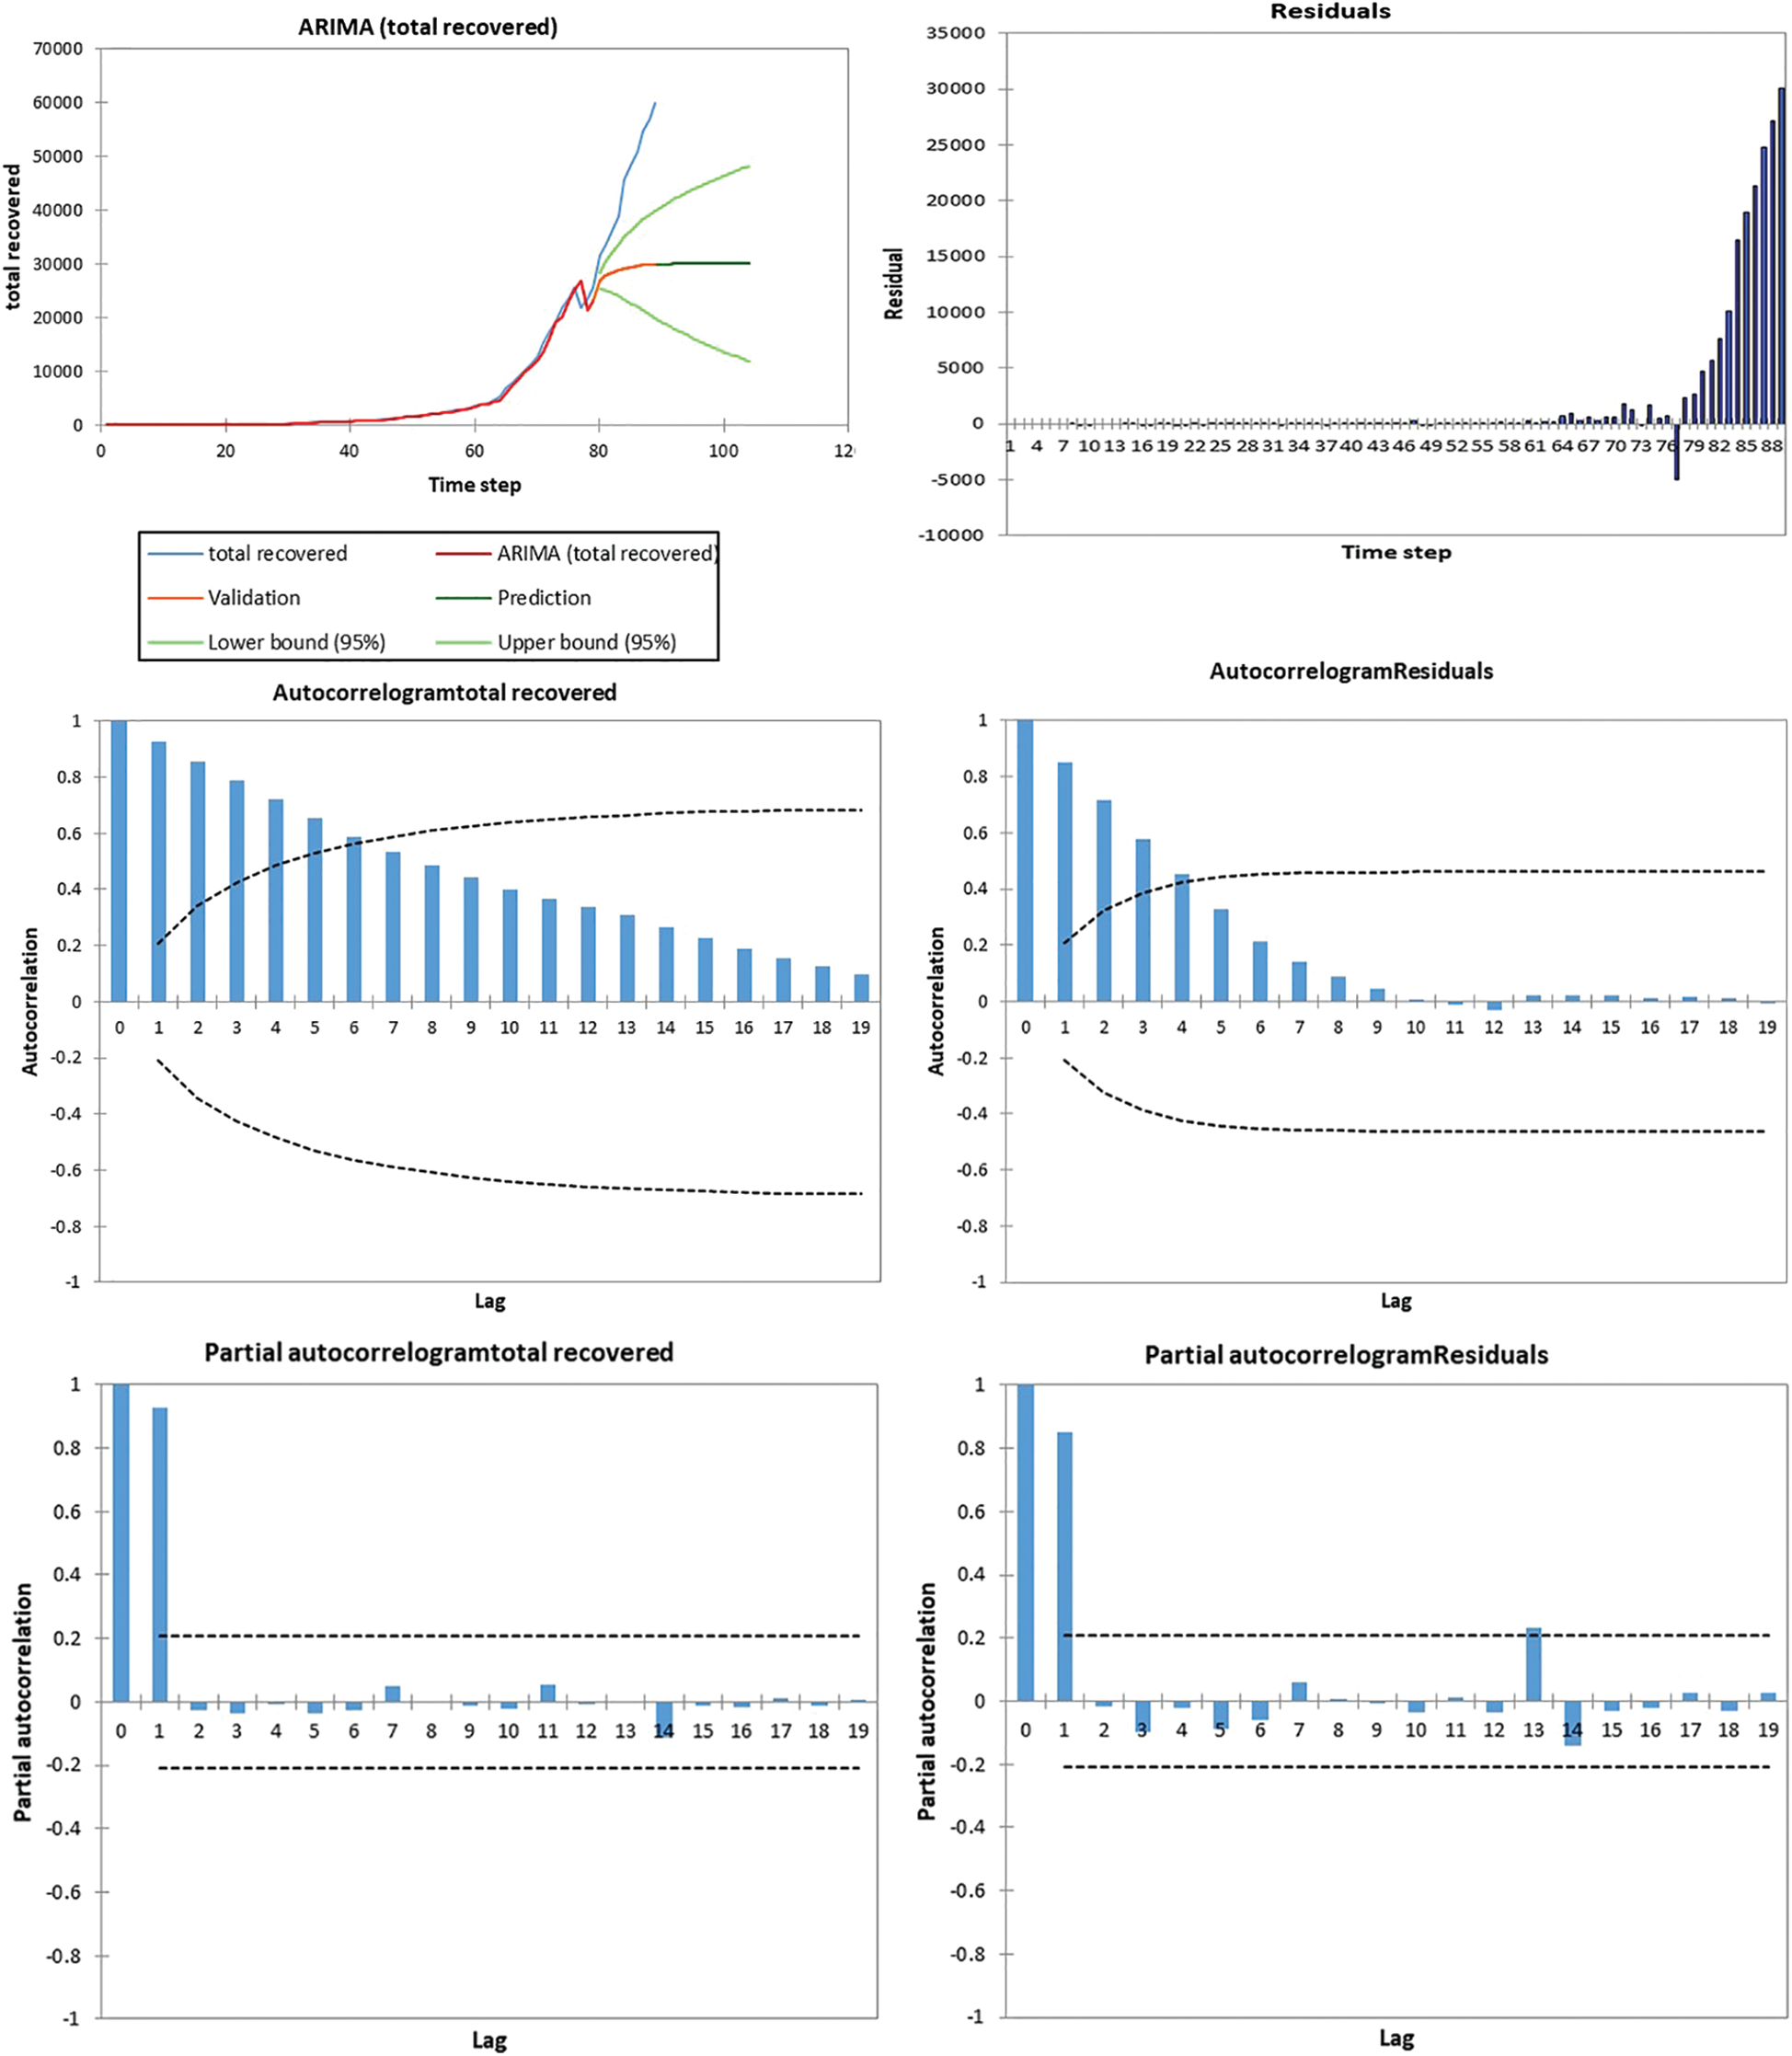
Figure 12: ARIMA (2,1,0) Total recovered cases
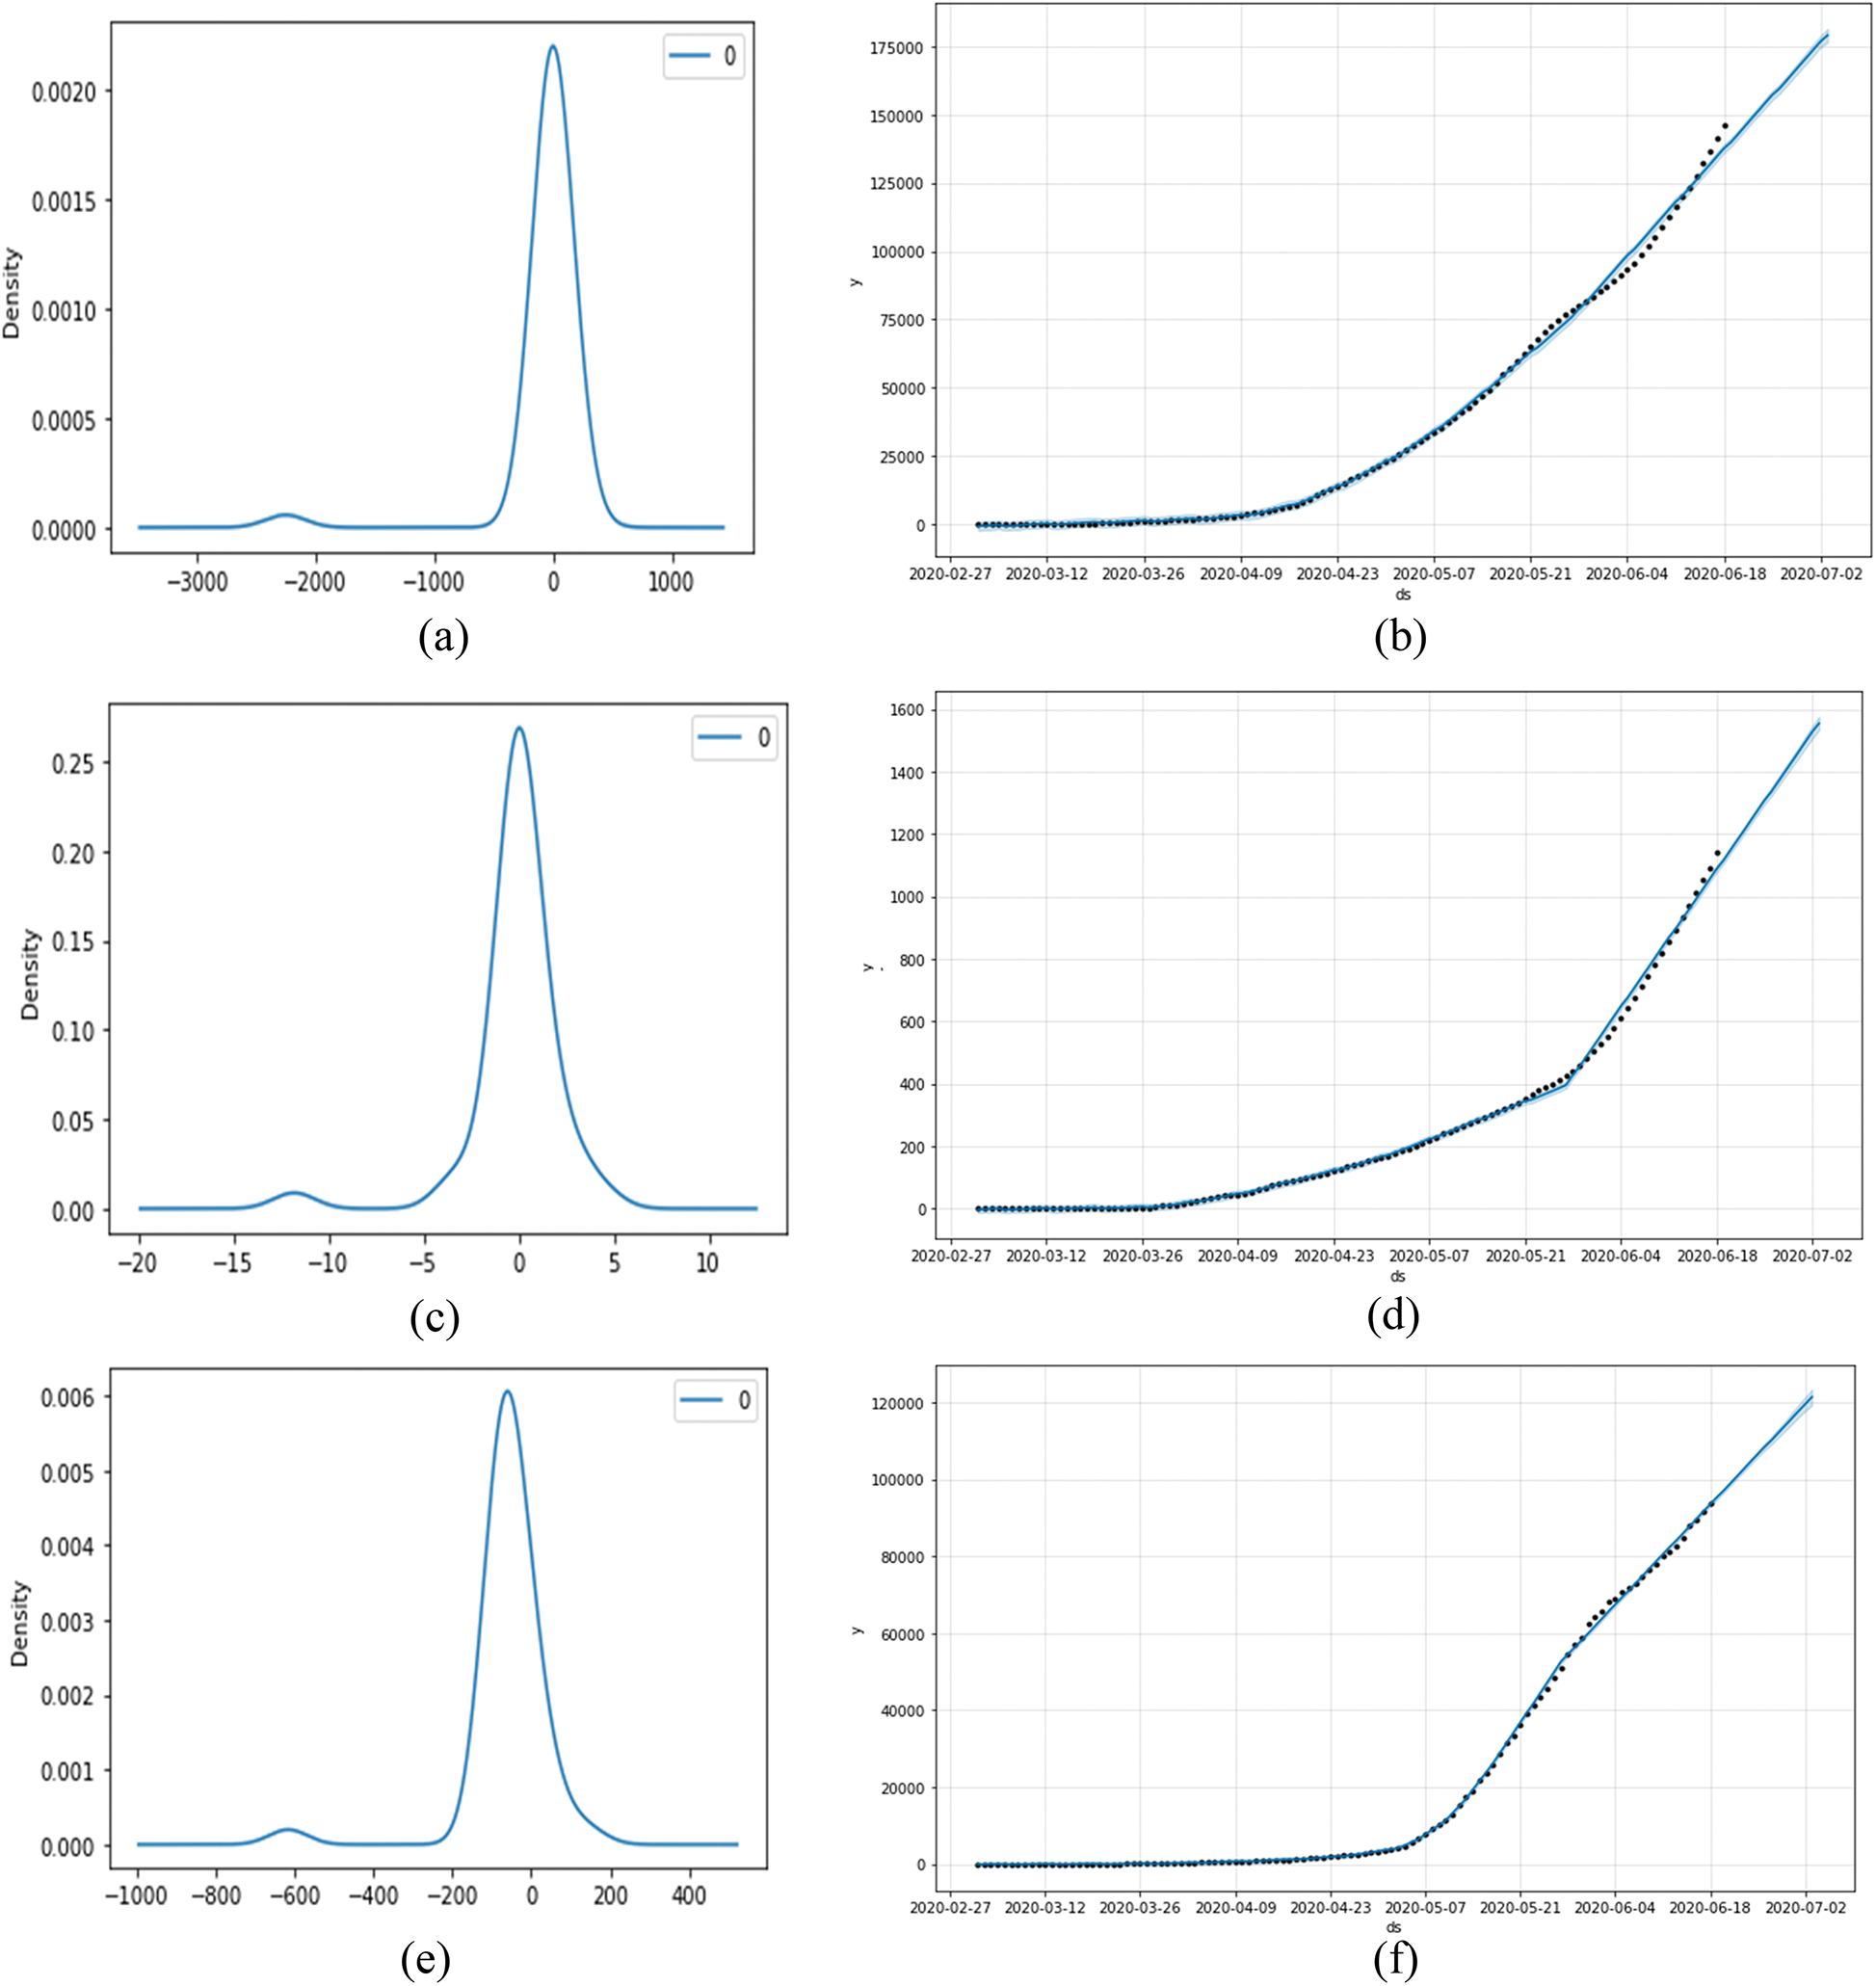
Figure 13: Forecast and trend analysis for total confirmed; total recovered; total death (a) Residual for total confirmed cases (b) Forecasting till July 02/2020 for total confirm (c) Residual for total death cases (d) Forecasting of total death cases (e) Residual for total recovered (f) Forecasting of total recovered cases
Table 1: Descriptive statistics of COVID–19 pandemic in Saudi Arabia
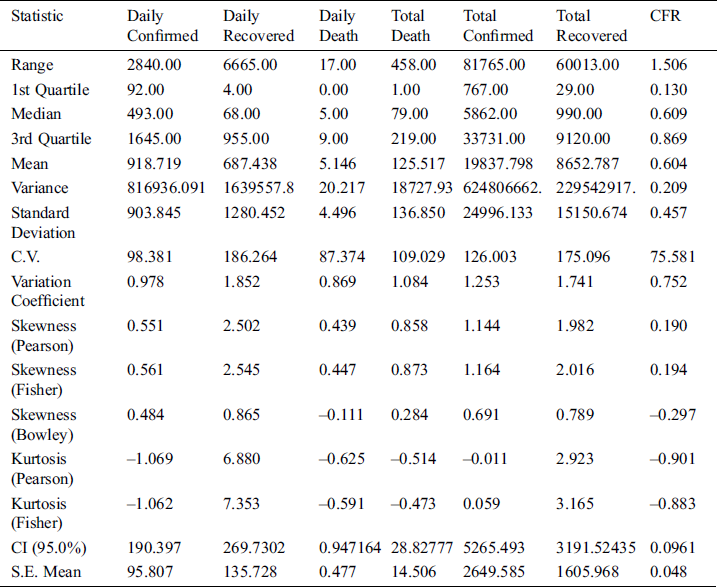
Table 2: Goodness of fit statistics at 95% confidence interval
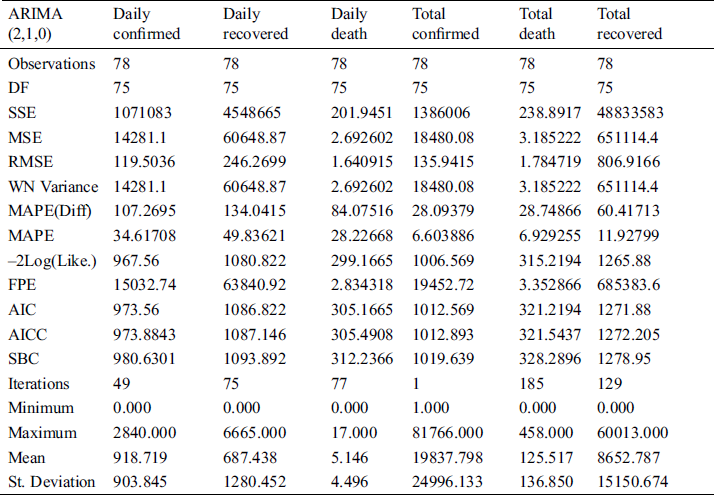
Table 3: ARIMA (2, 1, 0) fitness with AR (1) and AR (2) data for COVID–19 parameters
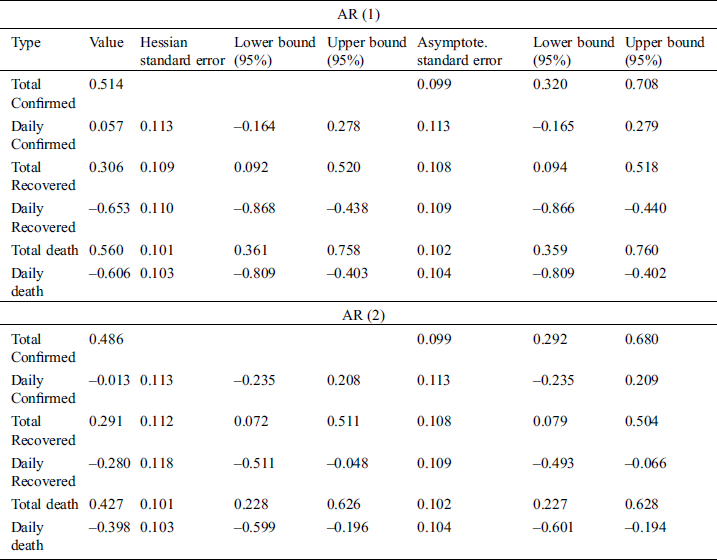
Table 4: Forecasting using ARIMA (2,1,0) model
From the figures and tables, it is observed that total confirmed, total death and total recovered cases are highly correlated. For ARIMA (2,1,0), it is observed that the value of constant is zero for all cases. Total confirmed cases, total deaths; total recovered cases and CFR are precisely fit to forecast using ARIMA (2,1,0) model, but daily deaths show a perturbed or random pattern, which is not perfectly fitted using ARIMA (2,1,0) model.
It may be observed that the actual and forecasted values using model ARIMA (2, 1, 0) for May 28, 2020, to May 30, 2020 are providing better results. It may be concluded that the ARIMA (2, 1, 0) model gives the best fit for long-term and short-term behavior. Hence, as the number of cases is increasing, proper cautionary measures and adherence to health guidelines are strongly recommended.
The forecasting of COVID-19 in order to predict the outcome of the disease in Saudi Arabia is critical for the policymakers and for the health department to focus on strengthening the surveillance system and reallocating the resources. The time series model plays an essential role in the prediction and control of the disease. This study has used the Geographic Information System [GIS] analysis and the ARIMA model for Saudi Arabia, the worst affected country in the Arabian region, to help predict the prevalence of the COVID-19 pandemic. The results of the study can help the policymakers to reallocate the resources like hospitals, staff, and the facilities required for the critically infected peoples. The cases are rising increasing in the country, and there is a need to ensure utilization of the available resources. The analysis helps in understanding the complex nature of the spread of the disease. The accuracy of an epidemic and pandemic forecasting largely depends on the data availability and uncertainty estimation. Despite this fact, forecasting based on data simulation has its advantage to better understand the present circumstances and plan the future. If the situation remains stable and data collection methods do not change significantly, then the predicted total number of recovered cases from the pandemic, until July 02, 2020, will be about 119,611 out of 211,953 confirmed cases. These predictions provide us the bounds of deaths forecasted as per the usual trend and extreme case scenario. Also, the results show very significant rise in the number of recovered cases, and reduction in the CFR value. Uncertainty prevails in the future, regardless of model and data, which needs to be kept in mind while making or acting upon any prediction; COVID-19 is not an exception. It is commendable that Saudi Arabia managed to limit the outbreak with its timely intervention. Nevertheless, the present analysis would be very helpful in dealing with the unwanted future rising trend of the COVID-19 infections in Saudi Arabia and develop guidelines or strategies to contain the pandemic. For further research, this method may be compared with other models like Neural Networks and machine learning.
Acknowledgement: The authors would like to express their heartfelt thanks to the editors and anonymous referees for their most valuable comments and constructive suggestions which leads to the significant improvement of the earlier version of the manuscript. The authors are thankful for the Deanship of Scientific research at Majmaah University and Guru Gobind Singh Indraprastha University, Delhi.
Funding Statement: The author(s) received no specific funding for this study.
Conflicts of Interest: The authors declare that they have no conflicts of interest to report regarding the present study.
References
1World Health Organization, “Coronavirus. ,” https://www.who.int/health-topics/coronavirus. 2020.
2J. Fan, X. Liu, W. Pan, M. W. Douglas and S. Bao. (2020), “Epidemiology of coronavirus disease in Gansu province. ,” China Emerging Infectious Diseases, vol. 26, no. (6), pp. 1257–1265, . [Google Scholar]
3H. A. Rothan and S. N. Byrareddy. (2020), “The epidemiology and pathogenesis of coronavirus disease (COVID-19) outbreak. ,” Journal of Autoimmunity, vol. 109, 102433, . [Google Scholar]
4S. P. Adhikari, S. Meng, Y. J. Wu, Y. P. Mao, R. X. Ye et al. (2020). , “Epidemiology, causes, clinical manifestation and diagnosis, prevention and control of coronavirus disease (COVID-19) during the early outbreak period: A scoping review. ,” Infectious Diseases of Poverty, vol. 9, no. (1), pp, 387, . [Google Scholar]
5L. Zhou, F. Tan, F. Yu and W. Liu. (2019), “Cluster synchronization of two-layer nonlinearly coupled multiplex networks with multi-links and time-delays. ,” Neurocomputing, vol. 359, pp, 264–275, . [Google Scholar]
6F. Yu, L. Liu, L. Xiao, K. Li and S. Cai. (2019), “A robust and fixed-time zeroing neural dynamics for computing time-variant nonlinear equation using a novel nonlinear activation function. ,” Neurocomputing, vol. 350, pp, 108–116, . [Google Scholar]
7F. Wang, L. L. Zhang, S. W. Zhou and Y. Y. Huang. (2019), “Neural network-based finite-time control of quantized stochastic nonlinear systems. ,” Neurocomputing, vol. 362, pp, 195–202, . [Google Scholar]
8X. Jiang, M. Coffee, A. Bari, J. Wang, X. Jiang et al. (2020). , “Towards an artificial intelligence framework for data-driven prediction of Coronavirus clinical severity. ,” Computers, Materials & Continua, vol. 62, no. (3), pp, 537–551, . [Google Scholar]
9World Health Organization. (2020), “Coronavirus disease 2019 (COVID-19) situation report-59. ,” March 19, . [Google Scholar]
10World Health Organization. (2019), “Coronavirus disease (COVID-19) pandemic. ,” . [Online]. Available: https://www.who.int/emergencies/diseases/novel–coronavirus–2019. [Google Scholar]
11N. Zhu, D. Zhang, W. Wang, X. Li, B. Yang et al. (2020). , “A novel coronavirus from patients with pneumonia in China, 2019. ,” New England Journal of Medicine, vol. 382, no. (8), pp, 727–733, . [Google Scholar]
12W. G. Carlos, C. S. Dela Cruz, B. Cao, S. Pasnick and S. Jamil. (2020), “COVID-19 disease due to SARS-CoV–2 (Novel Coronavirus). ,” American Journal of Respiratory and Critical Care Medicine, vol. 201, no. (4), pp, P7–P8, . [Google Scholar]
13Y. Wan, J. Shang, R. Graham, R. S. Baric and F. Li. (2020), “Receptor recognition by the novel coronavirus from Wuhan: An analysis based on decade-long structural studies of SARS coronavirus. ,” Journal of Virology, vol. 94, no. (7), pp, 1986, . [Google Scholar]
14H. Chen, J. Guo, C. Wang, F. Luo, X. Yu et al. (2020). , “Clinical characteristics and intrauterine vertical transmission potential of COVID-19 infection in nine pregnant women: A retrospective review of medical records. ,” Lancet, vol. 395, no. (10226), pp, 809–815, . [Google Scholar]
15UpToDate, 2020. [Online]. Available: https://www.uptodate.com/contents/coronavirus-disease–2019-covid–19#H2513094760. [Google Scholar]
16Centers for Disease Control and Prevention. (2020), “Interim guidelines for collecting, handling, and testing clinical specimens from persons under investigation (PUIs) for Coronavirus Disease 2019 (COVID–19). ,” . [Online]. Available: https://www.cdc.gov/coronavirus/2019–nCoV/lab/guidelines–clinical–specimens.html. [Google Scholar]
17World Health Organization. (2020), “Responding to community spread of COVID-19 interim guidance. ,” . [Online]. Available: https://www.who.int/docs/default-source/coronaviruse/20200307-responding–to-covid–19-communitytransmission–final.pdf. [Google Scholar]
18R. Bhardwaj and D. Datta, “Consensus algorithm,” “Decentralised Internet of Things: A blockchain perspective.” M. A. Khan, M. T. Quasim, F. Algarni and A. Alharthi (eds.), vol. 71, Springer, pp. 91–107, 2020. [Google Scholar]
19A. Bangia, R. Bhardwaj and K. V. Jayakumar, “Water quality analysis using artificial intelligence conjunction with wavelet decomposition,” in Advances in Intelligent Systems and Computing. Numerical Optimization in Engineering and Sciences, J. Kacprzyk, D. Dutta and B. Mahanty (eds.), Springer, vol. 979. pp. 107–123, 2020.
20R. Bhardwaj and A. Bangia. (2019), “Neuro-fuzzy analysis of demonetization on NSE,” in Soft Computing for Problem Solving, J. C. Bansal, K. N. Das, A. Nagar, D. Kusum and A. K. Ojha (eds.), Springer, Nature, pp, 853–861, .
21R. Bhardwaj. (2019), “Nonlinear time series analysis of environment pollutants,” in Mathematical Modeling on Real World Problems: Interdisciplinary Studies in Applied Mathematics, Z. Aslan, F. Dökmen, A. H. Siddiqi and E. Feoli (eds.), . New York, USA: NOVA Publisher, pp, 71–102, .
22R. Bhardwaj, “Wavelets and fractal methods with environmental applications,” in Mathematical Models, Methods and Applications, Industrial and Applied Mathematics, A. H. Siddiqi, P. Manchanda and R. Bhardwaj (eds.), Singapore: Springer, pp. 173–195, 2016.
23V. R. Durai and R. Bhradwaj. (2014), “Evaluation of statistical bias correction methods for numerical weather prediction model forecasts of maximum and minimum temperatures. ,” Natural Hazards, vol. 73, no. (3), pp, 1229–1254, .
24V. R. Durai and R. Bhardwaj. (2013), “Improving precipitation forecasts skill over India using a multi-model ensemble technique. ,” Geofizika, vol. 30, no. (2), pp, 155–172, .
25K. Srivastava and R. Bhardwaj. (2014), “Analysis and very short range forecast of cyclone AILA with radar data assimilation with rapid intermittent cycle using ARPS 3DVAR and cloud analysis techniques. ,” Meteorology and Atmospheric Physics, vol. 124, no. (1–2), pp, 97–111, .
26K. Srivastava and R. Bhardwaj. (2014), “Assimilation of Doppler weather radar data in WRF model for simulation of Tropical Cyclone Aila. ,” Pure and Applied Geophysics, vol. 171, no. (8), pp, 2043–2072, .
27K. S. Parmar and R. Bhardwaj. (2013), “Water quality index and fractal dimension analysis of water parameters. ,” International Journal of Environmental Science and Technology, vol. 10, no. (1), pp, 151–164, .
28R. Bhardwaj and D. Pruthi. (2020), “Evolutionary techniques for optimizing air quality model. ,” Procedia Computer Science, vol. 167, pp, 1872–1879, .
29R. Bhardwaj and D. Pruthi. (2020), “Development of model for sustainable nitrogen dioxide prediction using neuronal networks. ,” International Journal of Environmental Science and Technology, vol. 17, pp, 2783–2792, .
30R. Bhardwaj and D. Pruthi. (2019), “Variability analysis in pm 2.5 monitoring. ,” Datssa in Brief, vol. 24, pp, 1037, . [Google Scholar]
 | This work is licensed under a Creative Commons Attribution 4.0 International License, which permits unrestricted use, distribution, and reproduction in any medium, provided the original work is properly cited. |