DOI:10.32604/cmc.2020.012878
| Computers, Materials & Continua DOI:10.32604/cmc.2020.012878 | |
| Article |
The Effect of Surface Pit Treatment on Fretting Fatigue Crack Initiation
1Department of Mechanics and Engineering Science, Nanjing University of Science and Technology, Nanjing, 210094, China
2Soete Laboratory, Department of Electrical Energy, Metals, Mechanical Constructions and Systems, Faculty of Engineering and Architecture, Ghent University, Zwijnaarde, 9052, Belgium
3Division of Computational Mechanics, Ton Duc Thang University, Ho Chi Minh City, Vietnam
4Faculty of Civil Engineering, Ton Duc Thang University, Ho Chi Minh City, Vietnam
*Corresponding Author: Magd Abdel Wahab. Email: magd.abdelwahab@tdtu.edu.vn
Received: 16 July 2020; Accepted: 15 August 2020
Abstract: This paper analyses the effect of surface treatment on fretting fatigue specimen by numerical simulations using Finite Element Analysis. The processed specimen refers to artificially adding a cylindrical pit to its contact surface. Then, the contact radius between the pad and the specimen is controlled by adjusting the radius of the pit. The stress distribution and slip amplitude of the contact surface under different contact geometries are compared. The critical plane approach is used to predict the crack initiation life and to evaluate the effect of processed specimen on its fretting fatigue performance. Both crack initiation life and angle can be predicted by the critical plane approach. Ruiz parameter is used to consider the effect of contact slip. It is shown that the crack initial position is dependent on the tensile stress. For same type of model, three kinds of critical plane parameters and Ruiz method provide very similar position of crack initiation. Moreover, the improved sample is much safer than the flat-specimen.
Keywords: Finite element analysis; surface pit; stress distribution; fretting fatigue; critical plane approach
When there are a compression force and a periodic lateral slip between contact bodies, the components are prone to fretting fatigue. Moreover, fretting fatigue is always accompanied by fretting wear. Compared to uniaxial fatigue, fretting fatigue has more complex stress concentration and shorter life [1]. For homogeneous materials, the fretting fatigue performance mainly depends on the surface stress and strain distributions [2]. Previous researchers have divided fretting fatigue damage into two main stages: crack initiation and crack propagation [3–6]. In addition to load, material, temperature and microstructure, the shape of the contact surface also has a significant impact on fretting fatigue crack initiation. Previous researchers have compared the stress profiles of the two most common fretting fatigue contact types: flat-on-flat and cylinder-on-flat [7]. The experimental crack initiation life prediction studies for these two contact geometries were also reported in [8]. The difference between the sphere and the cylinder contact was presented in [9]. In addition to experimental methods, machine learning [10] and phase field methods [11] were also used to study fracture problems. And in order to predict the crack initiation life, scholars have established many empirical theoretical formulas. The critical plane approach is a widely used and validated method [3,12]. In fact, under cyclic loading, the stresses are continuously changing, and during the deformation process, the energy is also continuously transforming. When these parameters reach a critical value, cracks are generated. The critical plane approach is divided into three main categories based on stress, strain, and energy [3]. For the critical plane approach based on stress, the plane subjected to the maximum stress amplitude is defined as the critical plane. The strain and energy based critical plane methods have a similar definition, which will be discussed in a later section. In addition to experimental research, recent numerical methods are increasingly used by researchers because they can help to understand the distribution of stress and strain at the contact surface, which is difficult to be measured by experiments [13,14].
In this study, we propose improvements to the standard experimental geometry (flat-specimen) by adding artificial cylindrical pits to the specimen [6]. In addition, a finite element model is established to study the contact stress and strain distributions under different contact configurations. The FE model is combined with three types of critical plane methods, and the crack initiation life is predicted. The results show that the specimen after the treatment greatly increases the fretting fatigue crack initiation life, and it seems that the ratio of the contact stress peak to the contact radius is reciprocal. It is worth noting that the new designed specimen increases the surface slip amplitude, while it increases the fatigue life, which may cause more pronounced fretting wear. When the artificial pit diameter changes continuously, the magnitude of the stress amplitude and the slip amplitude may make the specimen having the best performance.
Fretting fatigue is a complex multi-axis fatigue problem. The critical plane method is widely used as a recognized fatigue crack initiation theory for fretting fatigue problems. In such a method, the crack will initiate along some special plane having the maximum critical plane parameter or shear strain amplitude. In this paper, three kinds of critical plane parameters are used, namely stress based Findley FP [15], strain based Fatemi-Socie FS [16], and energy based Smith–Watson–Topper SWT [17] parameters. The critical plane parameter of Findley is defined as:

where  is the maximum shear stress amplitude of whole cycle on any plane for a point, and
  is the maximum normal stress on any plane for the same point.
  is the material fatigue constant and can be obtained using Eq. (2) as:
where  MPa is the fatigue limit under tension and
  MPa is the fatigue limit under torsion [6,18]. At first, Findley did not propose the equation to predict the initiation life, however later on, Park et al. [19] proposed the expression shown in Eq. (3):

where  is the fatigue strength coefficient in shear and
  is the fatigue strength exponent in torsion, which are equal to 482.08 MPa and −0.096, respectively. When the FP parameter reaches the maximum value, the plan, at which the crack initiates, is the critical plane.
Fatemi and Socie proposed a model that can be applied to materials and load conditions producing shear mode failures [16]. This model depends on the strain. The maximum shear strain amplitude defines the critical plane. The  can be determined using Eqs. (4) and (5) as:


where  is the maximum shear strain amplitude.
  and
and  are the shear fatigue strength and shear fatigue ductility exponent, respectively.
  is the shear modulus of elasticity.
  is the shear fatigue ductility coefficient.
  is the tensile yield strength and
  is the tensile fatigue strength coefficient.
The SWT parameter is energy based critical plane criterion. It is very suitable for tensile fatigue problems [20]. Later, Socie [17] proposed the final form of SWT parameter as shown in Eq. (6):

where  is the normal strain amplitude, and
 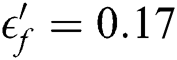 is the tensile fatigue ductility coefficient. Through the formulas of the above three criteria, it can be found that the stress and strain histories in the periodic load will determine the fatigue of the specimen.
From the above description, it can be found that the critical plane parameters do not consider the influence of slip between the contact surfaces on the crack initiation. Finally, this paper will use the Ruiz parameter [21] to evaluate the influence of slip as show in Eq. (7).

where  is the tensile stress,
  is the shear stress and
  is the slip amplitude.
As shown in Fig. 1, a schematic of the classical fretting fatigue specimen is illustrated. The specimen is flat, which is the general case. This paper aims to study the effect of surface pit treatment on fretting fatigue crack initiation behavior. Three models are used for comparative studies depending on the degree of surface pit treatment. Due to the symmetry of the structure in Fig. 1 and in order to save calculation time in the numerical simulation, usually only half of the structure is considered. The geometry and loading conditions of the finite element model of the flat specimen, named as type 1, is shown in Fig. 2. The movement of cylinder pad is fixed horizontally and free vertically. The vertical degrees of freedoms of the specimen centerline are fixed, and the horizontal ones are free.
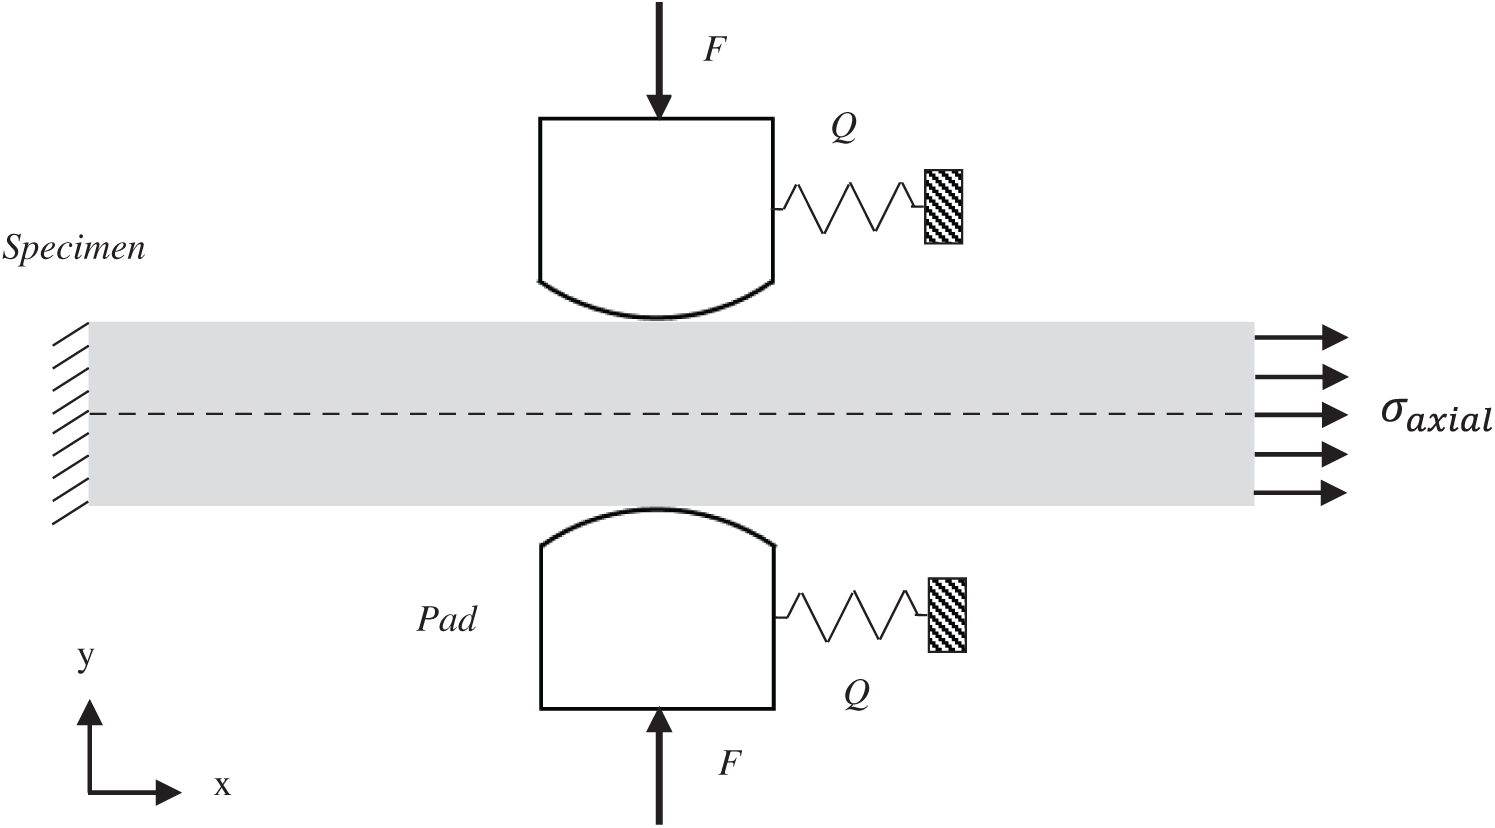
Figure 1: The schematic of fretting fatigue problem
Figure 2: Geometry and loading conditions of the fretting fatigue numerical model (flat-specimen)
The thickness of the pad and specimen are  and the radius of cylinder pad is
  . Next, artificially processed specimen, i.e. adding pits to the surface of the contact area, is also studied. The size of the pit is selected based on the contact radius between the pad and the specimen under normal compression contact load. In this study, the material of cylinder pad and specimen is aluminum 2024-T3, whose elastic modulus and Poisson's ratio are 72.1 GPa and 0.33, respectively.
As shown in Fig. 2, only the normal force F = 540 N acts at the top of the pad, which is a Hertzian contact problem [22]. When the pit radius is  , the contact radius
  and contact stress distribution on the contact surface
  are given by Eqs. (8) and (9), respectively [22].
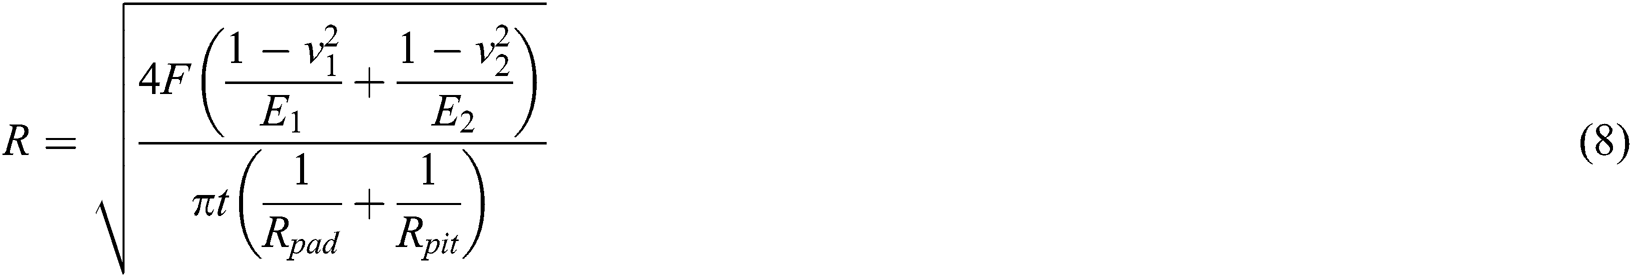

where  is the elastic modulus of the cylinder pad and the specimen, and
  is the Poisson’s ratio.
Therefore, as shown in Fig. 3, the contact radius of the two components will change with different pit radius according to the Hertzian contact theory. It is worth noting that for the case where the cylinder is in contact with the pit, the pit radius  should be taken as a negative value in Eq. (8). In Fig. 3, the relationship between the true pit radius and the contact radius is shown for the sake of clarity. If the pit radius tends to infinity the Hertzian contact radius is 0.474 mm. This is the type 1 model, shown as red point in Fig. 3. When the pit radius is slightly larger than 50 mm, the theoretical contact radius changes drastically, and the maximum value can reach 5 mm. The main idea of surface processing is to increase the contact area and reduce the surface stress and strain amplitudes. Thus, adding a pit to the specimen with a radius of 50 mm (same as the pad) is considered first. However, this produces a complete slip, and the calculation could not converge. Therefore, 50.5 mm (blue point) is selected as the pit radius to facilitate convergence (in the remaining part of this article, it is named type 3). Its Hertzian contact radius is 4.645 mm. In order to consider the intermediate state, the 52 mm is used as pit radius for type 2 model, whose theoretical contact radius is 2.36 mm (green point).
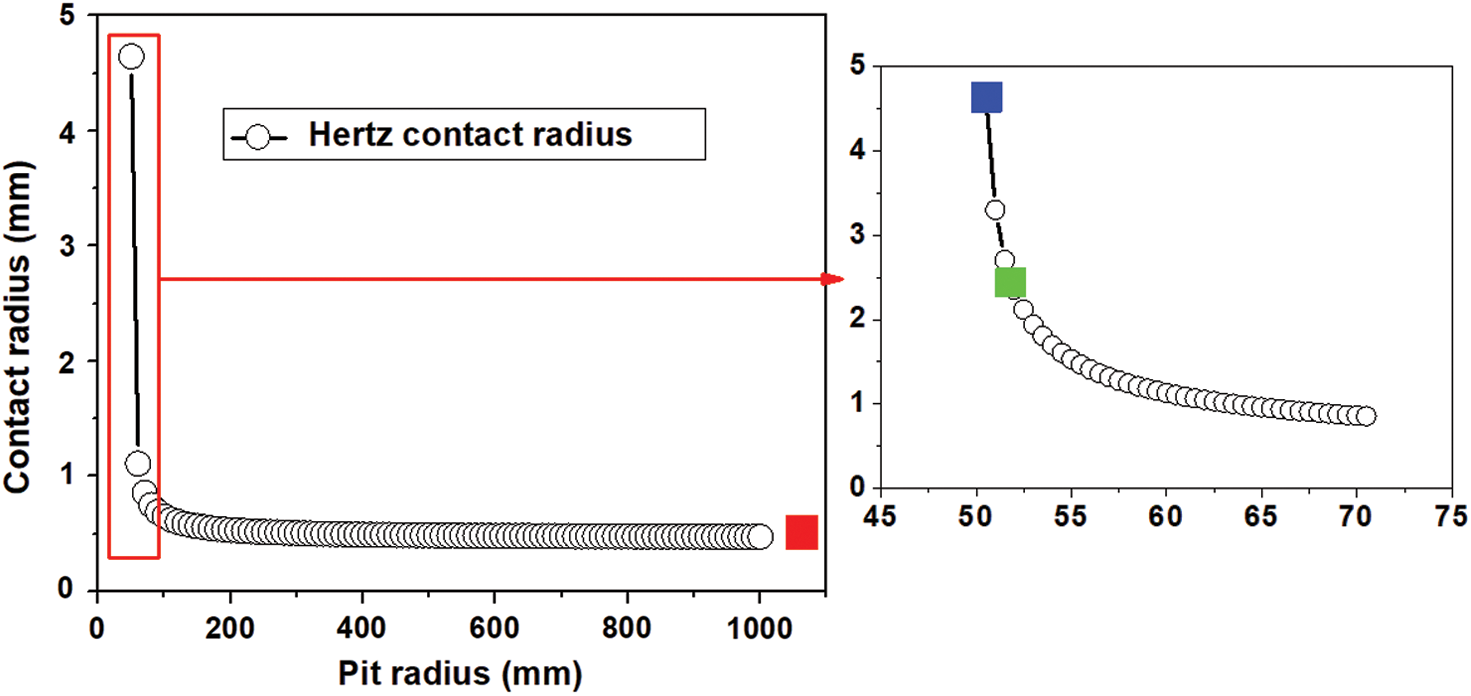
Figure 3: The theoretical contact radius change with the pit radius
Based on the Hertz contact theory; i.e., Eq. (9), the normal stress on the contact surface is shown in Fig. 4. The maximum normal stress of each model are -186.965 MPa, -36.66 MPa and -18.6 MPa, respectively. The contact radius of type 3 is almost 10 times higher than that of type 1, and the maximum normal stress is one-tenth of the maximum value of type 1.
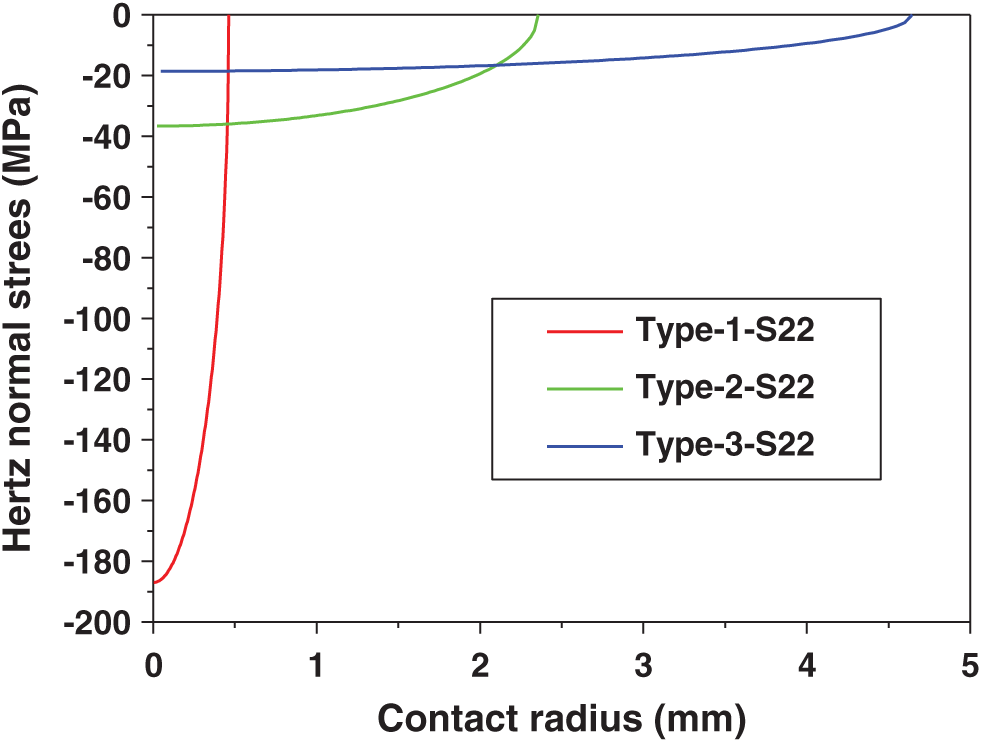
Figure 4: The theoretical normal stress of the contact surface for types 1, 2 and 3
The artificially processed specimen and FE model of type 2 are shown in Fig. 5b as an example. The FE model in Fig. 5 is built in Abaqus using plane strain 2D four nodes element (CPE4R). Considering the computational efficiency and accuracy, the finite element model uses different partitions for discretization. On the contact surface, the size of the element is 0.002 mm, which allows the mesh to converge and obtain sufficiently accurate results [2]. The discretization method of type 1 model is similar to that of type 2 as shown in Fig. 5a. However, for type 3 model, too large contact area will cause too many elements that affect the calculation convergence. According to our previous convergence study, the mesh size of the contact area mainly affects the stress accuracy at the contact edge [2]. So for the type 3 model, this study mainly refines the elements near the contact edge, and the size is equal to 0.002 mm as shown in Fig. 5c. The contact interaction behavior is defined as a general contact algorithm. The friction formulation of tangential behavior uses Lagrange multiplier and the coefficient of friction equals to 0.65. And the normal behavior is defined as hard contact formulation.
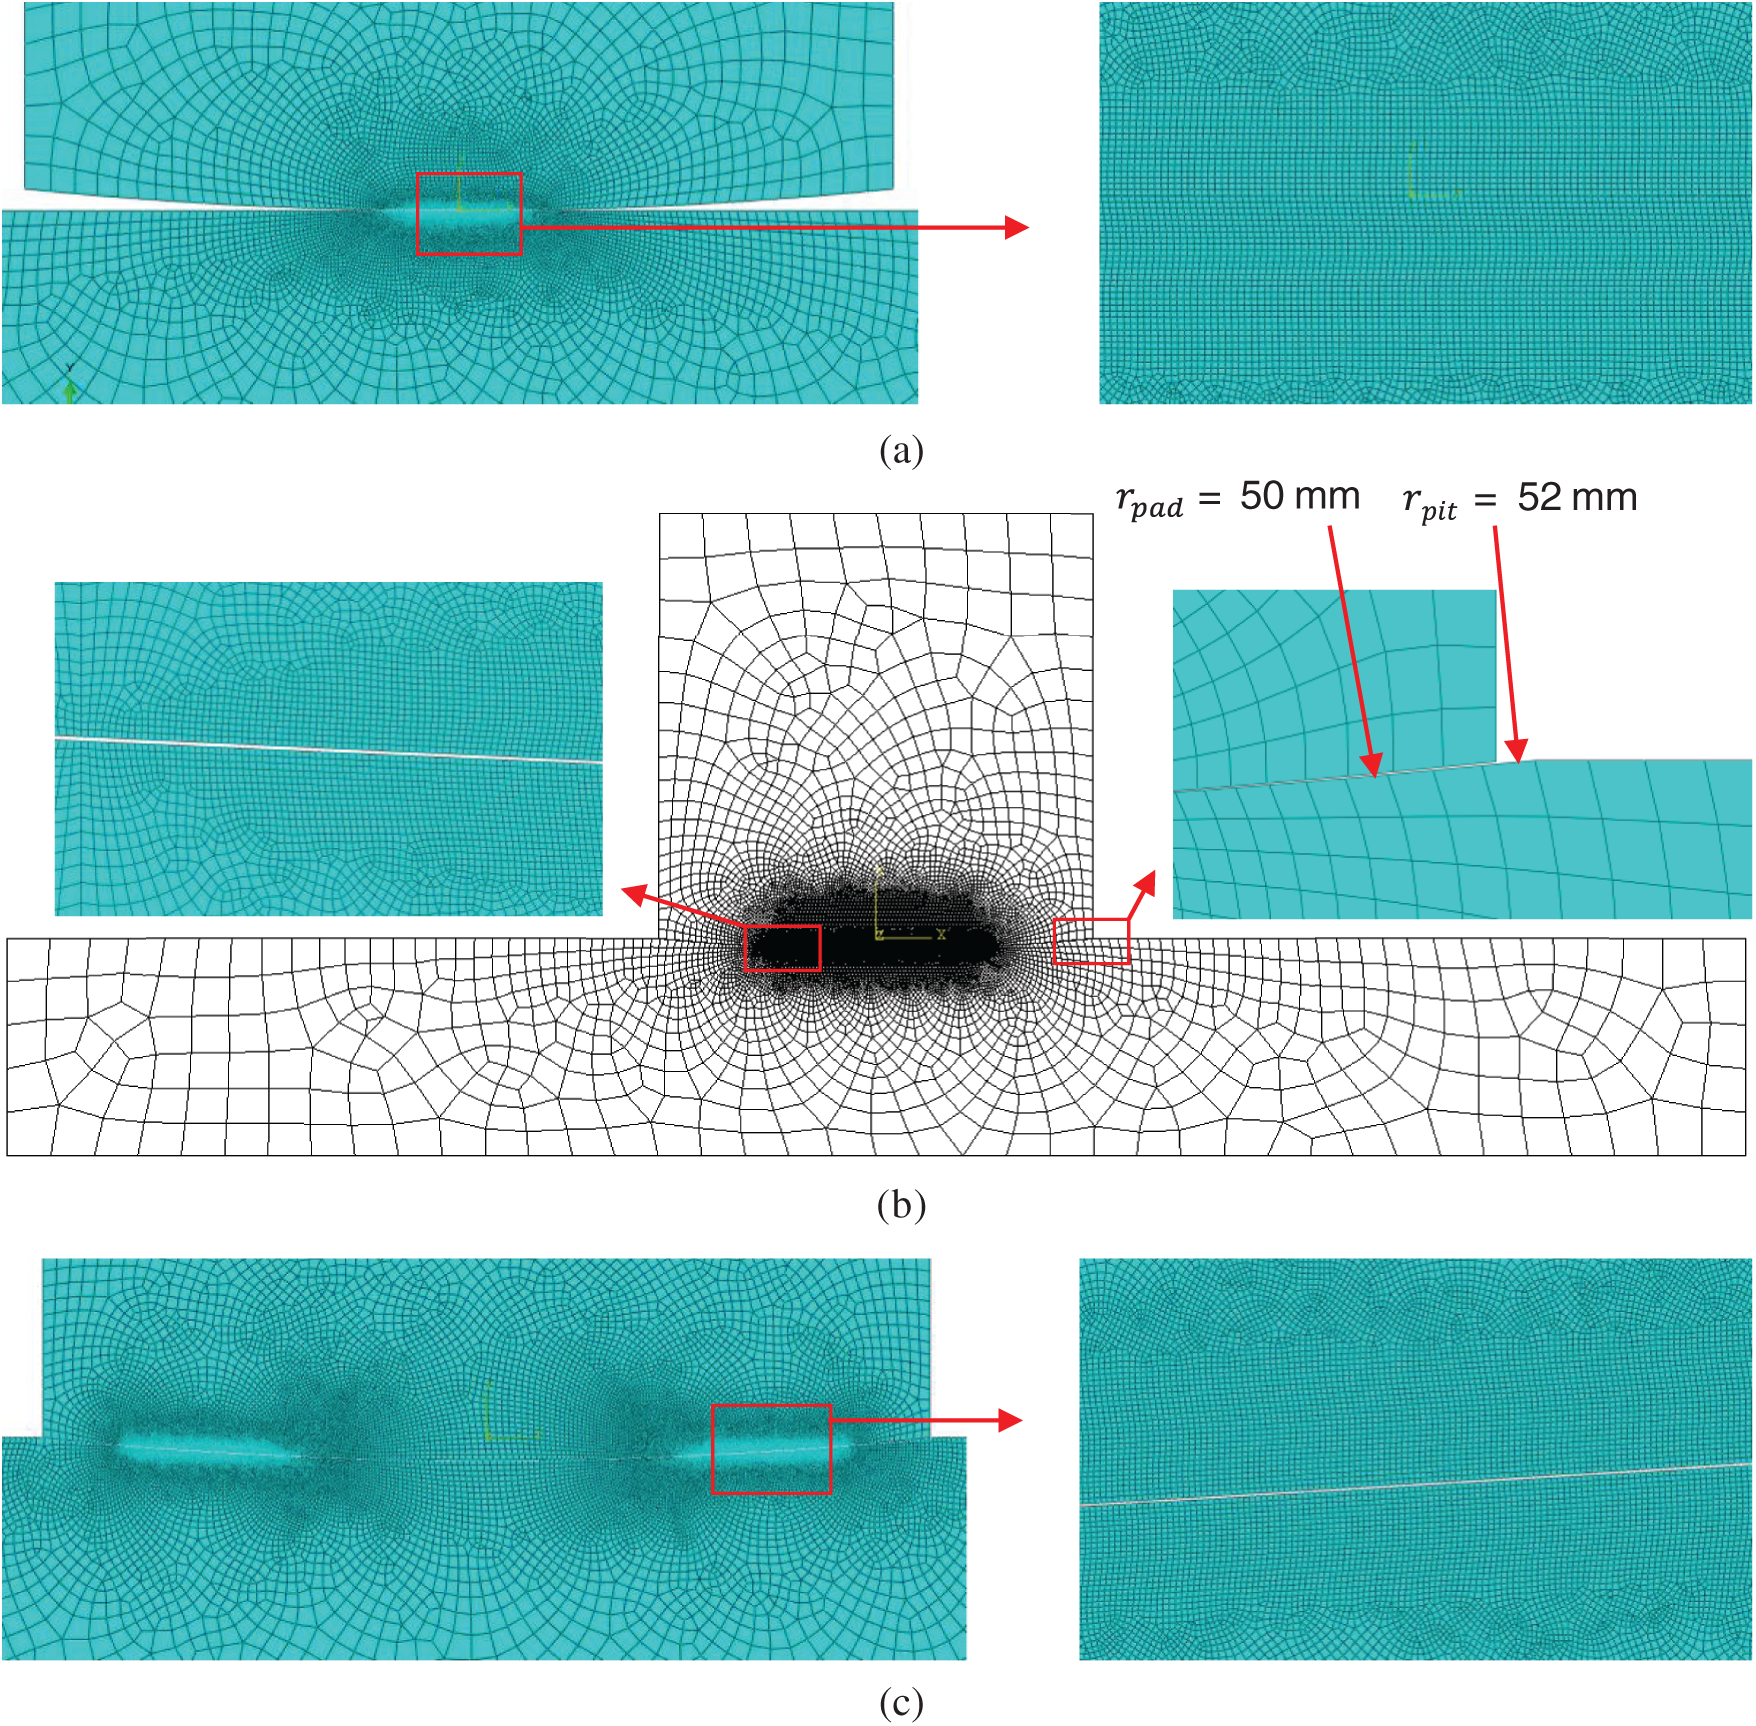
Figure 5: (a) The elements near the contact surface for type 1 model. (b) Finite element model of type 2. (c) The elements near the contact surface for type 3 model
After the simulation, Python codes were used to do the post-processing in order to determine the stress and strain history for each node on the contact surface. Matlab codes were used to calculate the critical plane parameters. The codes would go through every node on the contact surface of the specimen. For every node, every angle plane would be checked, in order to find out the critical plane. In addition, an angle increment of 1° was used for each iteration.
In our group at Ghent University, Hojjati-Talemi et al. [6] performed the experimental research on fretting contact between pad and flat specimen. Fig. 1 shows the schematic of experimental set up. The specimen is under periodic stretch stress  on the righthand side. The top and bottom sides of the specimen are subjected to compression load from two cylinderical pads. The contact coefficient of friction between pads and specimen is 0.65 and a normal force F = 540 N acts on the pad. The tangential force Q exerted on the side face of pad is also a periodic load. The ratios of
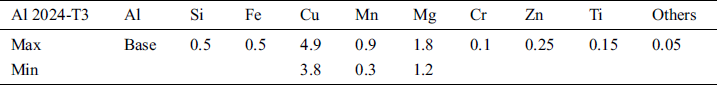
  and Q are 0.1 and −1, respectively. The material of cylinder pad and specimen is aluminum 2024-T3, which is the same as the one used for the FE model in Section 3. This kind of material is widely used in the aviation industry because of its good fatigue characteristics. The specific chemical composition of the material is listed in Tab. 1.
Table 1: Chemical composition of the Al2024-T3 [6]
The test was carried out by a servo-hydraulic load frame in order to apply the periodic stretch load on the specimen with a loading frequency of 10 Hz. All the load conditions of the fatigue experiments and failure life results are listed in Tab. 2.
Table 2: Fretting fatigue experimental loading conditions and lives [6]
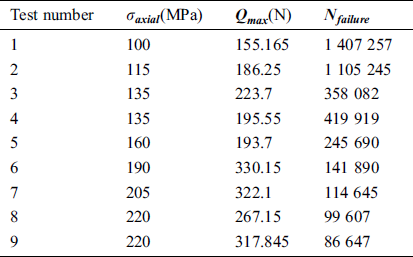
In order to verify the rationality of the critical plane method for predicting crack initiation life, the  of all tests is used to validate the numerical model and the prediction methods. However, to study the effects of the surface pit treatment on fretting fatigue, the load of test 1 is used along with all kind of critical plane methods for all proposed models.
Firstly, the above method, described in Section 3, is used to predict the crack initiation life of type 1 model under 9 kinds of tests. Then, combined with the crack propagation part [23], the total fretting fatigue life prediction for all tests can be compared with the total failure life from experiments as shown in Fig. 6.
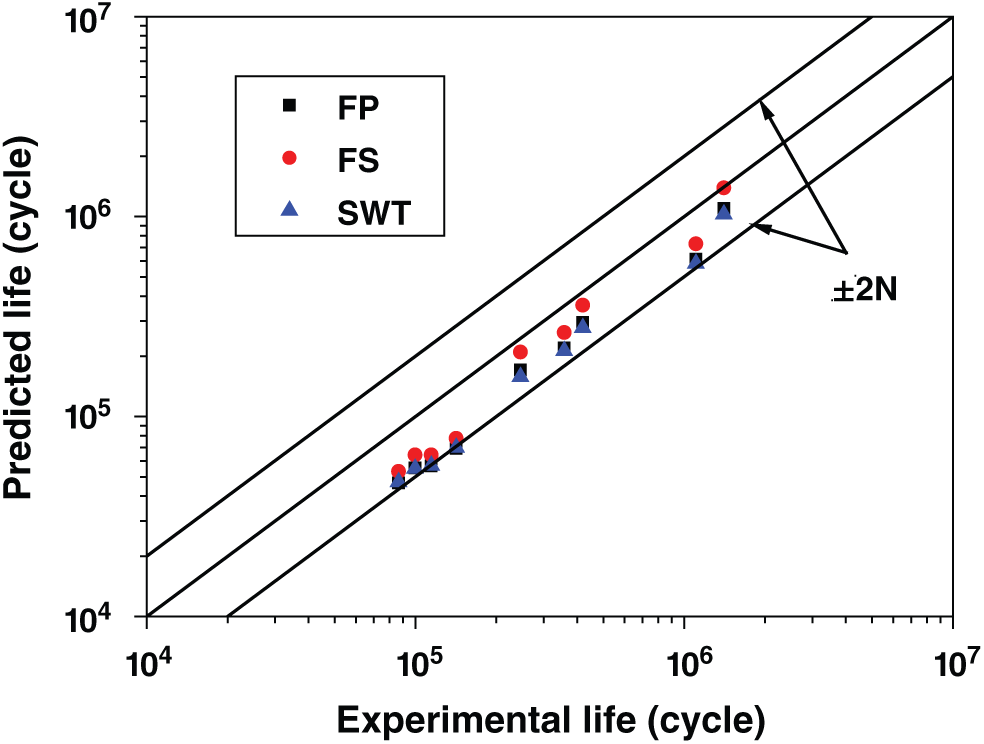
Figure 6: Comparison between prediction and experimental failure life
From the results, it is shown that the FS parameter gives the best prediction. Although the prediction of all cases has a certain degree of conservation, all the results are within the factor of ±2 N. Therefore, it can be concluded that the critical plane method can be used to predict crack initiation life under multiaxial stress field. Furthermore, it is reasonable to use the critical plane method to estimate the crack initiation lifetime for the other two types of models.
Because the stress distribution has a great influence on the fretting fatigue life of the structure, after applying the cyclic load to the model, the stress distribution in the specimen can be calculated over the entire period. Moreover, by extracting the results, the fatigue characteristics of the specimen can be evaluated by three different critical plane parameters. In addition to the contact surface, the stress field below the surface is also calculated and presented, which allows a more comprehensive comparison of the two models considered in this paper. In order to compare the effects of three different contact surface cases on the fretting fatigue initiation, the loading condition of experimental test 1 as listed in Tab. 2 is used for the three types of model.
5.1 Stress Distribution in the Three Models
The biggest difference between each model is the contact radius. From the resulting stress distribution shown in Fig. 7, the difference in stress concentration is very obvious. The high stress concentration of type 1 model is near the edge and takes place over a very small contact area. Therefore, it leads to a higher peak value of stress, not only shear stress but also normal and tensile stresses. However, for the other two models, the stress distribution takes place in a relatively large contact area. The absolute peak value of the shear stress is also much smaller than type 1.
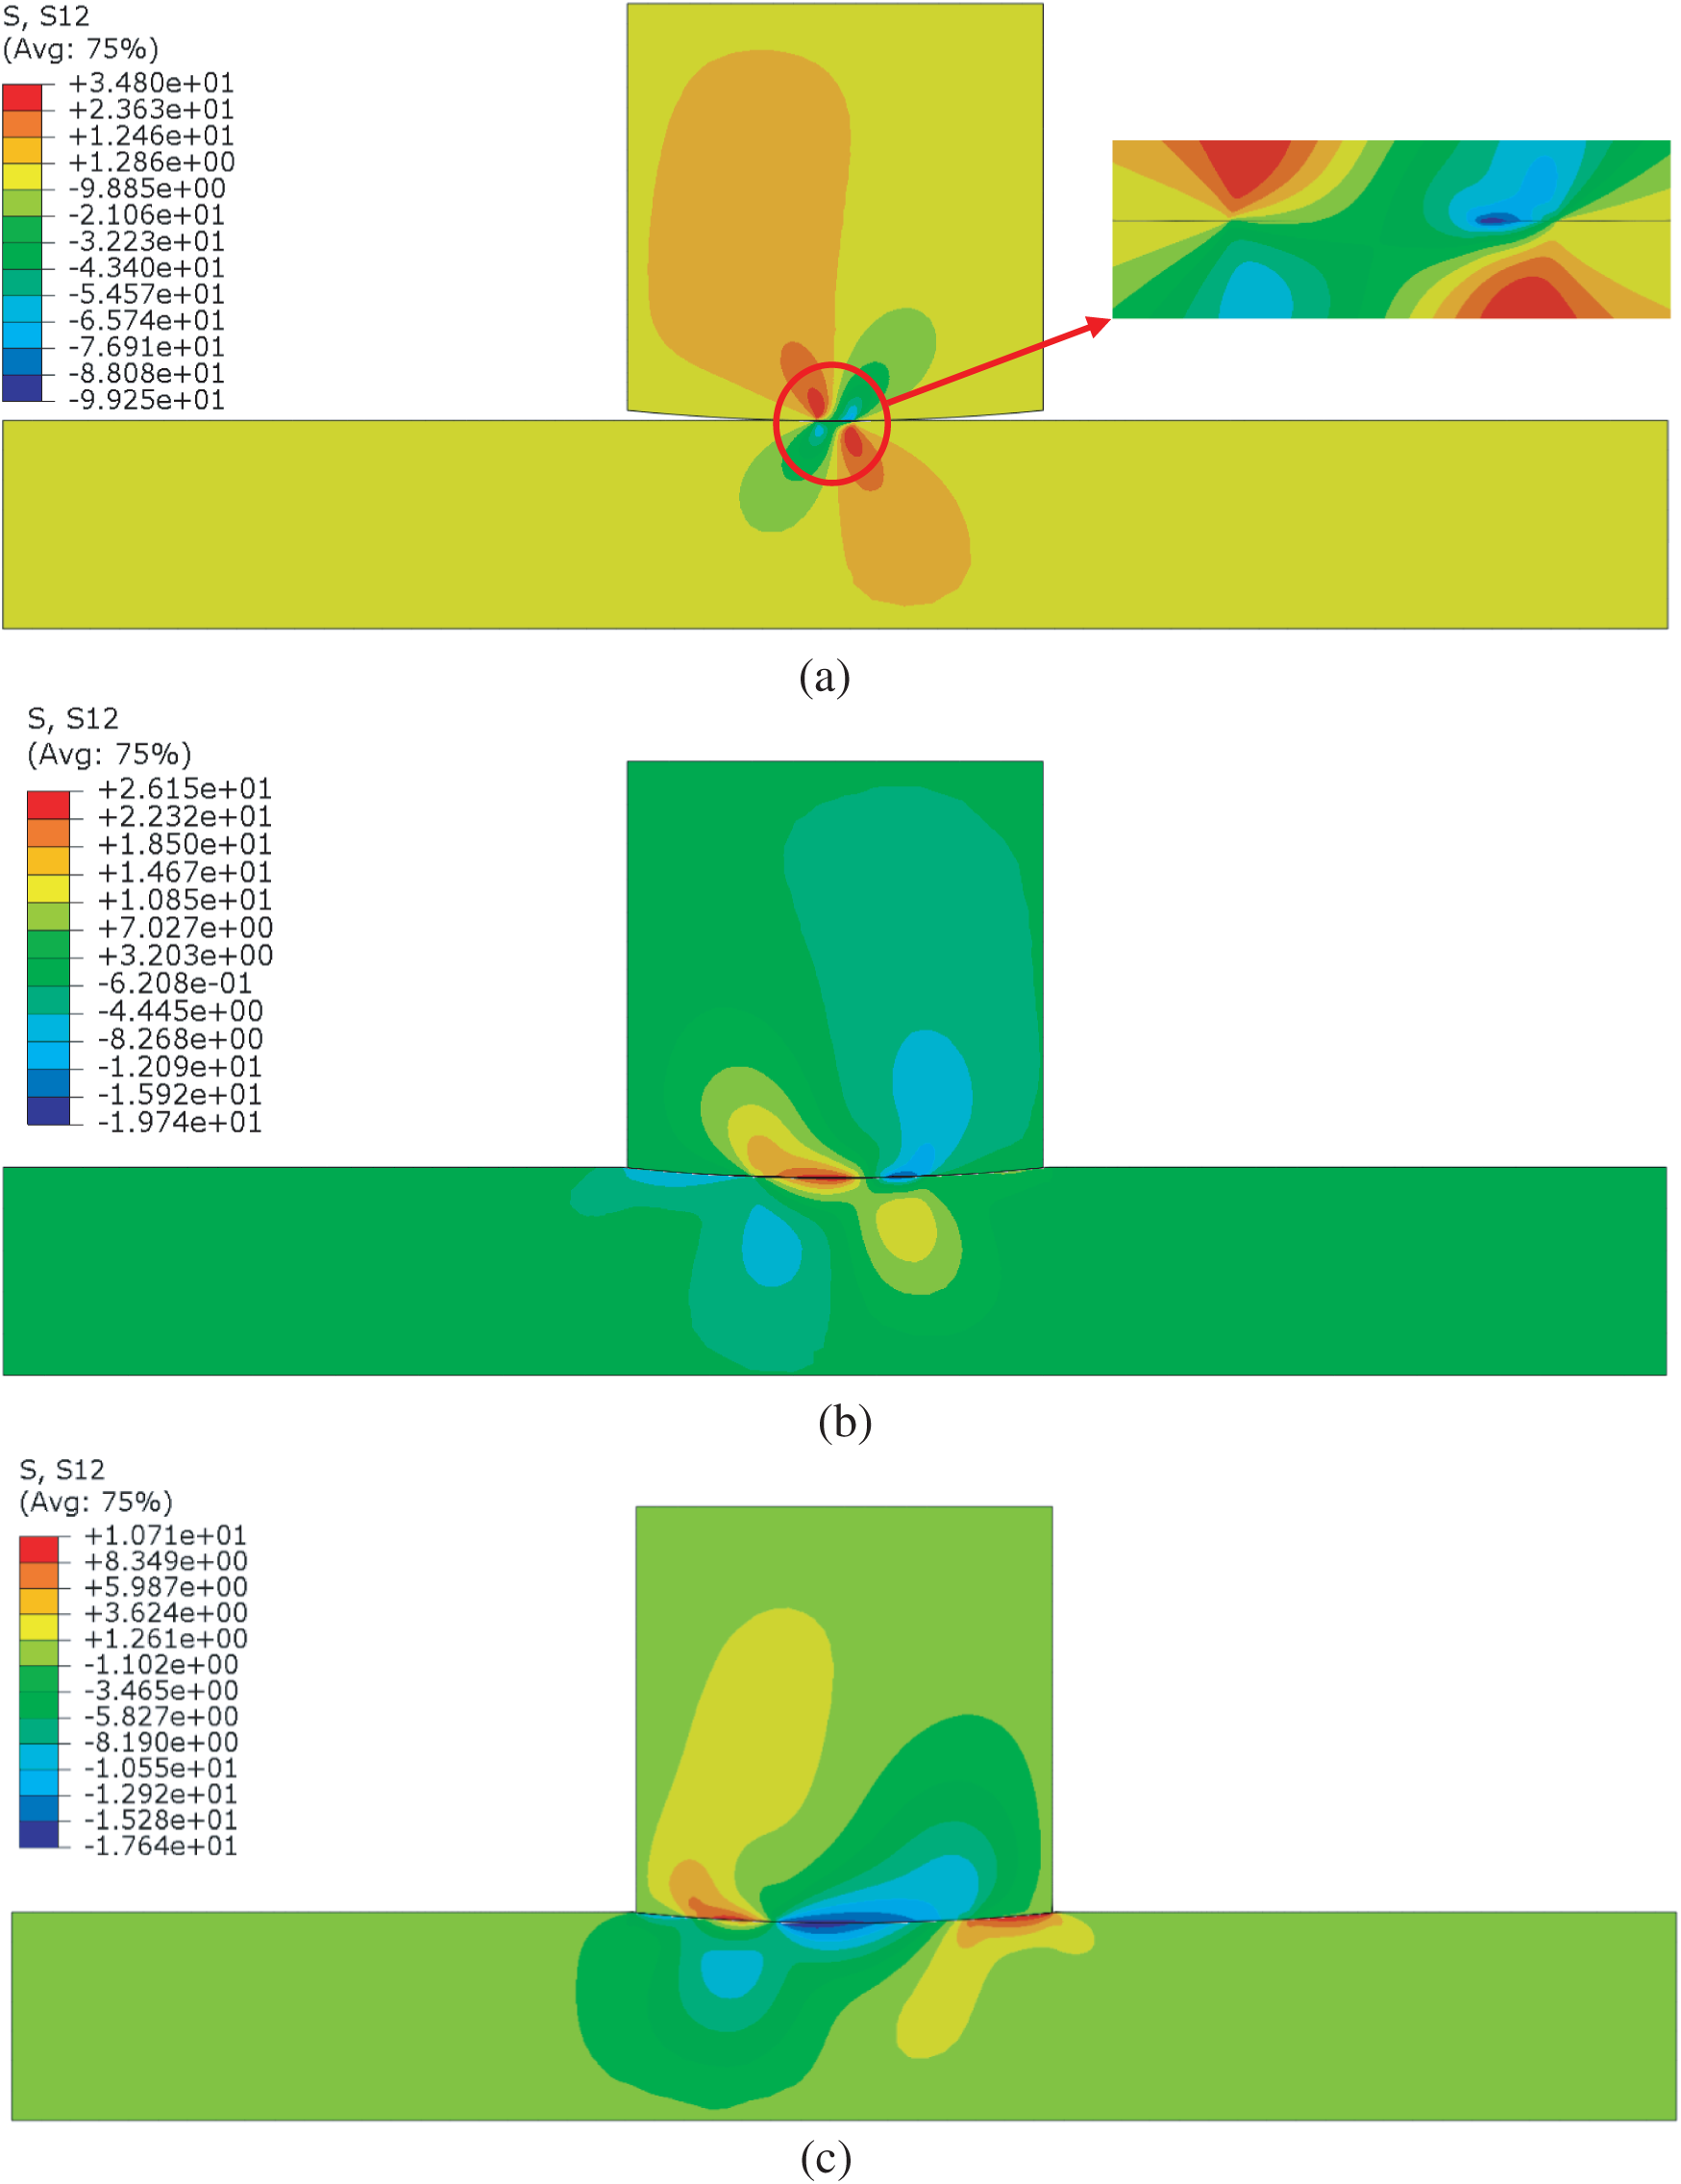
Figure 7: von-Mises stress distribution in the whole model when peak loading (a) type 1, (b) type 2 and (c) type 3
Although Fig. 7 shows a macro comparison of three models, it is more important to consider about the stress on the contact surface. Because it is known from previous experiments and numerical studies that crack usually appears first at the contact edge for type 1 model. This is similar for type 2 and 3 models because the stress at the contact surface is higher than below the surface.
A comparison of contact surface stress distribution between each model is shown in Fig. 8. From the results shown in Fig. 8a, we can see that the tensile stress varies greatly along the contact surface. It reaches a maximum of 290.089 MPa at x = 0.45986 mm for type 1. This point is very close to the theoretical contact radius (0.462 mm) of the type 1 model. This can also explain to some extent why cracks always initiate at contact edges.
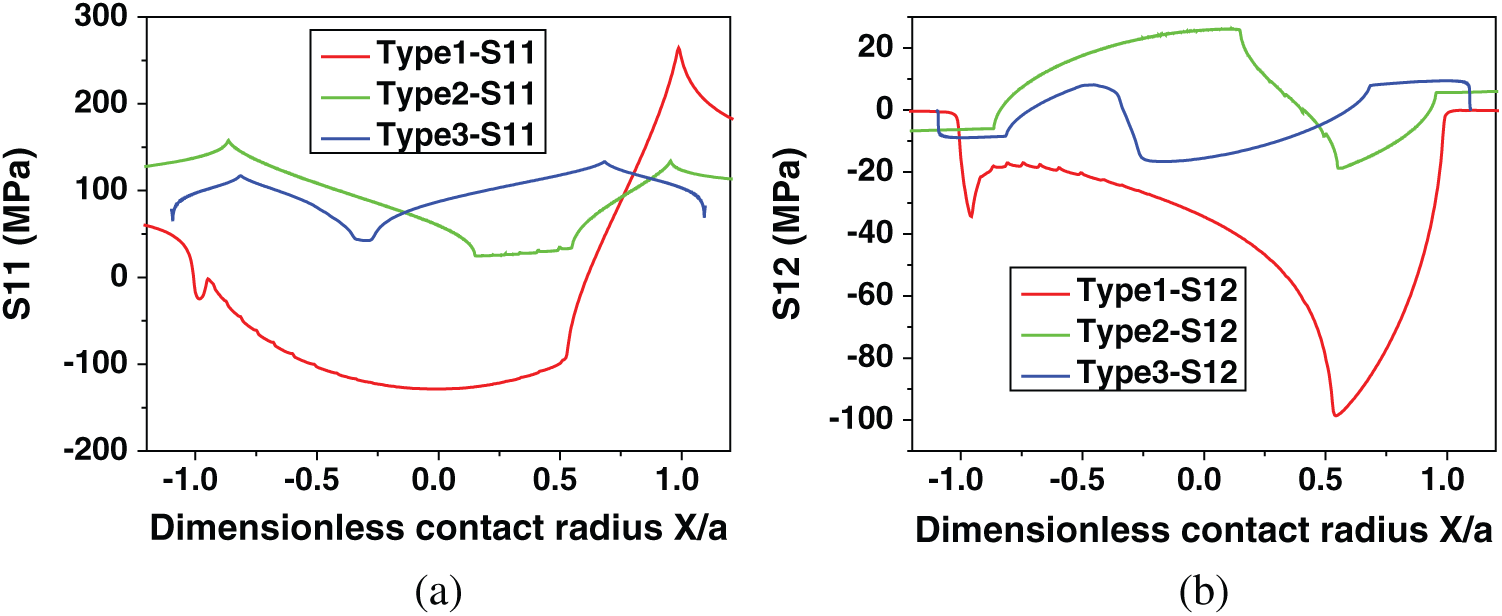
Figure 8: Contact surface stress distribution comparison between each model: (a) tensile stress and (b) shear stress
For the type 2 model, the maximum tensile stress is 157.992 MPa and is located at x = −2.0402 mm, and the theoretically contact radius is 2.36 mm. This difference is high when it is compared with the type 1. This means that the initial position of the crack may change greatly when the surface of the sample is treated by a pit. Moreover, for type 3 model, the maximum tensile stress (133.098 MPa) on the contact surface appears at x = 3.162 mm, which is smaller than the theoretical contact radius (4.645 mm). The peak value is just a little higher than the applied stress (100 MPa) on the right-hand side of the specimen. This shows that there is no particularly significant stress concentration in type 3 model. It also means that for type 3, the crack initiation position will be closer to the contact center. Moreover, the peak value is less than half of type 1. The slope of tensile stress on the surface is also smaller than type 1. This indicates that type 3 model will have better fretting fatigue performance. From the result shown in Fig. 8b, the maximum shear stress of type 1 model is −98.596 MPa at x = 0.25 mm. This point is close to the boundary between the stick zone and the slip zone calculated by the analytical solution [2]. In addition, the shear stress changes very sharply around this point. For type 3 model, both positive and negative shear stresses appear at the contact surface, but because the contact area is relatively large, the resulting lateral friction is equal to that of type 1. This will inevitably lead to an absolute peak shear stress that will be much smaller than type 1. The value and position of peak point are −16.651 MPa and x = −0.78795 mm, respectively. This is likely to produce lower critical plane parameters.
In general, specimens treated with pits (type 2 and type 3) have larger contact areas and smaller contact stress peaks. The stress distribution is completely different for the three models.
The stress distribution is important in fretting fatigue analysis, but it just considers the peak load value. However, the critical plane criteria can take the stress and strain history of the specimen into account [3].
As shown in Fig. 9, the three critical plane parameters are completely different at the surface of the three types of models. For the convenience of comparison, all three parameters are presented in dimensionless form by dividing them by their maximum values. The maximum values of each critical plane parameter are listed in Tab. 3, including position, critical plane angle and the estimated initial life.
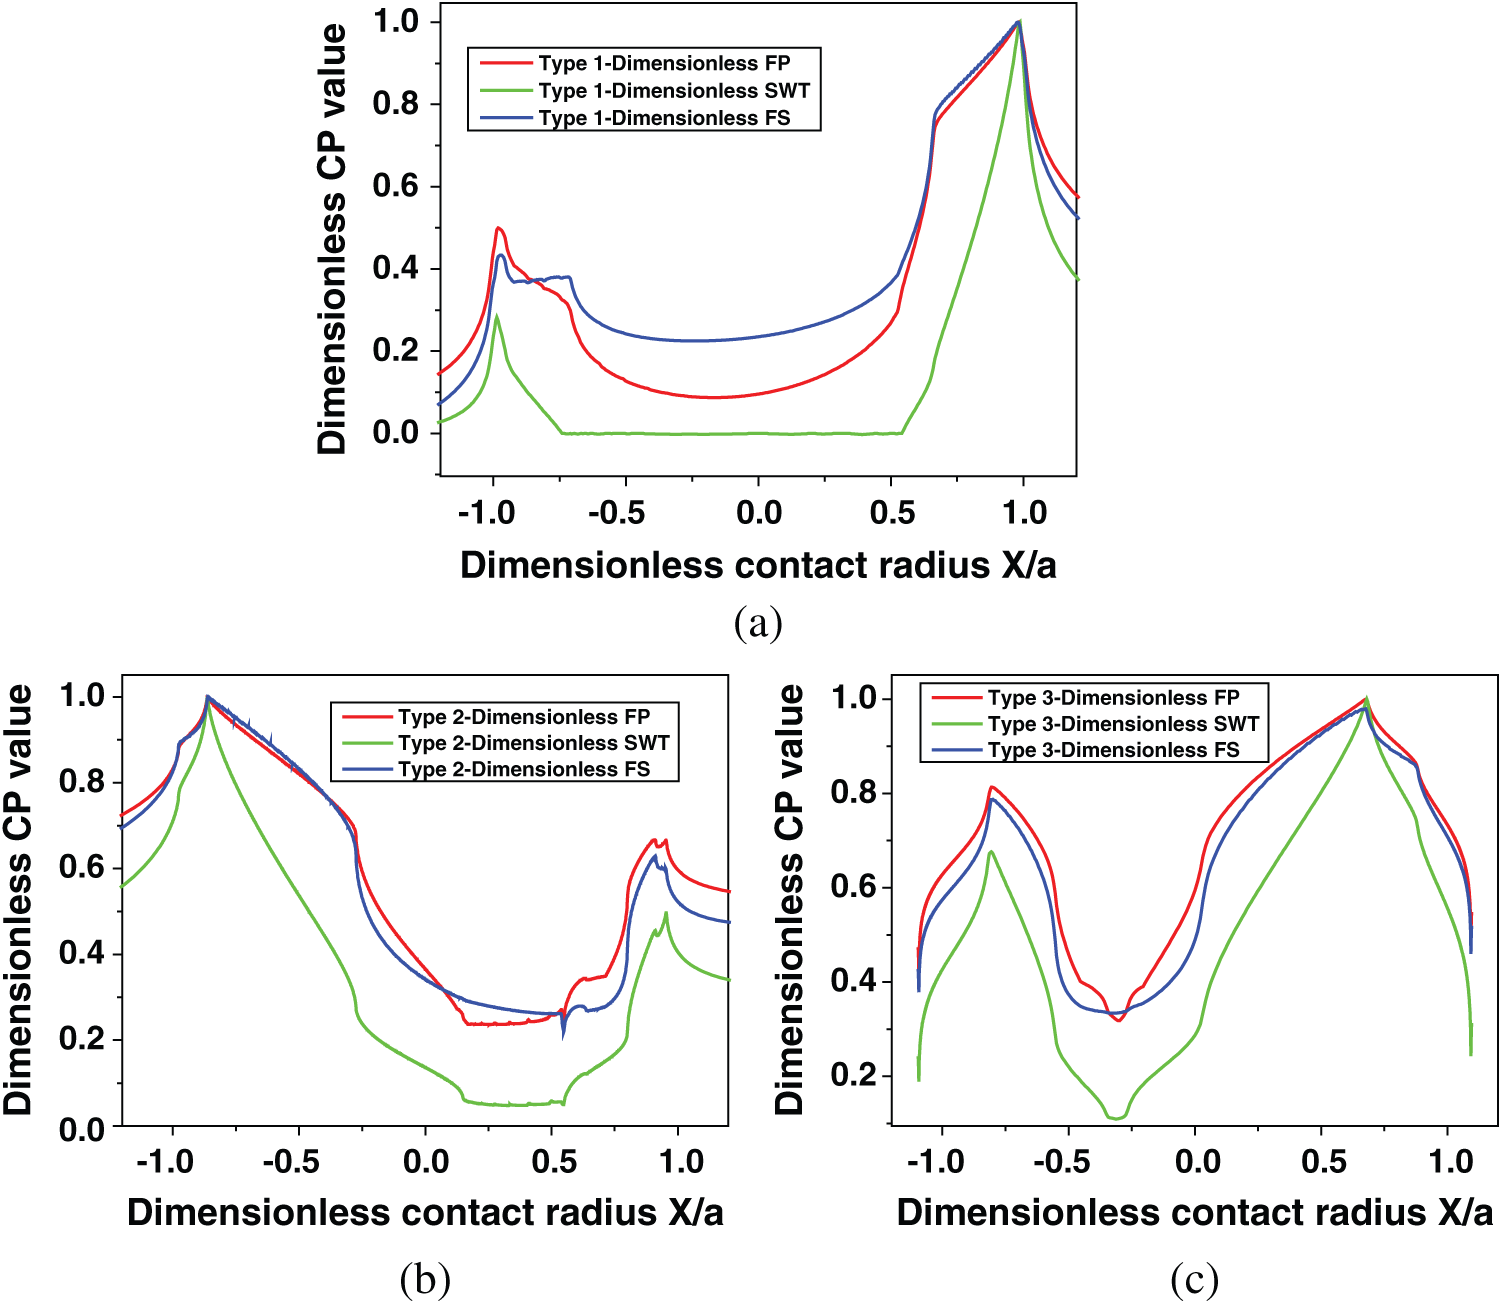
Figure 9: Dimensionless critical plane parameter distribution along the contact surface: (a) type 1, (b) type 2 and (c) type 3
Table 3: Maximum critical plane parameters
Although by comparing the three models, there is a large difference between each other, but for the same model, the peak positions of the three parameters are very close. It is around x = 0.453 mm, x = −2.0363 mm and x = 3.1426 mm for type 1, type 2 and type 3 models, respectively. As mentioned in the previous section, the position of peak tensile stress on the contact surface is x = 0.45986 mm, x = −2.04 mm and x = 3.1684 mm, respectively. It is clear that for all types of models, all damage parameters are dominated by tensile stress. In addition, because of the large difference in the stress and strain distribution in the three models, the maximum value of the critical plane parameter also has a large difference. The peak value of type 1 is more than two times larger than that of type 3. Therefore, the crack initiation lifetime also has a huge difference.
Regarding the critical plane angle, SWT parameter is mainly used for crack propagation under tensile load, so that the starting direction will be perpendicular to the direction of maximum tensile stress. However, the prediction of the other two kinds of parameters is reasonable compared with the previous experimental study [4]. When the specimen has been changed by adding pit on its surface, the predicted crack initiation life of type 2 and type 3 models will change a lot. These results mean that it will never fracture because the number of cycles to failure is more than 107 cycles (the endurance limit) [24].
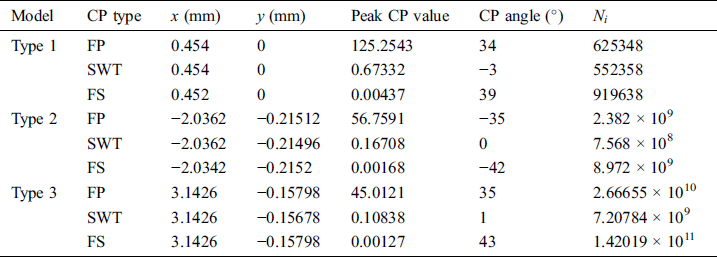
Type 2 and type 3 models have contact radii, which are several times larger than that of type 1. From the results above, it is clear that type 2 and type 3 models will be safer in accordance with the stress distribution and critical plane methods. On the other hand, it should be noted that the slip range of three models also has a huge difference as shown in Fig. 10.
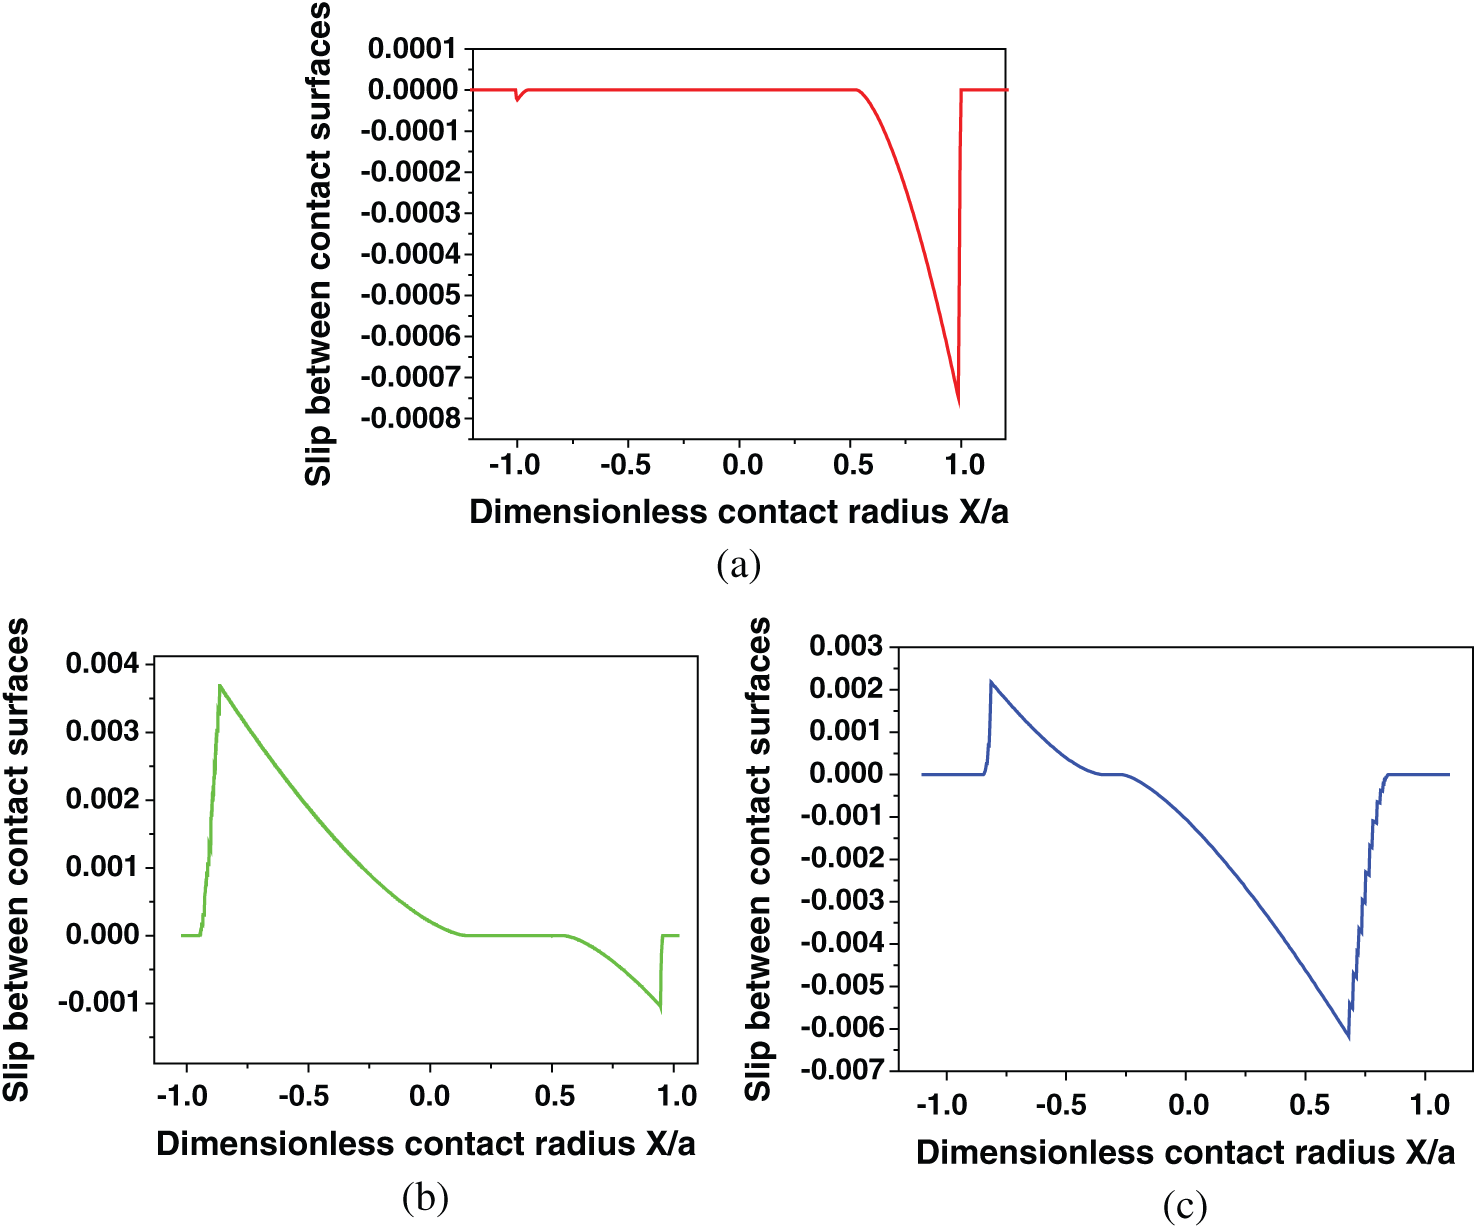
Figure 10: Slip range along the contact surface of both models: (a) type 1, (b) type 2 and (c) type 3
Even although, the amount of wear debris is not too much obvious in the partial slip regime [25], the effect of slip range also needs to be checked, because there are ten times differences between type 1 and type 3. Here, Ruiz parameter that can take contact slip into account is adopted [21]. As shown in Fig. 11, the maximum absolute Ruiz parameter value indicates the starting position of the crack. It can be seen that the critical plane method and the Ruiz approach have obtained very consistent predictions. However although type 3 model has the smallest stress peak and the largest predicted crack initiation life, its absolute peak of Ruiz parameters is also the largest. Unfortunately, Ruiz’s approach cannot predict fatigue life, but larger damage parameter values still indicate shorter life. It is worth noting that type 2 model has much less contact stress than type 1, and its Ruiz parameter is also smaller than type 1. Following this idea, it will be possible to find a situation between those models to achieve the best performance of fretting fatigue and fretting wear. This will be the topic of our next study.
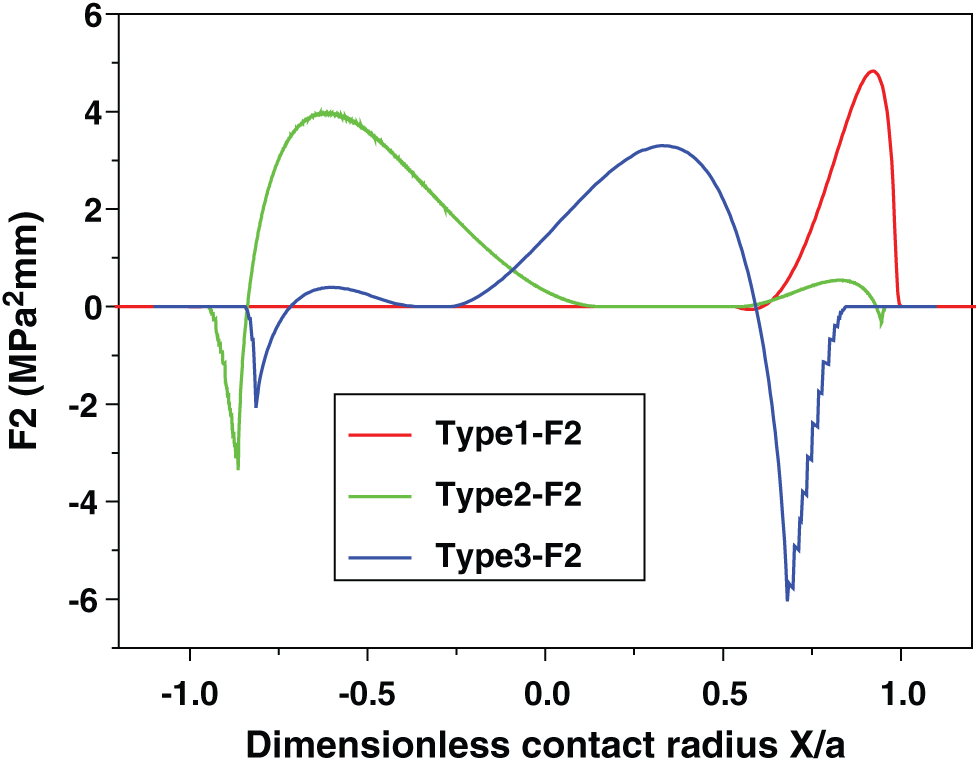
Figure 11: Ruiz F2 parameter along the contact surface
Based on the above results and discussion, we can draw the following conclusions:
1.Adding pits to the surface of the specimen can seriously affect the stress distribution of the specimen under fretting fatigue loading condition and significantly reduce the stress concentration. Moreover, this effect is not linear, and different stress distributions can be obtained with different pit radii.
2.Although the three critical plane parameters have a large difference in the prediction of fretting fatigue life, the prediction of the crack initiation position is very consistent. The position of the peak point of CP parameter is very close to the location of peak tensile stress. For type 1 model (flat-specimen), the crack will initiate from the contact edge. However, for type 2 and type 3 model (pit- specimens), the crack position will shift inside contact area.
3.The critical plane method is acceptable for type 1 model (flat-specimen) compared with the experimental results. Moreover, FS parameter has the best prediction. The gradient of the SWT parameter is the largest. Furthermore, Ruiz parameter has similar prediction of initiation location compared with the critical plane methods.
Acknowledgement: The authors would like to acknowledge the financial support of the grants from the China Scholarship Council (201806840127), and the Research Foundation-Flanders (FWO), The Luxembourg National Research Fund (FNR) and Slovenian Research Agency (ARRS) in the framework of the FWO Lead Agency project: G018916N ‘Multi-analysis of fretting fatigue using physical and virtual experiments.’
Funding Statement: This work was supported in part by the National Natural Science Foundation of China (Grant Nos. 11372138 and 11572157), the Research Foundation-Flanders (FWO), The Luxembourg National Research Fund (FNR) and Slovenian Research Agency (ARRS) in the framework of the FWO Lead Agency project: G018916N ‘Multi-analysis of fretting fatigue using physical and virtual experiments.’
Conflicts of Interest: The authors declare that they have no conflicts of interest to report regarding the present study.
1. R. H. Talemi and M. A. Wahab. (2012). “Finite element analysis of localized plasticity in Al 2024-T3 subjected to fretting fatigue,” Tribology Transactions, vol. 55, no. 6, pp. 805–814.
2. Q. Deng, N. Bhatti, X. Yin and M. Abdel Wahab. (2018). “Numerical modeling of the effect of randomly distributed inclusions on fretting fatigue-induced stress in metals,” Metals, vol. 8, no. 10, pp. p.–836.
3. N. A. Bhatti and M. Abdel Wahab. (2018). “Fretting fatigue crack nucleation: A review,” Tribology International, vol. 121, pp. 121–138.
4. K. Pereira, N. Bhatti and M. Abdel Wahab. (2018). “Prediction of fretting fatigue crack initiation location and direction using cohesive zone model,” Tribology International, vol. 127, pp. 245–254.
5. K. Pereira, S. Bordas, S. Tomar, R. Trobec, M. Depolli et al. (2016). , “On the convergence of stresses in fretting fatigue,” Materials, vol. 9, no. 8, 639.
6. R. Hojjati-Talemi, M. Abdel Wahab, J. De Pauw and P. De Baets. (2014). “Prediction of fretting fatigue crack initiation and propagation lifetime for cylindrical contact configuration,” Tribology International, vol. 76, pp. 73–91.
7. G. H. Majzoobi and F. Abbasi. (2017). “On the effect of contact geometry on fretting fatigue life under cyclic contact loading,” Tribology Letters, vol. 65, no. 4, pp. 125.
8. N. A. Bhatti, K. Pereira and M. A. Wahab. (2019). “Effect of stress gradient and quadrant averaging on fretting fatigue crack initiation angle and life,” Tribology International, vol. 131, pp. 212–221.
9. C. Navarro, S. Muñoz and J. Dominguez. (2008). “On the use of multiaxial fatigue criteria for fretting fatigue life assessment,” International Journal of Fatigue, vol. 30, no. 1, pp. 32–44.
10. E. Samaniego, C. Anitescu, S. Goswami, V. M. Nguyen-Thanh, H. Guo et al. (2020). , “An energy approach to the solution of partial differential equations in computational mechanics via machine learning: Concepts, implementation and applications,” Computer Methods in Applied Mechanics and Engineering, vol. 362, pp. 112790.
11. S. Goswami, C. Anitescu and T. Rabczuk. (2020). “Adaptive fourth-order phase field analysis using deep energy minimization,” Theoretical and Applied Fracture Mechanics, vol. 107, pp. 102527.
12. N. A. Bhatti and M. A. Wahab. (2017). “A numerical investigation on critical plane orientation and initiation lifetimes in fretting fatigue under out of phase loading conditions,” Tribology International, vol. 115, pp. 307–318.
13. D. Kumar, R. Biswas, L. H. Poh and M. A. Wahab. (2017). “Fretting fatigue stress analysis in heterogeneous material using direct numerical simulations in solid mechanics,” Tribology International, vol. 109, pp. 124–132.
14. Q. Deng, N. A. Bhatti, X. Yin and M. A. J. T. I. Wahab. (2020). “The effect of a critical micro-void defect on fretting fatigue crack initiation in heterogeneous material using a multiscale approach,” Tribology International, vol. 141, 105909.
15. W. N. Findley. (1959). “A theory for the effect of mean stress on fatigue of metals under combined torsion and axial load or bending,” Journal of Engineering for Industry, vol. 81, no. 4, pp. 301–305.
16. A. Fatemi and D. F. Socie. (1988). “A critical plane approach to multiaxial fatigue damage including out-of-phase loading,” Fatigue of Engineering Materials Ltd., vol. 11, no. 3, pp. 149–165.
17. D. Socie. (1987). “Multiaxial fatigue damage models,” Journal of Engineering Materials and Technology, vol. 109, no. 4, pp. 293–298.
18. A. Fatemi, A. Plaseied, A. Khosrovaneh and D. Tanner. (2005). “Application of bi-linear log–log S–N model to strain-controlled fatigue data of aluminum alloys and its effect on life predictions,” International Journal of Fatigue, vol. 27, no. 9, pp. 1040–1050.
19. J. Park and D. Nelson. (2000). “Evaluation of an energy-based approach and a critical plane approach for predicting constant amplitude multiaxial fatigue life,” International Journal of Fatigue, vol. 22, no. 1, pp. 23–39.
20. K. N. Smith, T. H. Topper and P. Watson. (1969). A Stress-Strain Function for the Fatigue of Metals. Waterloo, Ontario: Defense Technical Information Center.
21. C. Ruiz, P. Boddington and K. Chen. (1984). “An investigation of fatigue and fretting in a dovetail joint,” Experimental Mechanics, vol. 24, no. 3, pp. 208–217.
22. K. L. Johnson. (1987). Contact Mechanics. Cambridge, UK: Cambridge University Press.
23. K. Pereira and M. A. Wahab. (2017). “Fretting fatigue crack propagation lifetime prediction in cylindrical contact using an extended MTS criterion for non-proportional loading,” Wear, vol. 115, pp. 525–534.
24. J. Araujo and D. J. I. J. O. F. Nowell. (2002). “The effect of rapidly varying contact stress fields on fretting fatigue,” International Journal of Fatigue, vol. 24, no. 7, pp. 763–775.
25. O. Vingsbo and S. Söderberg. (1988). “On fretting maps,” Wear, vol. 126, no. 2, pp. 131–147.
 | This work is licensed under a Creative Commons Attribution 4.0 International License, which permits unrestricted use, distribution, and reproduction in any medium, provided the original work is properly cited. |