DOI:10.32604/cmc.2020.012507
| Computers, Materials & Continua DOI:10.32604/cmc.2020.012507 | |
| Article |
Smart Healthcare Using Data-Driven Prediction of Immunization Defaulters in Expanded Program on Immunization (EPI)
1Predicitive Analytics Laboratory, Shaheed Zulfikar Ali Bhutto Institute of Science and Technology, Islamabad, 44000, Pakistan
2Department of Software Engineering, Foundation University Islamabad, Islamabad, 44000, Pakistan
3Department of Software, Sejong University, Seoul, 05006, Korea
4Department of Computer Science and Engineering, Soonchunhyang University, Asan, 31538, Korea
*Corresponding Author: Yunyoung Nam. Email: ynam@sch.ac.kr
Received: 02 July 2020; Accepted: 26 July 2020
Abstract: Immunization is a noteworthy and proven tool for eliminating life-threating infectious diseases, child mortality and morbidity. Expanded Program on Immunization (EPI) is a nation-wide program in Pakistan to implement immunization activities, however the coverage is quite low despite the accessibility of free vaccination. This study proposes a defaulter prediction model for accurate identification of defaulters. Our proposed framework classifies defaulters at five different stages: defaulter, partially high, partially medium, partially low, and unvaccinated to reinforce targeted interventions by accurately predicting children at high risk of defaulting from the immunization schedule. Different machine learning algorithms are applied on Pakistan Demographic and Health Survey (2017–18) dataset. Multilayer Perceptron yielded 98.5% accuracy for correctly identifying children who are likely to default from immunization series at different risk stages of being defaulter. In this paper, the proposed defaulters’ prediction framework is a step forward towards a data-driven approach and provides a set of machine learning techniques to take advantage of predictive analytics. Hence, predictive analytics can reinforce immunization programs by expediting targeted action to reduce dropouts. Specially, the accurate predictions support targeted messages sent to at-risk parents’ and caretakers’ consumer devices (e.g., smartphones) to maximize healthcare outcomes.
Keywords: Smart healthcare; routine immunization; predictive analytics; defaulters; vaccination; machine learning; targeted messaging
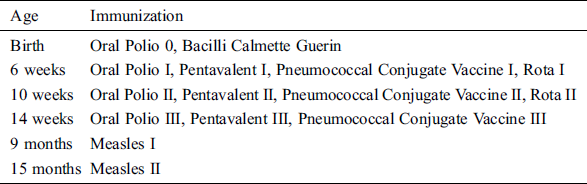
World Health Organization (WHO) started a global vaccination program, Expanded Program on Immunization (EPI) in 1974. The aim of the program was to protect children from ten infectious and fatal childhood diseases such as Diphtheria, Pertussis, Tetanus, Polio, Tuberculosis, Measles, Haemophilus Influenza Meningitis, Yellow fever, Hepatitis B and Pneumococcal, by making the corresponding vaccines available to all. WHO has indicated that around two to three million lives are saved per annum due to vaccination. Tab. 1 provides a schedule of immunization recommended by WHO to prevent childhood diseases in early stages of life prior to exposure of deadly diseases. Reducing the child morbidity and mortality is the major objective of immunization services. In 1978, Pakistan initiated its EPI with similar motive to vaccinate children for fatal diseases and improve the immunization facilities. PDHS conducted in 2017–18 showed that high child mortality rate is due to low immunization coverage, i.e., only 66% across the country. In year 2017, 74 childhood deaths out of per 1000 live births were reported. Government of Pakistan and its partners are putting substantial efforts to achieve the projected benchmark rate of immunization as there were multiple reasons for incomplete vaccinations among children in Pakistan as reported in Riaz et al. [1]. However, it is unrealistic to assume that just vaccinating every child will decrease the mortality rate; as this process has multidimensional structure along with the contribution of several other complex factors including keeping a record of all children and all vaccines. Within Pakistan, EPI has faced multiple challenges such as parental and female awareness, education and inefficient health worker attitudes [2]. Pakistan is trying to catch up with the national targets for immunizations. It is indeed a concern for the public health policy makers of Pakistan as it has its global impact.
Table 1: Routine immunization schedule
The focus of previous studies was on the identification of hurdles and provocations in the process. Most of the researchers centered their work on issues like maternal illiteracy, inadequate data, lack of parental knowledge and awareness program of vaccination, erroneous reporting, distance from vaccination centers etc. Unfortunately, the available data is not utilized to analyze and to discover trend in data for forecasting precise future outcomes. Considering the gaps found in literature, utilization of data for analysis and pattern discovery to improve the immunization coverage is kept as the major focus of our study. Health care domain can significantly benefit from the combined power of Machine learning and Big data where predictive analytics technology can play an important role in forecasting immunization outcomes as well.
Considering these factors, Chandir et al. [3] focused on developing a model for identifying defaulters, children who are more likely to miss a scheduled vaccine, in order to enhance the immunization coverage, by utilizing the strength of predictive analytics. However, their developed model did not consider those children who missed one or two vaccine doses in immunization schedule, and predicted defaulters and non-defaulters only. As a result, children missing few doses would be categorized at high risk of defaulting as well.
Motivated by aforementioned limitation, we propose a model in which we categorize immunization series into five stages: Not-vaccinated, Fully-immunized, Partially-High, Partially-medium, and Partially-Low on the basis of immunization doses. These categories were beneficial in recognize recognizing the level of risk associated with defaulting, making it possible to efficiently target children with limited resources and time. Hence, to predict the immunization stage of a child, various machine learning algorithms were used by this study, including Decision Tree, Support Vector Machine, Multilayer Perceptron, and Naïve Bayes. 98% accuracy was achieved by using Multilayer Perceptron. PDHS (2017–18) was used to extract children’s vaccination data for the purpose of experimentation. Overall, predictive analytics can be beneficial for the population having high rate of incomplete or partial immunization by making targeted efforts to reach defaulters on time. The accurate predictions in turn support smart healthcare [4–6] by sending targeted alerts to at-risk children’s parents and caretakers via their consumer devices, e.g., smartphones.
It is indicated by several studies that coverage is not the only factor to be considered for EPI but it constitutes of areas such as operational cost and stock maintenance of vaccine, value of data, electronic registries, health information and recommendation systems to monitor vaccinators. Literature discusses the proposed theories and rationales to develop the understanding of these areas and their influence on the performance of immunization program. In the next few paragraphs, we divided the literature with respect to the use of technology and analytical techniques used so far on vaccination data.
Socio-economic factors have been the focus of many researcher’s study to determine the factors of low vaccine completion coverage. Owais et al. [7] conducted a study on a low-income community in Karachi to evaluate the impact of educational intervention, for mothers with low literacy rate, on their child. It was evident from the results that the designed educational intervention for less literate mothers elevated the immunization completion rate of DPT-3/Hepatitis B vaccine by 39%, thus proving to have vital implications for achieving better immunization ratios. A similar work by Onsomu et al. [8] focused on the importance of maternal education’s role in a child immunization completion process in Kenya that remains an under vaccinated country. It was found that the likelihood of immunization completion rate of women having above primary level education is much higher. Even after considering the individual and community level aspects in model building, it was shown that maternal literacy level is statistically imperative for a child’s well-being. According to our knowledge, maternal education has been never considered as a feature to predict child immunization rate in any of the prior researches.
Apart from literacy rate, several other socio-economic attributes play a vital role in immunization coverage. Rammohan et al. [9] considered health facilities in India and other contributing socioeconomic factors in addition to education level to assess the childhood immunization rate at district level. Results showed that an individual’s income is strongly associated with the coverage rate of immunization and makes an imperative contribution in prediction as well. It was highlighted by their study that maternal education holds a statistically substantial importance and has a positive impact on immunization outcomes.
Crouch et al. [10] highlighted the importance of demographic and socioeconomic features as predictors of immunization. Alongside these features, data collected through immunization survey at national level was also considered for model building. Model was built using features like mother’s education level and age, culture, race, first or later born child and their geographic location being one of the most significant contributors. Demographic and socioeconomic elements were found to be the major predictors of immunization and it was suggested that if these characteristics are used in a right manner then it could benefit health officials and policy makers to devise policies which will result in improved outcomes. On the other hand, Ameen et al. [11] conducted a similar study by considering socio-economic features and immunization status as variables from a survey conducted in 2011. It was concluded that the variation in immunization coverage was mainly based on child’s birthplace, maternal literacy level and availability of immunization card.
Moreover, several researchers have acknowledged the significance of timely vaccinating the child and emphasized on its importance to prevent disabilities and fatal diseases in children. Qazi et al. [12] highlighted that delayed vaccinated children in KPK, Pakistan were not included in current vaccination reports. Due to this, if a child gets vaccinated after the specified time, he/she will be considered as fully immunized individual in the national level report. Hence, it tends to overestimate the vaccination coverage results. Problems related to non-vaccinated or partially vaccinated children are overlooked and rarely examined. However, Walton et al. [13] realized the significance of timeliness of vaccination and measured the quality of immunization services through routine data. It was highlighted through this study that delayed vaccinations highly affected the immunity of children leaving them at a high risk of catching infectious diseases. Moreover, there were no studies found focusing on the risk associated with partial or no vaccination affecting the whole immunization program. Moreover, none of the previous studies have utilized this information to improve the immunization coverage or to prevent future delays.
The proposed approach filled in a major gap of predictive analytics by identifying early and on time future outcomes. Chandir et al. [3] took the first step in this area to recognize the usage of predictive analytics and its capacity to enhance immunization coverage by assessing a limited scope of this approach.
Nevertheless, the previous studies have several limitations such as model was able to predict the potential candidates to miss their upcoming vaccination. Such individuals were termed as defaulters. However, even though a child misses only one dose, the model puts that child at an elevated risk of defaulting.
This motivated us to build a prediction model for accurate predictions of defaulters. This paper addresses the power of predictive analytics for decision making, targeted interventions and increasing immunization coverage, so far lacking in the literature. Accurate prediction is at the center of a consumer device-enabled targeted messaging that can lead to desirable smart healthcare outcomes. In the next section, the overview of proposed framework is presented for accurate defaulter prediction.
3 Proposed Framework for Defaulter Prediction
Based upon the shortcomings found in previous work as discussed in previous section, we propose a framework to predict immunization defaulters. This section provides an overview of proposed framework, details of dataset and experimental setup of the study.
3.1 Vaccine Defaulter Identification
The development of this framework was motivated by the lack of accurate identification of defaulters in an EPI. Fig. 1 represents our defaulter prediction framework.
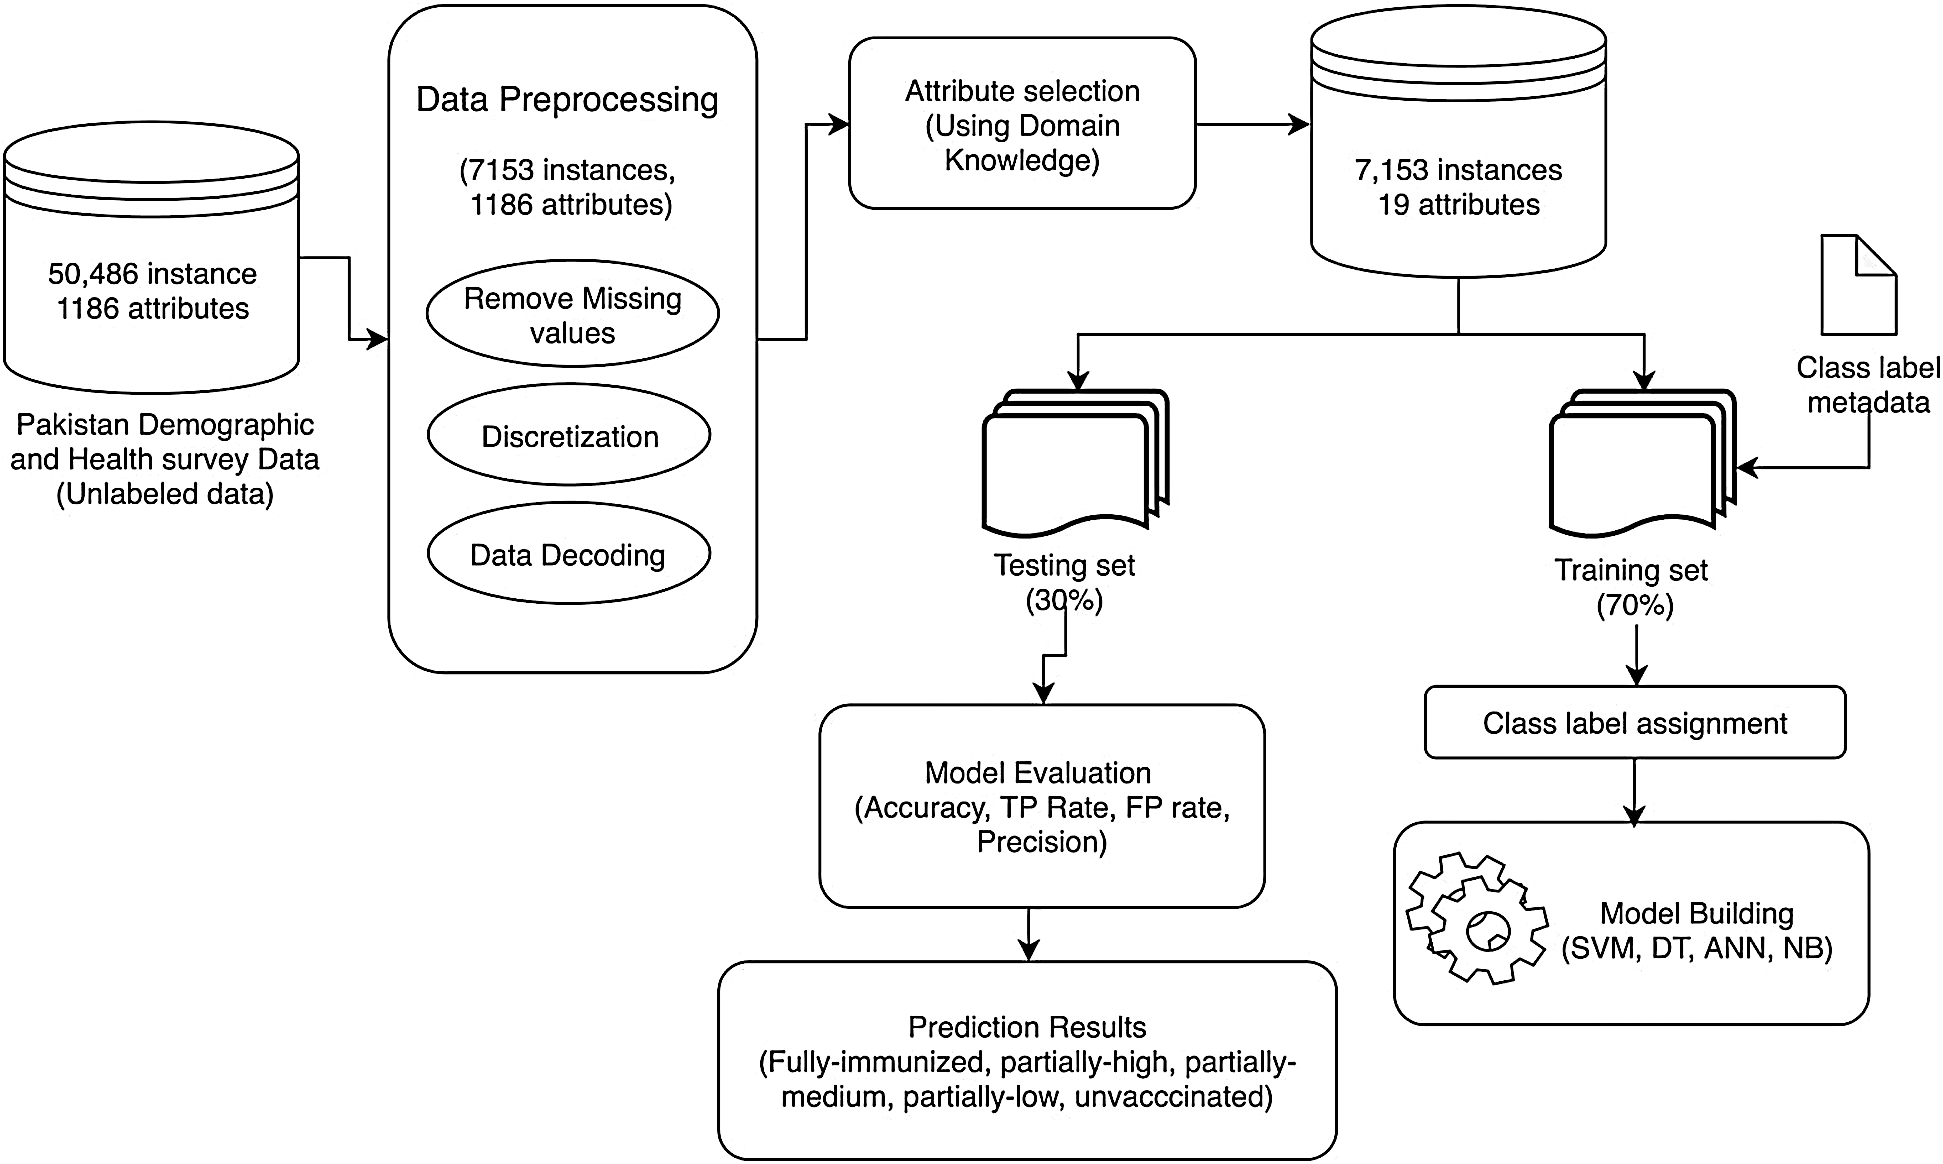
Figure 1: Framework for prediction of vaccine defaulters
The main contribution of this data-driven framework is to accurately identify the defaulters at different levels of risk of dropping out based on their vaccination status and the number of doses they have taken so far and categorizes children into five stages: Fully-immunized, partially-high, partially-medium, partially-low and un-vaccinated. The framework consists of three main components: Data Preprocessing, Attribute Selection, Model Building and Evaluation.
3.2 Pakistan Demographic and Health Survey
Dataset was extracted from PDHS (2017–18). This Survey contains information about basic demographics and health indicators. It provides an overview of population, maternal and child health issues in the country. The intent of this survey is to help policymakers and program managers to design strategies to improve the health of the population. Originally, the dataset consisted of 50,486 data records and 1186 variables (including variables related to household, education, and poverty).
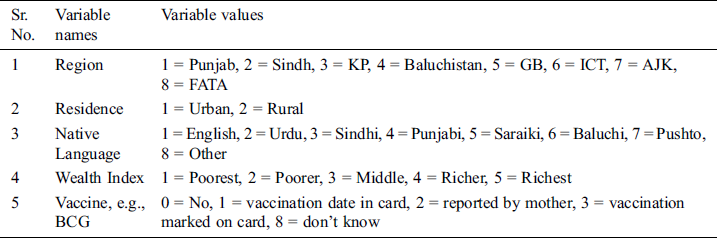
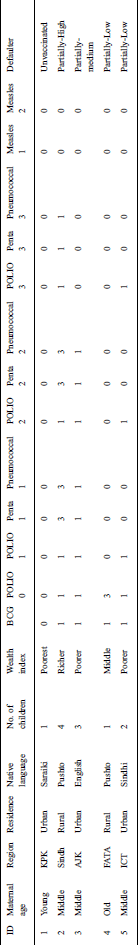
Survey data contains demographic information of children such as parent’s age, region, residence, parental language, families’ wealth index, child’s vaccine information, i.e., if a child is vaccinated or not. All attributes have multiple values except maternal age and number of children under 5 years. Tab. 2 shows the multiple values of each attribute.
Table 2: Variable values details
All experiments have been performed using Core i5 with 8 GB RAM. SPSS was used to extract the immunization and demographic related attributes from a dataset of Demographic and Health Survey. A number of machine learning algorithms were used for classification and association rule mining technique has been applied on the given dataset.
4 Component of the Proposed Framework
In this section, the components of the framework are explained in step by step manner.
Data for the PDHS study was collected through conducting interviews from different people and through questionnaires. Since the survey data was collected manually, there are possibilities of anomalies and variation in data. In such scenario, data preprocessing becomes a vital step to prepare the data for an efficient and effective model building, as unclean data has a negative impact on model’s performance. The dataset contains numerous records with multiple missing values. The details of the main steps of the preprocessing process are given below,
Dealing with the missing values is an important step of data preprocessing. Various missing values were removed or replaced including spaces, ‘Null’, special character ‘?’ to attain good results. There are only two possible options in immunization i.e., either a child vaccinated or not vaccinated for a specific disease. According to the nature data, it was not possible to replace the missing values with mean, min, max etc. Hence, the missing values were removed from the data and r the total number of instances were reduced from 50,486 to 7153 as shown in Fig. 2.
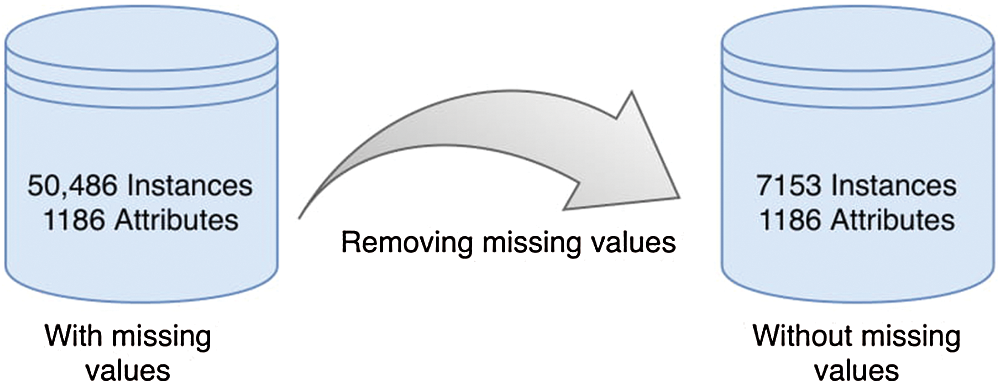
Figure 2: Removed missing values
In this step, nominal values were generated using the numeric demographic values. Survey dataset contains the metadata to decode demographic variables’ numeric value. In order to gain better understanding of variables, information was extracted from the metadata and demographic variables were decoded to nominal values, leaving out mother’s age, the number of children under 5 in a household.
A subset of categorical values was created from the dataset of large number of numeric values. The process of discretization helps is data evaluation and management process. Mother’s age was present in the data as a categorical attribute ‘maternal age’ indicating the age of child’s mother. After discretization, the values of the ‘respondent age’ attribute are distributed in three groups namely Young, Middle-aged and Old. 15 to 24 were grouped in Young category, 25–34 as Middle-aged and the rest as Old.
Immunization data contains 1186 attributes. All these attributes do not hold the same importance in terms for contribution to the intended outcome, which makes it vital to perform dimensionality reduction on dataset and to exclude less important or irrelevant attributes from data. Selected features include child’s immunization status such as getting vaccinated according to the schedule, child’s basic demographics including his residence, district, maternal age, wealth index and number of children under 5 years of age in a household. We selected 19 features based on domain knowledge as shown in Fig. 3.
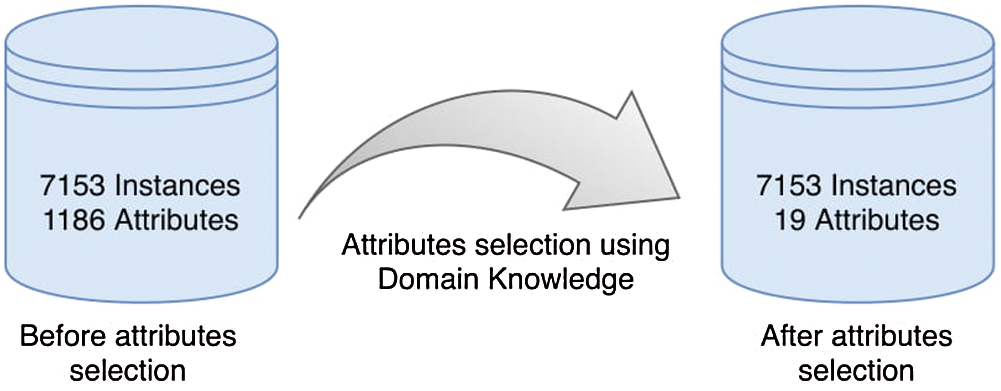
Figure 3: Attribute selection using domain knowledge
Once the data is completely preprocessed, prediction model is built using various classifiers. In first step, training and testing set is generated by splitting the dataset into two parts. The training set constitutes of 70% of the data and rest of the 30% is taken as the testing set. To train the model, only training set is used, whereas, to measure the performance of the model on unseen data, testing set is utilized. For classification, Artificial Neural Network, Naïve Bayes, Decision Tree and Support Vector Machine are applied to the training set. Tab. 3 shows the sample dataset after data preprocessing and attribute selection steps.
Table 3: Sample dataset after data preprocessing
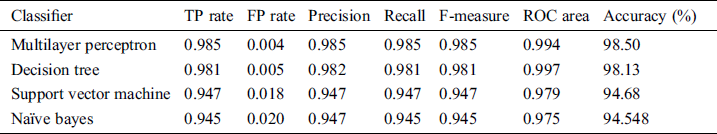
Before passing training set to model building, training data was labeled into five categories by classifying the vaccination status of children. Children who have not taken even a single vaccination dose were labeled as unvaccinated. Children who have taken 5 or less than 5 doses out of total 13 were labeled as partially-low and if a child has taken 6 out of 10 doses, he/she is labeled as partially-medium. In case a child has taken 11 or more than 11 doses out of 13 was labeled as partially-high. Another label assigned was fully immunized where children has completed the vaccination series by taking all the doses of vaccination schedule. In the next step, all these labels are then passed to the model to perform further processing. We applied four different classifiers (J48, SVM, Naïve Bayes, and Multilayer Perceptron) using Weka and noted down accuracy, TP rate, FP rate, Precision, Recall and ROC area for each classifier. Multilayer perceptron performed best and identified defaulters with an accuracy of 98.50%. In the next few lines, the reason behind our choice of these classifiers has been explained.
Artificial Intelligence is the heart of new technologies with the capability to deliver optimal and cost-effective healthcare solutions in real-time. With the increasing amount of healthcare data and the increasing power of analytical techniques, it gave a paradigm shift to healthcare. We applied this classifier on our dataset because it has the ability to detect complex non-linear relationships between dependent and non-dependent variables. This is really important because many of the input-output interactions are non-linear and dynamic in real-life.
Decision Tree helps in understanding the data relationship in a tree hierarchy structure. This model is simple, explainable and useful with the simple dataset and fewer features and generates better predictions. It also requires less effort for data preparation during data pre-processing step. Survey data mostly contains missing values whereas the decision tree building process is less affected by missing values to a significant extent. The other main reason for using this algorithm is that visualizations of a complex model of the Decision Tree can be simplified. Even a naive person can make sense of logic. The number of hyperparameters to be tuned is nearly zero and also supports classification problems with more than two classes.
Naïve Bayes is considered as one of the simple and easiest algorithms to predict outcomes. We applied Naïve Bayes because predicting the class of the test data set is easy and quick using this algorithm. In multi-class prediction, it performs really well. It also performs better as compared to other models such as logistic regression when assuming independence holds, and less training data is needed whereas, it can also work easily with the missing values.
The support vector machine is a versatile and powerful supervised machine learning algorithm. We applied the support vector machine because it can solve the issue of unbalanced data as a cost-sensitive classifier. Using a technique called the kernel trick to transform the results; it finds an optimal boundary between the possible outputs based on these transformations.
In the previous step, different machine learning algorithms have been applied to the training dataset and the performance of those algorithms has been measured using different performance metrics. According to four outcomes produced, Multilayer Perceptron performed best and yielded 98.5% accuracy. Decision Tree performed well after Multilayer Perceptron and yielded 98.1% accuracy. The support vector machine produced 94.68% accuracy and Naïve Bayes yielded 94.5% accuracy. Fig. 4 shows a comparison of the accuracy of each machine learning algorithm.
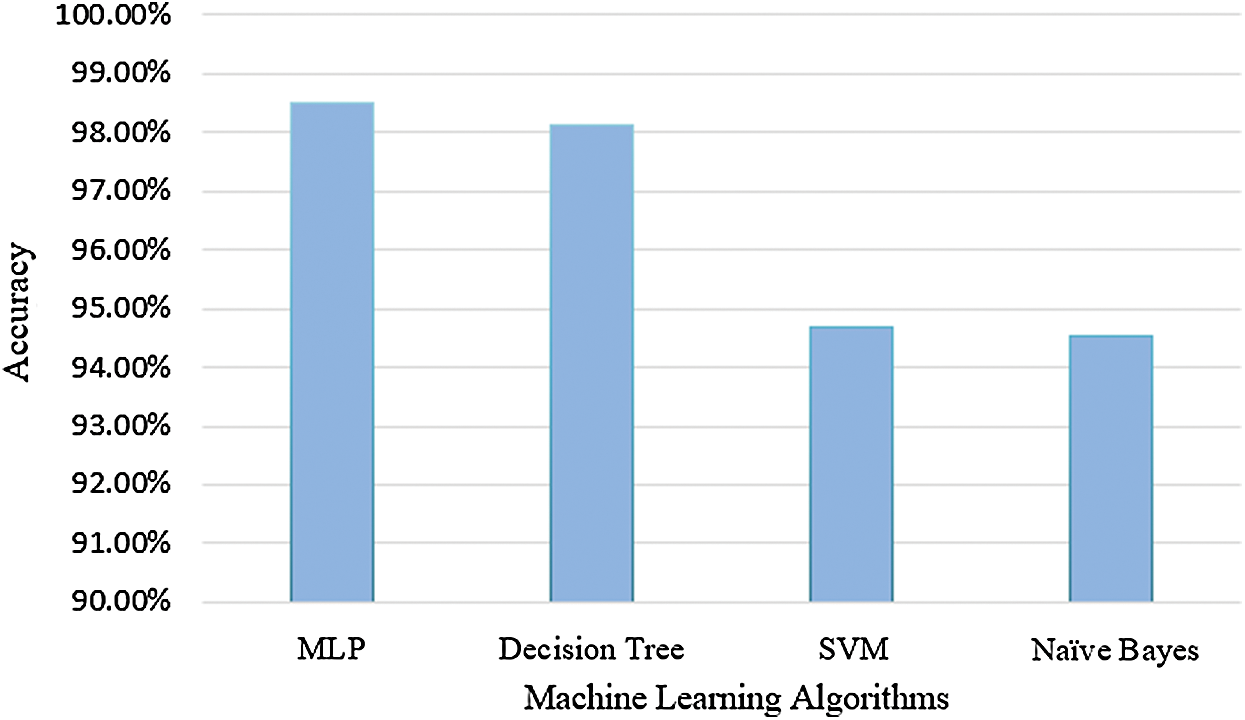
Figure 4: Prediction accuracy of machine learning algorithms
Among other performance metrics used in the literature, AUC is one of the most widely used metric to test the accuracy of the model. It is the plot between Sensitivity, i.e., True Positive rate on y-axis and Specificity, i.e., False positive rate on x-axis. Fig. 5 shows the AUC of Multilayer Perceptron that gave better results. It tells us about the measure of separability between two classes. If the value is closer to 1, it means that the model is performing well and is able to classify 1 s as 1 s and 0 s as 0 s. Performance of the model decreases as the value move towards zero. Hence, a value closer to zero indicates poor model performance with less separability.
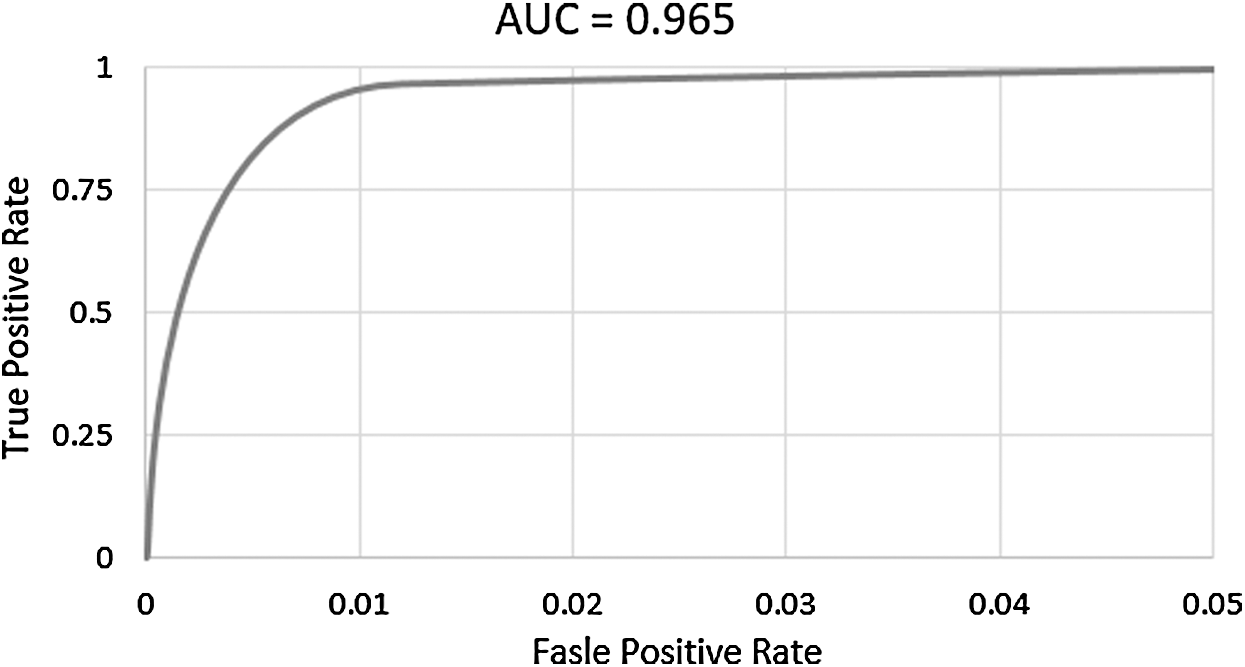
Figure 5: AUC of multilayer perceptron
However, Multilayer Perceptron outperforms the other algorithms in terms of accuracy, but accuracy alone is not the only metric to measure the performance of the model. Algorithms were analyzed on some other metrics like Precision, TP rate, and FP rate. Tab. 4 shows the results of all performance metrics against each algorithm.
Table 4: Performance metrics of each algorithm
Out of 7153 children, only 1955 (27.33%) children were fully-immunized. Tab. 5 shows the increasing dropout rate with each successive dose with the highest dropout for Measles 2, i.e., 72.6%. The same table also shows the inter-vaccination defaulting rate ranging from low (6.6%) between Penta 2 and Penta 3 to high defaulting rate (15.7%) between Measles 1 and Measles 2.
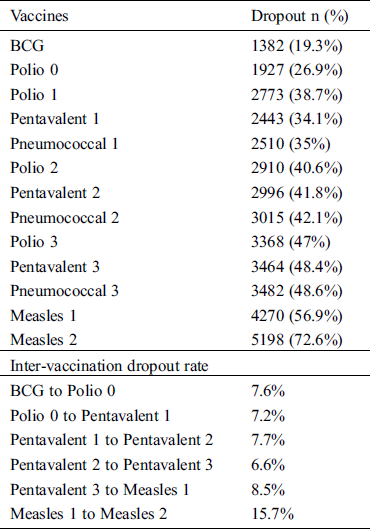
Immunization trend according to PDHS clearly shows that the rate of vaccination is high in early scheduled vaccines but it is decreasing with each subsequent vaccine in immunization visits which should not be the case. Using machine learning algorithms on demographic and immunization data, we can identify that either the child is at high risk or at low risk of missing their next immunization visit. This study aims not only to identify the child at risk of defaulting from next immunization visits but also the rate of risk as high, medium and low of defaulting.
Several predictive analytics algorithms have been used in research to identify the children who are most likely to skip their upcoming immunization visit. Policymakers and officials can benefit greatly from predictive analytics by performing analysis on EPI dataset to decrease the frequency of dropout. The results of predictive analytics provide on-time information extracted from data to make targeted interventions and alerts possible via consumer devices, thereby improving smart healthcare outcomes.
Despite paramount efforts to plan vaccine products that will come to get the requirements from end-users, the industry might need intuition into how product traits would influence immunization programs in low and middle-income countries. Similarly, priorities may be ignored by national-level decision-makers. National decision-makers, especially from the GAVI supported countries, the vaccine alliance, must pay attention to the advantages and disadvantages of peculiar product aspects along with budget limitations while making up decisions related to which vaccines to propose. A timely vaccination reduce the death rate in children up to 2.5 million per annum and has a great potential to save more lives as there is a rapid development in new vaccines to prevent the main causes of child mortality such as pneumonia, diarrhea, and malaria. Despite of this progress, several discrepancies persist in immunization coverage between several nations and the basic vaccine dosage is unavailable to many children worldwide.
Government has been doing substantial efforts to enhance immunization coverage and reduce the rate of missed opportunities. Unfortunately, there is no tool available for health providers to timely identify children who are likely to miss next vaccination dose. With the passage of time, digital immunization registries are expanding and crafting a distinctive chance to generate real-time insights from vaccination data through exploration and translation, as a result, enhancing immunization coverage and other related services.
To achieve complete vaccination coverage along with timeliness and age-appropriate vaccination, modeling and visualization of large datasets could be performed to identify the risk factors associated with dropout rate or delayed vaccination sessions. In this era of big data where massive data is being generated and collected, predictive analytics is utilized in several ways on reliable data to make the analysis more efficient.
Nowadays, socio-economic factors, awareness and knowledge development have more significant impact on the decision making about vaccination than decades ago. Elevated income, improved education and knowledge level, positive attitude towards immunization, and health insurance are associated with the increase in immunization rates. Furthermore, immunization rate can be improved further through targeted policy efforts such as educational interventions for less-educated mothers.
In addition to this, regular examining and assessment of district-level immunization coverage are important to identify local contextual factors Which could be better adapted to customized approaches such as a mix of health workers, more intensive education campaigns, socio-economic improvements and user-friendly health infrastructure provision.
There has been no research conducted in the past to identify the associations between demographic and socioeconomic factors with the defaulters. It is important to understand the factors due to which children fail to complete their vaccination schedule or miss their vaccination at all. More education, higher incomes, added knowledge, and affirmative immunization attitudes, and health insurance are all linked to higher immunization rates. Moreover, Targeted policy efforts could help in the improvement of immunization rates such as targeted educational interventions for less-educated mothers.
In a recent study [14], authors have checked the impact of languages spoken in Pakistan on the immunization of children. Interestingly, the results revealed the same finding that Balochi language speaking families are less likely to make their children immunized. So in this case, the decision-makers or health care provider can take steps to deliver message in their language or can design campaigns on vaccination in Baluchi language so that people who only understand Baluchi language could know about vaccination and its schedule and bring their children to complete his/her vaccination on time.
It is important to discuss the role of Lady Health Workers (LHWs) who are generally recruited from the local community to disseminate the information related to maternal and child health. Although, the LHWs have the ability to communicate with the families using the same language, still in majority of the Pakistani community mothers are not taken as a head of the family and they rely heavily on the male head of the family regarding the decisions related to child health. On the other hand, a typical LHW in Pakistan has to support not only EPI program but there are a large number of tasks associated with respect to different healthcare programs and it is very hard for a LHW to cover all the 22 different tasks as reported in Hafeez et al. [15].
An international target of immunization coverage of 90% and 80% at national and district level respectively is set by WHO. To meet this international criterion and to upsurge immunization coverage nation-wide, Pakistan require effectual and focused strategies. Predictive analytics, as presented in this paper, can help in identification of children who are going to miss their next visit so that those areas where the ratio of incomplete or partial immunization is high can get benefits of predictive analytics to reduce the incomplete vaccination series and ultimately increasing rate of complete immunization coverage.
Lack of vaccination coverage in Pakistan is due to several reasons. Numerous numbers of children are not fully vaccinated, late for their age-appropriate vaccine dose, or withdraw from their vaccination schedule. In this paper, the defaulters’ prediction model has been proposed and several classifiers were applied on PDHS dataset including Decision Tree, Support Vector Machine, Naïve Bayes and Multilayer Perceptron. 98% accuracy for identification of children at different stages of risk of dropping out was achieved through proposed model. Our framework is advancement towards data-driven approach that also benefits from predictive analytics by providing a set of machine learning techniques. Therefore, if immunization programs are powered by predictive analytics, smart health outcomes could be improved by expediting targeted action via consumer devices. In the field of immunization, predictive modeling is a novel idea, and its potential in revolutionizing immunization service delivery is yet to be identified.
Acknowledgement: This research was conducted by Predictive Analytics (PA) Lab SZABIST Islamabad, established under the National Center in Big Data and Cloud Computing (NCBC) Pakistan. PA Lab aims to assist in the healthcare domain of government institutions by providing predictive analytics tools and solutions for (NTP, EPI, LHWP, NSP, MNCH) programs.
Funding Statement: This research was supported by Korea Institute for Advancement of Technology (KIAT) grant funded by the Korea Government (MOTIE) (P0012724, The Competency Development Program for Industry Specialist) and the Soonchunhyang University Research Fund.
Conflicts of Interest: The authors declare that they have no conflicts of interest to report regarding the present study.
References
1. A. Riaz, S. Husain, M. T. Yousafzai, I. Nisar, F. Shaheen et al.. (2018). , “Reasons for non-vaccination and incomplete vaccinations among children in Pakistan,” Vaccine, vol. 36, no. 35, pp. 5288–5293.
2. M. Butt, R. Mohammed, E. Butt, S. Butt and J. Xiang. (2020). “Why have immunization efforts in pakistan failed to achieve global standards of vaccination uptake and infectious disease control?,” Risk Management and Healthcare Policy, vol. 13, pp. 111–124.
3. S. Chandir, D. A. Siddiqi, A. O. Hussain, T. Niazi, M. T. Dharma et al.. (2018). , “Predictive analytics to identify children at high risk of defaulting from a routine immunization program: Feasibility study,” JMIR Public Health and Surveillance, vol. 4, no. 3, pp. 63–75.
4. S. Pirbhulal, W. Wu, G. Li and A. K. Sangaiah. (2019). “Medical information security for wearable body sensor networks in smart healthcare,” IEEE Consumer Electronics Magazine, vol. 8, no. 5, pp. 37–41.
5. H. Zhu, C. K. Wu, C. H. Koo, Y. T. Tsang, Y. T. Liu et al.. (2019). , “Smart healthcare in the era of Internet-of-Things,” IEEE Consumer Electronics Magazine, vol. 8, no. 5, pp. 26–30.
6. P. Jain, A. M. Joshi and S. P. Mohanty. (2020). “iGLU: An intelligent device for accurate noninvasive blood glucose-level monitoring in smart healthcare,” IEEE Consumer Electronics Magazine, vol. 9, no. 1, pp. 35–42.
7. A. Owais, B. Hanif, A. R. Siddiqui, A. Agha and A. K. Zaidi. (2011). “Does improving maternal knowledge of vaccines impact infant immunization rates? A community-based randomized-controlled trial in Karachii, Pakistan,” BMC Public Health, vol. 11, no. 1, pp. 1471–2458.
8. E. O. Onsomu, B. A. Abuya, I. N. Okech, D. Moore and J. Collins-McNeil. (2015). “Maternal education and immunization status among children in Kenya,” Maternal and Child Health Journal, vol. 19, no. 8, pp. 1724–1733.
9. A. Rammohan and N. Awofeso. (2015). “District-level variations in childhood immunizations in India: The role of socio-economic factors and health infrastructure,” Social Science & Medicine, vol. 145, pp. 163–172.
10. E. Crouch and. L. A. Dickes. (2015). “A prediction model of childhood immunization rates,” Applied Health Economics and Health Policy, vol. 13, no. 2, pp. 243–251.
11. M. Ameen, S. Rasul, M. A. ul Haq and Q. Mahmood. (2018). “Determinants of factors associated with childhood immunization in Punjab, Pakistan: Evidence from the multiple indicator cluster survey,” Journal of Public Health, vol. 26, no. 5, pp. 495–499.
12. U. Qazi, S. Malik, U. A. Raza, M. Saad, M. F. Zeeshan et al.. (2019). , “Compliance to timely vaccination in an expanded program on immunization center of Pakistan,” Vaccine, vol. 37, no. 32, pp. 4618–4622.
13. S. Walton, M. Cortina-Borja, C. Dezateux, L. J. Griffiths, K. Tingay et al.. (2017). , “Measuring the timeliness of childhood vaccinations: Using cohort data and routine health records to evaluate quality of immunisation services,” Vaccine, vol. 35, no. 51, pp. 7166–7173.
14. R. E. A. Khan and I. Aslam. (2017). “Child immunization in Pakistan: Socio-institutional and regional aspects,” Asian Journal of Economic Modelling, vol. 5, no. 1, pp. 49–56.
15. A. Hafeez, B. K. Mohamud, M. R. Shiekh, S. A. I. Shah and R. Jooma. (2011). “Lady health workers programme in Pakistan: Challenges, achievements and the way forward,” Journal of the Pakistan Medical Association, vol. 61, no. 3, pp. 210–215.
 | This work is licensed under a Creative Commons Attribution 4.0 International License, which permits unrestricted use, distribution, and reproduction in any medium, provided the original work is properly cited. |