DOI:10.32604/cmc.2020.012557
| Computers, Materials & Continua DOI:10.32604/cmc.2020.012557 | |
| Article |
Financing Strategy of Low-Carbon Supply Chain with Capital Constraint under Cap-and-Trade Regulation
1School of Economics and Management, Shanghai Maritime University, Shanghai, 201306, China
2School of Economics and Management, Pingdingshan University, Pingdingshan, 467000, China
3Department of Electrical Engineering, University of Engineering and Technology Peshawar, Peshawar, Pakistan
4School of Telecommunication Engineering, Suranaree University of Technology, Nakhon Ratchasima, Thailand
*Corresponding Author: Peerapong Uthansakul. Email: uthansakul@sut.ac.th
Received: 04 July 2020; Accepted: 26 July 2020
Abstract: Cap-and-trade regulation provides incentives for manufacturers to reduce carbon emissions, but manufacturers’ insufficient capital can disrupt the implementation of low-carbon emission reduction technologies. To alleviate capital constraints, manufacturers can adopt external financing for low-carbon emission reduction investments. This paper studies the independent financing and financing cooperation behavior in a supply chain in which the manufacturer and retailer first implement low-carbon emission reduction technologies and then organize production and sales in accordance with wholesale price contracts. Through comparing the optimal profits and low-carbon emission reduction levels under the independent financing and financing cooperation mode, we come to the following conclusions: (1) Although financing interest increases the cost of the supply chain, manufacturers prefer to invest in reducing carbon emissions rather than buying carbon quotas. (2) When financing independently, a decentralized decision-making mode (MD) is the best choice for manufacturers. (3) In cooperative financing, when the supply chain adopts a decentralized decision-making mode (SD) in which the retailer determines the financing cost-sharing ratio according to their optimal profit, the profits of the supply chain and its members are significantly improved. (4) When manufacturers and retailers adopt a centralized decision-making model (SC) in cooperative financing, they jointly determine the financing cost-sharing ratio and the level of low-carbon emission reduction. If the financing cost-sharing ratio meets a certain threshold range, the profits of manufacturers and retailers achieve Pareto improvement, indicating that this cooperative financing model is effective.
Keywords: Cooperative financing; cap-and-trade; supply chain coordination
The emission of greenhouse gases represented by carbon dioxide threatens the sustainable development of humanity. Environmental degradation caused by economic development has become a key factor in formulating environmental policies [1]. The Kyoto Protocol, signed in December 1997, stipulated that more than 30 countries would achieve carbon reduction targets of 5.2% or higher between 2008 and 2012. Both the 2009 Copenhagen Agreement and the 2015 Paris Agreement pushed countries around the world to adopt quantitative and effective emission reduction plans by 2020 [2]. Many countries and regions have introduced emission reduction policies to encourage enterprises to implement low-carbon emission reduction technologies. Cap-and-trade regulation is the most accepted method because it enable authorities to control the redistribution and quantity of carbon emissions, which is critical to improving emission reduction performance and environmental sustainability [3].
Cap-and-trade regulation refers to the authority setting an upper limit on the initial carbon emission allowances of enterprises [4]. In the consumption stage, with growing public green awareness and consumer environmental awareness, corporate low-carbon products provide opportunities for market and demand expansion, and these products cause less damage to the environment or provide greater environmental benefits [5]. In China, the government requires companies to mark energy efficiency levels on household appliances, label “green food” on packaging, and provide subsidies for the purchase of new energy vehicles. These green consumption policies are adopted to guide consumers to purchase low-carbon products [6], which is also the main driving force for enterprises to implement low-carbon emission reduction. Manufacturers often experience long payment delays after delivering products to retailers, which leads to advances in production funds and financial constraints [7]. Although low-carbon products can reduce carbon trading costs and increase product prices, some enterprises choose not to take low-carbon production because the additional cost of low-carbon progressing is high [8].
Commercial bank financing is an effective way to solve manufacturers’ financial constraints [9]. For large enterprises with fixed assets such as land, plants, and equipment, financial institutions are usually willing to use them as guarantees to issue loans. However, many start-up and fast-growing companies do not have enough assets as guarantees for financing [10], so there is an urgent need for financial markets to provide innovative green guaranteed loans. However, due to the long payback period of low-carbon technology investment, manufacturers need to pay a certain amount of interest after obtaining these bank loans, which also brings some risks to manufacturers [11]. Compared with manufacturers financing from banks alone, supply chain members can achieve better performance if they cooperate in financing, which means that cooperation financing can improve the efficiency of the supply chain [12].
Based on management practices, our research considers a carbon-restricted supply chain consisting of a manufacturer and a retailer. By establishing a game model, the effects of different decision-making models on production, emission reduction, and profit are analyzed, and a cooperative financing model based on financing cost sharing in the supply chain is constructed, which also provides practical reference values for the supply chain enterprise capital risk management.
This paper is relevant to multiple streams of literature, three of which are most related to our research: A firm’s decisions under cap-and-trade regulation, the coordination of the low-carbon supply chain, and the financing decisions of a capital-constrained supply chain.
2.1 Firm’s Decisions under Cap-and-Trade Regulation
In terms of a firm’s low-carbon strategy decisions, Zhang et al. [13] considered the manufacturer’s strategy choices for adopting green technology and purchasing carbon credits, and investigated the manufacturer’s emission abatement decisions with three power structures. Ji et al. [14] discussed the O2O retail supply chain member’s emission reduction strategies, and compared the impact of benchmarking and grandfathering mechanisms on companies’ low-carbon decisions. After that, Yang et al. [15] examined the manufacturer’s channel selection and emission reduction decisions, and the results showed that carbon emissions are distinguished according to different sales channels, which provided useful insights for the supply chain and government. In the area of production decisions, Xu et al. [16] studied the production and pricing problem of manufacturing with multiple products, and they found that the optimal number of products is determined by the emission trading prices and the cap and tax rate. Meng et al. [17] considered product selection strategies of two competitive firms, and analyzed the effects of the power structure on low-carbon product selection. In the area of inventory decisions, He et al. [18] adopted an economic order quantity (EOQ) model to examine the firm’s production lot-sizing issues under cap-and-trade regulations. Using a mixed integer linear programming model, Purohit et al. [19] studied non-stationary stochastic inventory lot-sizing problems considering carbon cap-and-trade regulatory mechanisms. García-Alvarado et al. [20] explored the influence of environmental legislation on inventory control decisions.
The above studies discuss a firm’s choice of low-carbon strategy, production, and inventory under cap-and-trade regulation. These studies are all based on the assumption of sufficient capital and do not consider the financial constraints of the firm. Our research takes into account the importance of capital in the improvement of low-carbon technologies under cap-and-trade regulation, mainly focusing on low-carbon emission reduction decisions based on the financing background of capital-constrained manufactures.
2.2 The Coordination of the Low-Carbon Supply Chain
Many scholars have begun to pay more attention to the coordination mechanism of the low-carbon supply chain. Zhu et al. [21] adopted a multivariate analysis of variance (MANOVA) cluster analysis method to point out the importance of the supply chain’s cooperation in environmental protection. Xu et al. [22] adopted wholesale price and cost sharing contracts to coordinate the supply chain consisting of a manufacturer and a retailer. Similarly, Li et al. [23] devised revenue-sharing and cost-sharing contracts offered by retailers to encourage manufacturers to participate in low-carbon supply chains. Xu et al. [24] investigated the coordination decision in the dual channel supply chain. An improved revenue-sharing contract is designed to coordinate the supply chain under cap-and-trade regulation. Chen et al. [25] focused on firms’ green R&D cooperation behavior, evaluating the effects of green R&D cooperation on the economic, environmental, and social performances of the supply chain. Bai et al. [26] also proposed a revenue and investment sharing contract to coordinate the supply chain. The difference is, in this model, the upstream supplier provided two types of raw materials and the downstream manufacturer produced two products. Xu et al. [27] considered revenue sharing and two-part tariff contracts to coordinate the sustainable supply chain, and they proved that only the two-part tariff contract can lead to perfect coordination. In addition, Dai et al. [28] analyzed the two typical cooperative behaviors of the two supply chain members. Compared with the non-cooperative model, the cost-sharing contract brought more profits to the members and the supply chain.
This existing literature on supply chain coordination mainly focus on cost-sharing, revenue-sharing, and green R&D cooperation. Our model studies the problem of cooperative financing. For manufacturers with financial constraints, we design a financing cost-sharing mechanism with the participation of retailers to coordinate the low-carbon supply chain. Compared with the traditional share-sharing model, financing cost-sharing has a lower risk for supply chain members and can better achieve the coordination of low-carbon supply chain.
2.3 The Financing Decisions of a Capital-Constrained Supply Chain
Lai et al. [29] pointed out that many firms with heavy investment and low margin are capital-constrained. These firms need to finance their operations from external capital markets. Gong et al. [30] also found that a firm’s operational decisions are affected by their internal capital and ability to obtain external capital. They studied the dynamic inventory control for firms with limited capital and short-term financing. Some articles have examined the effect of different supply chain financing contracts. Dada et al. [31] studied the game between the capital-constrained retailer’s inventory decisions and the bank’s interest rate decisions, and presented a non-linear loan contract to coordinate the supply chain. Xiao et al. [32] considered the situation where downstream retailers have financial constraints and bank credit restrictions. Suppliers can borrow from banks and provide retailers with commercial credit financing. They discussed the supply chain coordination under revenue sharing contracts, repurchase contracts, and full-volume discount contracts. Green financing, which is closely related to our research, has also attracted scholars’ attention. Wang et al. [33] argued that green financing is an innovative financial model with environmental protection as the goal, which can achieve the organic combination of environmental protection and economic benefits. Fang et al. [34] studied a Green Supply Chain Financing (GSCF) system, and derived the financing equilibrium of the GSCF system under the green supply chain and hybrid financing. Yang et al. [35] considered a green supply chain with one manufacturer and two fund-restricted retailers, and then analyzed the impact of credit strategies on the performance of green supply chains. In addition, some scholars have explored financing decisions for capital-constrained [36] and risk-averse [37] supply chains.
There are three differences between this study and the above literature: Firstly, in our research, manufacturers are short of capital in low-carbon technology transformation rather than in production operations. Secondly, all the shortage of capital came from external financing, such as bank loans. Thirdly, we designed a cooperative financing model based on financing cost sharing that maximizes the benefits of the supply chain and its members.
The supply chain in this paper is composed of one manufacturer and one retailer. Retailers purchase low-carbon products from manufacturers and sell them to consumers. Manufacturing low-carbon products can reduce carbon trading costs and increase product prices, but the capital-constrained manufacturers need external financing to implement low-carbon technology. Our model focuses on the financing strategy of the low-carbon supply chain under cap-and-trade regulation, finding the optimal cooperation model by comparing the profits, carbon emission reduction levels, and low-carbon product quantities of the supply chain under different financing cost sharing schemes.
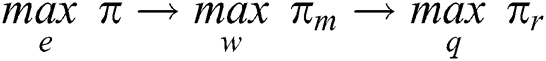
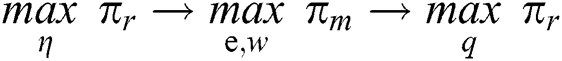
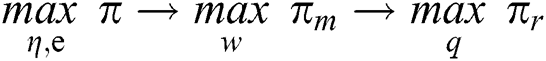
The sequence of decision-making participants’ actions is divided into two stages. The first stage is financing and implementation of low-carbon technology. The optimal performance level of low-carbon technology is determined. The second stage is production and marketing. This is a Stackelberg game where the manufacturer determines the optimal wholesale price and the retailer determines the optimal production quantity to maximize their profits. The notations are described in Tab. 1.
Table 1: The parameters and definitions
Before presenting the model, we first articulate some assumptions:
Assumption 1. The supply chain adopts the MTO (make-to-order) model. The supply chain members do not consider factors such as inventory cost and out of stock loss in the process of production and sales. The quantity of low-carbon products and the retailer’s order quantity are equivalent to the market demand. MTO supply chain is widely used to study the decision-making behavior of enterprises [38]. It is easy for us to obtain analytical solutions to the problem, which can lead to more management insights.
Assumption 2. The implementation of a low-carbon emission reduction plan is a one-time investment with high cost, which is not related to the quantity of low-carbon products. Many scholars have applied the cost function of traditional technological innovation to calculate the cost of low-carbon emission reduction technology. In consideration of the previous literature [39,40], the emission cost is quadratic in the carbon emission reduction level.  efforts are paid to achieve carbon emission trading cost reductions.
Assumption 3. The manufacturer is capital-constrained, and all of the investment of carbon emission reduction technology comes from external financing and the loan capital, and financing cost  has to be paid at the end of the financing cycle. This paper takes no account of the financing risks and credit problems and considers that the manufacturer can obtain enough financing for technical improvement in production and can obtain enough funds for the payment of the principal and interest at the end of the sales cycle.
Assumption 4. Consumers’ awareness of environmental protection has gradually increased, and they are willing to pay higher prices for low-carbon products. The low-carbon level of a product is expressed as a demand enhancement factor in the linear demand function [41], so the price is positively correlated with the carbon emission reduction level, and defines the price function  . The definitions of parameters
  and
and  are listed in Tab. 1.
Assumption 5. In our model, we depict the manufacturers’ low-carbon behaviors under the cap-and-trade regulation through the function  , where
  represents the carbon emission reduction per unit caused by low-carbon technological innovation. If
 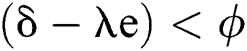 , the initial carbon quota allocated by the government has not been used up and can be sold in the carbon trading market. Oppositely, if
 , the manufacturer needs to buy additional carbon quota in the carbon trading market.
4.1 Manufacturer Independent Financing
We first analyze the situation of independent financing by manufacturers. The amount of financing is determined by the low-carbon emission reduction level. In our research, the determination of the low-carbon emission reduction level of the supply chain under the manufacturer’s independent financing model can be divided into three cases: The first is a centralized carbon emission reduction decision model that the level of low-carbon emission reduction is determined by maximizing the profit of the supply chain. The premise of this decision model is that the low-carbon emission reduction level e > 0. Because this model is carbon reduction cooperation between manufacturers and retailers, we must ensure that e ≠ 0. The second is a decentralized carbon emission reduction decision model in which manufacturers determine low-carbon emission reduction levels based on maximizing their own profits. The value of the low-carbon emission reduction level in this model is e ≥ 0. The third case is that there is no financing, manufacturers do not invest in low-carbon emission reduction technology, and the value of e is equal to zero, manufacturers should purchase additional carbon emission allowances for excessive carbon emissions.
When the manufacturer is financing independently, the profit functions of the retailer and the manufacturer are expressed as follows:

 is the retailer’s profit,
 represents the price of the unit product, and
 indicates the low-carbon premium due to consumer environmental awareness, which is the main motivation for manufacturers to implement low-carbon emission reduction technologies.

 is the manufacturer’s profit. This formula consists of three terms. The first term
  represents the sales profit, the second term
  is the carbon trading costs, and the third term
  is the capital and interest costs for implementing low-carbon emission reduction technologies.
4.1.1 Centralized Carbon Emission Reduction Decision (MC)
In this model, we adopt the centralized decision mode to research low-carbon technology investment and financing decision, we use superscript MC to denote the centralized decision model for independent financing. The model consists of two stages.
The total profit of the supply chain is the sum of the profits of the manufacturer and the retailer:

The process of the centralized decision model can be described as follows:
The models are multi-stage games, and we can use backward induction to solve it. The optimal value of decision variables is obtained by solving the model as shown below.
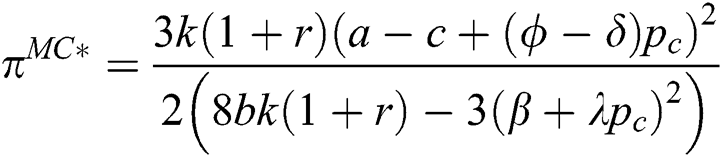
Theorem 1. If 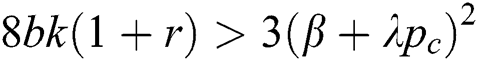 , the supply chain optimal decisions under centralized decisions are shown as follows:
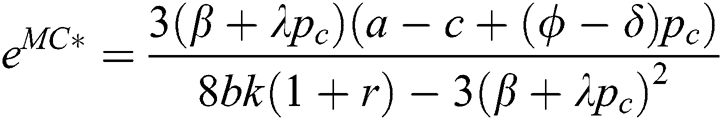

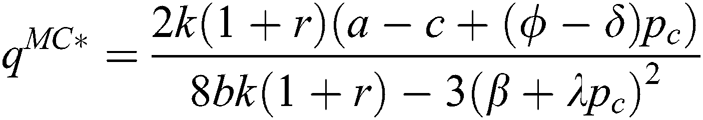
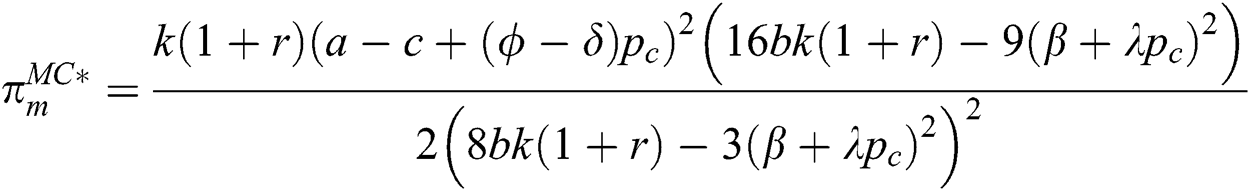
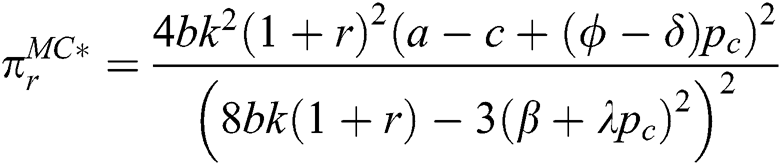
Under equilibrium condition, the optimal profit of supply chain and the members are as follows:
According to Theorem 1, we can obtain Lemma 1:
Lemma 1. The effects of the financing interest rate on the supply chain under centralized decisions are as follows:
i)The optimal carbon emission reduction level  and the optimal quantity of low-carbon products
  are negatively related to the financing interest rate r.
ii)When ,
,  related to r. When
  , the optimal unit wholesale price
  is negatively related to r.
4.1.2 Decentralized Carbon Emission Reduction Decision (MD)
As the manufacturer is paid to produce low-carbon technology costs, financing costs, and carbon transaction costs, centralized decisions that maximize the supply chain’s total profit are difficult to achieve in practice.
The process of the decentralized decision model is described as follow:
This is a Stackelberg game led by the manufacturer. We can also use backward induction to obtain the optimal value of decision variables in Theorem 2.
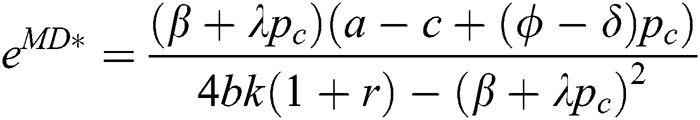
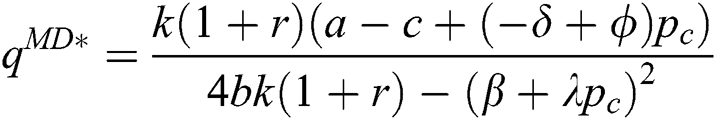
Theorem 2. If 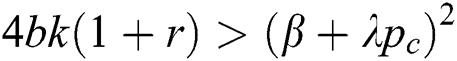 , the supply chain’s optimal decisions under decentralized decisions are shown as follows:

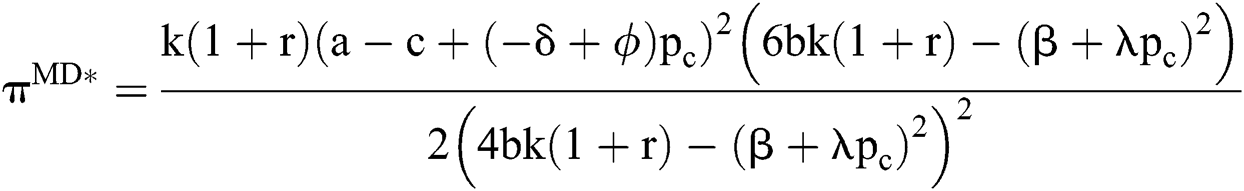
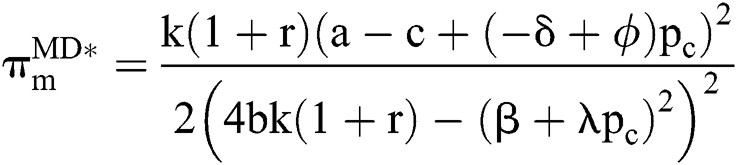
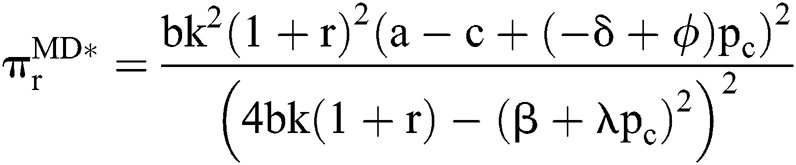
The optimal profit of the supply chain and the members under a decentralized decision model are as follows:
4.1.3 Manufacturer Non-Financing Model
We assume that the manufacturers cannot obtain commercial loans. Due to financial constraints, low-carbon emission reduction technologies cannot be implemented, and low-carbon emission reduction level e = 0. We use the superscript N to indicate the manufacturer’s no financing model, which can be shown as follows:


Theorem 3. The optimal profit of the supply chain and the members are as follows: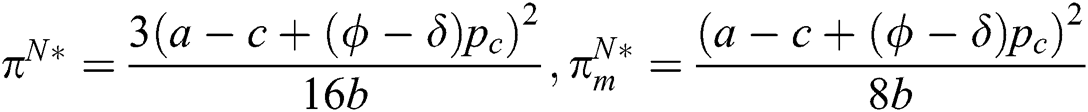 ,
,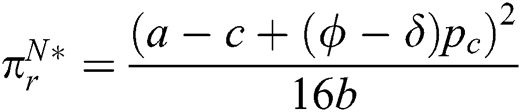 .
.
Lemma 2. Comparing to the optimal profits, we can obtain the following relationships:
 ,
, 
Lemma 2 compared the profits of the supply chain and its members under different decision-making modes. We can make the following conclusions:
1.The manufacturer has increased their profits after financing and implementing low-carbon emission reduction technologies. Under the no financing model (N), it is necessary for the manufacturer to purchase insufficient carbon allowances during the production process.
2.The profits of supply chain and the retailer are also increased after financing and implementing low-carbon emission reduction technologies.
4.2 Supply Chain Cooperative Financing
In this model, we assume that the retailer participates in the implementation and financing of low-carbon emission reduction technologies and shares the financing costs with the manufacturer. We create a coordination mechanism, where the parameter  (
( ) represents the proportion of financing costs borne by the retailer. Similar to the previous section, we determined the low-carbon emission reduction level through centralized and decentralized decision-making models. Due to cooperative financing, we must ensure that the low-carbon emission reduction level e ≠ 0. In other words, whether the decision-making model is centralized or decentralized, low-carbon emission reduction technologies must be implemented. According to the determination of the optimal cost-sharing ratio, this section is divided into two cases: In the first case, the retailer determines
  . We indicated it by superscript SD. In the second case, the manufacturer and retailer negotiate to determine
  , which is indicated by the superscript SC. Based on the above assumptions and parameters, the decision problem of supply chain coordination can be modeled as follows:


The total profit of the supply chain with cooperative financing is the sum of the profits of the manufacturer and the retailer:

4.2.1 Decentralized Carbon Emission Reduction Decision (SD)
In the previous section, we concluded that the optimal choice for manufacturer financing independently is decentralized decisions (MD). On this basis, we calculate the retailer’s optimal cost-sharing ratio. The process of the supply chain cooperative financing model is described as follows:
We use backward induction to obtain the optimal decision variable values and optimal profit under equilibrium conditions as follows:
Theorem 4. When  , the supply chain’s optimal decisions under coordination decision are shown as follows:
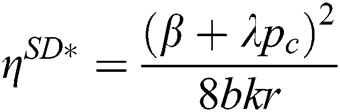


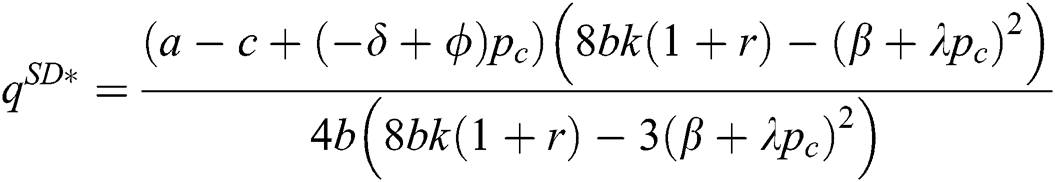
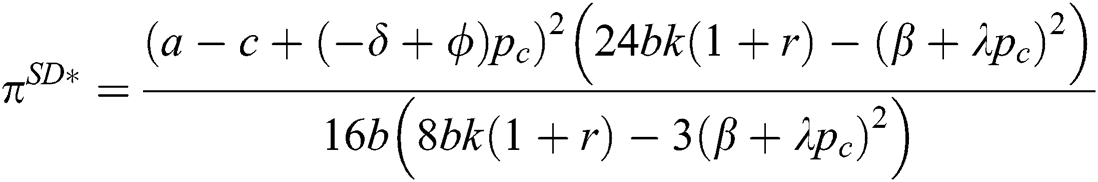
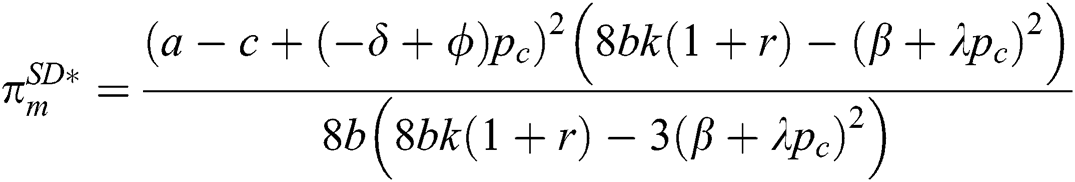
The optimal profit of supply chain and the members under supply chain coordination model are as follows:
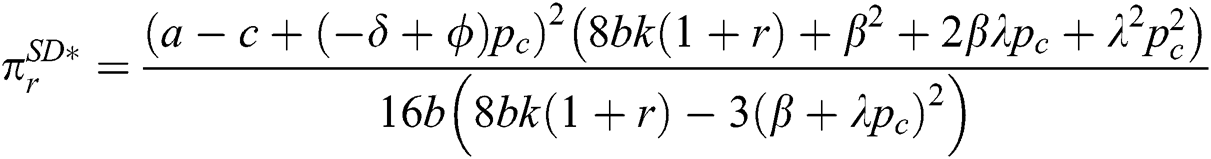
Lemma 3. Combined with the optimal decision of the manufacturer in the previous chapter, when manufacturers and retailers make independent decisions, the relationships of the profits of the supply chain under supply chain cooperative financing model (SD) and the manufacturer independent financing (MD) are as follows:
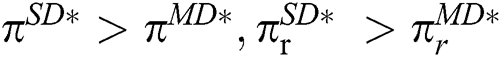 ,
, 
Lemma 3 shows that, in the context of cooperative financing, the profits of the supply chain and its members have all increased. This also shows that the financing cost sharing mechanism has a Pareto improvement effect on the supply chain implementing low-carbon emission reduction technologies. However, under the consideration of rational participants, the optimal financing cost-sharing ratio and low-carbon emission reduction level are determined by retailers and manufacturers, respectively, which also results in the supply chain’s overall environmental performance and economic performance not being optimal. Therefore, we need to consider a cooperative mechanism that maximizes the profit of the supply chain and improves the profit level of the supply chain members under the background of cooperative financing.
4.2.2 Centralized Carbon Emission Reduction Decision (SC)
In this section, we assume that both manufacturers and suppliers have more specific consultations on financing cooperation mechanisms. The process of the SC model is described as follows:
In the first phase, manufacturers and retailers cooperate in financing. The retailer and the manufacturer jointly determined the financing cost-sharing ratio. In the second phase, manufacturers and retailers make wholesale and retail price decisions, respectively. This is a Stackelberg game similar to the previous section. We use backward induction to obtain the optimal decision variable values and optimal profit under equilibrium conditions as follows:
Theorem 5. If  , the supply chain optimal decisions under centralized decision are shown as follows:


The optimal profit of supply chain and the members under the supply chain coordination model are as follows:

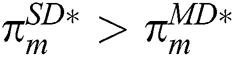
Lemma 4. For the supply chain’s total profits, always exists. For the supply chain member’s profits,
 and
and 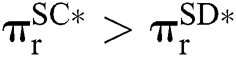 when
when  .
.
Lemma 4 shows that, under the cooperative financing model, adopting a centralized decision mode increased the total profits of the supply chain. That is to say, the SC mode has significant advantages over the SD mode from the perspective of the supply chain. The financing cost-sharing ratio  represents the contribution level of retailers to the low-carbon emission reduction of the supply chain. The level of this contribution also determines whether the profits of the supply chain members can increase. If the value of
  is greater than a certain threshold (the derivation of the value range is in Appendix A), it will damage the retailer’s profit; otherwise, it will reduce the manufacturer’s profit. Therefore, we need to limit the value of
  to a reasonable range to ensure that the profits of the manufacturer and the retailer have increased compared with the SD model, such that the members of the supply chain are willing to accept the SC mode.
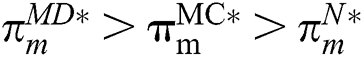
Lemma 5. Comparing the optimal carbon emission reduction level in the four modes, we can obtain the relationships as follows:

Lemma 5 shows that the optimal low-carbon emission reduction level under the MC and SC models are the highest, and that a centralized decision model is conducive to improving the environmental level of the supply chain. The low-carbon emission reduction level in the MD mode is the lowest. This indicates that, when the manufacturer is independently financing, as the leader of the game in a decentralized decision model, in order to maximize their own profits, rational manufacturers will actively reduce the level of low-carbon technology and the product quantities in the supply chain. In this case, the level of low-carbon emission reduction in the supply chain is not brought to the maximum level, and the damage caused by carbon emissions to the environment has not been reduced to the minimum. The supply chain cooperative financing mechanism and centralized decisions have significantly increased the level of low-carbon emission reduction, which indicates that this coordination mechanism of financing cost sharing has a positive effect. Due to the complexity of the formula, we will compare the profits of the supply chain and the members in numerical analysis.
In this section, a numerical analysis is conducted to illustrate the theoretical results and provide a theoretical basis for management practice. On the premise of meeting the constraints of the previous models, we estimate the parameters to verify the relationship between the parameters in the model, and show the impact of parameter changes on profits, carbon emission reduction levels, and wholesale price.
5.1 The Impact of Financing Interest Rates on Optimal Profits of the Supply Chain and Its Members
Subject to the relevant constraints in the previous chapter, the parameter settings used in this numerical analysis are as follows:  0.6. The interest rate r in this study is an exogenous variable, which is affected by the level of economic development and the policies of the authorities and financial institutions. We assume that the range of interest rates is [0,1]. Fig. 1 shows that the optimal profit of the supply chain is a decreasing function of interest rates. Under four decision modes, profits of the supply chain all decline as interest rates increase. Whether the manufacturer adopts independent financing or the supply chain implements cooperative financing, the total profit of the supply chain under the decentralized decision models, MD and SD, is always lower than that under the centralized decision models SC and MC, and the SC and MC curves completely coincide. Under a decentralized decision mode, the cooperative mode of financing cost sharing SD increases the overall profit of the supply chain and improves the performance level of the supply chain to a greater extent than MD, but it did not reach the profit level of the centralized decision models SC and MC. According to Fig. 1, we can conclude
  . As the MC model is a benchmark, it is difficult to achieve in actual management practice; therefore, from the perspective of the overall supply chain, the optimal choice is the SC model.
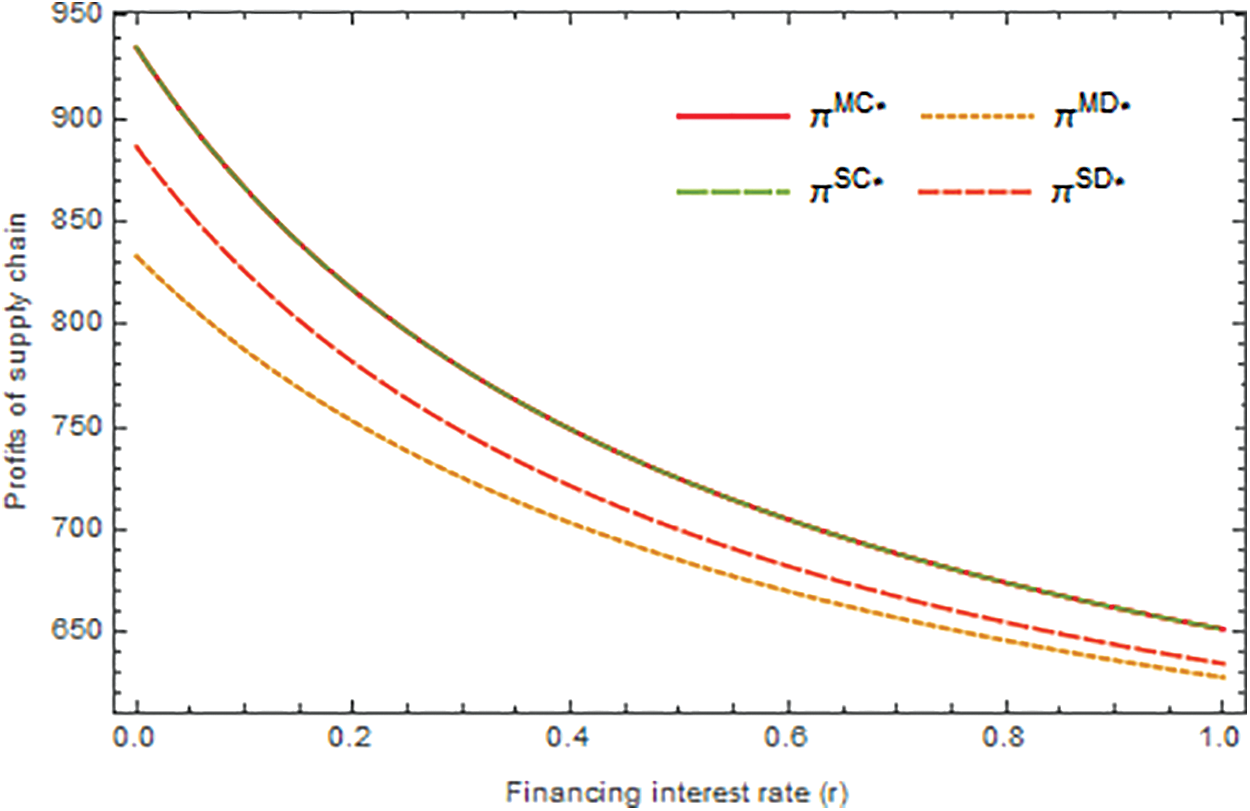
Figure 1: The impact of financing interest rate on the profits of the supply chain
Fig. 2 shows the trend of the manufacturer’s profits when the financing interest rate fluctuates. In the case of independent financing by the manufacturer, the profits under decentralized decisions (MD) are always higher than those under centralized decisions (MC), which validates the conclusion of Lemma 2, the optimal decision of the manufacturer when independent financing is MD. Supply chain cooperative financing makes retailers contribute to low-carbon emission reduction. The retailer determines their own optimal financing cost-sharing ratio in the SD mode. This cooperation model makes the manufacturer’s profit increase, so manufacturers are willing to accept this coordination mechanism, which is consistent with the conclusion of Lemma 3. In addition, when r > 0.44, the manufacturer’s profit in the SC mode surpasses the other three modes and becomes the manufacturer’s optimal choice. This also shows that, when the financing interest rate increases, the SC model has a certain ability to resist risks. Fig. 3 shows the trend of the retailer’s profits when the financing interest rates are different. Under the MC decision mode, the retailer’s profit is the highest, but according to the analysis in the previous section, if the manufacturer adopts the MC decision mode, it will damage its own profits, so the MC decision mode will not be selected when the manufacturer independently finances. In cooperative financing, when the retailer adopts the SD model that determines the proportion of financing cost sharing based on its own maximum profit, its profit level exceeds the optimal decision-making model MD of independent financing. This is also the main motivation for retailers to participate in cooperative financing. When r < 0.73, the profit of retailers under the SC mode exceeds the profit under the SD mode, which shows that, in cooperative financing, the proportion of financing cost sharing is determined through coordination. When the interest rate is not particularly high, there is room for an increase in retailer profits.
Figure 2: The impact of financing interest rate on the profits of the manufacturers
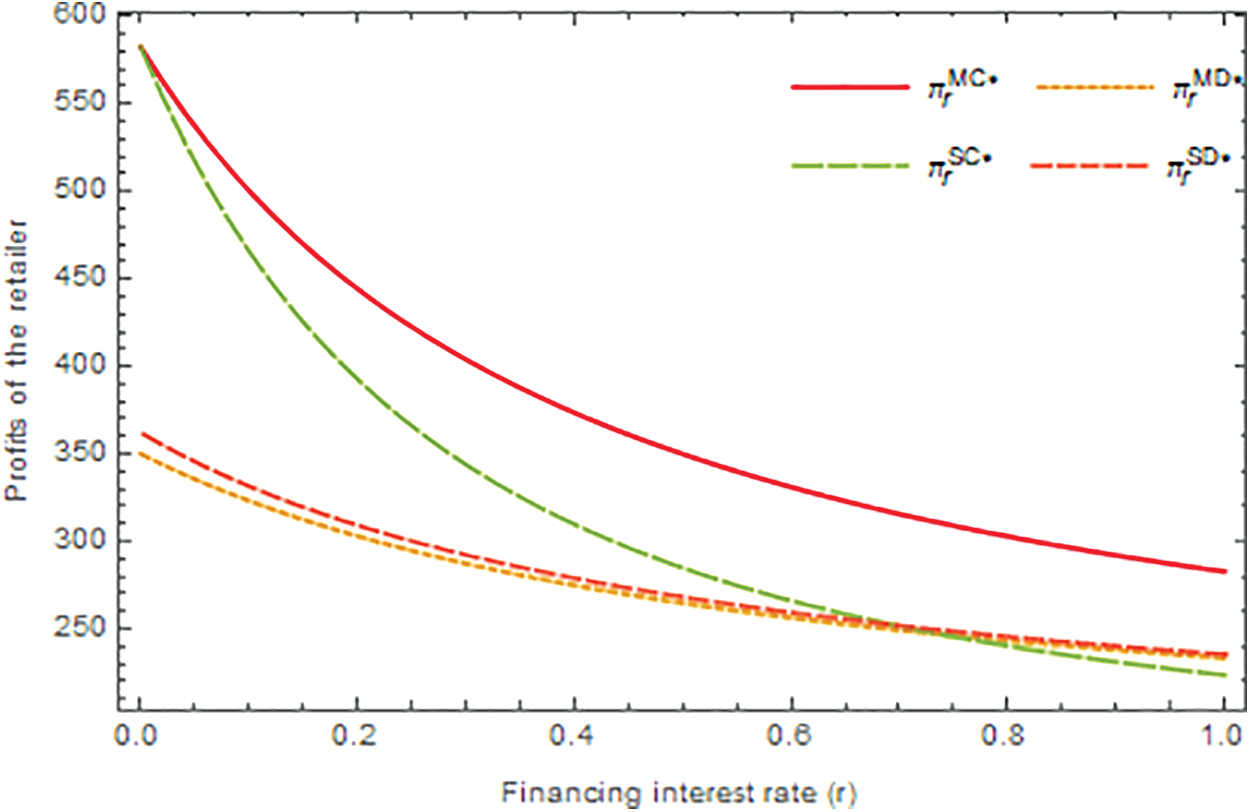
Figure 3: The impact of financing interest rate on the profits of the retailer
5.2 The Impact of Different Decision Modes on Carbon Emission Reduction Level and Unit Wholesale Price
From an environmental perspective, interest expenditures caused by funding shortages have reduced low-carbon emission reduction levels. Fig. 4 shows that the low-carbon emission reduction level under a centralized decision model (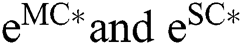 ) is always greater than that under a decentralized decision model. The ultimate goal of the cap-and-trade regulation is to improve environmental benefits, and encourage companies to reduce carbon emissions as much as possible. The centralized mode makes the overall profit of the supply chain and the level of low-carbon emission reduction reach the optimum. Both environmental and economic benefits can be achieved. Considering that the centralized mode MC in independent financing can only be used as a benchmark, from the perspective of low-carbon emission reduction, the SC mode is the optimal choice for the supply chain. It can be seen in Fig. 5 that the carbon trading price
  in the calculation example exceeds the threshold
  , so the optimal wholesale price is positively correlated with the interest rate, which is consistent with the conclusion of Lemma 1. Compared with the MD decision model, the wholesale price in the SD model has decreased, but it has not reached the minimum. After manufacturers and retailers decided to adopt the SC model, the wholesale price was reduced to be consistent with the benchmark price. The decline in wholesale prices means cost savings for retailers and increased competitiveness for manufacturers. From a price perspective, the SC model is the optimal decision for members of the supply chain. Fig. 6 shows that the quantity of optimal products decreases with rising interest rates, which is also in line with the conclusion of Lemma 1. When the manufacturer is financing independently, the optimal number of products using the MD mode is the lowest. In the context of cooperative financing, a decentralized decision model (SD) will increase the output of the supply chain, but it does not reach the optimal level. The SC mode further increases the optimal quantity of products, reaching the quantity of products under the MC mode as a benchmark. Therefore, from the perspective of increasing production capacity, SC is the optimal choice of the supply chain.
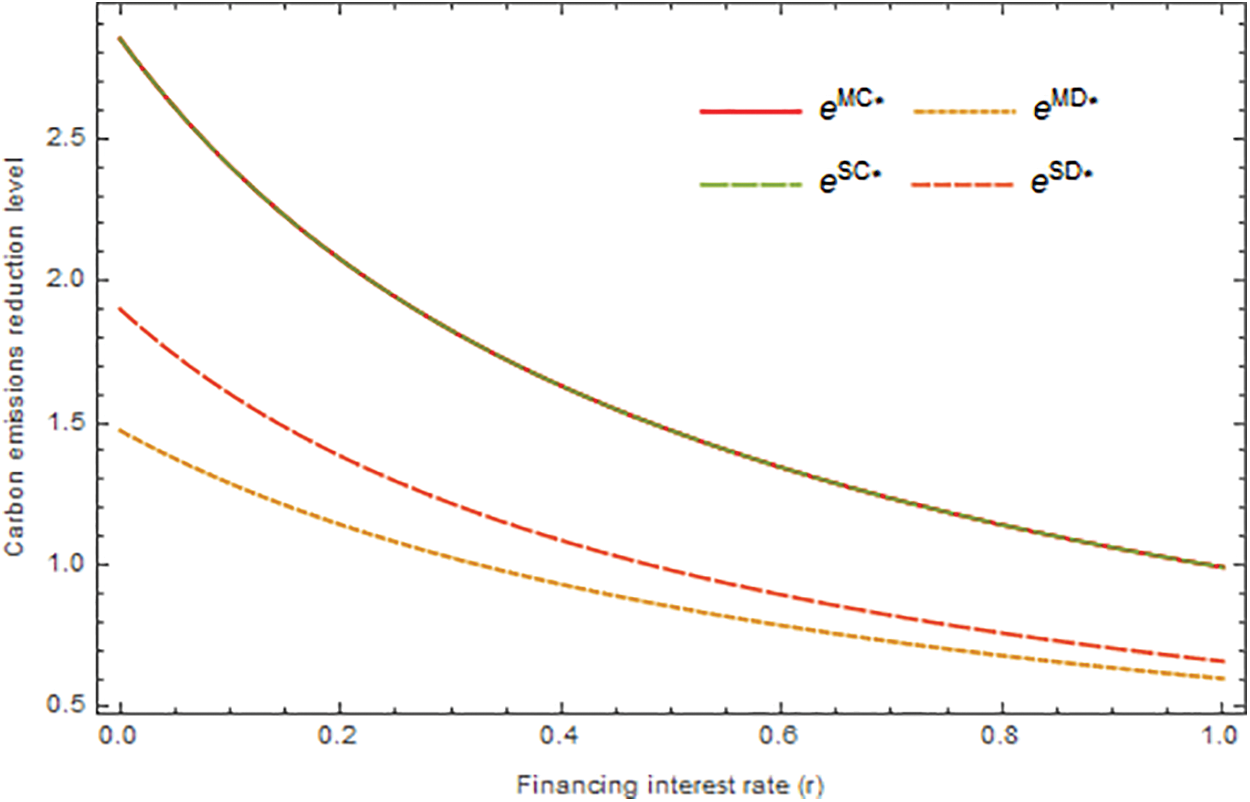
Figure 4: The impact of financing interest rate on the carbon emission reduction level
Figure 5: The impact of financing interest rate on the wholesale price
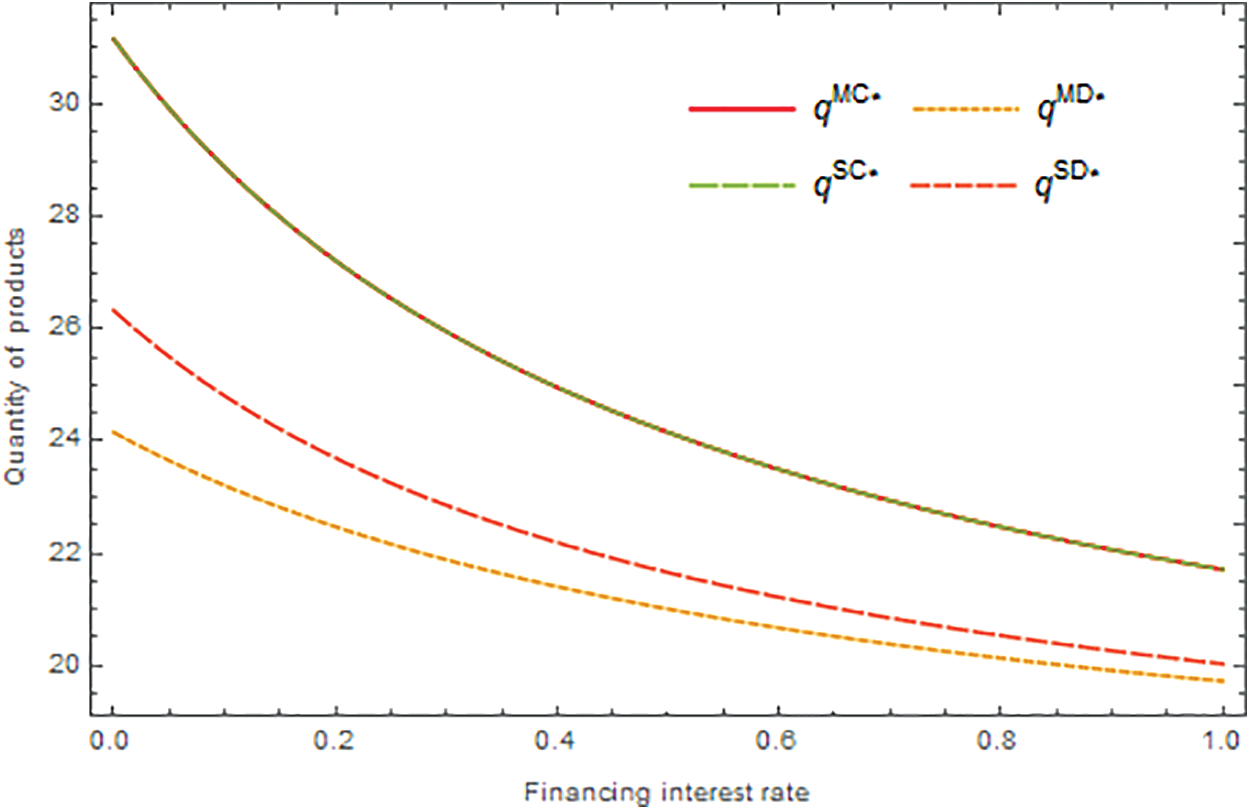
Figure 6: The impact of financing interest rate on the quantity of products
5.3 The Impact of the Financing Cost-Sharing Ratio
Subject to the relevant constraints, the parameter settings used in this numerical analysis are as follows:  0.5. In the centralized decision mode SC under the background of cooperative financing,
  is jointly decided by manufacturers and retailers, and has no effect on the total profit of the supply chain and the level of low-carbon emission reduction. This section mainly analyzes the impact of
  on the profits of manufacturers and retailers. As Fig. 7 shows, with the increase of the financing cost sharing coefficient
  , the profits of the manufacturer under model SC have increased significantly. The increase of
  means that the retailer has taken on more responsibilities and reduces the burden on the manufacturer, so the profit will increase accordingly. Fig. 8 shows that the retailer’s profit is negatively correlated with the financing cost-sharing ratio
  , which reflects that the retailer’s profit shows a downward trend with the increase of
  . By calculation, we can show that, if the value of the proportion of the cost-sharing financing meeting the conditions
 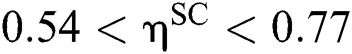 , regardless of the MC decision model which as a benchmark, the profits of retailers and suppliers in the SC model have reached Pareto improvement.
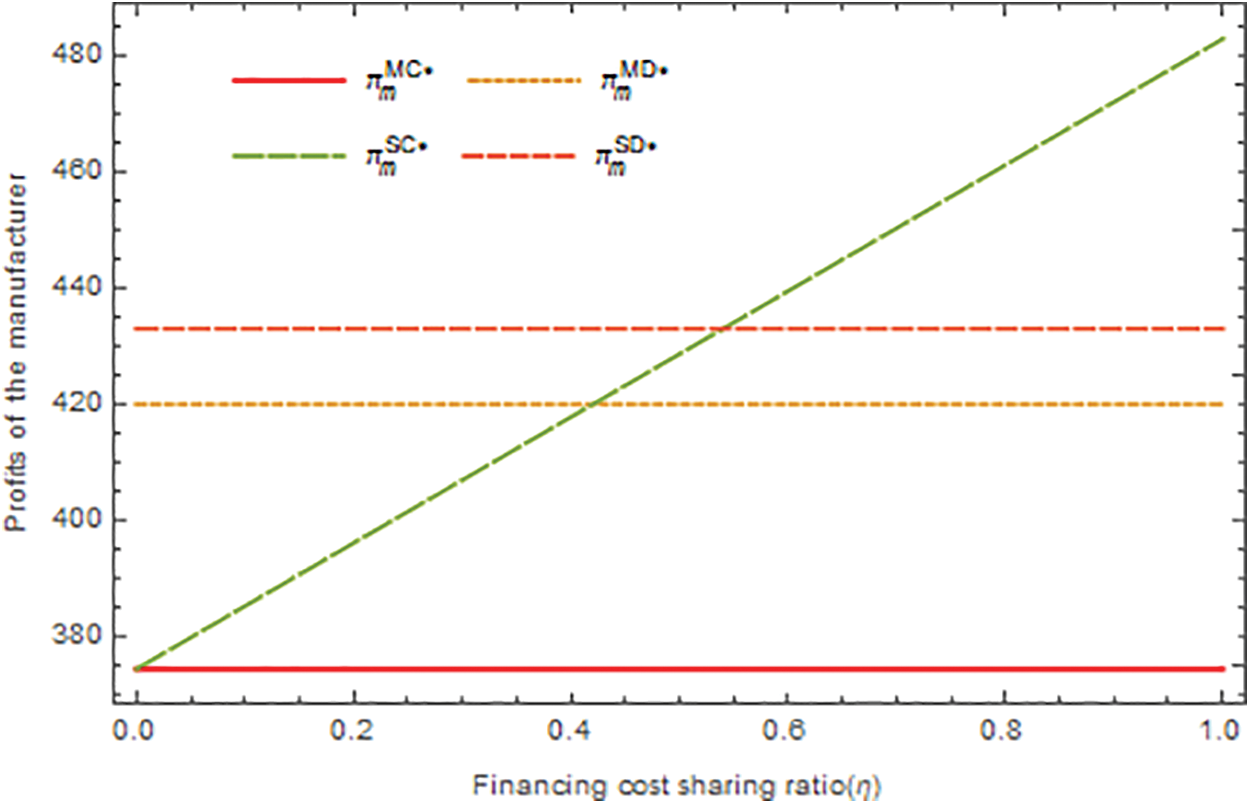
Figure 7: The impact of financing cost-sharing ratio on the profits of the manufacturer
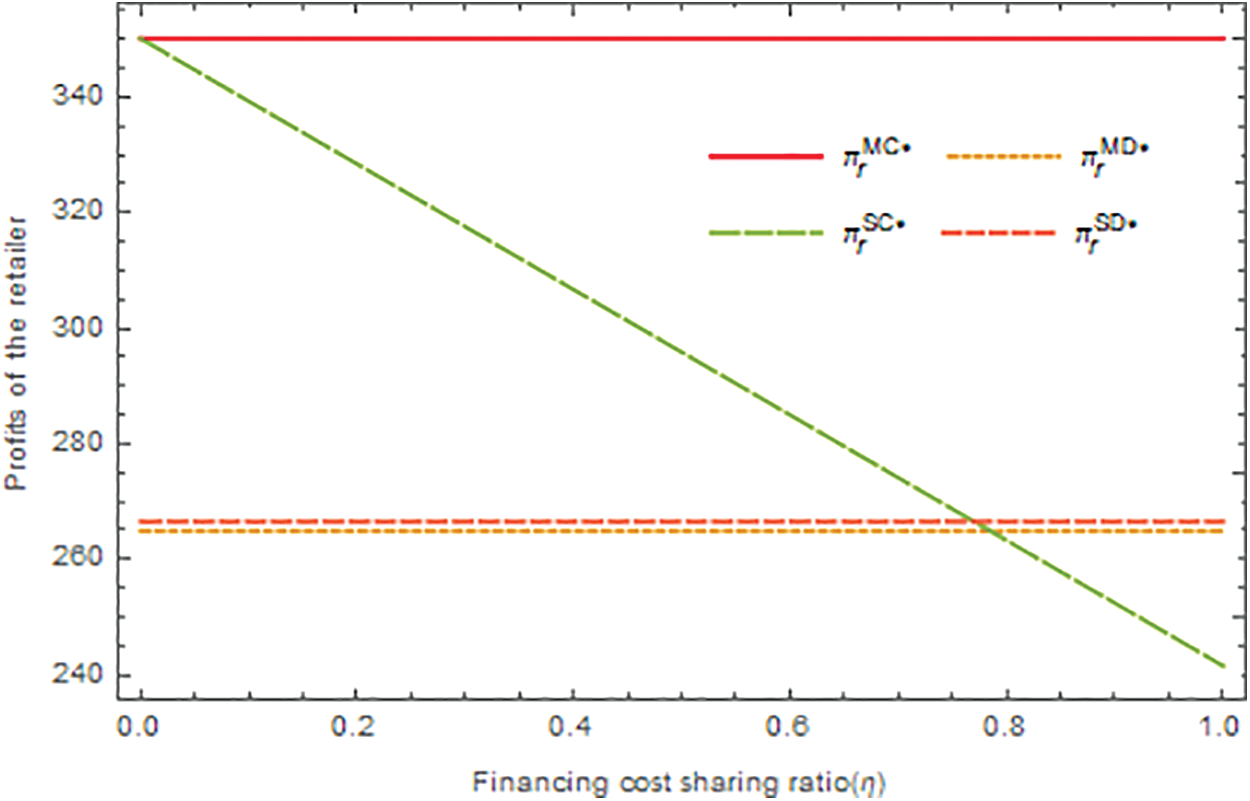
Figure 8: The impact of financing cost-sharing ratio on the profits of the retailer
This paper studies the financing strategies of low-carbon emission reduction technologies for capital-constrained manufacturers under cap-and-trade regulation. When the manufacturer independently finances, it is divided into two decision modes: Centralized and decentralized. Under a centralized decision-making model, manufacturers and retailers determine the optimal decision based on maximizing the profit of the supply chain. Under a decentralized decision model, the optimal decision is determined based on the manufacturer’s own profit maximization. When the manufacturers and the retailer engage in cooperation financing, retailers bear part of the financing costs. We analyzed two cases: the share ratio is determined by the retailer, and the supply chain negotiation determines the share ratio. Finally, we used numerical analysis to compare the optimal profit, the low-carbon emission reduction level, and other decision variables.
There are some limitations in our research, some of which may provide guidance for our future research. First, in this study, only manufacturers are capital-constrained, and financing is used for low-carbon emission reduction technologies. In reality, there are still many other companies that are capital-constrained, and there may be capital requirements in production, wholesale, inventory, and logistics. It is interesting to study the impact of multiple participants’ financing behavior on operational decisions. Second, due to the uncertainty of the market environment, the risks of financing are widespread.
Funding Statement: This work is supported by the SUT research and development fund.
Conflicts of Interest: The authors declare that they have no conflicts of interest to report regarding the present study.
References
1. E. Momeni, F. H. Lotfi, R. F. Saen and E. Najafi. (2019). “Centralized DEA-based reallocation of emission permits under cap and trade regulation,” Journal of Cleaner Production, vol. 234, pp. 306–314.
2. X. Hu, Z. Yang, J. Sun and Y. Zhang. (2020). “Carbon tax or cap-and-trade: Which is more viable for Chinese remanufacturing industry?,” Journal of Cleaner Production, vol. 243, pp. 118–606.
3. M. Betsill and M. J. Hoffmann. (2011). “The contours of cap and trade: The evolution of emissions trading systems for greenhouse gases,” Review of Policy Research, vol. 28, no. 1, pp. 83–106.
4. H. Sun, J. Yang and Y. Zhong. (2020). “Optimal decisions for two risk-averse competitive manufacturers under the cap-and-trade policy and uncertain demand,” International Journal of Environmental Research and Public Health, vol. 17, no. 3, pp. 1–17.
5. L. Zhang, J. Wang and J. You. (2015). “Consumer environmental awareness and channel coordination with two substitutable products,” European Journal of Operational Research, vol. 241, no. 1, pp. 63–73.
6. K. Wang, R. Zhao and H. Chen. (2018). “Optimal credit period and green consumption policies with cash-credit payments under asymmetric information,” Journal of Cleaner Production, vol. 205, pp. 706–720.
7. N. Yan, X. Jin, H. Zhong and X. Xu. (2020). “Loss-averse retailers’ financial offerings to capital-constrained suppliers: Loan vs. investment,” International Journal of Production Economics, vol. 227, pp. 1–15.
8. S. Du, W. Tang and M. Song. (2016). “Low-carbon production with low-carbon premium in cap-and-trade regulation,” Journal of Cleaner Production, vol. 134, pp. 652–662.
9. H. Yang, F. Sun, J. Chen and B. Chen. (2019). “Financing decisions in a supply chain with a capital-constrained manufacturer as new entrant,” International Journal of Production Economics, vol. 216, pp. 321–332.
10. J. A. Buzacott and R. Q. Zhang. (2004). “Inventory management with asset-based financing,” Management Science, vol. 50, no. 9, pp. 1274–1292.
11. Y. Zhu, L. Zhou, C. Xie, G. J. Wang and T. V. Nguyen. (2019). “Forecasting SMEs’ credit risk in supply chain finance with an enhanced hybrid ensemble machine learning approach,” International Journal of Production Economics, vol. 211, pp. 22–33.
12. W. Jin, Q. Zhang and J. Luo. (2019). “Non-collaborative and collaborative financing in a bilateral supply chain with capital constraints,” Omega, vol. 88, pp. 210–222.
13. S. Zhang, C. Wang, C. Yu and Y. Ren. (2019). “Governmental cap regulation and manufacturer’s low carbon strategy in a supply chain with different power structures,” Computers & Industrial Engineering, vol. 134, pp. 27–36.
14. J. Ji, Z. Zhang and L. Yang. (2017). “Comparisons of initial carbon allowance allocation rules in an O2O retail supply chain with the cap-and-trade regulation,” International Journal of Production Economics, vol. 187, pp. 68–84.
15. L. Yang, J. Ji, M. Wang and Z. Wang. (2018). “The manufacturer’s joint decisions of channel selections and carbon emission reductions under the cap-and-trade regulation,” Journal of Cleaner Production, vol. 193, pp. 506–523.
16. X. Xu, X. Xu and P. He. (2016). “Joint production and pricing decisions for multiple products with cap-and-trade and carbon tax regulations,” Journal of Cleaner Production, vol. 112, pp. 4093–4106.
17. X. Meng, Z. Yao, J. Nie, Y. Zhao and Z. Li. (2018). “Low-carbon product selection with carbon tax and competition: Effects of the power structure,” International Journal of Production Economics, vol. 200, pp. 224–230.
18. P. He, W. Zhang, X. Xu and Y. Bian. (2015). “Production lot-sizing and carbon emissions under cap-and-trade and carbon tax regulations,” Journal of Cleaner Production, vol. 103, pp. 241–248.
19. A. K. Purohit, R. Shankar, P. K. Dey and A. Choudhary. (2016). “Non-stationary stochastic inventory lot-sizing with emission and service level constraints in a carbon cap-and-trade system,” Journal of Cleaner Production, vol. 113, pp. 654–661.
20. M. García-Alvarado, M. Paquet, A. Chaabane and L. Amodeo. (2017). “Inventory management under joint product recovery and cap-and-trade constraints,” Journal of Cleaner Production, vol. 167, pp. 1499–1517.
21. Q. Zhu, Y. Geng and K. H. Lai. (2010). “Circular economy practices among Chinese manufacturers varying in environmental-oriented supply chain cooperation and the performance implications,” Journal of Environmental Management, vol. 91, pp. 1324–1331.
22. X. Xu, P. He, H. Xu and Q. Zhang. (2017). “Supply chain coordination with green technology under cap-and-trade regulation,” International Journal of Production Economics, vol. 183, pp. 433–442.
23. T. Li, R. Zhang, S. Zhao and B. Liu. (2019). “Low carbon strategy analysis under revenue-sharing and cost-sharing contracts,” Journal of Cleaner Production, vol. 212, pp. 1462–1477.
24. L. Xu, C. Wang and J. Zhao. (2018). “Decision and coordination in the dual-channel supply chain considering cap-and-trade regulation,” Journal of Cleaner Production, vol. 197, pp. 551–561.
25. X. Chen, X. Wang and M. Zhou. (2019). “Firms’ green R&D cooperation behavior in a supply chain: Technological spillover, power and coordination,” International Journal of Production Economics, vol. 218, pp. 118–134.
26. Q. Bai, J. Xu and Y. Zhang. (2018). “Emission reduction decision and coordination of a make-to-order supply chain with two products under cap-and-trade regulation,” Computers & Industrial Engineering, vol. 119, pp. 131–145.
27. J. Xu, Y. Chen and Q. Bai. (2016). “A two-echelon sustainable supply chain coordination under cap-and-trade regulation,” Journal of Cleaner Production, vol. 135, pp. 42–56.
28. R. Dai, J. Zhang and W. Tang. (2017). “Cartelization or cost-sharing? Comparison of cooperation modes in a green supply chain,” Journal of Cleaner Production, vol. 156, pp. 159–173.
29. G. Lai, L. G. Debo and K. Sycara. (2009). “Sharing inventory risk in supply chain: The implication of financial constraint,” Omega, vol. 37, no. 4, pp. 811–825.
30. X. Gong, X. Chao and D. Simchi-Levi. (2014). “Dynamic inventory control with limited capital and short-term financing,” Naval Research Logistics, vol. 61, no. 3, pp. 184–201.
31. M. Dada and Q. Hu. (2008). “Financing newsvendor inventory,” Operations Research Letters, vol. 36, no. 5, pp. 569–573.
32. S. Xiao, S. P. Sethi, M. Liu and S. Ma. (2017). “Coordinating contracts for a financially constrained supply chain,” Omega, vol. 72, pp. 71–86.
33. Y. Wang and Q. Zhi. (2016). “The role of green finance in environmental protection: Two aspects of market mechanism and policies,” Energy Procedia, vol. 104, pp. 311–316.
34. L. Fang and S. Xu. (2020). “Financing equilibrium in a green supply chain with capital constraint,” Computers & Industrial Engineering, vol. 143, pp. 1–18.
35. H. Yang, L. Miao and C. Zhao. (2019). “The credit strategy of a green supply chain based on capital constraints,” Journal of Cleaner Production, vol. 224, pp. 930–939.
36. J. Huang, W. Yang and Y. Tu. (2020). “Financing mode decision in a supply chain with financial constraint,” International Journal of Production Economics, vol. 220, pp. 107–441.
37. B. Li, S. An and D. Song. (2018). “Selection of financing strategies with a risk-averse supplier in a capital-constrained supply chain,” Transportation Research Part E: Logistics and Transportation Review, vol. 118, pp. 163–183.
38. X. Xu, W. Zhang, P. He and X. Xu. (2017). “Production and pricing problems in make-to-order supply chain with cap-and-trade regulation,” Omega, vol. 66, pp. 248–257.
39. H. Gurnani and M. Erkoc. (2008). “Supply contracts in manufacturer-retailer interactions with manufacturer-quality and retailer effort-induced demand,” Naval Research Logistics, vol. 55, no. 3, pp. 200–217.
40. Z. Ge, Q. Hu and Y. Xia. (2014). “Firms’ R&D cooperation behavior in a supply chain,” Production and Operations Management, vol. 23, no. 4, pp. 599–609.
41. Z. Liu, T. D. Anderson and J. M. Cruz. (2012). “Consumer environmental awareness and competition in two-stage supply chains,” European Journal of Operational Research, vol. 218, no. 3, pp. 602–613.
 | This work is licensed under a Creative Commons Attribution 4.0 International License, which permits unrestricted use, distribution, and reproduction in any medium, provided the original work is properly cited. |