DOI:10.32604/cmc.2020.012196
| Computers, Materials & Continua DOI:10.32604/cmc.2020.012196 | |
| Article |
Traffic Queuing Management in the Internet of Things: An Optimized RED Algorithm Based Approach
1Department of Information Technology, Hazara University, Mansehra, 21120, Pakistan
2School of Electrical and Computer Engineering, Seoul National University, Seoul, 08826, Korea
3Department of Computer Science, Institute of Management Sciences, Peshawar, 25000, Pakistan
4Tecnologico de Monterrey, School of Engineering and Sciences, Zapopan, 45201, Mexico
5Department of Computer Science, IQRA National University, Peshawar, 25124, Pakistan
6Department of Electrical Engineering, University of Engineering Technology, Peshawar, 25120, Pakistan
7Electrical Engineering Department, College of Engineering, Prince Sattam Bin Abdulaziz University, Wadi Addwasir, 11991, Saudi Arabia
8Electrical Engineering Department, Faculty of Engineering, Aswan University, Aswan, 81542, Egypt
*Corresponding Author: Abdul Waheed. Email: abdul@netlab.snu.ac.kr
Received: 19 June 2020; Accepted: 18 July 2020
Abstract: Congestion control is one of the main obstacles in cyberspace traffic. Overcrowding in internet traffic may cause several problems; such as high packet hold-up, high packet dropping, and low packet output. In the course of data transmission for various applications in the Internet of things, such problems are usually generated relative to the input. To tackle such problems, this paper presents an analytical model using an optimized Random Early Detection (RED) algorithm-based approach for internet traffic management. The validity of the proposed model is checked through extensive simulation-based experiments. An analysis is observed for different functions on internet traffic. Four performance metrics are taken into consideration, namely, the possibility of packet loss, throughput, mean queue length and mean queue delay. Three sets of experiments are observed with varying simulation results. The experiments are thoroughly analyzed and the best packet dropping operation with minimum packet loss is identified using the proposed model.
Keywords: Random early detection (RED); active queue management (AQM); quality of service (QOS); throughput
Internet of Things (IoT) refers to direct communication between the physical and digital world [1]. IoT is the collection of two words: “Internet” and “Thing”; the internet is the communication among computers based on TCP/IP protocols while the thing is any object that is not accurately recognizable. Thus, IoT semantically means a network of interconnected objects uniquely addressable, based on TCP/IP. IoT can also be defined as that the communication among things and people at any place/time through any service and path [2]. Since the day of its development, it has got massive identification and consideration for potential IoT applications. The IoT was firstly introduced in 1999 for inter-communication of information, however, today it serves as a key facilitator in different fields such as the smart grids, smart cities, precision medicine and intelligent transportation systems, etc. Furthermore, IoT is creating innovative distinct applications, business models and markets with the emergence of its 5G technology, which observes delay performance and high data rate [3]. IoT is one of the limelight innovations which has this capability to provide infinite benefits to our society. IoT technology enhances the quality of critical operations in terms of attaining efficient collaboration. However, one condition that needs to be guar-anteed for such applications, i.e., the response time and QoS requirements [4].
Formerly, the IoT was designed to use different types of sensors to gather data from the environment to store and process it automatically and reduce human efforts [5]. The future of IoT is to grasp the phase at which many of the objects in the world will have the ability to get connected with the internet for communication without any human interference. Currently, IoT is the main powerful force behind modernizing all aspects of the technology, since, it is a very challenging task for the continuous integration of all the technologies. The research in the next-generation IoT covers the current development areas like 5G spectrum potential for intelligent IoT, the coexistence of wireless technologies, Device to Device (D2D) Communications, Vehicular to Everything (V2X), caching techniques in cellular networks, and congestion management in the networks. The development of IoT technologies flourishing the remote accessibility and connectivity, availability at the lowest prices and the adaptation of standards are very necessary for IoT for the communication between these heterogeneous networks [6]. To evaluate an analytical model, the best dropping operation should generate the following results using the performance metrics as given below:
- Achievement of lowest packet dropping possibility: It can be achieved when the optimum function is increased by the threshold value. It is expected to generate minimum packets drop possibility in comparison to other functions.
- Highest throughput in the network delayed due to achievement of minimum proliferation: The best possible operation should attain a low delay of the network at the highest throughput in comparison to other operations.
- Discover the best possible size of the average queue: The computed mean of the size of the queue should consider being the best perspectives to the highest threshold in comparison to other operations.
Recently, there is a huge demand for application services that operate at immensely high speed on the Internet. Additionally, this high speed is desired to be delivered while accommodating all of the Quality-of-Service (QoS) parameters. The principal significance is to ensure the QoS in certain delay-sensitive applications in the network of smart devices. The memory capacity of the existing switches and routers is limited. Therefore, usually, incoming web traffic goes beyond the extrovert buffer size. When the buffer is overflown congestion takes place that leads to network collapse and loss of packets. Congestion also causes packet delays during the transmission. Hence, insufficient information is retrieved and it drastically degrades the standard of internet services. Therefore, an efficient traffic queue management model is required to overcome the net-work congestion.
This research article presents an optimized analytical model for traffic queue management in a network. The main objective is to obtain a mathematical solution that is optimum and results in enhanced performance metrics. This objective is fulfilled by taking into consideration and observing two tasks. (1) Decreasing the mean queuing delay and increasing the throughput after its execution in the proposed analytical model. Similarly, its evaluation and comparison to other operations in Sharma et al. [7]. (2) The proposed model is inferred from the earlier analytical model. Therefore, in performance modeling, the derivation of the finest operation will serve as a new entry. The rest of the paper is organized as follows: Section 2 provides the existing related studies and algorithms for the congestion control in internet traffic. The analytical model proposed by Sharma et al. [7] is also presented which is to be used as a reference model for the proposed study. In Section 3 the proposed analytical model is discussed in detail. The performance metrics derivation is also reported in detail using different equations. Next, in Section 4 the experimental simulations and results for the proposed model are explored in detail. The performance of the proposed model is reviewed and is supported by several simulation results produced using MATLAB. Finally, Section 5 contains the concluding remarks.
This section provides a detailed review of the existing algorithms and techniques such as the Tail Drop (TD) and RED methods that are used for internet traffic congestion control. Similarly, a detailed overview is provided for the analytical model presented in Sharma et al. [7]. Illustration for the analytical model is given for the distinct-time limited queue using the L1 threshold in the STD (State Transition Diagram).
Over the year’s researchers have proposed several techniques to manage the congestion in the internet traffic. One of the classic buffer management approaches is known as TD technique. The TD approach was developed to overcome the gridlock and was applied on routers [8–9]. The TD approach is unable to detect congestion until the queue is full. The highest congestion sign is introduced to inform the source when the queue becomes full; all the remaining packets that arrive are subsequently dropped. RED was initiated to overcome the pitfalls of TD technique, [9–11,12–14]. RED is one of the Active Queue Management (AQM) plans approach [15]. The Internet Engineering Task Force (IETF) has approved it to be used for overcrowding control in internet traffic. It was recommended to be a superior approach in comparison to the TD system and is executed extensively in router these days [16].
RED method recognizes the congestion in advance and gives a response to the transmitter by either dropping or marking packets even if the space of buffer is ready for use [9,13]. Likewise, RED doorways for the overcrowding control approach in packet-switched Networks are suggested in Betzler et al. [10]. The doorways identify the congestion about to happen by calculating the mean size of the queue, calculated by utilizing a low-pass filter. The filter allows signals having a frequency below a chosen cutoff-frequency along with Exponential Weighted Moving Average (EWMA) [15]. Two different RED algorithms for gateway were utilized in their scheme. The primary algorithm was used to calculate the mean size of the queue to find out the robustness level permit-ted in the doorway line. The secondary algorithm was used to compute the packet-dropping/marking possibility to find how mostly the gateway drops/marks packets and provides the congestion level. The algorithms of two RED gateways that are mentioned above are efficiently implemented as a grid-lock control system to acquire aims like gridlock avoidance, appropriate time scales, fairness and parameter sensitivity. Similarly, in Sharma et al. [7] the performance was re-implemented using queuing threshold congestion control. These models were based on the RED method, which is approved by Internet society [16]. In each of the two executed models, the RED method against thresholds compared the performance metrics parameters. In Priscilla et al. [17] for congestion control, a new AQM algorithm is proposed which is dependent on RED. By modifying the RED, the AQM algorithm among the two thresholds was executed and issuing a bendable way of adjusting the highest possibility of packets dropping [15], upgrading throughput and delay contrast to RED. Similarly, in Huang et al. [18], the authors presented a Random Early Drop algorithm, IRED, based on the queuing theory and hierarchical system framework. The IRED employs the immediate queue length to compute the drop rate of the systems. The performance metrics of IRED are Average delay, average queue length and total loss of probability. The only drawback of IRED is that it’s incapable to contemplate the packets coming from multiple sources. Likewise, the authors in Suwannapong et al. [19] proposed a congestion control mechanism that is based on the back off algorithms and buffer management to decrease the transmitted packets’ congestion. The mechanism is named as Congestion Control Random Early Detection. In the case of high traffic, it predicts and detects congestion before the packet loss. The efficiency of the algorithm is checked by the authors using the Cooja simulator using two scenarios i.e., the burst traffic and continuous traffic scenarios. The CoCo-RED algorithm is useful since it reduces packet loss, however, problems arise in acknowledgment time of network communication.
To control the network congestion, several researchers have also focused on using other algorithms such as the Decentralized Traffic Aware Scheduling (DeTAS) algorithm, Constrained Application Protocol (CoAP) and Technique for Order Preference by Similarity to Ideal Solution (TOPSIS) methods. In Accettura et al. [20] the authors have worked on the DeTAS, which is installed in multi-hop lossy and low-power networks. In DeTAS, the Internet Engineering Task Force’s Routing Protocol for Low-Power and Lossy Networks (RPL) is used for the Internet of things. In a decentralized manner, the master node technique is used to compute the optimum multi-hop schedule for the whole network; this helps in controlling the queue congestion. This logic reduces the over-heads using a very low amount of signaling messages. The authors in Bhalerao et al. [21] proposed a system in which the traditional IETF congestion control mechanisms are not suitable for low data-volume application protocols like CoAP. They suggested maintaining an assessment of the Round-Trip Time (RTT) for any destination with which it’s interconnected. Else to assume a conservative fixed value of 3 seconds when no RTT estimate can be achieved (e.g., unidirectional communication), controlling the transmission behavior by not sending more than one User Datagram Protocol (UDP) datagram per RTT on average to a destination. Also perceiving packet loss and exponentially backing off the retransmission timer when a loss event occurs. In another research [22], it defines the CoAP as a basic method for congestion control with exponential back off. This basic congestion control mechanism does not consider the actual estimate of RTT values acquired from previous transactions. Dashkova et al. [23] argue that more advanced queue management control mechanisms are required to limit the energy resources of other nodes (that may need to re-transmit multiple times because of congestion), damage on the network and obtain high throughput consecutively. On the contrary, in Bhandari et al. [24] the authors worked on the congestion-aware routing mechanism that properly senses the congestion based on the present and past traffic trends. In this work, the congestion is improved by using the resource control method. For solving the parent selection problem, the author presented the TOPSIS method framework as the multi-criteria decision-making problem. The congestion detection mechanism ensures the affected nodes to avoid the temporary congestion position. The only drawback is that CoAR improves the PRR, packet loss ratio, end-to-end delay, energy consumption and throughput. The authors in Islam et al. [25] stated the design and implementation details of the CoAP handler for the POINT architecture. It allows CoAP and CoAP extensions to IoT devices through the ICN operator network. The authors also exhibit how the CoAP traffic over an Information-Centric Networking (ICN) network can release the full probable of CoAP, shifting both complexity and overhead from the endpoints to the ICN network. Therefore, the resource-constrained IoT device does not need to distribute more resources for an IP multicast and DNS client implementation. However, this approach does not reduce the communication overhead immensely. The authors in Yin et al. [26] explored developing an Aggregation Tree (AT) that achieved fewer communication costs for complex queries. First, the data pruning power and the aggregation cost were formalized to maximize the aggregation gain. Next, the set of aggregation operations were connected with the maximum aggregation gain to construct the AT. In Huang et al. [27], the authors explored and proposed software-defined networking, Software-defined Energy Harvesting Internet of Things (SEANET). Concerning the centralized flow control, the data plane, energy plane and control plane were decoupled. The Nash bargaining game was investigated to resolve the benefit allocation problem for feasible energy trading in the SEANET. The proposed method reduced packet loss and optimized energy. The experimental results report improvements in the data traffic. Likewise, a novel analytical model based on the queueing theory was proposed for performance evaluation of the OpenFlow network in Xiong et al. [28]. The proposed controller model was compared and contrasted with the Clench model. Through experiments, it was observed that the proposed model provided improved approximation for the performance of the SDN controller.
2.2 Overview of Existing Analytical Model
To evaluate the performance of the proposed model, it is necessary to compare it to an existing model. The model presented in Sharma et al. [7] was a distinct-time queuing technique. It is derived using presumption from the Markov chain state transition procedure; quitting takes place on all occasions before entrance in whichever unit time frame (See Fig. 1).
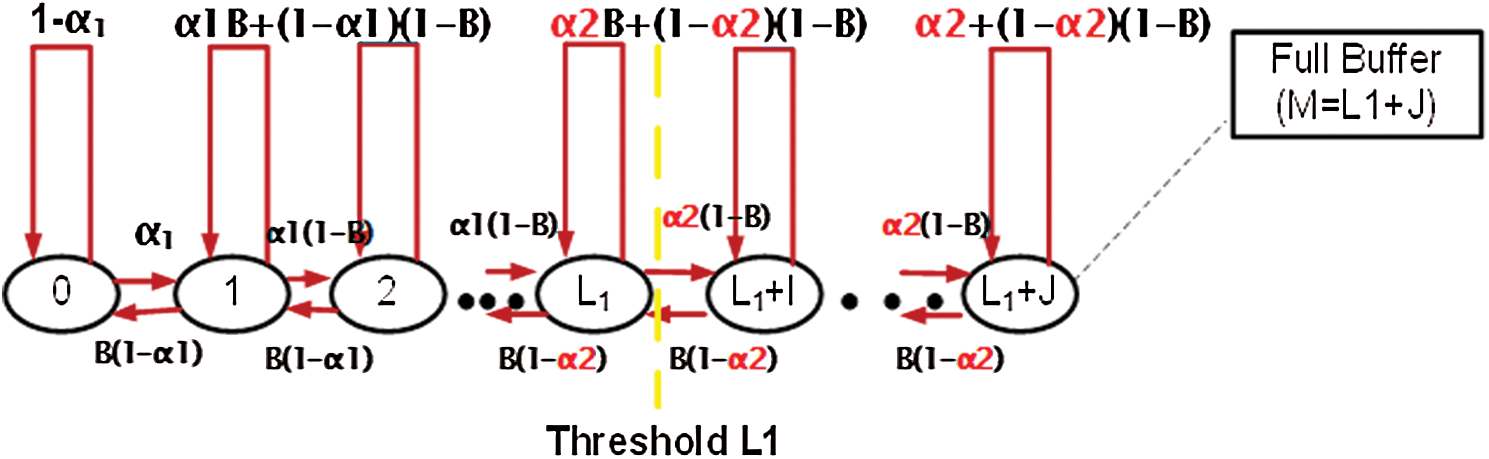
Figure 1: Distinct-Time limited queue with L1 threshold state transition diagram
Every entrance accompanies an individualistic Bernoulli procedure to a limited buffer capacity ( ). The system had alone server, furthermore, the queuing rule was First-come First-serve (FCFS). Moreover,
  is the single thresh-old value in the model. Before and after the threshold, the arrivals of the packets are
  and
and  respectively. The packet exit is
  . When packets number thrust out to the threshold value
  , so at the entrance rate of
  to
to  there is a step cut-back. Consequently, it means that the sender is continuously sending the packets at
  rate but the probability of dropped packets is at the rate of
  [7]. The probabilities of zero packet departure are represented by (
 ) and zero packet arrivals are represented by (
 ). Similarly, it is also shown that no packets arrival at threshold value equal to or greater than
  is represented by (
 ).
).
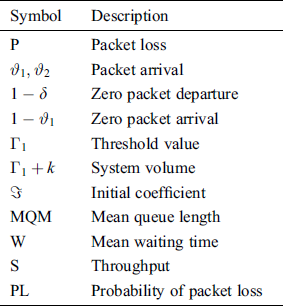
The analytical model proposed by Sharma et al. [7] is taken as a reference model used for the proposed analytical model. This section discusses in detail the proposed analytical model and how it is different from the existing models. The overall working of the model has been explained. The process of derivation of different performance metrics has also been provided. Tab. 1 describes various symbols used in the proposed model.
Table 1: Parameters with description
As already stated the model proposed in this research paper is based on the model presented in Sharma et al. [7], after initiating divergent mathematical operations for recording loss of packet at the threshold value equal to or extensive than  in the STD. In the proposed model, before and after the threshold value
  the possibility of packets arrival is shown by
  and
and  respectively. Whereas, is used for the probability of packet exit. With one server, the major volume of the system is shown by
  . The probabilities of zero packet departure are represented by (
 ) and zero packet arrivals are represented by (
 ). In Fig. 2 it is shown that the no packets arrival at the threshold value equal to or greater than
  is represented by
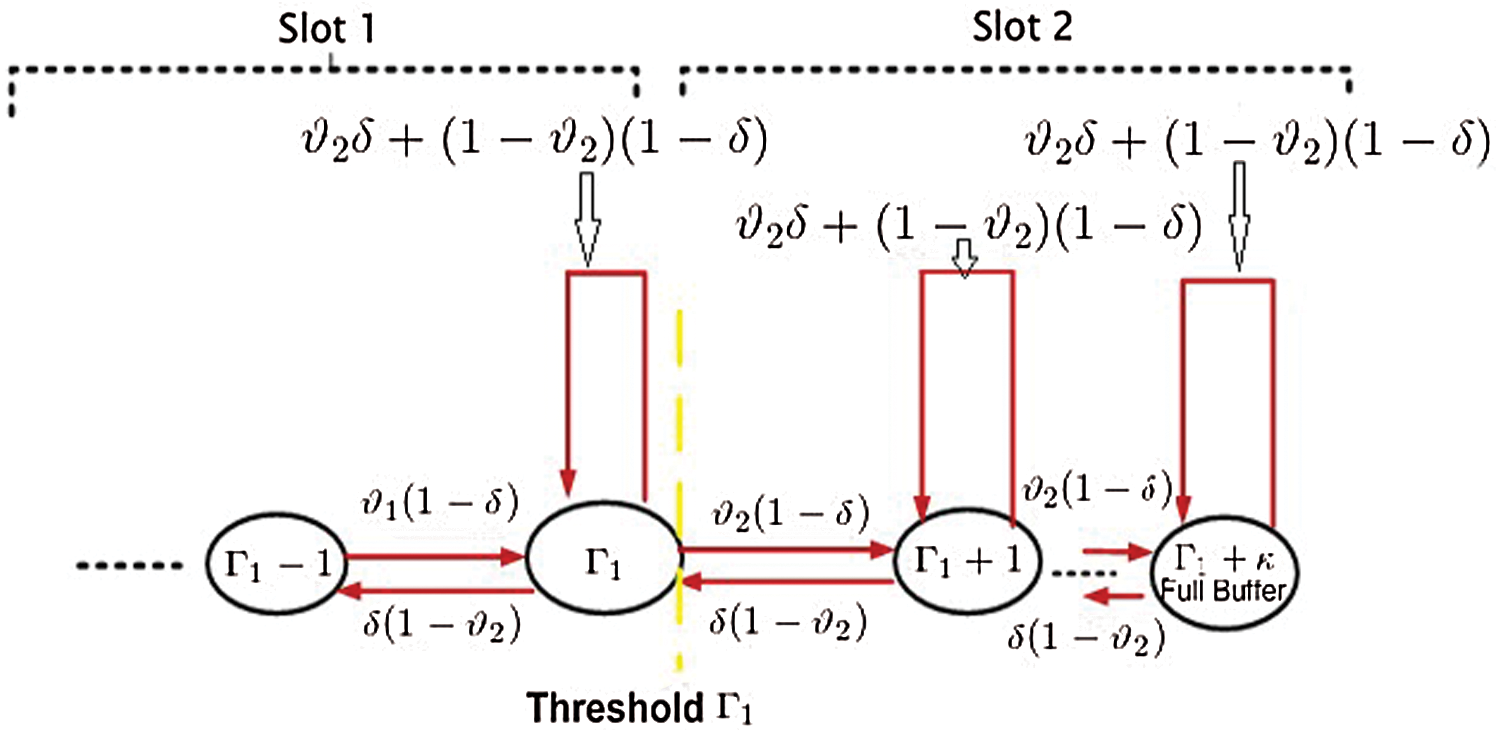
Figure 2: One analytical model of threshold
Several of the packets are dropped, the probability is taken such that the threshold value equal to or greater than  , while the ability of the buffer-level to hold the packets. Mathematical function capture this dropped packet and it is denoted by
  . In the new analytical model, the rate at which packets arrive is
  , and is represented by a term which is equal to
 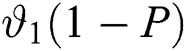 . This implicates that in the arrival speed from
  to
to  there is a steep reduction. With probability, the dropped packets and packets loss is confined with a term which is shown in Fig. 3.
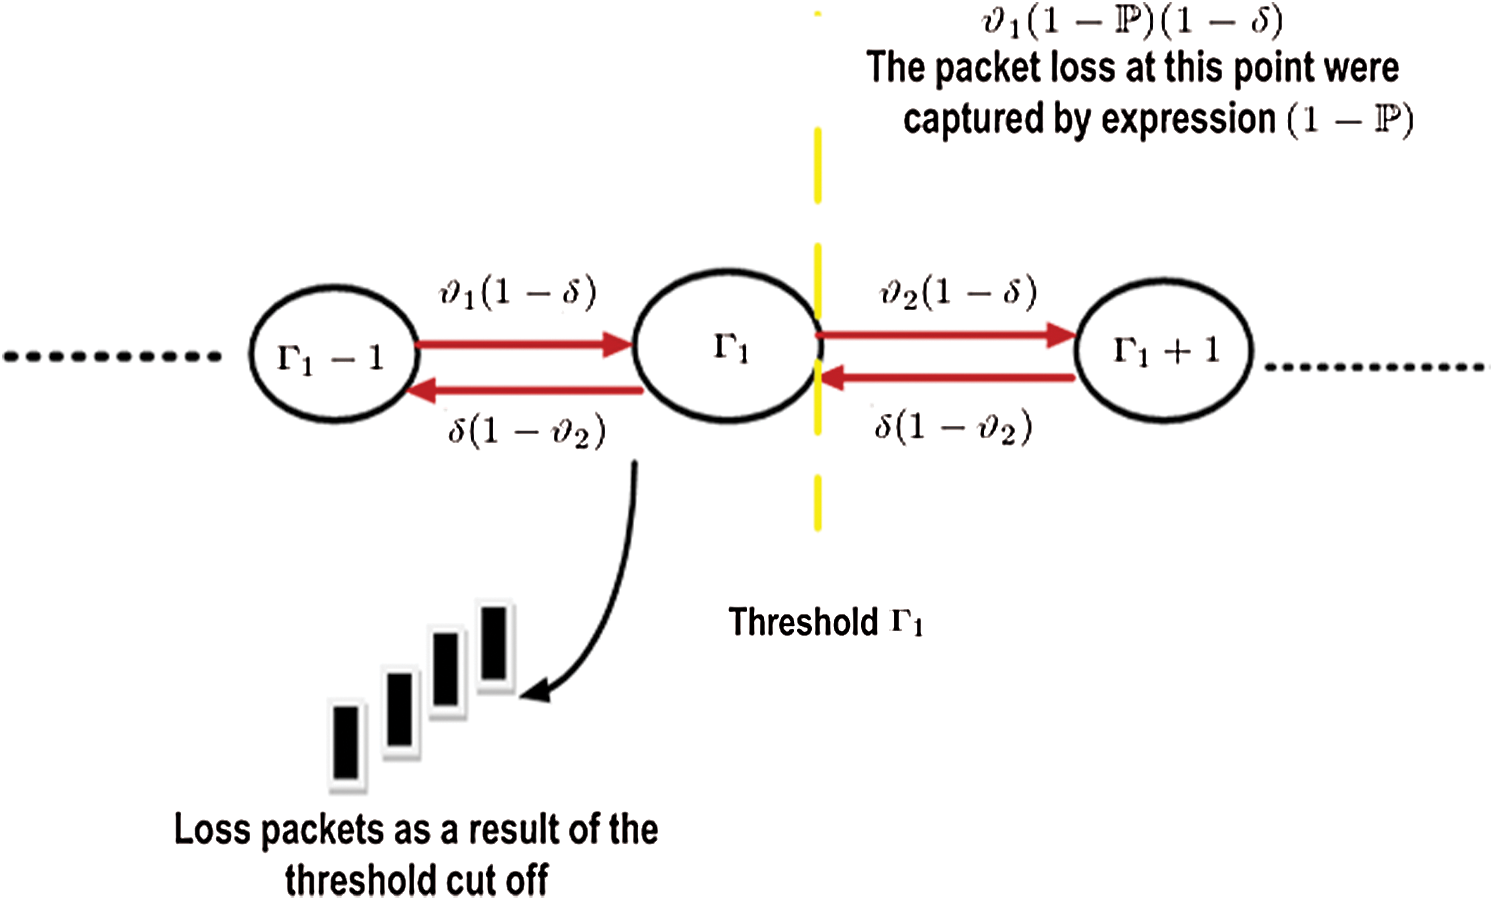
Figure 3: Loss happening in the single-threshold analytical model
3.2 Performance Metrics: Derivation
Suppose that the proposed model utilized a discrete-time queuing system, dependent on a specific unit of time to obtain performance metrics equations, called a slot. The finite buffer space ( ) is the capacity of the model, which contains packets in the once-over. Also, the entrance process which (an), suppose the model is identically and autonomously disseminated Bernoulli process which signify a packet entrance at slot n. Then the queuing order is supposed to be FCFS [7].
1)The following sequence of steps is used to find the STD measuring expression using virtual mathematics to obtain the performance metrics and balanced equation from the new model. The symmetry probability equations given below are obtained under the supposition  from the new model STD:


Generally, the equations can be represented as,

For 


In the general case, the following equations are obtained,

For 

For 
Eq. (8): Equilibrium Equation
2)For each value of =  , solving the above equilibrium probability equations, For
  with respect to
  using essential mathematical values for
  ,
,  ,
,  ,…,
,…, are obtained.
3Using the normalized equation  and the results in step (2), we can solve the value for
  as,
as,

Eq. (9): Initial coefficient ( )
)
4)For substituting and finite queue length results obtained in Eq. (2), using the probability-generating function formula, we can compute for the value of P (Z).

Eq. (10): Generating Function
5)To compute the “Mean Queue Length” (MQL) an expression is created from the first-order derivative which is obtained in step (4) evaluated at Z = 1 as shown below:

Eq. (11): Mean Queue Length ( )
)
6)Using a few rules [1] formulas can be created for mean waiting time and Throughput given below,
a)The period where a random customer gets into the system and leaves the system is the waiting time  that contains the time spent in service.

Eq. (12): Mean Waiting Time
b)Throughput (S) is the number of customers passing through the system per unit.

Eq. (13): Throughput
7. Some of the random customers find no waiting room to hold them as they reached the destination.

Eq. (14): Probability of Packet loss
where 
 .
.
The probability of Packet Loss enlarged from zero to  , where
  is the dropping to confine the Packet Loss.
4 Experimental Simulations, Results and Evaluation
Experimental simulations are carried out to analyze and observe the performance metrics expression resulting in the four typical packets dropping functions already discussed earlier.
This analysis is observed in MATLAB for numerical and graphical simulations. The input values of the RED parameters,  = 0:27, system capacity, max queue length = 20, packet departure,
  = 0:30, and threshold,
 max queue length] are applied for calculating and measuring the performance metrics for the arrival of the packet. There are three sets of experimental simulations are carried out and the results are represented using graphical line charts:
-Simulation Experiments 1: These simulation experiments are for the Dropping Functions Analysis. In this set of simulation experiments, each of the four performance metrics are analyzed for four different types of dropping functions. To evaluate the proposed model, the dropping functions analysis utilizes the performance metrics of, (1) Probability of Packet Loss (2) Through-put (3) Average Queue Length (4) Average Queue De-lay. Whereas, the four dropping functions observed are termed F1, F2, F3 and F4.
-Simulation Experiments 2: These simulation experiments are for the Power of Function and Exponential Operation Analysis. In this set of simulation experiments, each of the four performance metrics are analyzed for two functions of power and exponential. To evaluate the proposed model, the power of function and exponential analysis utilizes the performance metrics of, (1) Probability of Packet Loss (2) Throughput (3) Average Queue Length and (4) Average Queue Delay. Whereas, the two functions observed are termed F1 and F2. Where F1 represents a power function and F2 represents an exponential function.
-Simulation Experiments 3: These simulation experiments are for the Exponential Function Analysis with Different Parameters. In this set of simulation experiments, each of the four performance metrics is analyzed for four exponential functions with different parameters taken as base. To evaluate the proposed model, the power of function and exponential analysis utilizes the performance metrics of, (1) Probability of Packet Loss (2) Throughput (3) Average Queue Length and (4) Average Queue Delay. Whereas the four exponential functions observed are termed F1, F2, F3 and F4. Where F1 has a parameter value of 0.01, F2 has a parameter value of 0.20, F3 has parameter value of 0.40 and F4 has a parameter value of 0.60.
4.1 Simulation Experiments 1: Results and Observations
The Figs. 4a, 4b, 4c and 4d show the results for the performance metrics using four different dropping functions. The following observations are extracted from the detailed observations of the simulation experiments:
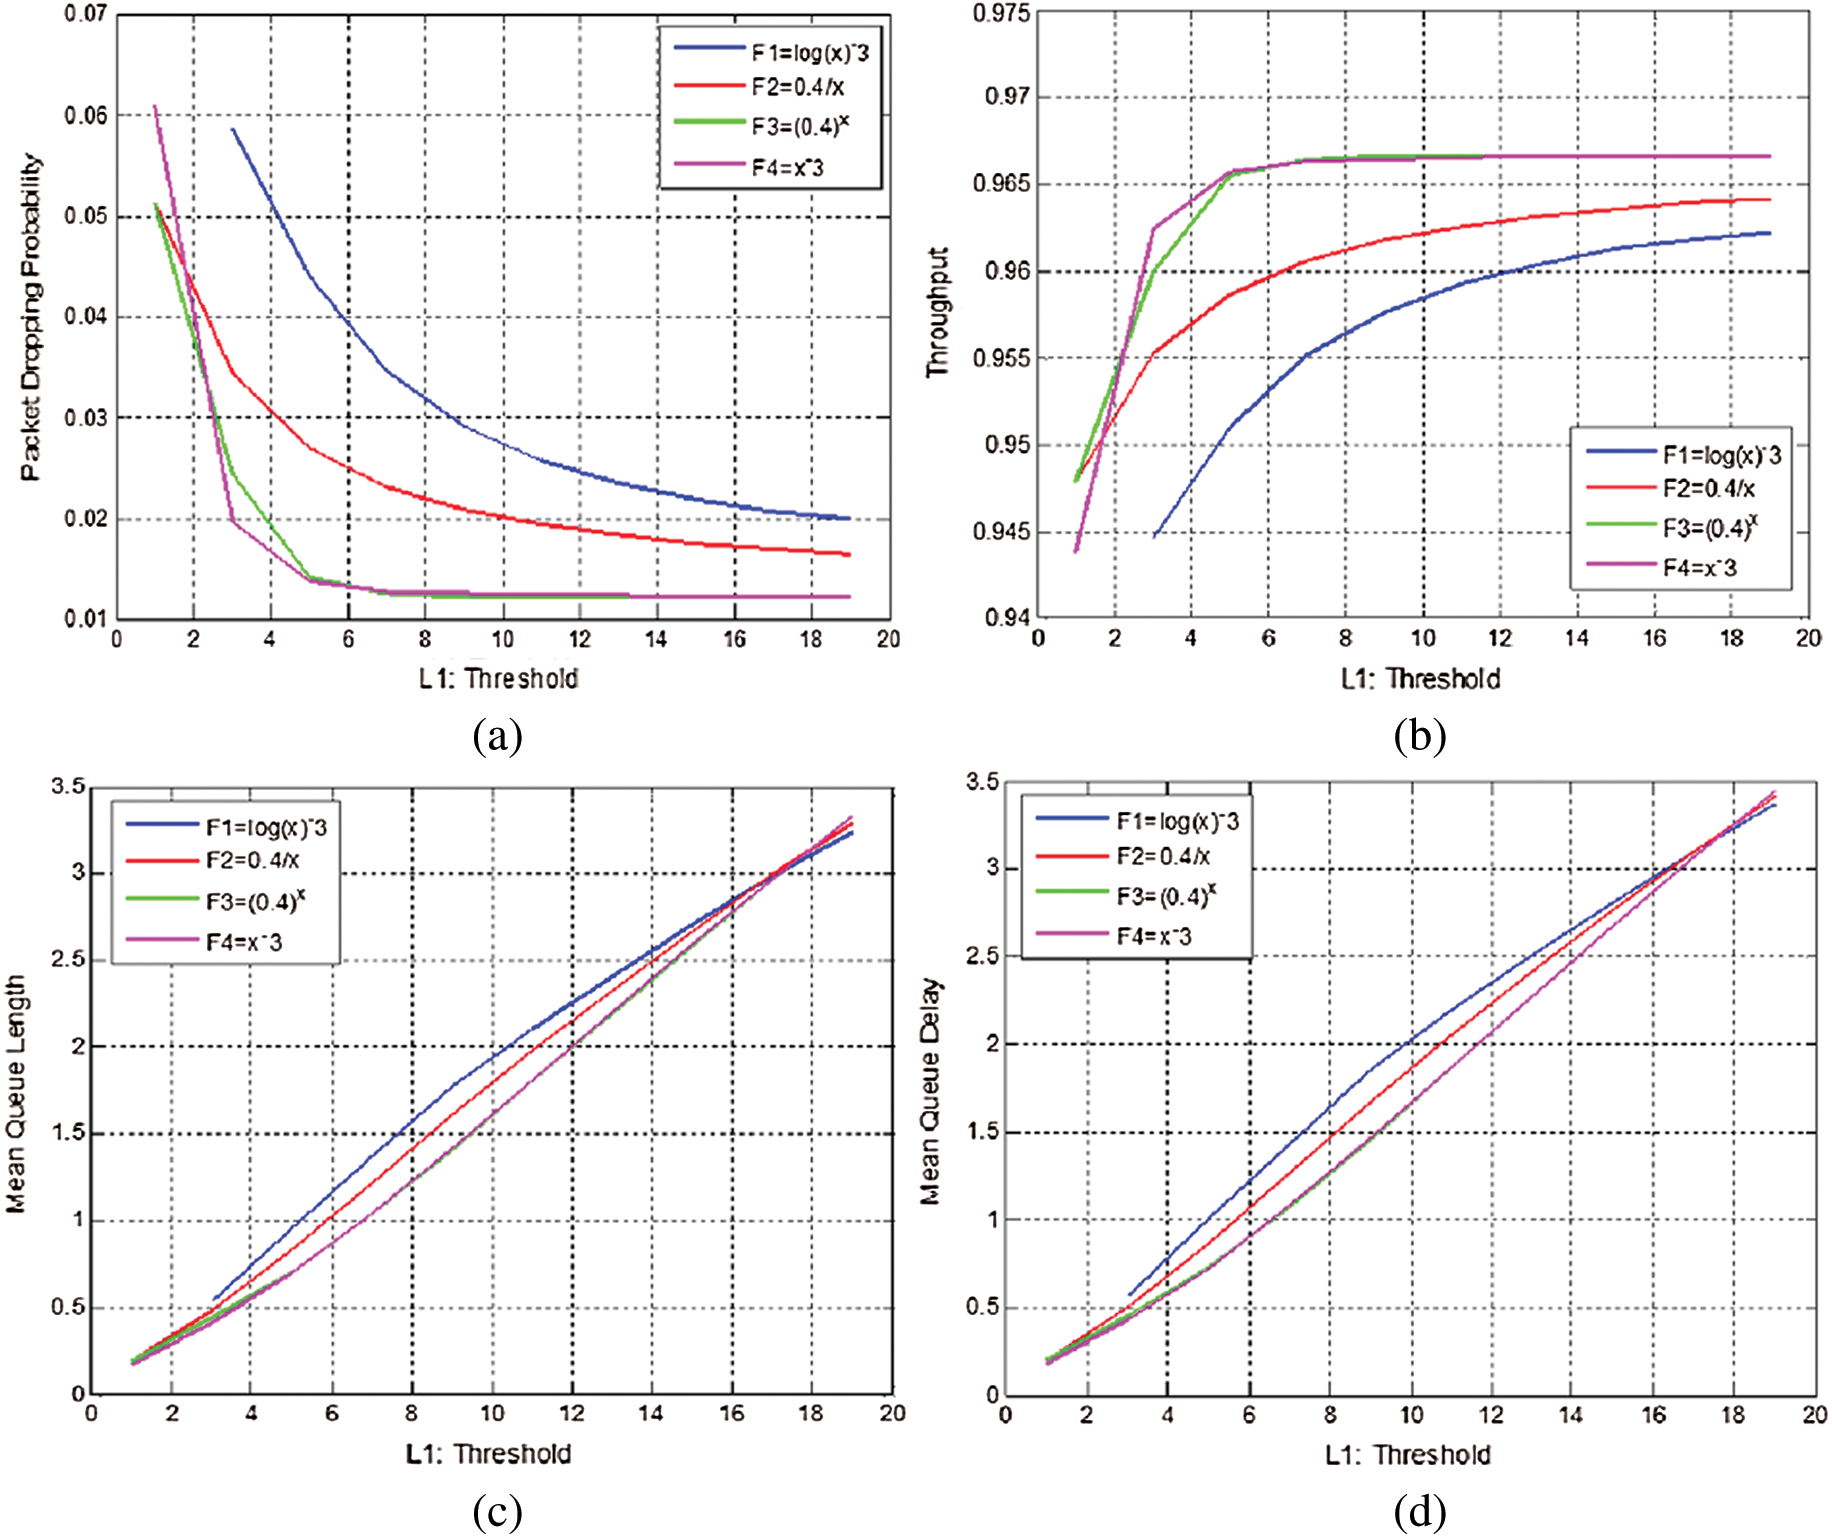
Figure 4: Simulation experiments for dropping functions analysis. (a) Probability of packet loss vs. threshold. (b) throughput vs. threshold. (c) Average queue length vs. threshold. (d) Average queue delay vs. threshold
-In Fig. 4a it can be observed that when the threshold value 1 increases, the packet loss for each of the function decreases. Low packet loss may be obtained using a high value of threshold 1; the aforementioned are reliable to the system that is normal.
-In Fig. 4b it is observed, the increase in the threshold value of 1 the throughput value is increasing for each of the functions (F1, F2, F3 and F4).
-In Figs. 4c and 4d, it is observed, increasing the threshold values increases the throughput, mean delay, and mean queue length for each function. Whereas, values of performance metrics are increasing sensibly and the router’s effort to avoid congestion is decreasing. The graphical and numerical results show that among the four different functions, the exponential function ax and the power of a function  reveal higher throughput, lower delay, and lower probability of packet loss in comparison to the other two.
4.2 Simulation Experiments 2: Results and Observations
To detect the best possible operation from the power of a function  , and exponential operation
  , experimental analysis is carried out. The figures, Figs. 5a, 5b, 5c, and 5d shows the results for the performance metrics using two functions. The following observations are extracted from the detailed observations of the simulation experiments:
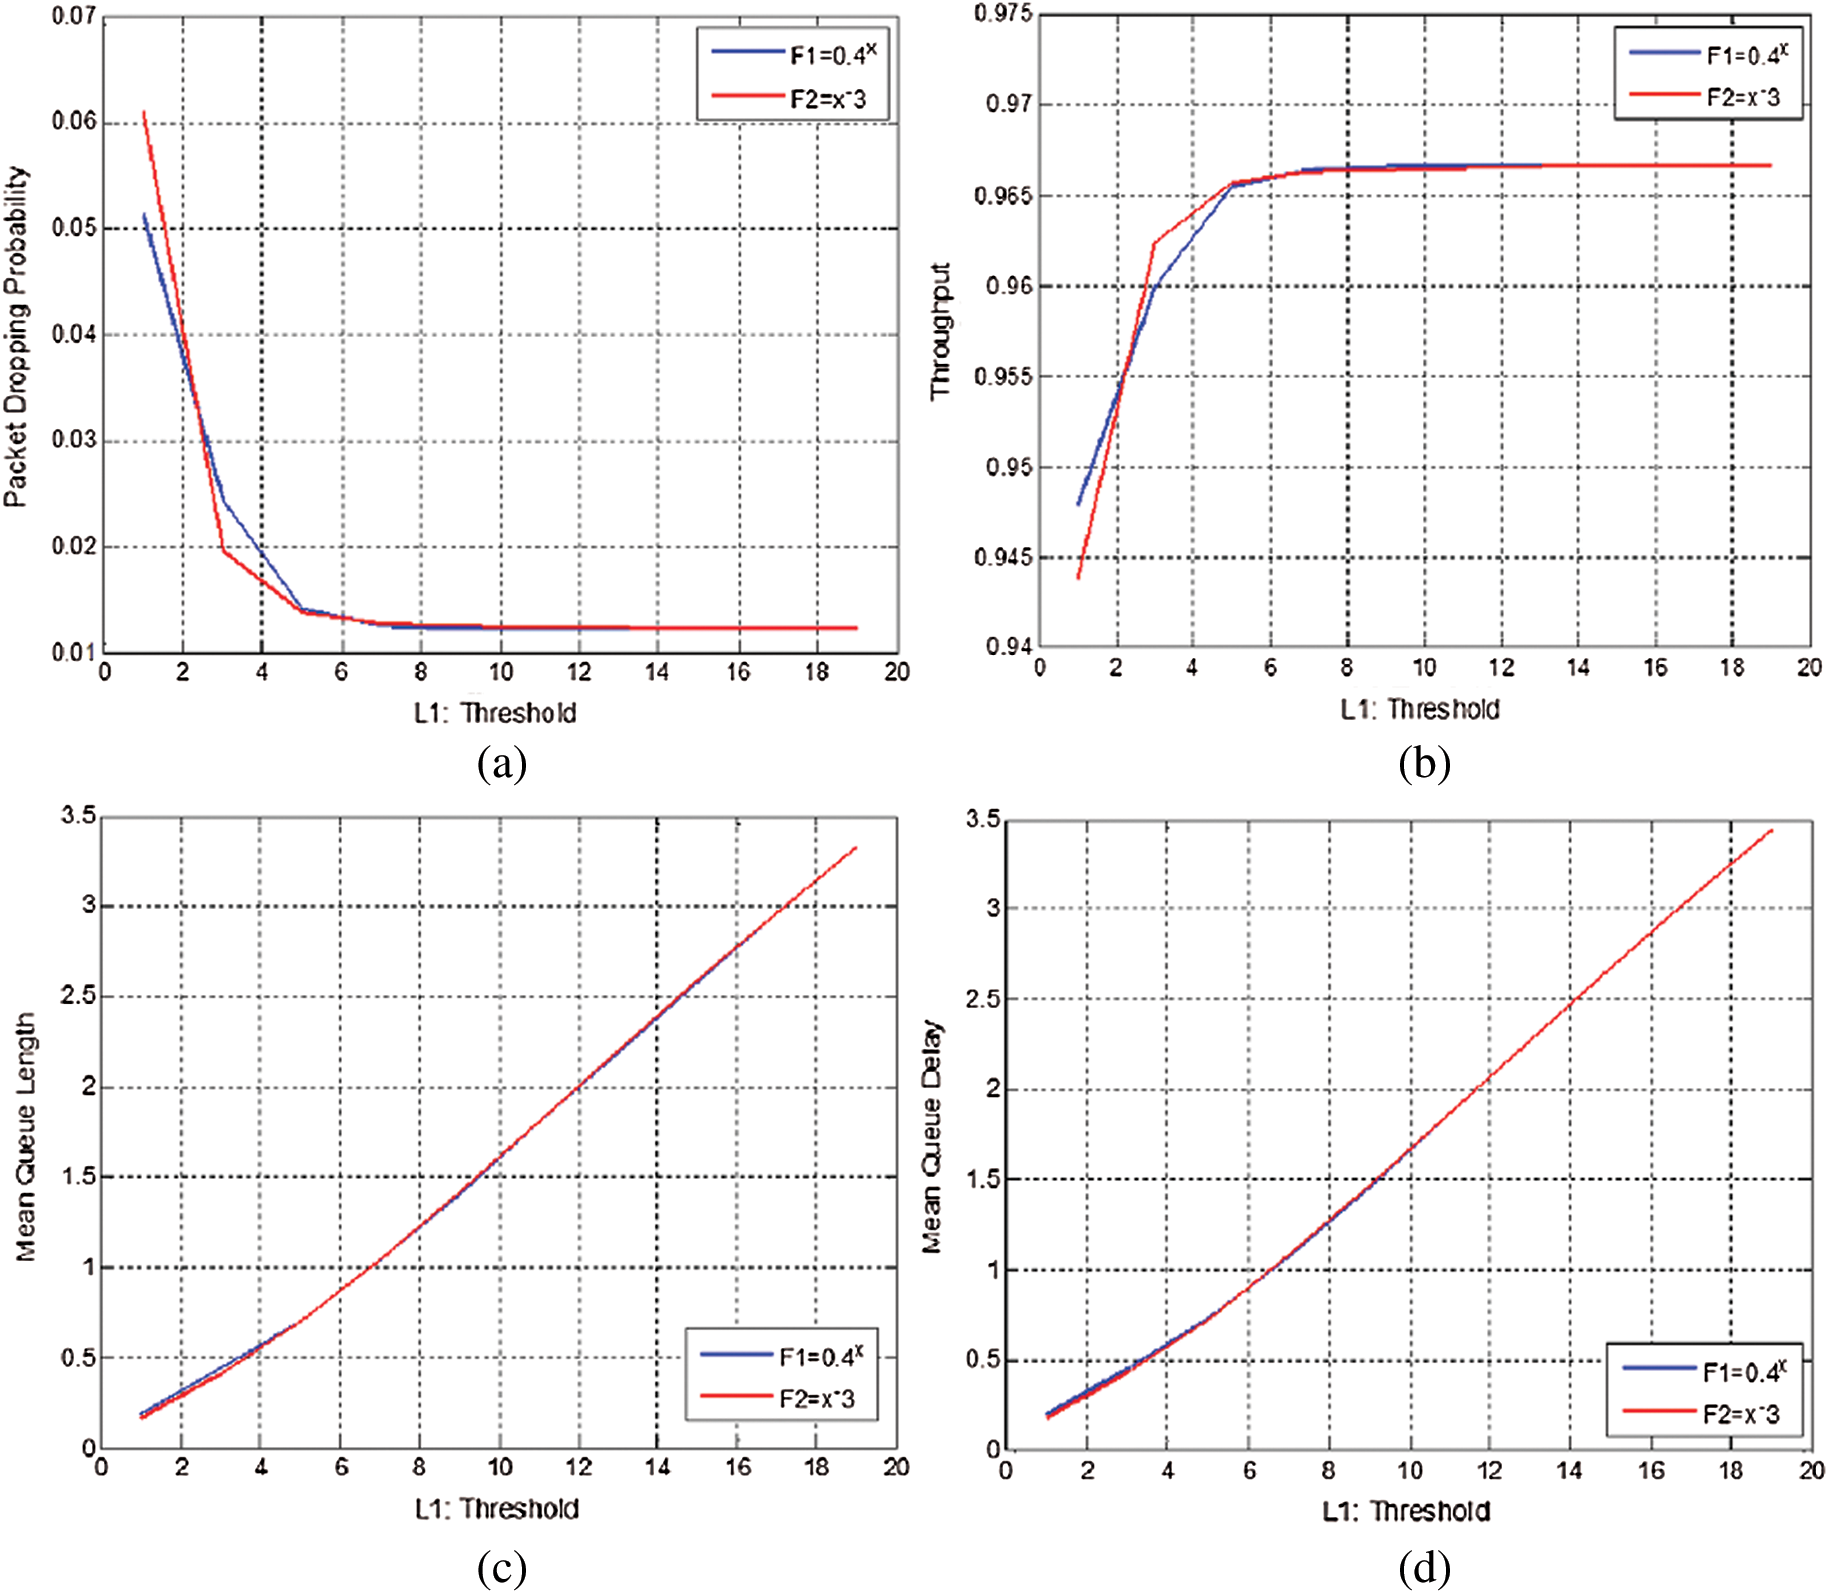
Figure 5: Simulation experiments for power of a function  and exponential operation of
  . (a) Possibility of packet loss vs. threshold. (b) throughput vs. threshold. (c) Average queue length vs. threshold. (d) Average queue delay vs. threshold
-In Fig. 5a it can be observed that when the threshold value is increased, the possibility of packet loss decreases as expected.
-In Figs. 5b, 5c and 5d it can be observed that the average delay, the throughput and average queue length for the two operations are increasing when the threshold value is increased. This is compatible with a general system.
-The graphical and numerical outcomes visibly illustrate that out of the two operations, exponential function,  , attained the least possibility of packet loss, maximum throughput, and lowest delay in comparison to the power of a function
  .
.
4.3 Simulation Experiments 3: Results and Observations
Finally, to draw a general conclusion, a tentative analysis is carried out using different parameter values of a, about the exponential function, ax. Figs. 6a, 6b, 6c and 6d show the results for the performance metrics using four functions with different parameters. The following observations are extracted from the detailed observations of the simulation experiments:
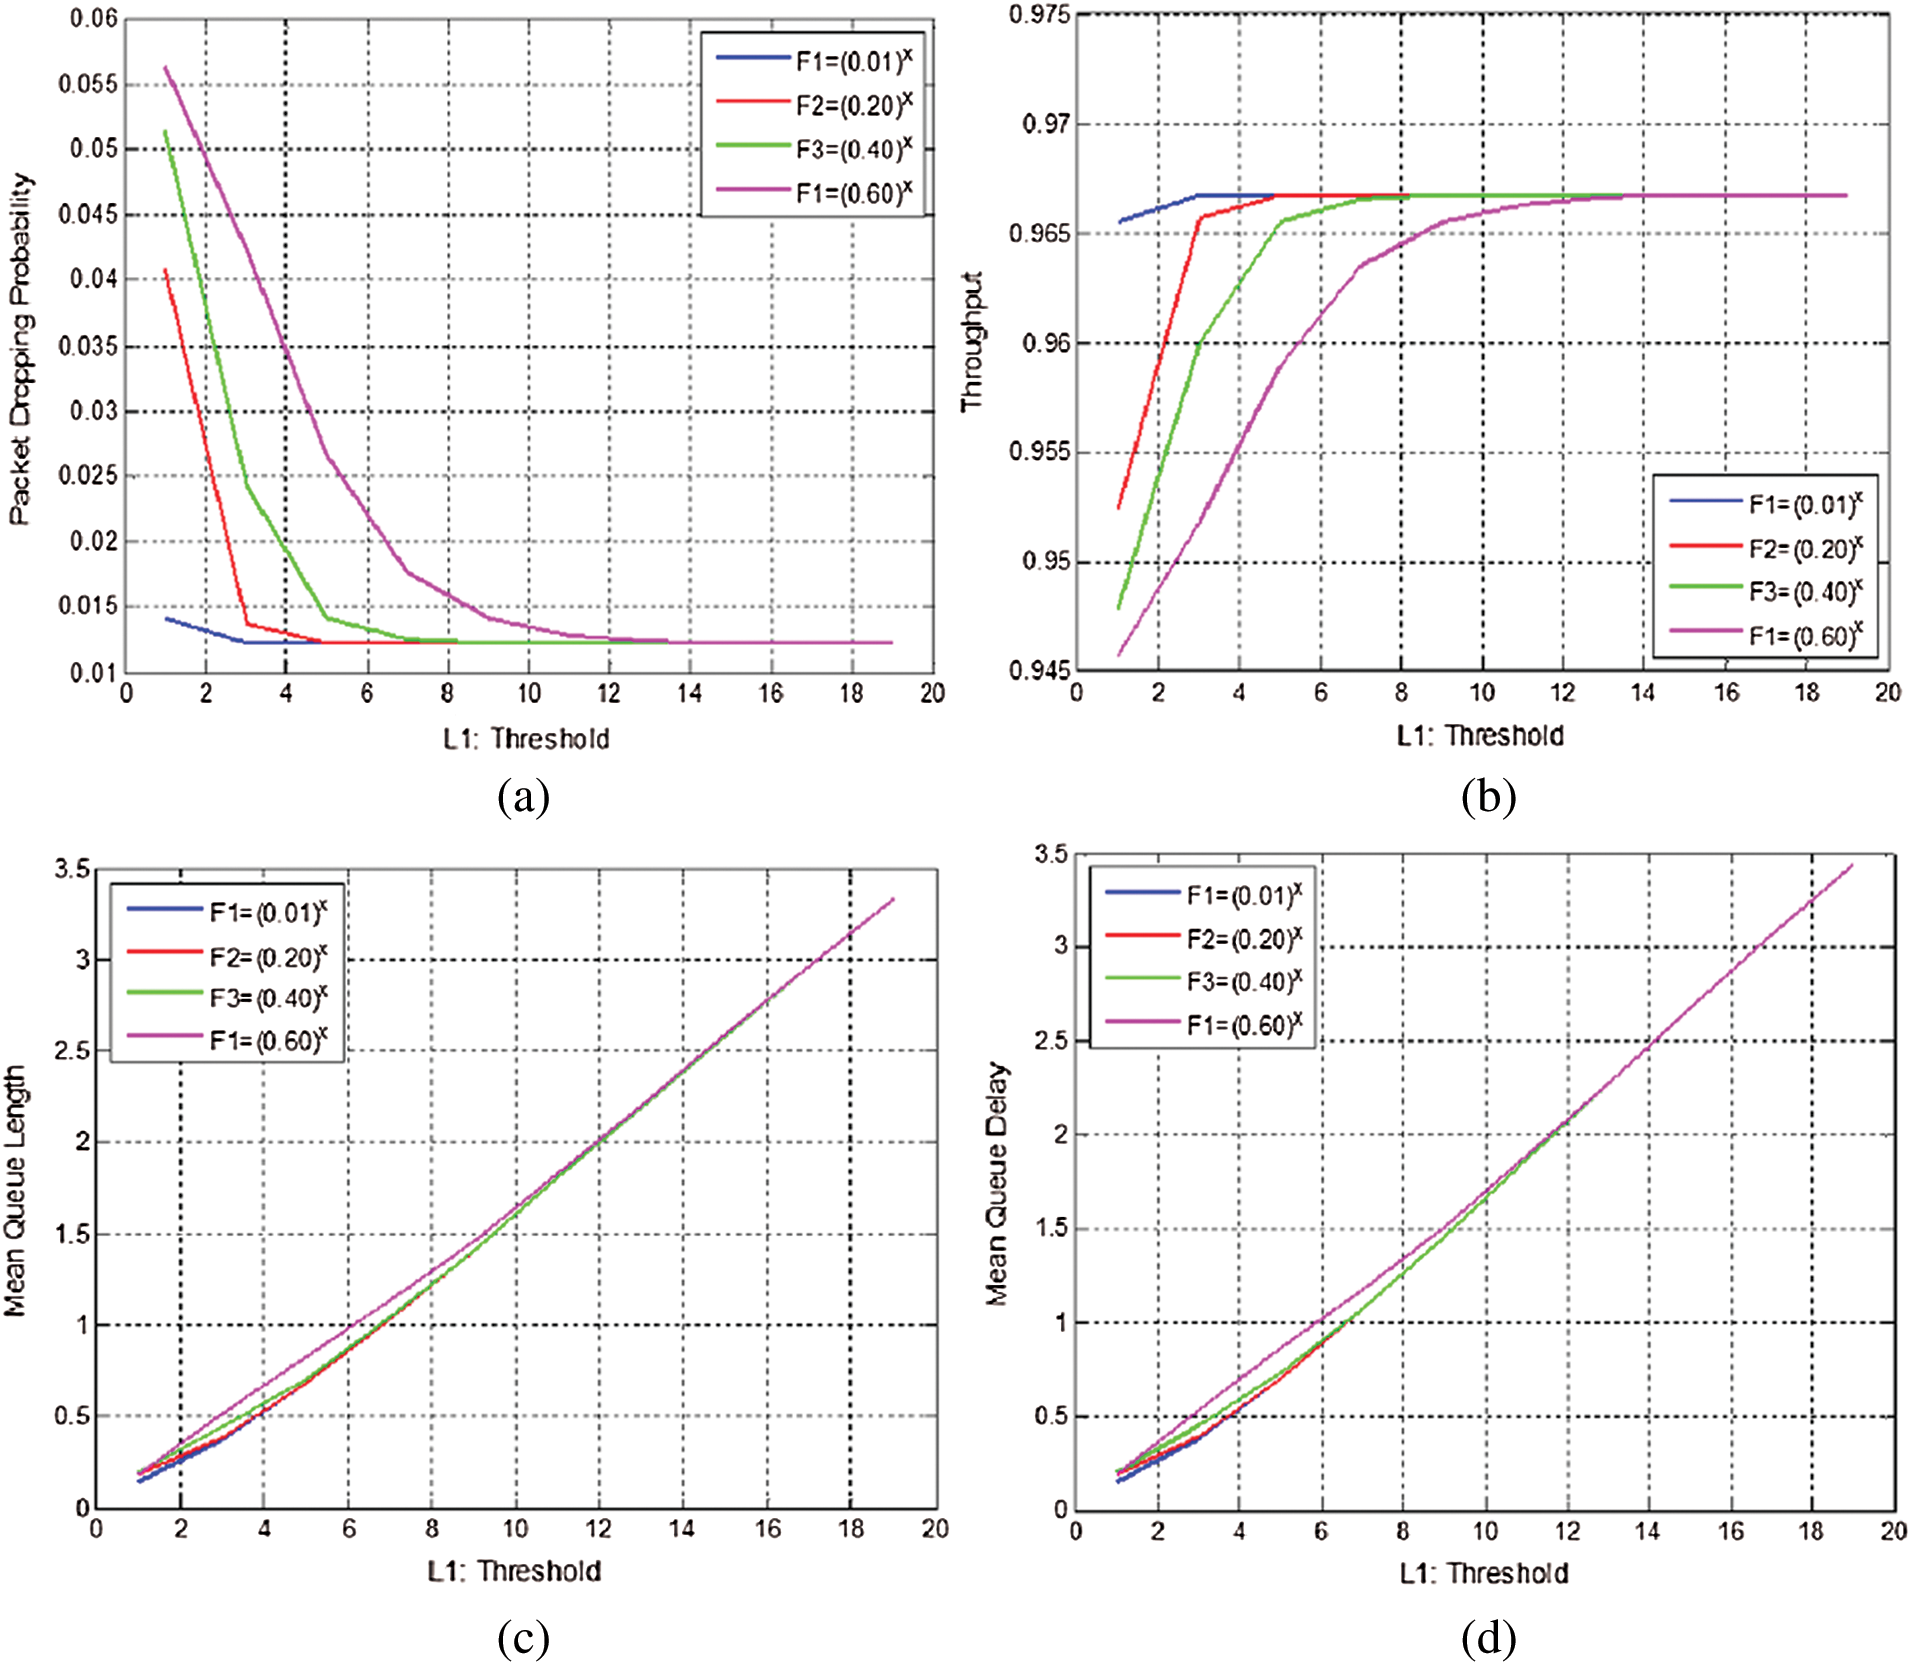
Figure 6: Simulation experiments for exponential function analysis with different parameters. (a) Possibility of loss of packet vs. threshold. (b) throughput vs. threshold. (c) Mean queue length vs. threshold. (d) Mean queue delay vs. threshold
-Figs. 6a, 6b, 6c, and 6d illustrate that when the parameter values reach 0:01 the exponential operation attained minimum probabilities of packets loss, maximum throughput and lowest delay as the threshold values increases.
-These parameter settings may be utilized for various applications of data service. Whereas, for real-time applications that need minimum delay such a setting should be utilized where the parameter should be reaching 1.
-All the results are compatible with a typical system. The exponential operation depends on the input values and setting of the parameter for AQM method. Therefore, this analysis is a handout for the performance modeling.
This paper presents an analytical model to investigate the best possible packet dropping operation that utilizes virtual mathematical approaches. The performance modeling of the proposed model has also been discussed. The proposed modeling technique is derived from Random Early Detection techniques of AQM methods. The discrete-time queuing system, single threshold, departures and independently distributed packets arrivals maintain the process of Markov chain state transition and are based on the Bernoulli process. Performance metrics such as throughput, the average length of the queue, average delay of queuing, the possibility of packet loss and threshold are derived for divergent functions. These metrics are analyzed for the precision of the model by performing a wide variety of simulation experiments. The preset input values for packets arrival and departure, when the variable threshold values are used to compare the parameters at the stable state. Finally, it is concluded by analyzing the results that the exponential operation is the best possible operation which attained the lowest probability of losing packet, maximum throughput and minimum delay in comparison to other operations when the threshold value is increased.
Acknowledgement: The authors would like to thank Dr. M. Amin and Dr. Waqar assistant professors whose constructive comments helped in the improvement of the presentation of this project.
Funding Statement: The author(s) received no specific funding for this study.
Conflicts of Interest: The authors declare that they have no conflicts of interest to report regarding the present study.
References
1P. P. Ray. (2018), “A survey on Internet of Things architectures. ,” Journal of King Saud University-Computer and Information Sciences, vol. 30, no. (3), pp, 291–319, .
2A. Ghasempour. (2019), “Internet of things in smart grid: Architecture, applications, services, key technologies, and challenges. ,” Inventions, vol. 4, no. (1), pp, 22, . [Google Scholar]
3S. Li and D. Qinghe. (2018), “A review of physical layer security techniques for the Internet of Things: Challenges and solutions. ,” Entropy, vol. 20, no. (10), pp, 730, . [Google Scholar]
4R. Sharma, N. Kumar, N. B. Gowda and T. Srinivas. (2018), “Packet scheduling scheme to guarantee QoS in internet of things. ,” Wireless Personal Communications, vol. 100, no. (2), pp, 557–569, . [Google Scholar]
5Y. B. Zikria, S. W. Kim, O. Hahm, M. K. Afzal and M. Y. Aalsalem. (2019), “Internet of Things (IoT) operating systems management: Opportunities, challenges, and solution. ,” Sensors, vol. 19, pp, 1793, . [Google Scholar]
6H. F. Atlam, R. J. Walters and G. B. Wills. (2018), “Fog computing and the internet of things: A review. ,” Big Data and Cognitive Computing, vol. 2, no. (2), pp, 10, . [Google Scholar]
7V. K. Sharma and M. Kumar. (2017), “Adaptive congestion control scheme in mobile ad-hoc networks. ,” Peer-to-Peer Networking and Applications, vol. 10, no. (3), pp, 633–657, . [Google Scholar]
8A. S. Alfa, Queueing Theory for Telecommunications: Discrete Time Modelling of a Single Node System. New York, NY, USA: Springer, 2010. [Google Scholar]
9K. Manikandan and M. A. Saleem Durai. (2014), “Active queue management based congestion control protocol for wireless networks. ,” International Journal of Enterprise Network Management, vol. 6, no. (1), pp, 30–41, . [Google Scholar]
10A. Betzler, C. Gomez, I. Demirkol and J. Paradells. (2016), “Coap congestion control for the Internet of Things. ,” IEEE Communications Magazine, vol. 54, no. (7), pp, 154–160, . [Google Scholar]
11J. Wang and B. Lin. (2013), “Active queue management algorithm based on particle swarm optimization. ,” Journal of Computer Applications, vol. 33, no. (2), pp, 390–392, . [Google Scholar]
12Y. P. Zhang, J. Ma, Y. C. Wang and X. Y. Chen. (2011), “Improved nonlinear random early detection algorithm. ,” Journal of Computer Applications, vol. 4, no. (31), pp, 890–917, . [Google Scholar]
13P. Anelli, R. Diana and E. Lochin. (2014), “Favor queue: A parameterless active queue management to improve TCP traffic performance. ,” Computer Networks, vol. 60, pp, 171–186, . [Google Scholar]
14L. Liu, X. Jin and G. Min. (2011), “Performance analysis of an integrated scheduling scheme in the presence of bursty MMPP traffic. ,” Journal of Systems and Software, vol. 84, no. (1), pp, 37–44, . [Google Scholar]
15J. J. Song and Z. X. Zhang. (2015), “Research on the improvement of RED algorithm in network congestion control. ,” Applied Mechanics and Materials, vol. 713, pp, 2471–2477, . [Google Scholar]
16C. L. Chen. (2012), “Performance evaluation of active queue management using a hybrid approach. ,” Journal of Computers, vol. 7, no. (5), pp, 136–142, . [Google Scholar]
17G. M. Priscilla and C. P. Sumathi. (2012), “An intelligent active queue management technique for congestion control. ,” International Journal of Computer Applications, vol. 41, no. (16), [Google Scholar]
18J. Huang, D. Du, Q. Duan, Y. Sun, Y. Yin et al.. (2014). , “Modeling and analysis on congestion control in the internet of things. ,” in IEEE Int. Conf. on Communications, Sydney, NSW, pp, 434–439, . [Google Scholar]
19C. Suwannapong and C. Khunboa. (2019), “Congestion control in CoAP observe group communication. ,” Sensors, vol. 19, no. (15), pp, 3433, . [Google Scholar]
20N. Accettura, M. R. Palattella, G. Boggia, L. A. Grieco and M. Dohler. (2013), “Decentralized traffic-aware scheduling for multi-hop low power lossy networks in the internet of things. ,” in IEEE 14th Int. Sym. on A World of Wireless, Mobile and Multimedia Networks, Madrid, pp, 1–6, . [Google Scholar]
21R. Bhalerao, S. S. Subramanian and J. Pasquale. (2016), “An analysis and improvement of congestion control in the CoAP Internet-of-Things protocol. ,” in 13th IEEE Ann. Consumer Communications & Networking Conf., Las Vegas, NV, pp, 889–894, . [Google Scholar]
22Z. Shelby, K. Hartke and C. Bormann. (2014), “The constrained application protocol (CoAP). ,” Internet Requests for Comments, RFC Editor, and RFC 7252, . [Online]. Available: http://www.rfc-editor.org/rfc/rfc7252.txt. [Google Scholar]
23E. Dashkova and A. Gurtov. (2012), “Survey on congestion control mechanisms for wireless sensor networks, ” in Internet of Things, Smart Spaces, and Next-Generation Networking. Berlin, Heidelberg: Springer, pp, 75–85, . [Google Scholar]
24K. S. Bhandari, A. S. M. Hosen and G. H. Cho. (2018), “CoAR: Congestion-aware routing protocol for low power and lossy networks for IoT applications. ,” Sensors, vol. 18, no. (11), pp, 3838, . [Google Scholar]
25H. M. A. Islam, D. Lagutin, A. Ylä-Jääski, N. Fotiou and A. Gurtov. (2019), “Transparent coap services to IoT endpoints through ICN operator networks. ,” Sensors, vol. 19, no. (6), pp, 1339, . [Google Scholar]
26B. Yin and X. T. Wei. (2018), “Communication-efficient data aggregation tree construction for complex queries in IoT applications. ,” IEEE Internet of Things Journal, vol. 6, no. (2), pp, 3352–3363, . [Google Scholar]
27X. M. Huang, R. Yu, J. W. Kang, Z. Q. Xia and Y. Zhang. (2018), “Software defined networking for energy harvesting Internet of Things. ,” IEEE Internet of Things Journal, vol. 5, no. (3), pp, 1389–1399, . [Google Scholar]
28B. Xiong, K. Yang, J. Zhao, W. Li and K. Li. (2016), “Performance evaluation of OpenFlow-based software-defined networks based on queueing model. ,” Computer Networks, vol. 102, pp, 172–185, . [Google Scholar]
 | This work is licensed under a Creative Commons Attribution 4.0 International License, which permits unrestricted use, distribution, and reproduction in any medium, provided the original work is properly cited. |