DOI:10.32604/cmc.2020.012045
| Computers, Materials & Continua DOI:10.32604/cmc.2020.012045 | |
| Article |
Prediction of COVID-19 Confirmed Cases Using Gradient Boosting Regression Method
1College of Computer and Information Sciences, King Saud University, Riyadh, 11362, Saudi Arabia
2Computer Science Department, Faculty of Applied Science, Taiz University, Taiz, Yemen
3College of Applied Computer Sciences, King Saud University, Riyadh, 11362, Saudi Arabia
*Corresponding Author: Abdu Gumaei. Email: abdugumaei@gmail.com
Received: 11 June 2020; Accepted: 22 July 2020
Abstract: The fast spread of coronavirus disease (COVID-19) caused by SARS-CoV-2 has become a pandemic and a serious threat to the world. As of May 30, 2020, this disease had infected more than 6 million people globally, with hundreds of thousands of deaths. Therefore, there is an urgent need to predict confirmed cases so as to analyze the impact of COVID-19 and practice readiness in healthcare systems. This study uses gradient boosting regression (GBR) to build a trained model to predict the daily total confirmed cases of COVID-19. The GBR method can minimize the loss function of the training process and create a single strong learner from weak learners. Experiments are conducted on a dataset of daily confirmed COVID-19 cases from January 22, 2020, to May 30, 2020. The results are evaluated on a set of evaluation performance measures using 10-fold cross-validation to demonstrate the effectiveness of the GBR method. The results reveal that the GBR model achieves 0.00686 root mean square error, the lowest among several comparative models.
Keywords: COVID-19; coronavirus disease; SARS-CoV-2; machine learning; gradient boosting regression (GBR) method
At the end of December 2019, patients with clinical symptoms similar to those of the common cold and pneumonia were reported in Wuhan city, China. Chinese scientists detected that the cause of this pneumonia was a novel coronavirus [1]. The most common clinical features of the disease are cough, fever, and difficulty in breathing. More severe symptoms in some cases can include lung damage, severe acute respiratory syndrome (SARS), breathing failure, and kidney failure, possibly causing death [2]. Coronavirus disease 2019 (COVID-19) was named by the World Health Organization (WHO) on February 11, 2020 [3]. The International Committee on Taxonomy of Viruses (ICTV) refers to COVID-19 as severe acute respiratory syndrome coronavirus 2 (SARS-CoV-2) [3].
The coronavirus (CoV) family includes the Middle East respiratory syndrome coronavirus (MERS-CoV) and SARS and can cause symptoms with severity ranging down to those of the common cold [4]. Published studies have shown that MERS-CoV and SARS-CoV infections, respectively, spread from dromedary camels and civet cats to humans. CoVs can be transmitted between humans and several animals, such as cattle, cats, camels, and bats [5]. Animal CoVs, such as MERS-CoV, it is noted that it can hardly to be transmitted to humans and then spread between humans [6]. Compared to SARS-CoV and MERS-CoV, SARS-CoV-2 spreads easily and has a low mortality rate [7].
On May 30, 2020, the WHO reported that COVID-19 had infected more than 6 million people in 213 countries and territories, with 369,126 fatalities since the cases were officially registered in January [6]. COVID-19 has become a serious worldwide problem, especially in the United States, Brazil, Russia, Spain, the United Kingdom, India, and Italy [8]. Since the disease has no specific treatment and it spreads rapidly, it is crucial to prepare healthcare services for future cases [9].
Machine learning and approximation algorithms have been used to solve problems in areas such as healthcare [10], industry [11], cloud computing [12,13], human activity recognition [14], and brain tumor classification [15]. Machine learning models are certainly useful to forecast future cases to take control of this global pandemic [16–18].
Few studies have used statistical models and artificial intelligence (AI) methods to predict coronavirus cases. The autoregressive integrated moving average (ARIMA) was used to forecast the spread of SARS-CoV-2 [18]. An AI framework to predict the clinical severity of coronavirus was proposed in [19]. A simple and powerful method was proposed to predict the continuation of COVID-19 [20]. However, to develop an effective model to predict future confirmed cases of COVID-19 in the world in different time periods is a challenging issue that needs a solution.
We aim to develop an effective model using a gradient boosting regression (GBR) algorithm to predict daily total confirmed cases and enhance the readiness of healthcare systems.
The rest of the paper is organized as follows. Section 2 explains the materials and methods, including a COVID-19 data sample, the GBR method, and performance evaluation measures. Section 3 describes our experiments and their results. Section 4 provides our conclusions and suggestions for future work.
We describe the dataset used to evaluate the work, our computational method, and performance evaluation measures.
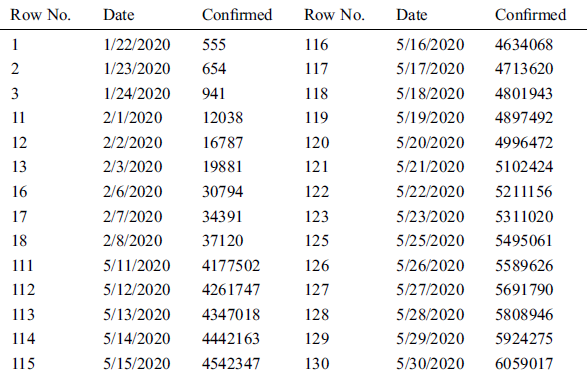
The data sample used in this study includes the total daily confirmed cases of COVID-19, collected from the official website (https://gisanddata.maps.arcgis.com/apps/opsdashboard/index.html) of Johns Hopkins University, in the period from January 22, 2020, to May 30, 2020, all over the world. It contains 130 time-series instances from which to build our model, which we compare to other predictive models. Tab. 1 shows some example instances from the collected COVID-19 data sample Fig. 1.
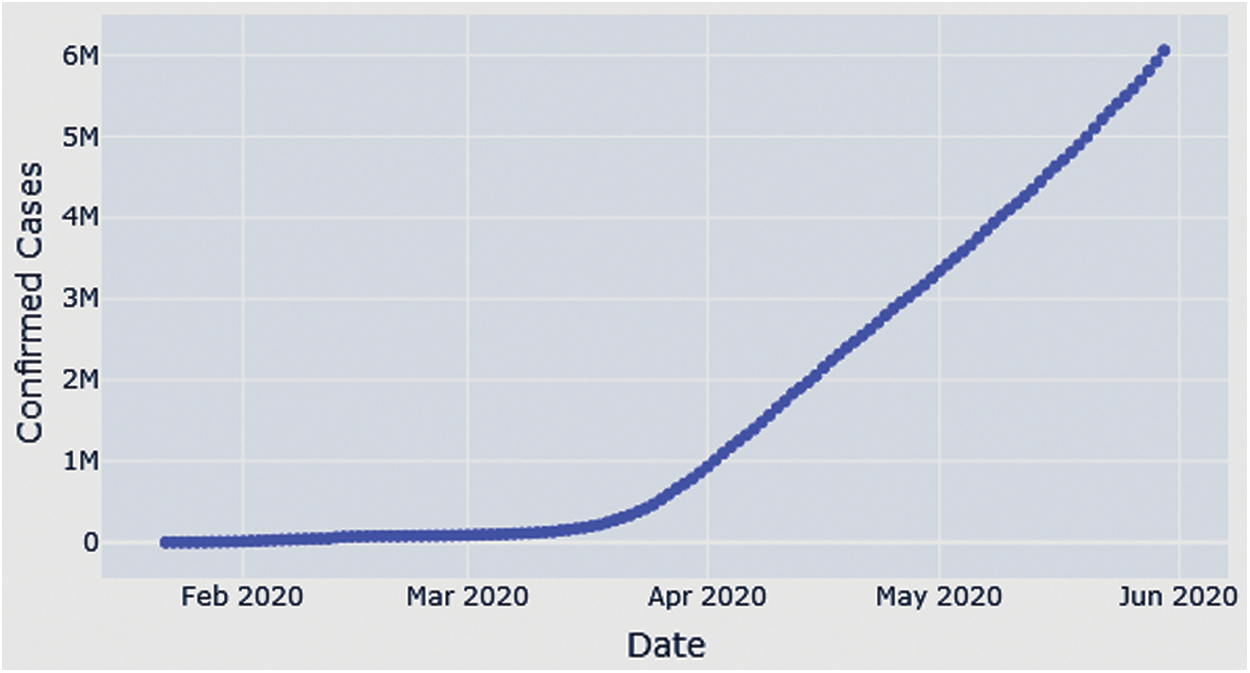
Figure 1: Growth of total confirmed COVID-19 cases from January 22, 2020, to May 30, 2020
Table 1: Some instances of the collected COVID-19 data sample
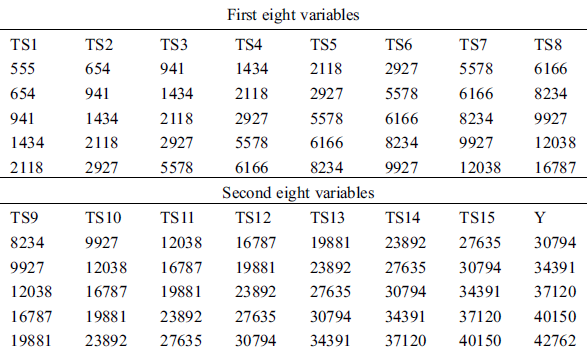
The time-series instances of the dataset were processed for supervised learning methods using the time-series data of the previous days as input to predict the next day. We used a sliding window technique to create three public benchmark datasets based on different time-intervals (5, 10, and 15 days), respectively, called COVID-19_DataSet1,1 COVID-19_DataSet2,2 and COVID-19_DataSet3.3 Tabs. 2–4 demonstrate the first five instances of these datasets, where  are features variables of the previous days, and
  is the predicted variable of the next day.
1 https://github.com/abdugumaei/COVID-19-Time-Series-Prediction-Datasets/blob/master/COVID-19_DataSet1.csv
2 https://github.com/abdugumaei/COVID-19-Time-Series-Prediction-Datasets/blob/master/COVID-19_DataSet2.csv
3 https://github.com/abdugumaei/COVID-19-Time-Series-Prediction-Datasets/blob/master/COVID-19_DataSet3.csv
Table 2: First five instances of COVID-19_DataSet1
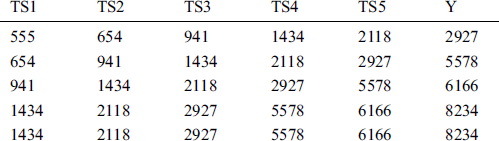
Table 3: First five instances of COVID-19_DataSet2
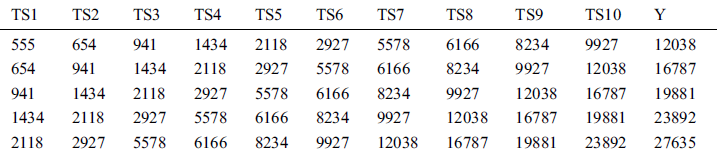
Table 4: First five instances of COVID-19_DataSet3
To make the values of independent feature variables suitable to ML methods and in a specific range, we transformed them to values between zero and one using a min-max normalization technique:

where is the feature variable in row
  and column
  of a COVID-19 dataset.
2.2 Gradient Boosting Regression (GBR)
Gradient boosting (GB) is a machine learning (ML) algorithm used for regression and classification tasks. It can build a prediction model using a combination of weak prediction models, often through decision trees (DTs) [21,22]. This algorithm was first proposed to optimize a cost function [23] and has been used for regression [24,25] and energy theft detection [26]. This led to the development of applications in statistics and artificial intelligence (AI) [27].
GB regression (GBR) is an adaptive boosting algorithm that creates a single strong regression learner by iteratively combining a set of weak regression learners [28]. Its objective function can use gradient descent to minimize the loss function computed from adding weak learners. In this case, the loss function is used to measure how the coefficients of a good model can fit the underlying instances of data. Such as in other boosting algorithms, GBR generates an additive model in a greedy style:

where  is the previous ensemble model, and
  is the base learner, which is added to minimize the loss function
 . The base learner
  is trained on the training set
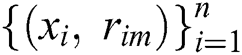 , and the multiplier is found by solving a one-dimensional optimization problem

where  is the target class label.
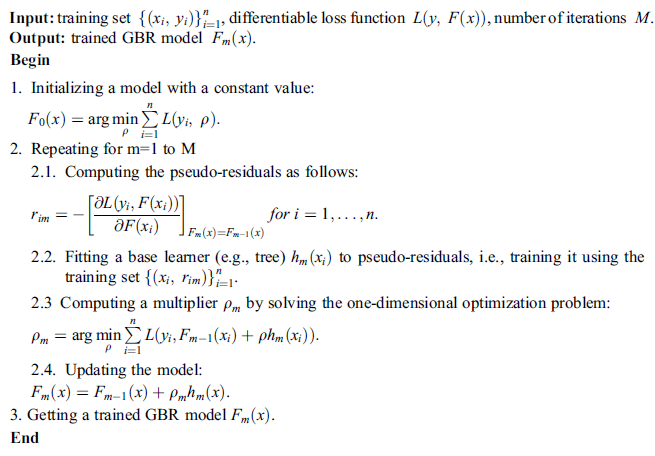
Algorithm 1 lists the steps to train the GBR method to build a trained model with training set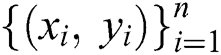 .
.
Algorithm 1: Training GBR Method
We train the GBR method on COVID-19 confirmed case datasets containing feature variables ( ) that represent total confirmed cases for previous days, and target labels (
 ) that are confirmed cases of the following days. The trained GBR model predicts the total confirmed cases for the next day based on those of previous days.
2.3 Performance Evaluation Measures
To evaluate the experimental results of the study, a set of performance measures is utilized to evaluate the differences between the predicted and actual numbers of COVID-19 confirmed cases. These are the root mean square error (RMSE), mean absolute error (MAE), and coefficient of determination (R-squared). RMSE and MAE evaluate the errors between predicted and actual values, which should be small. In contrast, higher values of R-squared give a good indication that the model can correctly predict data instances. These measures are calculated as
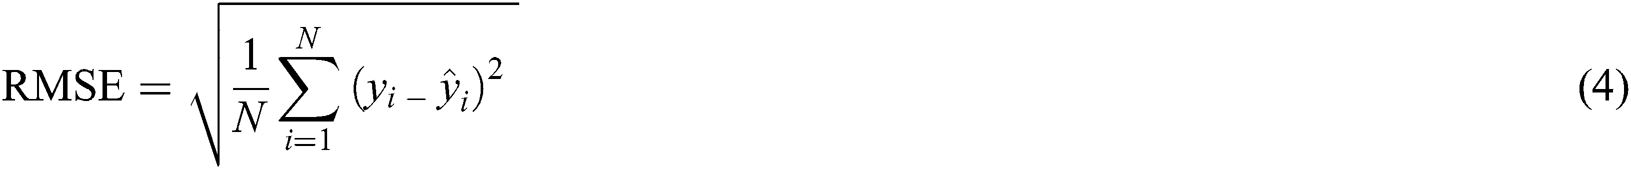


where  and
and  , respectively, are vectors of the
  predicted and actual values, and
  is the mean value of
 .
.
We conducted a set of experiments to compare the GBR model to other predictive models in terms of the above performance evaluation measures. We describe and discuss the experimental results for the three COVID-19 datasets. All models were trained based on 10-fold cross-validation, a robust technique, used to train and evaluate ML models. It divides the dataset into 10 folds. The validation process is executed ten times, each time using one fold for testing and the others for training. The final evaluation result is the average over the 10 folds. Tabs. 5–7 show the RMSE, MAE, R-squared, average, and standard deviation using this technique on the three datasets.
Table 5: Evaluation results of GBR method using 10-fold cross-validation on COVID-19_DataSet1
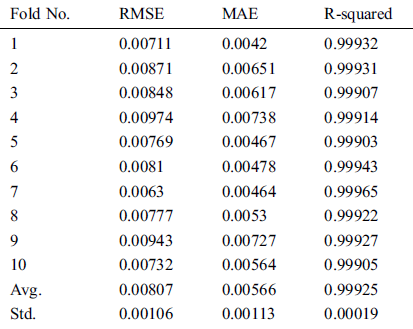
Table 6: Evaluation results of GBR method using 10-fold cross-validation on COVID-19_DataSet2
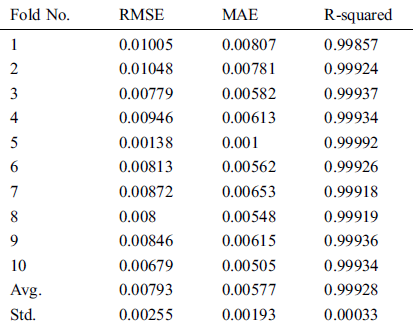
Table 7: Evaluation results of GBR method using 10-fold cross-validation on COVID-19_DataSet3
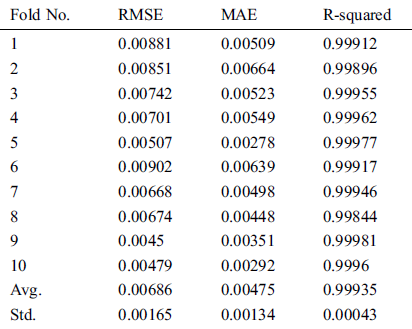
In Figs. 2–4, we visualize the averaged results of RSME, MAE, and R-squared for the GBR method on the three datasets. From the results, it is clear that the best evaluation results are on COVID-19_DataSet3, which is for a time interval of 15 days. This means that to train the model using a long period of total confirmed cases can produce more accurate predictions.
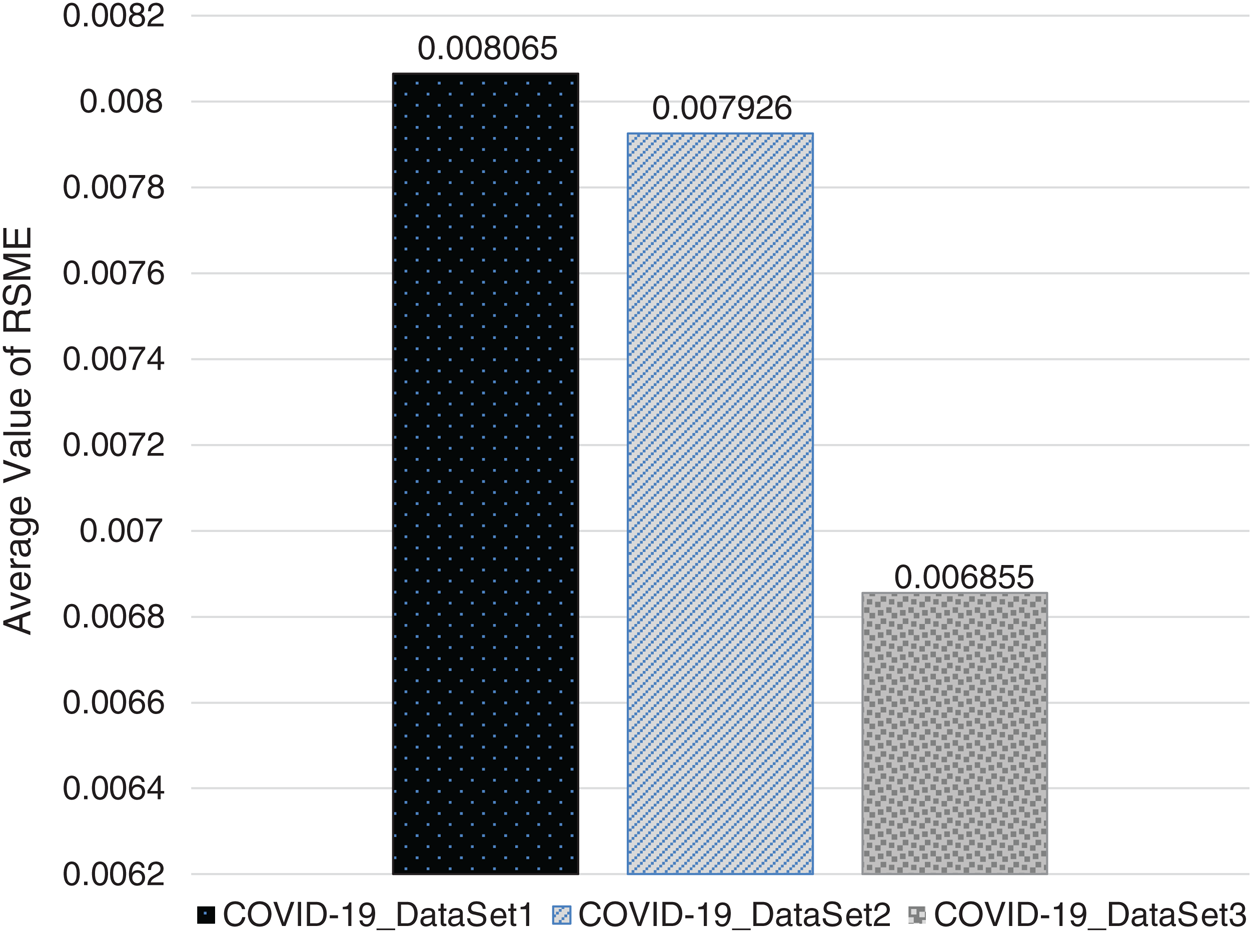
Figure 2: Averaged RSME results of GBR method on the three datasets
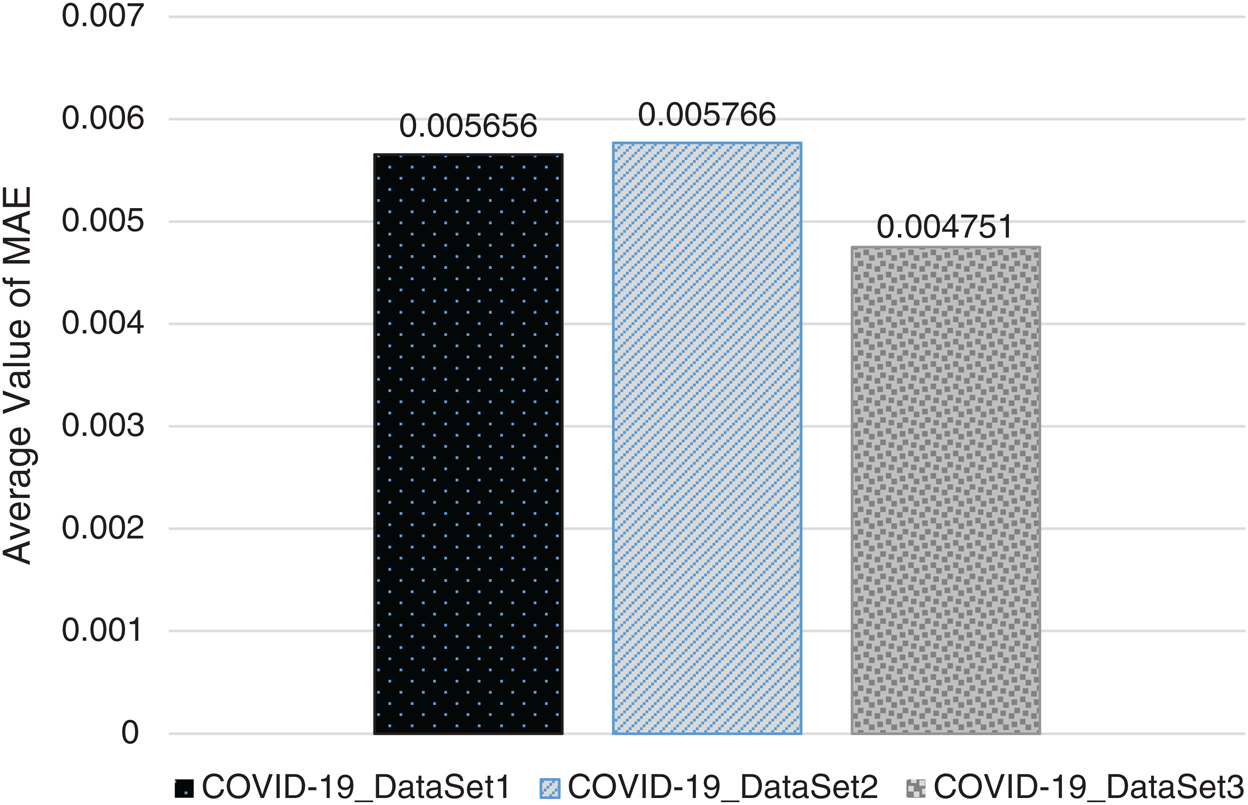
Figure 3: Averaged MAE results of GBR method on the three datasets
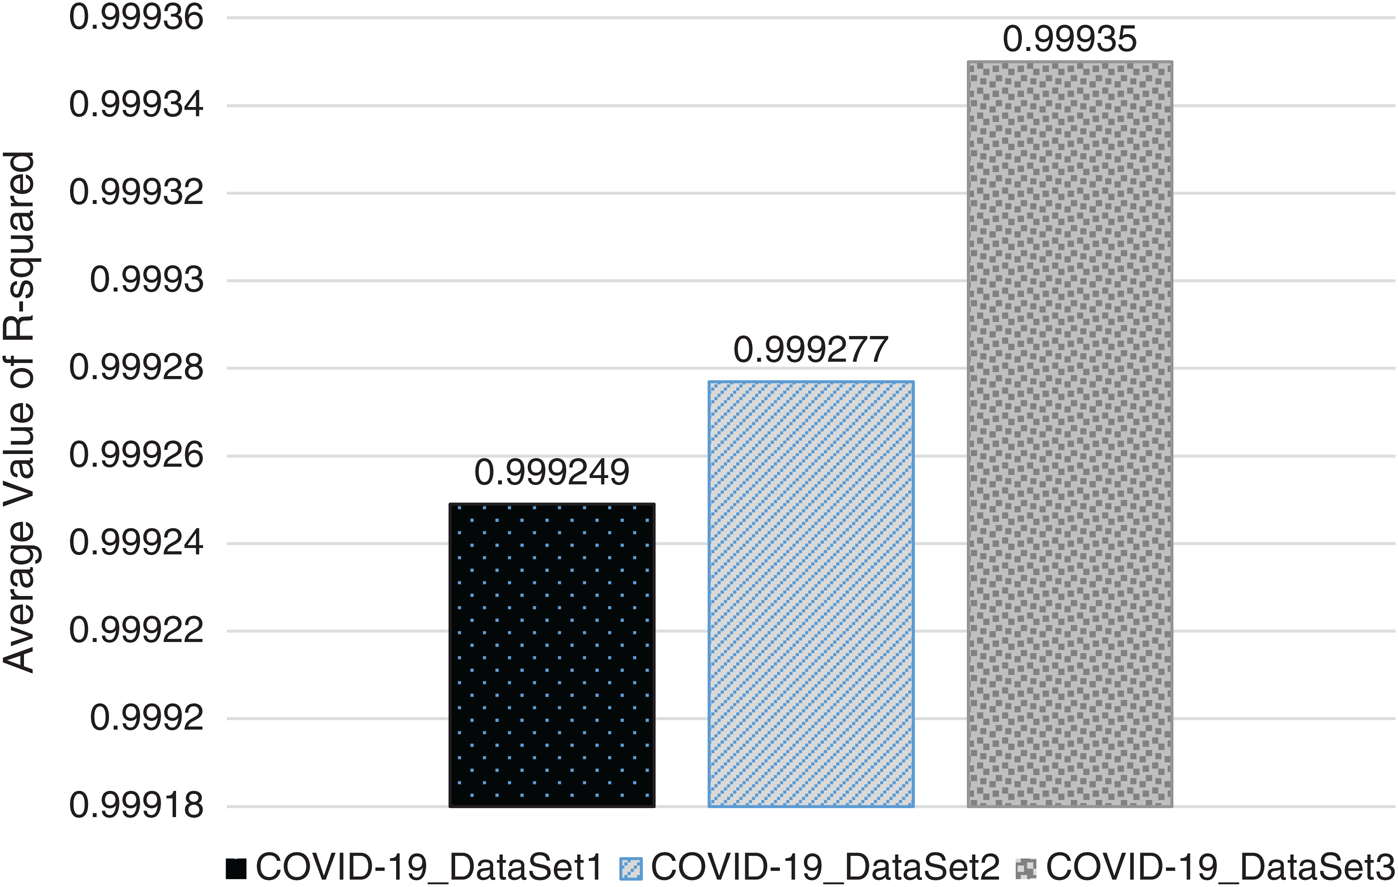
Figure 4: Averaged R-squared results of GBR method on the three datasets
We compared the performance of the GBR method to that of the popular ML regression methods of extreme gradient boosting regression (XGBR), support vector regression (SVR), and decision tree regression (DTR). Figs. 5–7 show the actual and predicted total confirmed cases of fold 6 test instances for each dataset using GBR, XGBR, SVR, and DTR. From the figures, we can see that the actual and predicted total confirmed cases are better fitted by GBR than by the other methods, and SVR has the worst fitting among the compared methods.
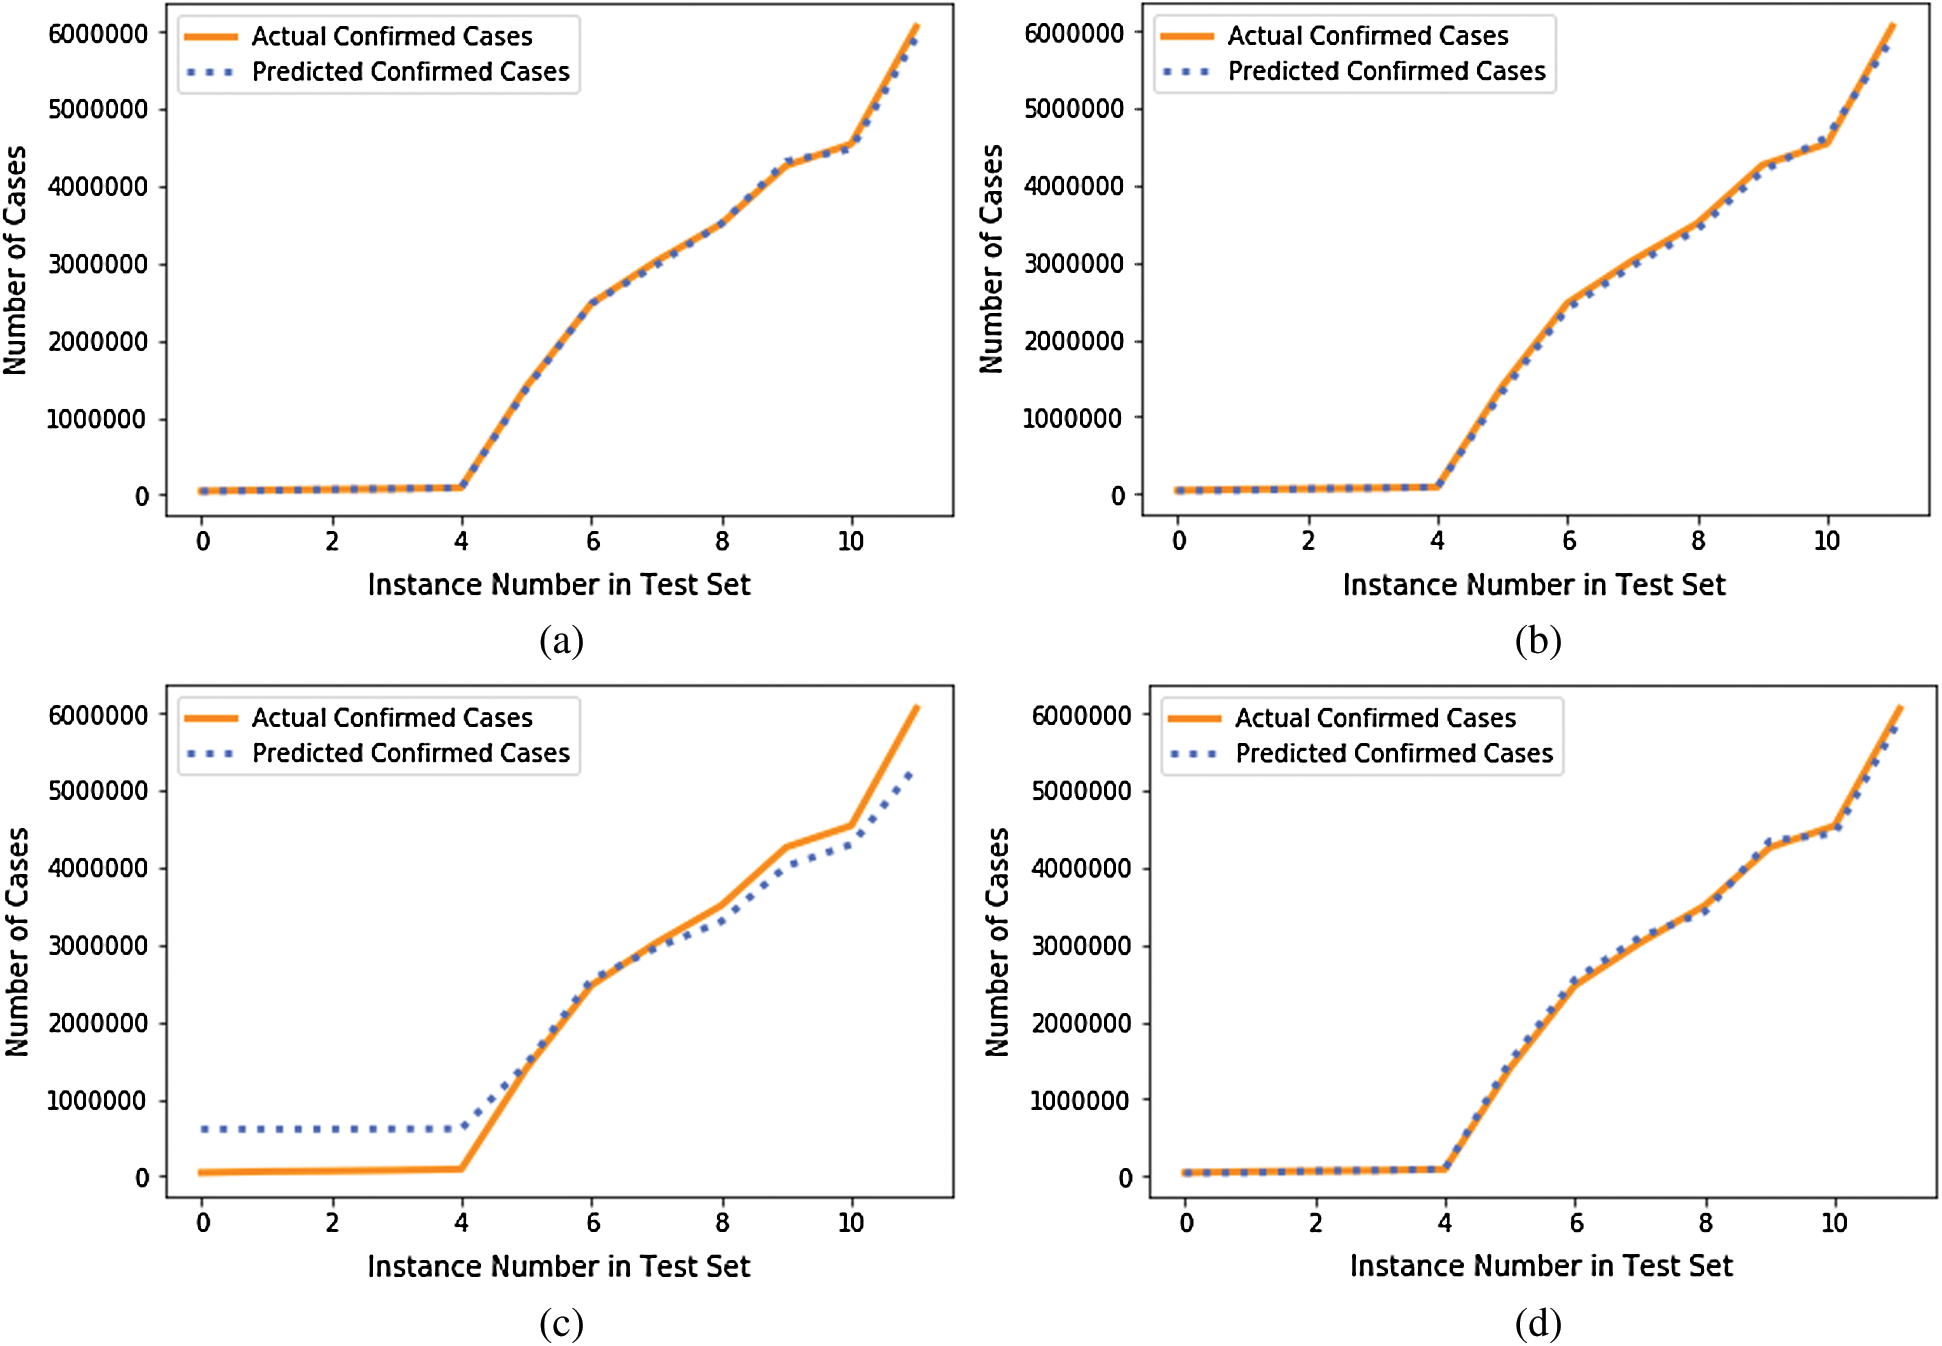
Figure 5: Actual and predicted total confirmed cases of test instances in fold 6 of COVID-19_DataSet1 for: (a) GBR; (b) XGBR; (c) SVR; (d) DTR
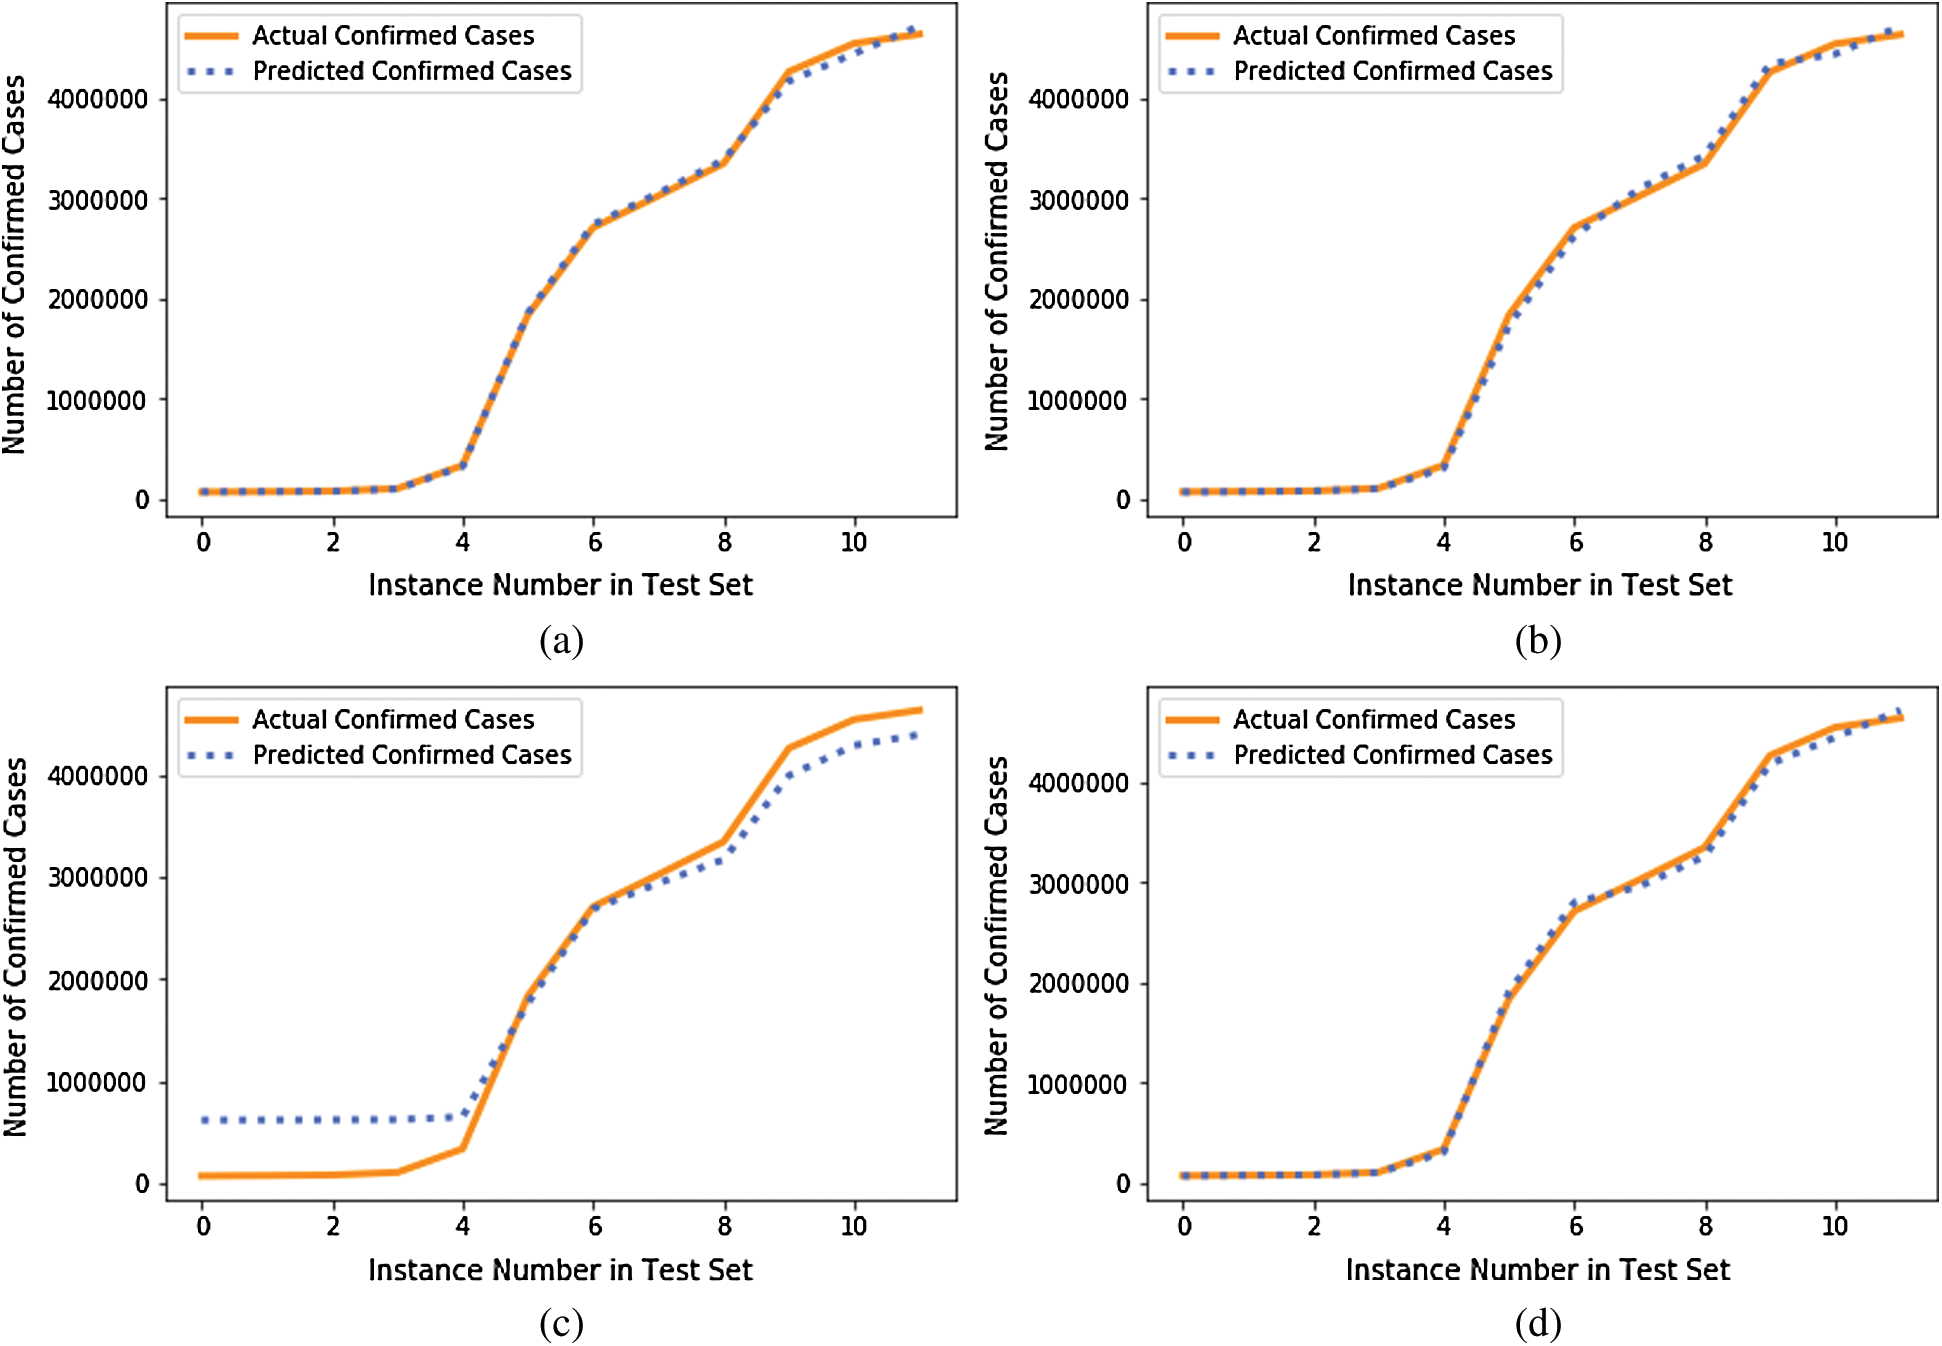
Figure 6: Actual and predicted total confirmed cases of test instances in fold 6 of COVID-19_DataSet2 for: (a) GBR; (b) XGBR; (c) SVR; (d) DTR
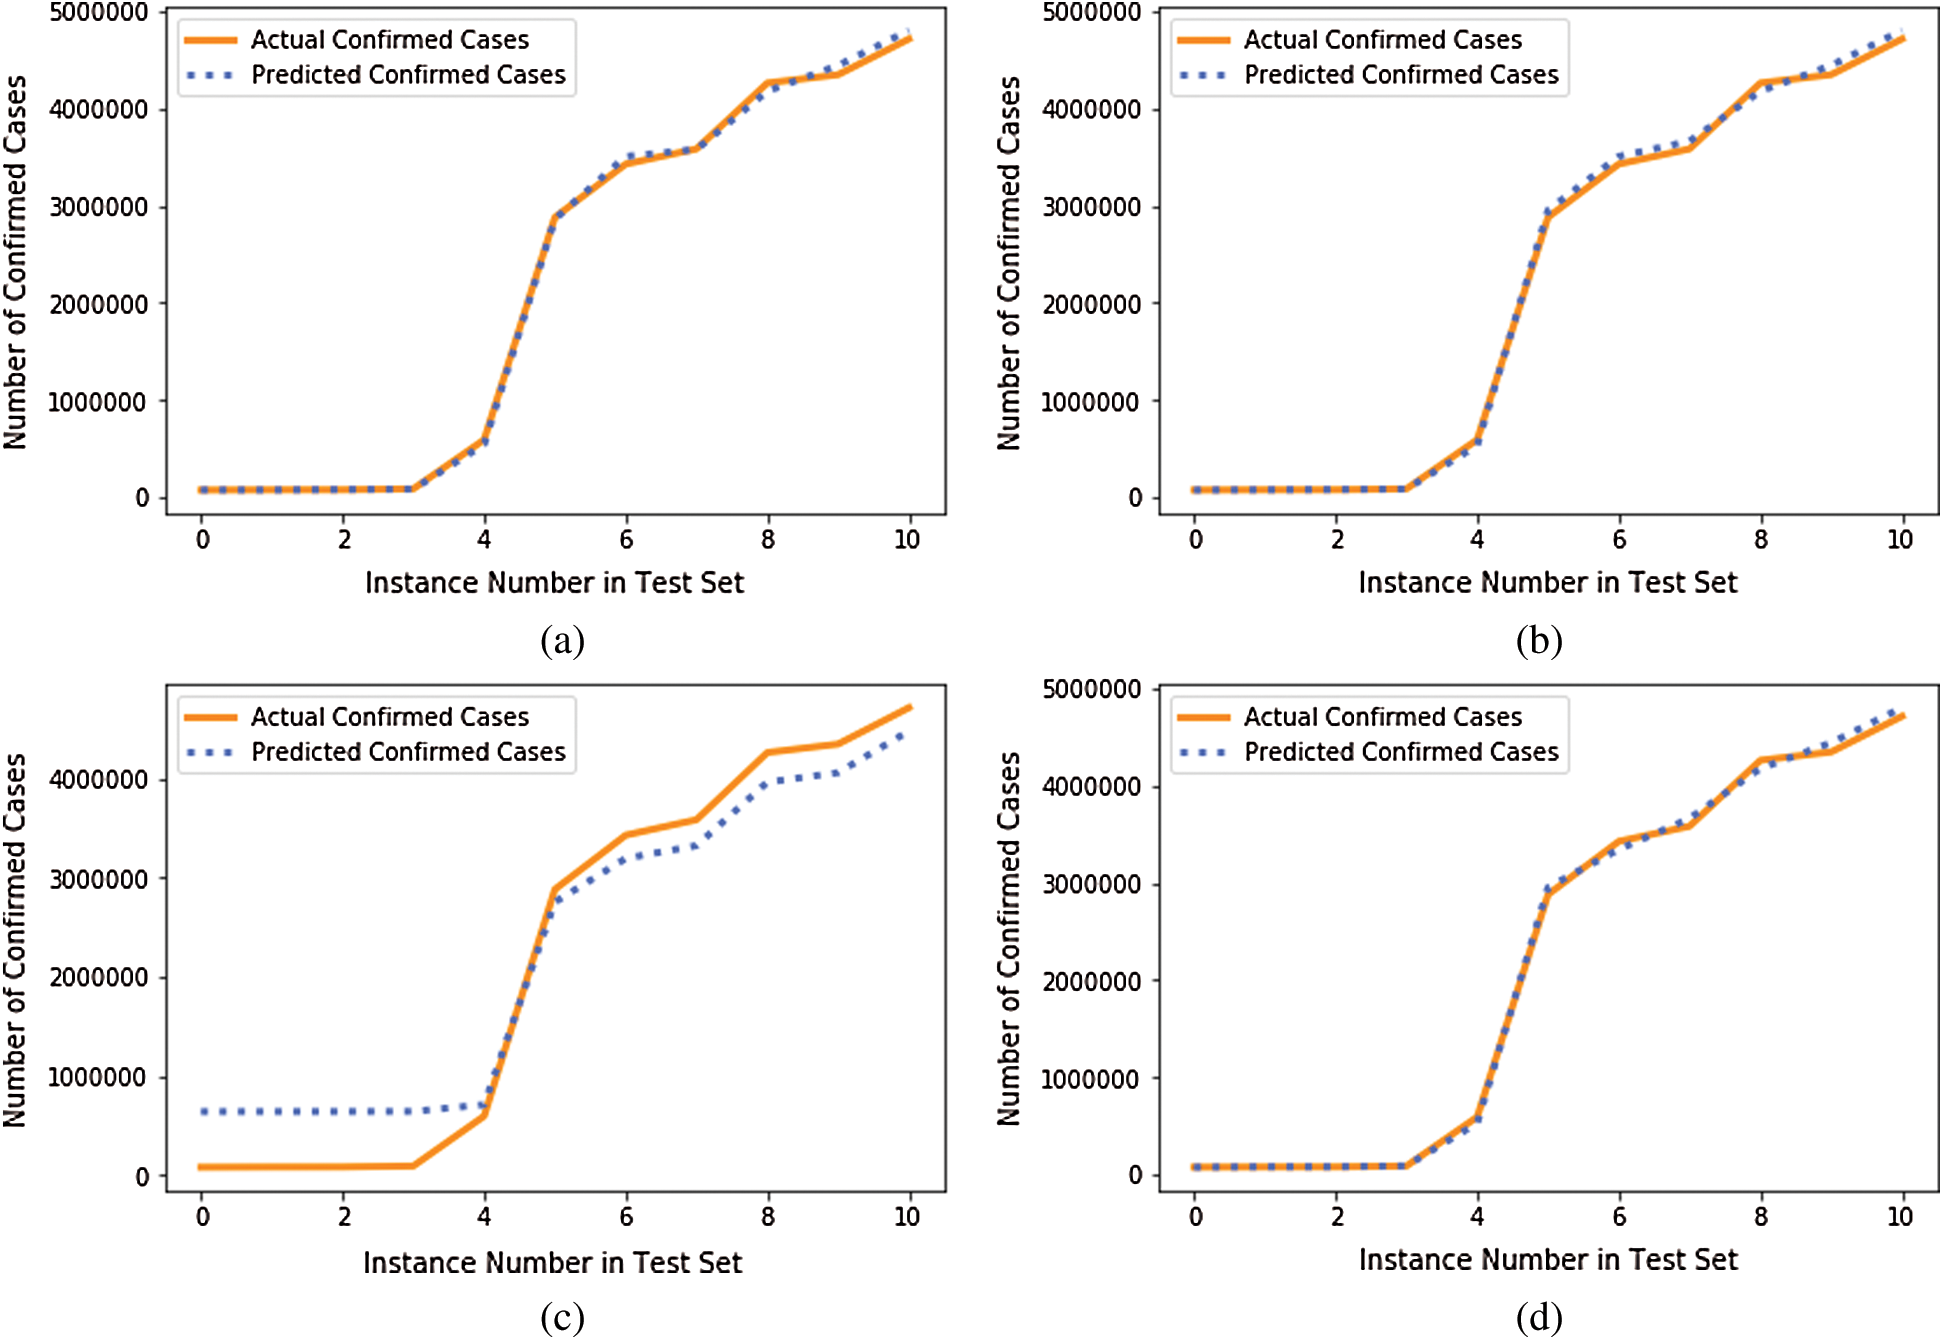
Figure 7: Actual and predicted total confirmed cases of test instances in fold 6 of COVID-19_DataSet3 for: (a) GBR; (b) XGBR; (c) SVR; (d) DTR
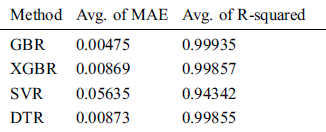
For the 10-fold cross-validation test, we report the average results of RMSE, MAE, and R-squared on the three datasets in Tabs. 8–10. We can notice that GBR achieves the lowest average MAE and the highest average R-squared among the four methods. Figs. 8–10 show the difference in RMSE results between GBR and the other methods on all three datasets.
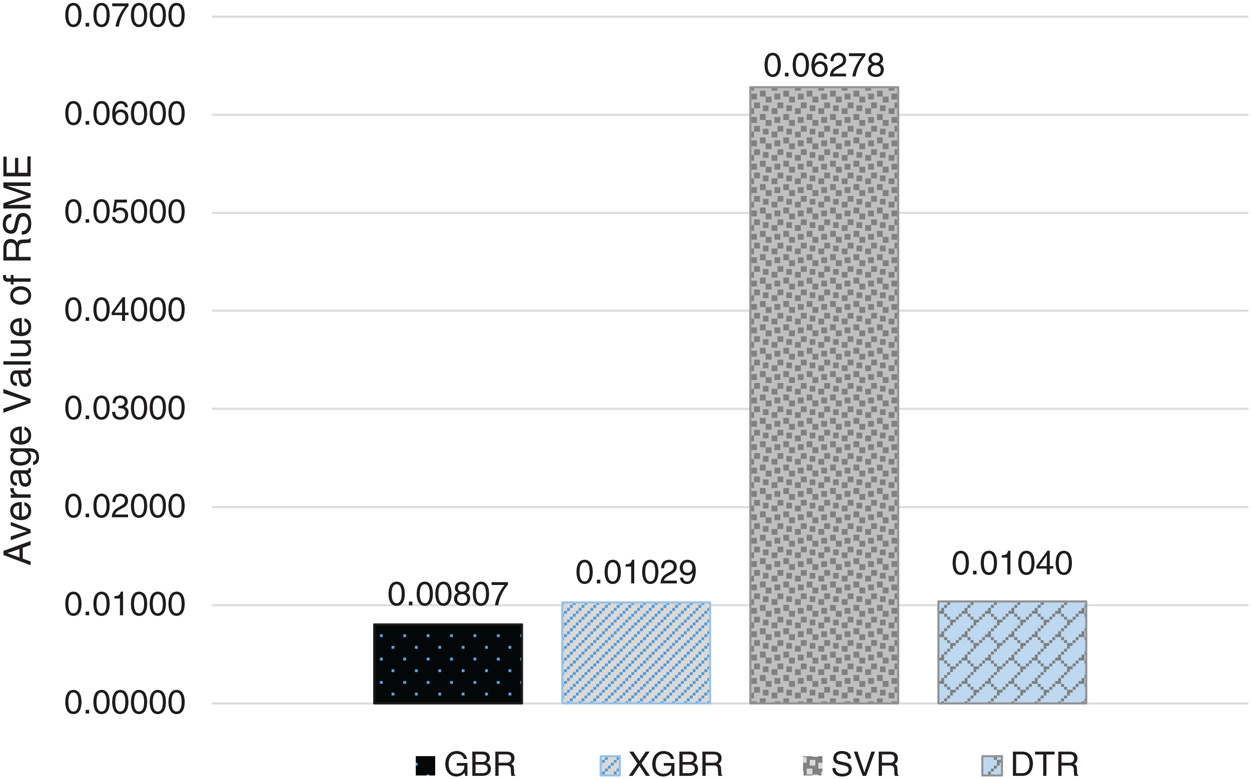
Figure 8: Average RMSE for GBR, XGBR, SVR, and DTR on COVID-19_DataSet1
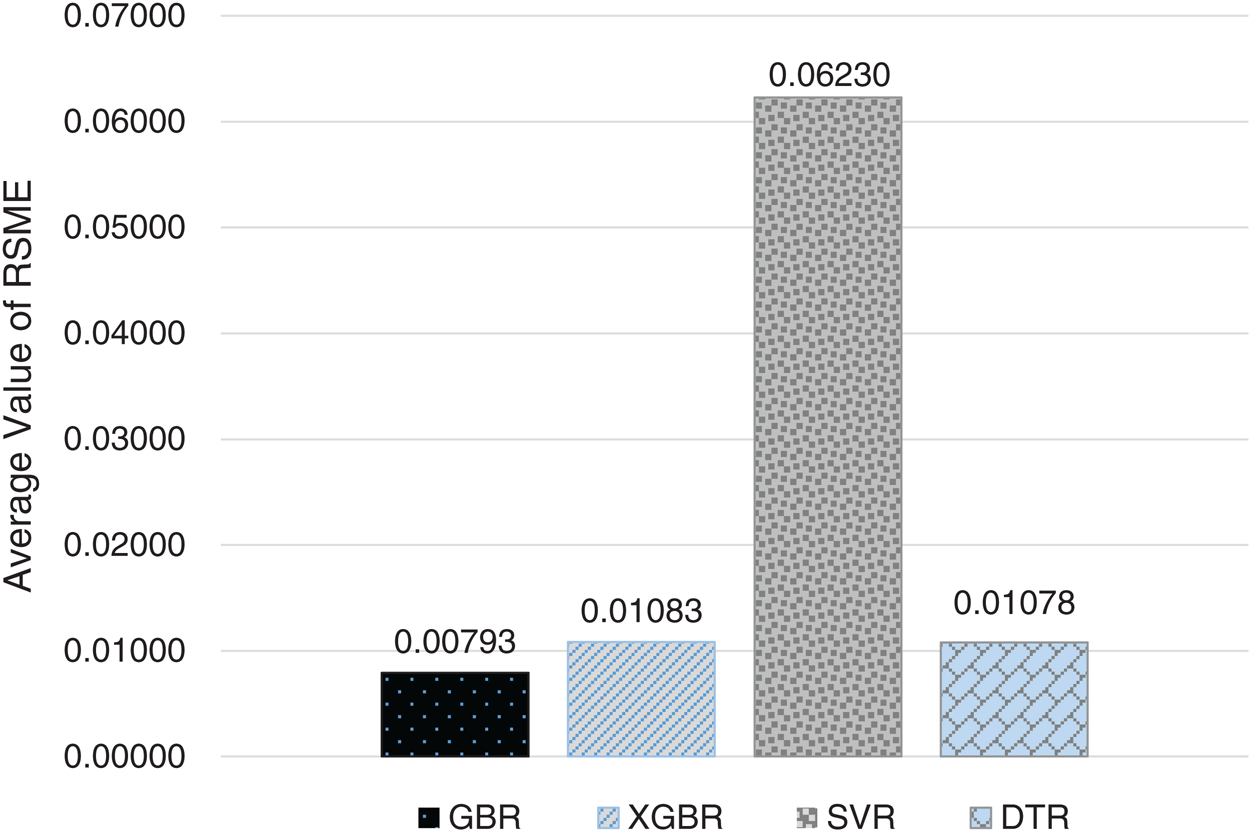
Figure 9: Average RMSE for GBR, XGBR, SVR, and DTR on COVID-19_DataSet2
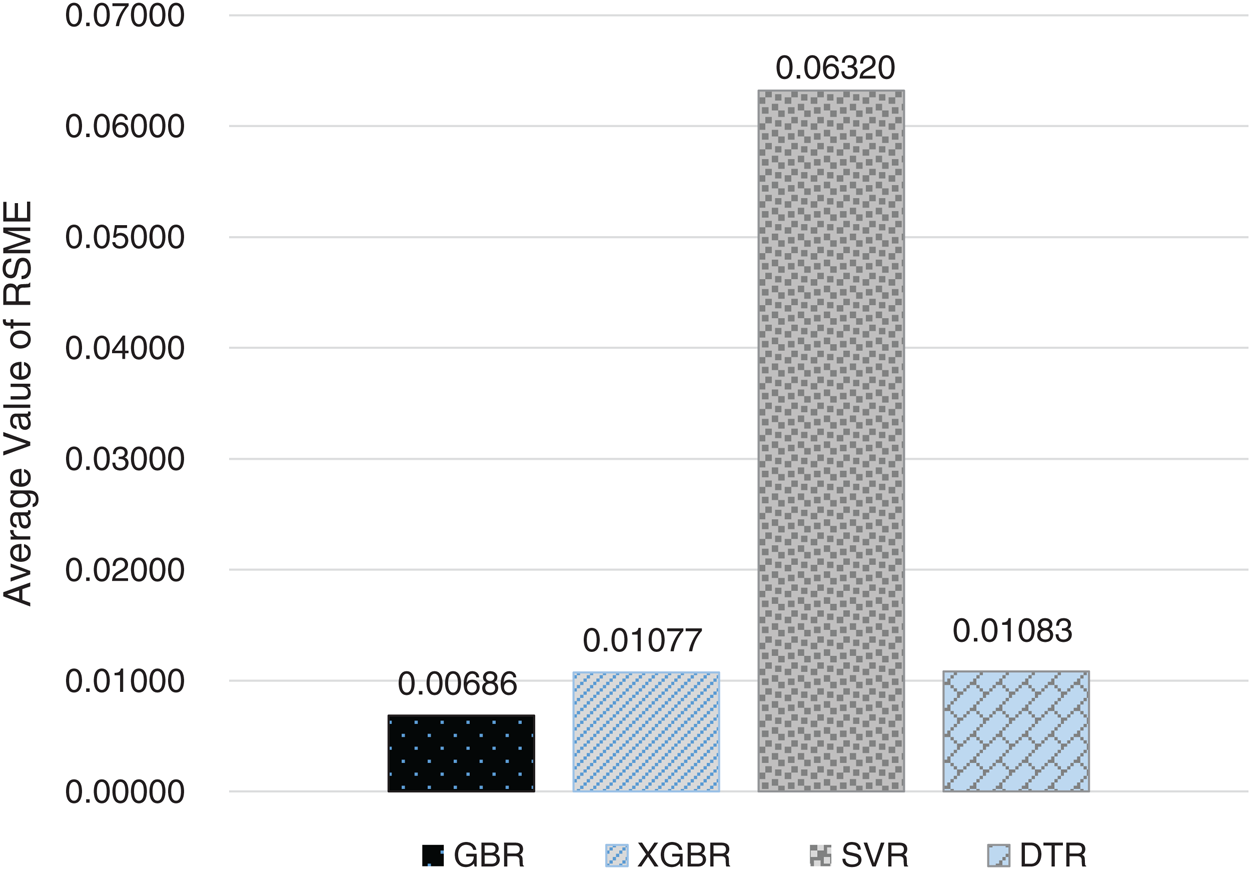
Figure 10: Average RMSE for GBR, XGBR, SVR, and DTR on COVID-19_DataSet3
Table 8: Comparison of GBR, XGBR, SVR, and DTR on COVID-19_DataSet1
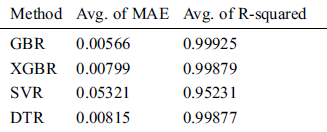
Table 9: Comparison of GBR, XGBR, SVR, and DTR on COVID-19_DataSet2
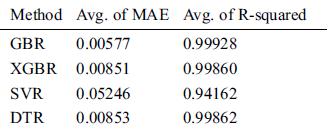
Table 10: Comparison of GBR, XGBR, SVR, and DTR on COVID-19_DataSet3
From the reported results, we find that GBR can effectively predict the total confirmed COVID-19 cases for the next day based on those of previous days. We also conclude that GBR performs better than popular predictive methods in terms of RSME, MAE, and R-squared.
The SARS-CoV-2 pandemic has become a serious worldwide problem. Prediction of future confirmed cases of COVID-19 disease using ML methods is important to provide medical services and have readiness in healthcare systems. We proposed the GBR method to predict the daily total confirmed cases of COVID-19 based on the totals of previous days. We selected GBR because it can minimize the loss function in the training process and create a single strong learner from weak learners. We conducted experiments using 10-fold cross-validation on the daily confirmed cases of COVID-19 collected from January 22, 2020, to May 30, 2020. Experimental results were evaluated using RMSE, MAE, and R-squared. The results revealed that GBR is an effective ML tool to predict the daily confirmed cases of COVID-19. The results showed that GBR achieves 0.00686 RMSE, which is the lowest among GBR and the comparison XGBR, SVR, and DTR models on the same datasets. In future work, we plan to conduct a comprehensive study of ML methods to predict the total deaths and recovered cases as well as the total confirmed cases of COVID-19, so as to analyze their performance in more detail.
Acknowledgement: The authors extend their appreciation to the Deanship of Scientific Research at King Saud University for funding this work through research group No. RG-1441-502.
Funding Statement: The financial support provided from the Deanship of Scientific Research at King Saud University, Research group No. RG-1441-502.
Conflicts of Interest: The authors declare that they have no conflicts of interest to report regarding the present study.
References
1C. Huang, Y. Wang, X. Li, L. Ren, J. Zhao et al.. (2020). , “Clinical features of patients infected with 2019 novel coronavirus in Wuhan, China. ,” Lancet, vol. 395, no. (10223), pp, 497–506, .
2C. Sohrabi, Z. Alsafi, N. O’Neill, M. Khan, A. Kerwan et al.. (2020). , “World Health Organization declares global emergency: A review of the 2019 novel coronavirus (COVID-19). ,” International Journal of Surgery, vol. 76, no. (2), pp, 71–76, . [Google Scholar]
3C. C. Lai, T. P. Shih, W. C. Ko, H. J. Tang and P. R. Hsueh. (2020), “Severe acute respiratory syndrome coronavirus 2 (SARS-CoV-2) and corona virus disease-2019 (COVID-19): The epidemic and the challenges. ,” International Journal of Antimicrobial Agents, vol. 55, no. (3), 105924, . [Google Scholar]
4M. A. Shereen, S. Khan, A. Kazmi, N. Bashir and R. Siddique. (2020), “COVID-19 infection: Origin, transmission, and characteristics of human coronaviruses. ,” Journal of Advanced Research, vol. 24, no. (6), pp, 91–98, . [Google Scholar]
5S. A. Hassan, F. N. Sheikh, S. Jamal, J. K. Ezeh and A. Akhtar. (2020), “Coronavirus (COVID-19): A review of clinical features, diagnosis, and treatment. ,” Cureus, vol. 12, no. (3), e7355, . [Google Scholar]
6W. H. Organization. (2020), “Coronavirus disease 2019 (COVID-19). Situation Report, 88, . [Google Scholar]
7Y. Liu, A. A. Gayle, A. Wilder-Smith and J. Rocklöv. (2020), “The reproductive number of COVID-19 is higher compared to SARS coronavirus. ,” Journal of Travel Medicine, vol. 27, no. (2), pp, 1–4, . [Google Scholar]
8Worldometers. (2020), “Countries where COVID-19 has spread. Worldometers, . [Online]. Available: https://www.worldometers.info/coronavirus/countries-where-coronavirus-has-spread/. [Google Scholar]
9A. Raoofi, A. Takian, A. Akbari Sari, A. Olyaeemanesh, H. Haghighi et al.. (2020). , “COVID-19 pandemic and comparative health policy learning in Iran. ,” Archives of Iranian Medicine, vol. 23, no. (4), pp, 220–234, . [Google Scholar]
10B. Hossain, T. Morooka, M. Okuno, M. Nii and S. Yoshiya. (2019), “Surgical outcome prediction in total knee arthroplasty using machine learning. ,” Intelligent Automation and Soft Computing, vol. 25, no. (1), pp, 105–115, . [Google Scholar]
11Y. H. Peng, D. Y. Chen, L. H. Chen, J. Y. Yu and M. J. Bao. (2018), “The machine learning based finite element analysis on road engineering of built-in carbon fiber heating wire. ,” Intelligent Automation and Soft Computing, vol. 24, no. (3), pp, 531–541, . [Google Scholar]
12H. Li, W. Li, H. Wang and J. Wang. (2018), “An optimization of virtual machine selection and placement by using memory content similarity for server consolidation in cloud. ,” Future Generation Computer Systems, vol. 84, pp, 98–107, . [Google Scholar]
13M. Al-Rakhami, A. Gumaei, M. Alsahli, M. M. Hassan, A. A. Alamri et al.. (2020). , “A lightweight and cost effective edge intelligence architecture based on containerization technology. ,” World Wide Web, vol. 23, no. (2), pp, 1341–1360, . [Google Scholar]
14A. Gumaei, M. M. Hassan, A. Alelaiwi and H. Alsalman. (2019), “A hybrid deep learning model for human activity recognition using multimodal body sensing data. ,” IEEE Access, vol. 7, pp, 99152–99160, . [Google Scholar]
15A. Gumaei, M. M. Hassan, M. R. Hassan, A. Alelaiwi and G. Fortino. (2019), “A hybrid feature extraction method with regularized extreme learning machine for brain tumor classification. ,” IEEE Access, vol. 7, pp, 36266–36273, . [Google Scholar]
16N. Chintalapudi, G. Battineni and F. Amenta. (2020), “COVID-19 virus outbreak forecasting of registered and recovered cases after sixty day lockdown in Italy: A data driven model approach. ,” Journal of Microbiology, Immunology and Infection, vol. 53, no. (3), pp, 396–403, . [Google Scholar]
17K. Roosa, Y. Lee, R. Luo, A. Kirpich, R. Rothenberg et al.. (2020). , “Real-time forecasts of the COVID-19 epidemic in China from February 5th to February 24th, 2020. ,” Infectious Disease Modelling, vol. 5, pp, 256–263, .
18Y. Gao, Z. Zhang, W. Yao, Q. Ying, C. Long et al.. (2020). , “Forecasting the cumulative number of COVID-19 deaths in China: A Boltzmann function-based modeling study. ,” Infection Control & Hospital Epidemiology, vol. 41, no. (7), pp, 841–843, . [Google Scholar]
19X. Jiang, M. Coffee, A. Bari, J. Wang, X. Jiang et al.. (2020). , “Towards an artificial intelligence framework for data-driven prediction of coronavirus clinical severity. ,” Computers, Materials & Continua, vol. 62, no. (3), pp, 537–551, . [Google Scholar]
20F. Petropoulos, S. Makridakis and L. A. Braunstein. (2020), “Forecasting the novel coronavirus COVID-19. ,” PLoS One, vol. 15, no. (3), e0231236, . [Google Scholar]
21C. Zhang, Y. Zhang, X. Shi, G. Almpanidis, G. Fan et al.. (2019). , “On incremental learning for gradient boosting decision trees. ,” Neural Processing Letters, vol. 50, no. (1), pp, 957–987, . [Google Scholar]
22M. Al-Rakhami, A. Gumaei, A. Alsanad, A. Alamri and M. M. Hassan. (2019), “An ensemble learning approach for accurate energy load prediction in residential buildings. ,” IEEE Access, vol. 7, no. (1), pp, 48328–48338, . [Google Scholar]
23T. Chen and C. Guestrin. (2016), “Xgboost: A scalable tree boosting system. ,” in Proc. of the 22nd ACM SIGKDD Int. Conf. on Knowledge Discovery and Data Mining, San Francisco, USA: , pp, 785–794, . [Google Scholar]
24X. Zhan, S. Zhang, W. Y. Szeto and X. Chen. (2020), “Multi-step-ahead traffic speed forecasting using multi-output gradient boosting regression tree. ,” Journal of Intelligent Transportation Systems, vol. 24, no. (2), pp, 125–141, . [Google Scholar]
25J. Thomas, A. Mayr, B. Bischl, M. Schmid, A. Smith et al.. (2018). , “Gradient boosting for distributional regression: Faster tuning and improved variable selection via noncyclical updates. ,” Statistics and Computing, vol. 28, no. (3), pp, 673–687, . [Google Scholar]
26R. Punmiya and S. Choe. (2019), “Energy theft detection using gradient boosting theft detector with feature engineering-based preprocessing. ,” IEEE Transactions on Smart Grid, vol. 10, no. (2), pp, 2326–2329, . [Google Scholar]
27C. Zhang, Y. Zhang, X. Shi, G. Almpanidis, G. Fan et al.. (2019). , “On incremental learning for gradient boosting decision trees. ,” Neural Processing Letters, vol. 50, no. (1), pp, 957–987, . [Google Scholar]
28A. Mayr, H. Binder, O. Gefeller and M. Schmid. (2015), “The evolution of boosting algorithms. ,” Methods of Information in Medicine, vol. 53, no. (6), pp, 419–427, . [Google Scholar]
 | This work is licensed under a Creative Commons Attribution 4.0 International License, which permits unrestricted use, distribution, and reproduction in any medium, provided the original work is properly cited. |