DOI:10.32604/cmc.2020.011969
| Computers, Materials & Continua DOI:10.32604/cmc.2020.011969 | |
| Article |
ACLSTM: A Novel Method for CQA Answer Quality Prediction Based on Question-Answer Joint Learning
School of Information and Electronic Engineering, Zhejiang University of Science and Technology, Hangzhou, 310023, China
*Corresponding Author: Weifeng Ma. Email: mawf@zust.edu.cn
Received: 08 June 2020; Accepted: 29 June 2020
Abstract: Given the limitations of the community question answering (CQA) answer quality prediction method in measuring the semantic information of the answer text, this paper proposes an answer quality prediction model based on the question-answer joint learning (ACLSTM). The attention mechanism is used to obtain the dependency relationship between the Question-and-Answer (Q&A) pairs. Convolutional Neural Network (CNN) and Long Short-term Memory Network (LSTM) are used to extract semantic features of Q&A pairs and calculate their matching degree. Besides, answer semantic representation is combined with other effective extended features as the input representation of the fully connected layer. Compared with other quality prediction models, the ACLSTM model can effectively improve the prediction effect of answer quality. In particular, the medium-quality answer prediction, and its prediction effect is improved after adding effective extended features. Experiments prove that after the ACLSTM model learning, the Q&A pairs can better measure the semantic match between each other, fully reflecting the model’s superior performance in the semantic information processing of the answer text.
Keywords: Answer quality; semantic matching; attention mechanism; community question answering
People used to rely on traditional search engines to acquire knowledge. With the explosive growth of information nowadays, it is clear that the traditional search engines have many shortcomings, such as: With excessive numbers of search results, it is difficult to quickly locate the required information; it relies solely on keyword matching technology and does not involve semantics, resulting in poor retrieval, etc. Consequently, a new mode of information sharing—community question answering (CQA) emerged. In particular, the emergence of vertical domain CQA such as Stack Overflow, Brainly, and Auto Home not only satisfies the specific information needs of users, but also promotes the dissemination of high-quality information. The CQA launched by Auto Home is a professional automobile communication platform. Users have put forward a substantial number of real and effective questions and answers with increased user activities. However, the content edited by responders varies greatly, and the quality of the answers is uneven. Auto Home has introduced an automatic Q&A service, but it fails to analyze customized issues and address user needs, so the user experience is undermined. Besides, CQA answer quality analysis indicates that about more than 30% of the answers were worthless [1]. Therefore, the basis for CQA success is how to detect high-quality answers from the content edited by the responder. In response to these problems, this paper proposes an answer quality prediction model based on question-answer joint learning with the use of attention mechanism and question text, together with the semantic representation of Q&A pairs in joint learning to filter out high-quality answers that fit the question.
Mining the effective factors that affect the quality of answers is one of the keys to predict high-quality answers. Fu et al. [2] found that reviews and user features among non-textual features are the most effective indicators for evaluating high-quality answers, while the validity of textual features varies across different knowledge domains. Shah et al. [3] found that the responder’s personal information and reciprocal ranking of answers to a given question could significantly predict high-quality answers. Calefato et al. [4] found that answers with links to external resources are positively related to the integrity of their content, and the timeliness of the answers, the responder’s emotions, and the responder’s reputation score are all factors that influence the acceptance of the answer. Liu et al. [5] found that the quality of the question is also an important factor affecting the quality of the answer. Low-quality answers induce by low-quality questions. On the contrary, high-quality questions contribute to high-quality answers. The quality of the question to some extent determines the quality of the answer. Combining the quantitative and time difference characteristics of answers, Xu et al. [6] proposed to use the relative positional sequence characteristics of the answers to make quality predictions of the answers. The results show that this feature can significantly improve the effect of answer quality prediction.
The key to predict high-quality answers is not only to explore the effective factors that affect the quality of answers, but also to choose the appropriate model. Machine learning methods are widely used in classification and prediction tasks, such as Random Forest classification model [7], Latent Dirichlet Allocation (LDA) model [8], Support Vector Machines (SVM) [9–10], ensemble learning [11], etc. Because of the advantages in processing structured data, machine learning methods are also widely used in answer quality prediction. Alternate Decision Tree (ADT) classification model and multi-dimensional features extracted were used to predict the quality of answers, which has achieved good results [12–13]. By using textual features, non-textual features and the combination of the two, Li et al. [14] established a binary classification model with logical regression. It is found that the discriminant performance of the model for high-quality answers is higher than that for low-quality answers. Wang et al. [15] found that the Random Forest classification model including user social attributes has better classification performance after comparing the classification performance of logistic regression, Support Vector Machine and Random Forest. Wu et al. [16] proposed a new unsupervised classification model to detect low-quality answers. Studies have shown that testing multiple answers under the same question can improve the detection of low-quality answers. Machine learning has achieved remarkable results in the prediction of answer quality. However, most of them take advantage of structural features, so they have a low utilization rate of the text and cannot capture the semantic information of the text.
With the development of deep learning, the neural network has achieved tremendous success in Computer Vision [17], Signal Processing [18–19] and Natural Language Processing. The neural network can be used to capture text semantic information, and how to better measure the semantic information of the answer has been gradually in the spotlight. Sun et al. [20] used the topic model to extract the keywords of the answer, extend it with context and synonyms, and then train the model with CNN. The results show that the model can effectively improve the accuracy of answer quality prediction. Suggu et al. [21] proposed two different DFFN (Deep Feature Fusion Network) answer quality prediction frameworks to model the Q&A pairs with CNN and Bi-directional Long Short-term Memory Network (Bi-LSTM) with neural attention respectively, and extended features through leveraging various external resources. Experiments show that this method has better performance in answer quality prediction tasks than other general deep learning models. Zhou et al. [22] combined CNN with Recurrent Neural Network (RNN) to capture both the matching semantics of the Q&A pairs and the semantic association between the answers. Considering the interdependence of sentence pairs, Yin et al. [23] studied the dependency semantic relationship between sentence pairs through the attention mechanism and CNN. The results show that this method can better measure the semantic relationship between pairs of sentences than modeling sentences separately.
Fig. 1 shows the architecture of answer quality prediction model based on question-answer joint learning. First, Q&A pairs of Auto Home CQA is used to jointly construct attention text representation and learn the dependency relationship between Q&A pairs; Second, input the attention text representation into parallel CNN to extract the local features of Q&A pairs; Third, input the Q&A pairs after CNN into parallel LSTM to extract long-distance dependent features; Next, calculate the semantic matching degree between the question representation and the answer representation, combine with deep answer semantic representation and other effective extended features as the input representation of the fully connected layer; Finally, the SoftMax classifier is used to predict the quality of the corresponding answers to a given question.
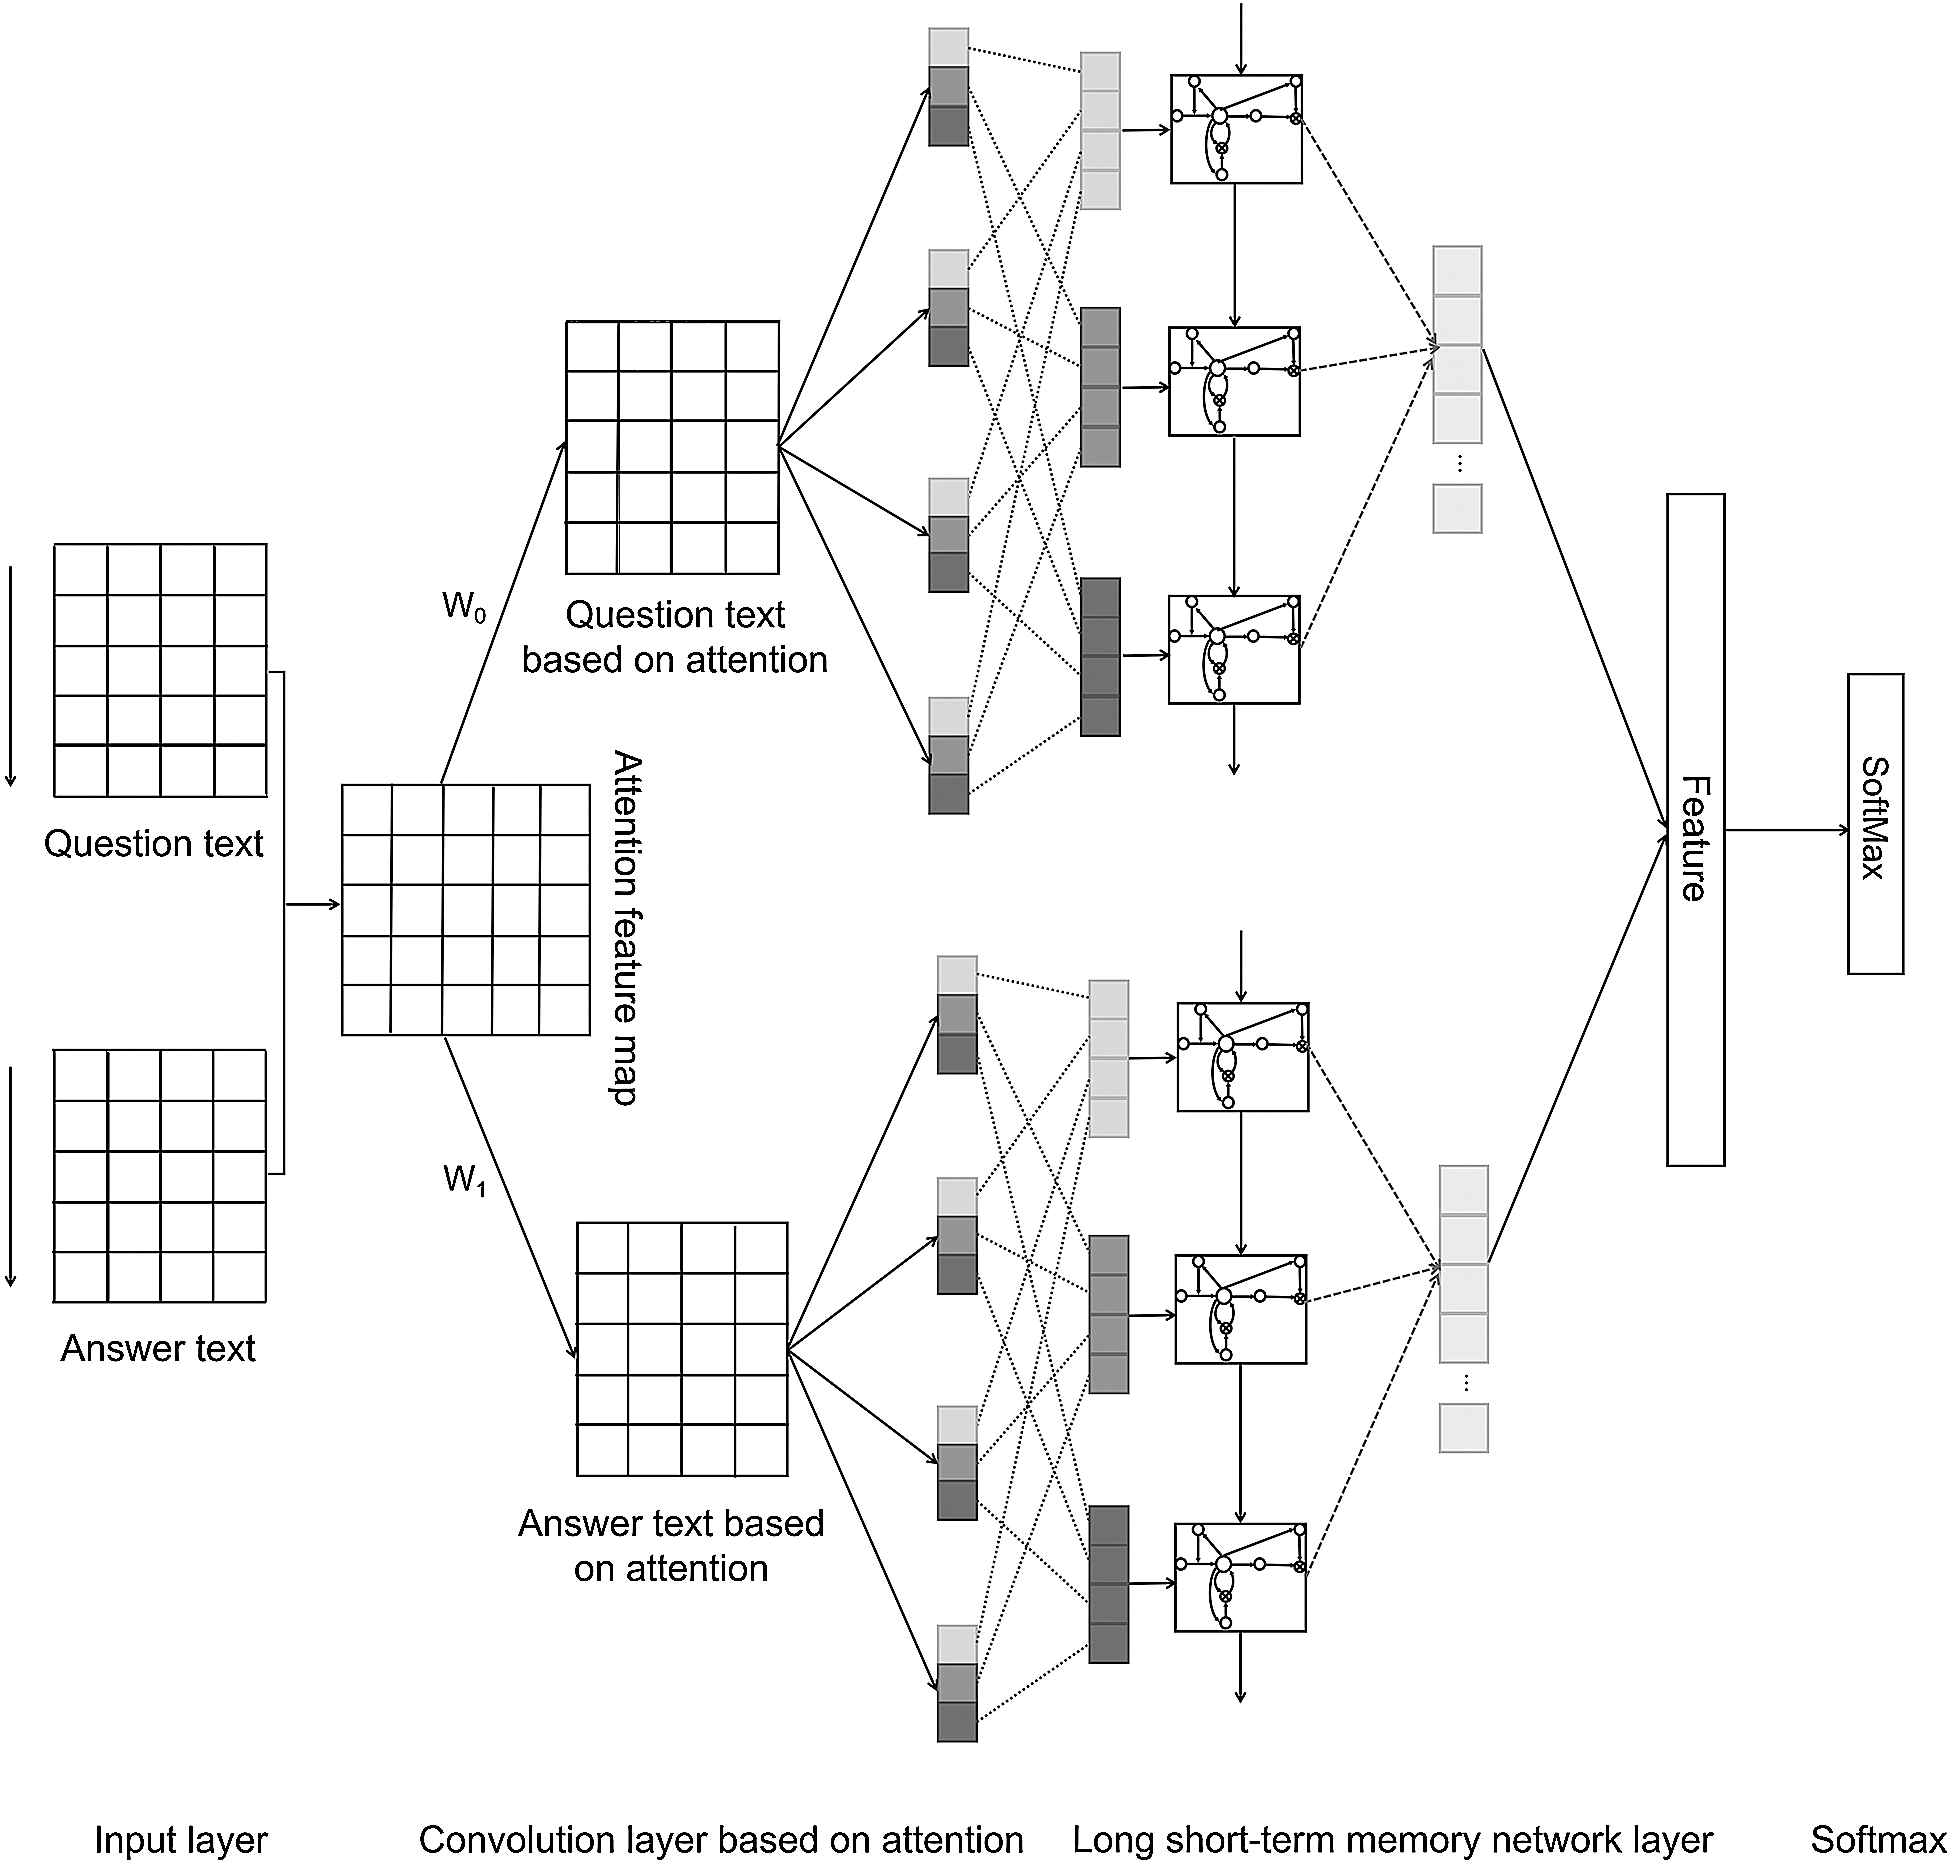
Figure 1: The architecture of model
First, for given Q&A pair, the question text and the answer text need to be filled with 0 to equal length, that is, the length of the text is  ; where question text
  ,
,  ; and answer text
  ,
,  . Word2vec model is used to pre-train the word vector to indicate that the word is d-dimensional [24],
 , where
  represents the value of the word vector of the
  -th word of the question text
  in the
  -th dimension;
  , where
  represents the value of the word vector of the
  -th word of the question text
  in the
  -th dimension. Finally, the question text and the answer text are expressed as the word vector matrix
  ,
,  .
.
3.2 Convolution Layer Based on Attention
The attention matrix  is introduced to weight the semantic similarity between the question text and the answer text. In the attention matrix
  , the
, the  -th line value represents the attention distribution of the
  -th word of the question text
  relative to the answer text
  , and
, and  -th column value represents the distribution of attention of the
  -th word of the answer text
  relative to the question text
  . The specific calculation of attention matrix
  is as follows:

Given the above attention matrix, the attention feature maps with consistent dimensions for the original question text  and answer text
  need to be generated:

where  ,
,  are weight matrices, which need to learn and update in model training.
Input question text attention representation  and the answer text attention representation
  into parallel CNN, respectively, the local features of attention representation are captured through CNN, and new feature representations are obtained as
  and
and  . The specific calculation method of convolution operation for attention representation of question text is as follows, answer text is the same:


where  represents sliding window size;
  (
( ) represents subsequence composed of convolution kernel of
  dimension size at the position of
  in
in  ;
;  represents the convolution parameter matrix, where
  represents the final dimension size after convolution output;
  represents the bias;
  represents the non-linear activation function. Here, ReLu is used as the activation function; and
  represents the convoluted final feature representation sequence at the position
  .
.
3.3 Long Short-Term Memory Network Layer
CNN has limitations in dealing with time series-related tasks. The RNN can compensate for this deficiency. Compared with the traditional RNN, LSTM as a variant of RNN, can use its unique gating units to learn the long-distance dependence of text sequence. Therefore, this paper inputs feature representation of  and
and  into parallel LSTM through the convolution layer to extract context semantic features, as well as to obtain long-distance dependence features
  and
and  of question and answer texts with the reference of Hochreiter’s LSTM structure [25]. The specific calculation formula for the long-distance dependency features of the question text is as follows, answer text is the same:


where  represents input information of time sequence
  (
( );
);  represents the output information of last time sequence;
  ,
,  ,
,  and
and  represent the input gate, forget gate, output gate and candidate memory information of the time sequence
  ;
;  and
and  represent the memory state and hidden state of time sequence
  ;
;  represents the weight matrix to be learned;
  represents the bias; and
  represents the non-linear activation function Sigmoid.
In this paper, the above fusion feature representation is input into the SoftMax classifier for answer quality prediction. For given  , where quality category label
  (
( is the number of quality category labels). After entering the SoftMax classifier, the prediction probability distribution of answer quality category corresponding to characteristic
  is obtained, as shown in formula (13):

where  represents weight parameter matrix;
  represents the bias.
In model training, use cross-entropy as the loss function to measure the model loss, and use regularization to prevent overfitting, as shown in formula (14). The ultimate goal of model training is to minimize the cross-entropy.

where  represents the number of samples;
  represents the answer quality category;
  represents the correct quality category of the answer text;
  represents the predicted quality category;
  is the L2 regularization;
  is the model parameter.
4 Feature Construction and Selection
By obtaining relevant data from the Auto Home CQA, this paper constructs a feature system for extended features, and evaluates the feature system with multiple indicators, and selects effective features as the extended features of answer quality prediction.
(1) Structural Features
Structural features are features after direct statistics, including question length (que_length), answer length (ans_length), number of question words (que_words_num), number of answer words (ans_words_num), number of question characters (que_ch_num), number of answer characters (que_ch_num), answer time interval (time_interval), whether the answer is adopted (is_adopt), whether the question contains a picture (has_picture) and whether the answer includes external links (has_link).
(2) User Attribute
User attributes can reflect the activity and authority of users, including the number of answers (ans_num), number of adopted answers (adopt_num), and number of helpful answers (help_num).
(3) Textual Features
Textual features refer to the features that are contained in the text but cannot be counted directly. This paper calculates the cosine similarity between the average word vector representation of the question text and the average word vector representation of the answer text as an indicator of the semantic match between the question text and the answer text (similarity).
In order to make the model have better performance, data is usually processed by the following strategies: feature selection [26], dictionary learning, compressed sensing [27–28], etc. Considering the characters of data, this paper uses feature selection method to obtain high-quality features. Various features are different in unit and dimension and cannot be compared directly. It is therefore necessary to first have dimensionless processing of features, so the features of different attributes are comparable. This paper evaluates the above features with Pearson correlation coefficient (Corr.), L1 regularization (Lasso), L2 regularization (Ridge), maximal information coefficient (MIC), random forest mean decrease impurity (MDI) and recursive feature elimination (RFE), and normalizes the final score. Tab. 1 shows the detailed evaluation of various features.
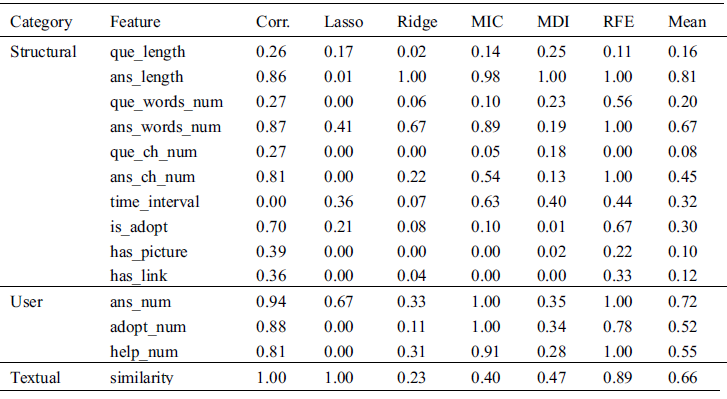
It requires conducting feature screening to obtain more stable features [29]. This paper uses the mean value combined with the threshold method for feature selection [30]. Based on the evaluation, it can be known that the length of question/answer, number of words and characters of questions/answers can reflect the richness of the text content of questions/answers, which all belong to redundant features. Chinese sentences are composed of successive single character, a word could consist of a single character or more. Compared with character, words can better measure whether the Chinese sentences are misspelled [31]. Therefore, the number of questions/answers is selected as the feature. In other features, whether the question includes pictures and whether the answers include external links has little impact on the model. Therefore, the threshold value is set at 0.12. Finally, the feature of average score above threshold is selected as the adopted feature, including the following eight: Number of question words, number of answer words, answer time interval, whether the answer is adopted, matching degree, number of answers, number of adopted answers and number of helpful answers are selected as the final extended features.
In this paper, the dataset used is a customized benchmark dataset, and sourced from Auto Home CQA. The dataset contains a total of 7,853 questions and 48,815 Q&A pairs, with a time span from April 25, 2012 to December 9, 2019. The user took only 4.25% out of 48,815 answers. The reason that users did not adopt the answers is not because of their low-quality, but because the questioner did nothing to make his answer stand out, resultantly the majority of the answers were not adopted. Therefore, only taking whether the answer is adopted as an assessment criterion of the quality of the answer is unreliable. Based on the literature [15], this paper evaluates the quality of the answer from 13 dimensions and artificially labels the answer quality as low, medium, and high.
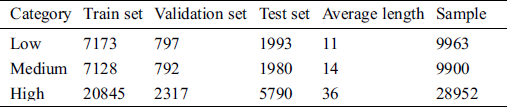
To verify the validity of the algorithm model proposed, this paper randomly takes 20% of the total sample as a test data set, and randomly selects 10% as the validation data set and the rest as training data set in the remaining 80% of the data. Tab. 2 shows the specific statistics after dividing the dataset.
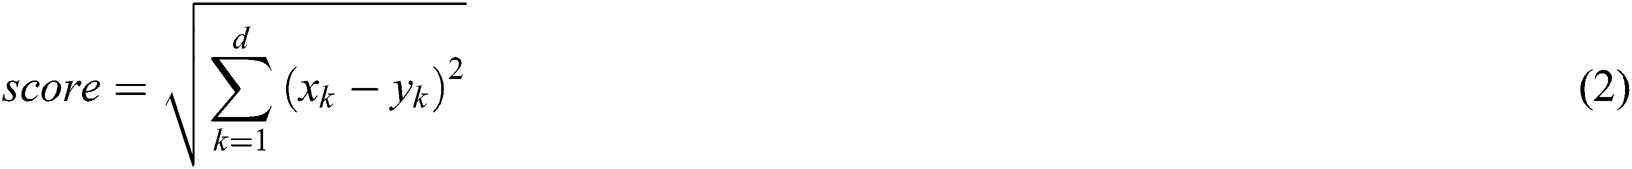
This paper takes precision (P), recall (R), F1 score, macro average precision, macro average recall, macro average F1-score as evaluation indexes of answer quality with the following calculation formula:


where  represents the number of samples actually positive and predicted positive;
  represents the number of samples actually negative but predicted positive;
  represents the number of samples actually positive but predicted negative; and
  represents the sample size of the test set.
5.3 Comparative Experiment Selection
This paper uses customized data sets to compare different models to verify the validity of the proposed models. The Skip-gram mode of Word2vec is used to obtain better word vectors. The context window is set to 5, and the word vector dimension is set to 100, and the question text and answer text of Auto Home CQA are jointly trained to finally obtain the word vector representation of question/answer text pre-training. The comparative experiments include:
1.SVM. This paper obtains the average word vector representation of the answer text from the pre-training word vector, and predicts its quality with SVM.
2.Random Forest. This paper obtains the average word vector representation of the answer text from the pre-training word vector, and predicts its quality with Random Forest.
3.CNN. With the reference of model architecture of literature [32], this paper uses CNN to learn the vector representation of the given question text and the answer text and predicts its quality.
4.ABCNN. With the reference of model architecture of literature [23], this paper uses the attention mechanism to consider the interaction between question and answer, and integrates it into the CNN to learn the vector representation of the answer text and predicts its quality.
5.LSTM. This paper uses LSTM to learn the vector representation of the given question text and the answer text and predicts the quality of the answer.
6.ACLSTM. The proposed model in this paper uses attention mechanism to respectively weight the answer/question text with the question/answer text, and inputs the weighted text representation into CNN and LSTM to learn the deep semantic representation of question/answer texts and predicts its quality.
This paper not only uses different models to learn answer text representation for quality prediction, but also take structural features, user attribute features and textual features as extended features, and add them to the text representation of the answers after different model training step by step, so as to compare the influence of different extended features on the quality prediction of the answers.
The important issue for this research is whether the models proposed in this paper performs better in semantic match and achieves answer quality prediction. In the next sub-sections, we will discuss the advantages of the model and the task specific set up.
5.4.1 Evaluation and Comparison
Tab. 3 shows the evaluation values of different models compared with the models proposed in this paper. From the evaluation values of Tab. 3, it can be known that the machine learning model SVM and Random Forest do not have the advantage in capturing text semantics, while the mainstream deep learning model has significant advantages. Compared with the mainstream deep learning model, the model proposed in this paper has a better performance in the prediction of the answer quality in the Auto Home CQA. It verified the validity of the proposed model. Experiments show that the introduction of attention mechanism can effectively measure the semantic match between Q&A pairs and capture the deep semantic representation of text. In addition, the predictive power of the model has improved significantly after adding extended features step by step. It indicates that the extended features, as the supplementary features of the answer text, contribute greatly to the answer quality prediction task.
Table 3: Evaluation value of comparative experiment
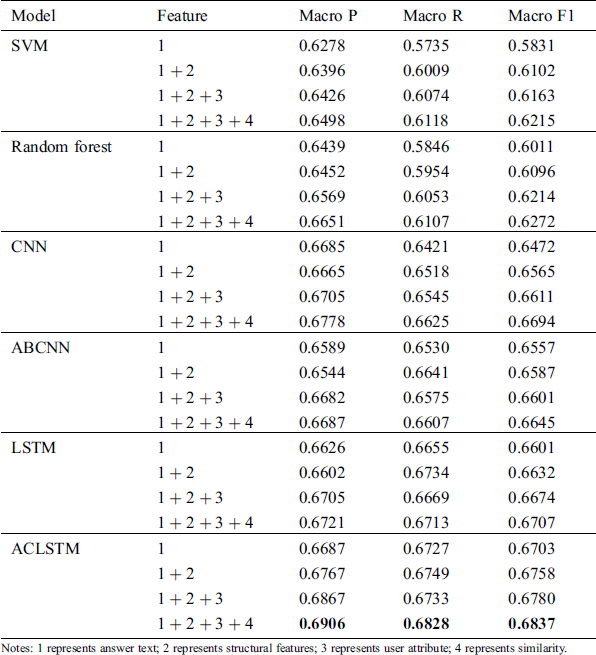
Fig. 2 is the comparison of F1 score among different answer quality categories with SVM, Random Forest, CNN, ABCNN, LSTM and the model proposed in this paper. From the figure, it can be seen that SVM and Random Forest have no advantage in capturing the text semantics of the answers compared to the deep learning model. CNN, ABCNN, LSTM, and the model proposed in this paper have comparable predictive ability to low, high-quality answers, and generally low prediction ability for medium-quality answers. However, compared with other models, the model presented in this paper shows better predictive ability in predicting medium-quality answers, which is significantly better than other models. It shows that attention mechanism can learn the semantic information between Q&A, by integrating the question text with the semantic information covered by the answer text, the model can better distinguish between medium-quality answers whose features are not significant but are consistent with the text of the question.
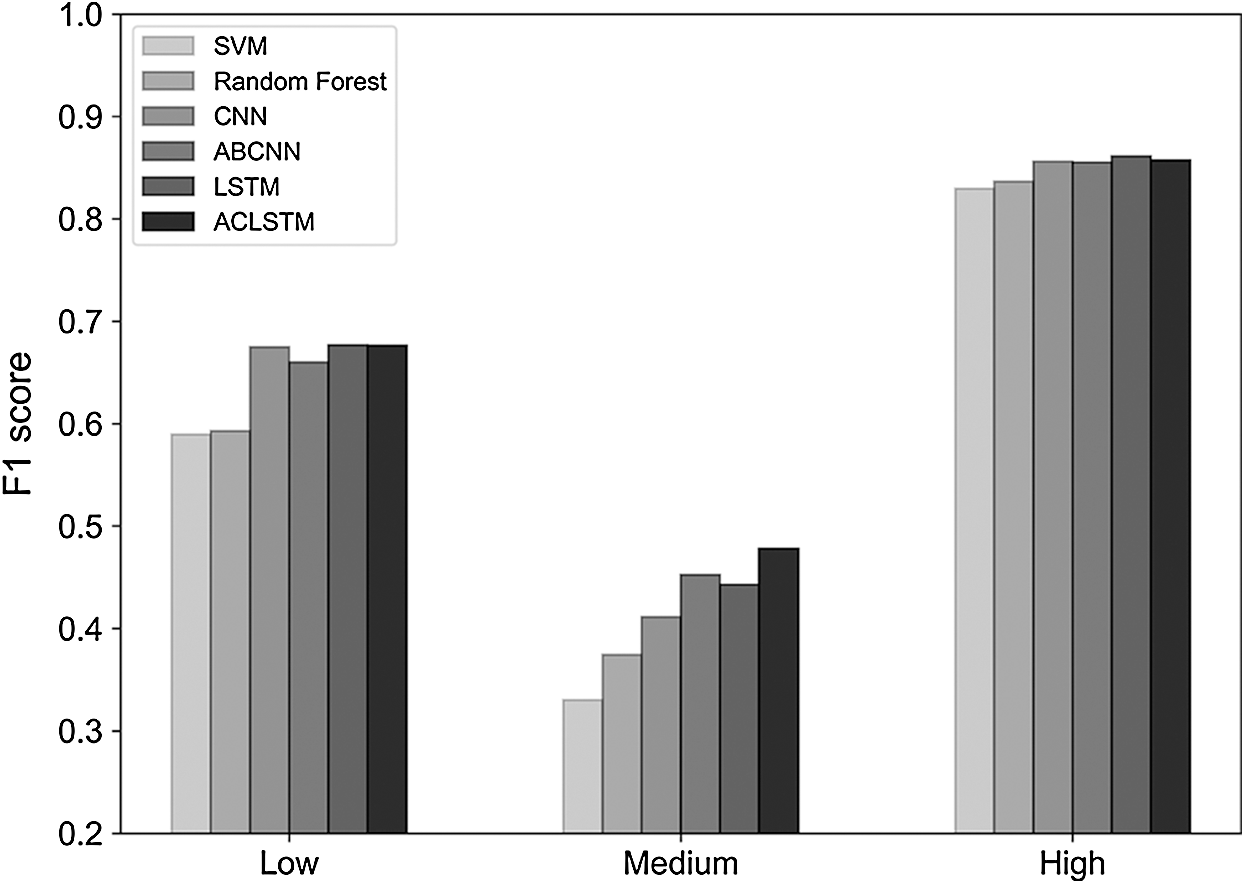
Figure 2: Comparison of F1 score among different answer quality categories
5.4.2 The Choice of Different Sources of Q&A Pairs
To better measure the semantic matching between Q&A pairs and the validity of the model, this paper uses three different sources of Q&A pairs of vector representation to calculate cosine similarity of the two, as a supplementary extended feature:
1.Sim1. Same as Section 4.1 textual features, by using the average word vector of Q&A pairs, calculate the cosine similarity of the two.
2.Sim2. In the representation layer of the model, the cosine similarity is calculated by using the max-pooling word vector representation of Q&A pairs.
3.Sim3. Calculate the cosine similarity by using the vector representation of Q&A pairs after model learning.
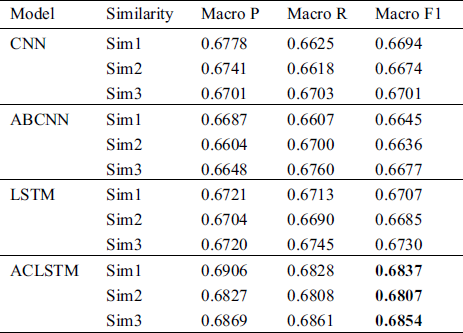
Tab. 4 shows the comparative experimental results of CNN, ABCNN, LSTM and the model proposed in this paper with different similarity degrees based on the existing extended features. The results show that the model with Sim3 has the best performance, and followed by Sim1, and Sim2 is relatively poor. It indicates that vector representation of Q&A pairs without model learning covers less semantic information, while vector representation of Q&A pairs with model learning has deeper semantic information. Particularly, the model proposed in this paper is optimal. It can combine the semantic information covered by the question text with the answer text to better measure the match between the Q&A pair. In addition, the matching of Q&A pairs measured by average word vectors is better than the max-pooling.
Table 4: Experimental results of different similarity
5.4.3 The Effect of Different Length of Answer Text
This paper also discusses the effect of different lengths of answer text on the model to reduce computational complexity. The histogram in Fig. 3 shows the text length distribution of the answer text after word segmenting for all samples. Based on Fig. 3, it can be seen that answers with text length less than 300 account for about 99.25% of the total sample. Therefore, answers with text lengths of 10, 50, 100, 200 and 300 are selected for comparative experiments. Since Samples with answer text lengths less than 1000 account for about 99.98% of the total sample, comparison experiment with a text length of 1000 was also added. When the answer text length is less than the fixed length, it is filled with zero. On the contrary, the answer text is truncated when its length is greater than the fixed length. Fig. 4 shows the effect of different lengths of answer text on the model. As can be seen from Fig. 4, when the text length of the answer is 10 to 300, the evaluation values gradually rise; when the answer text length is greater than 300, the evaluation values tend to level off. Therefore, the text fixed length is set to be 300.
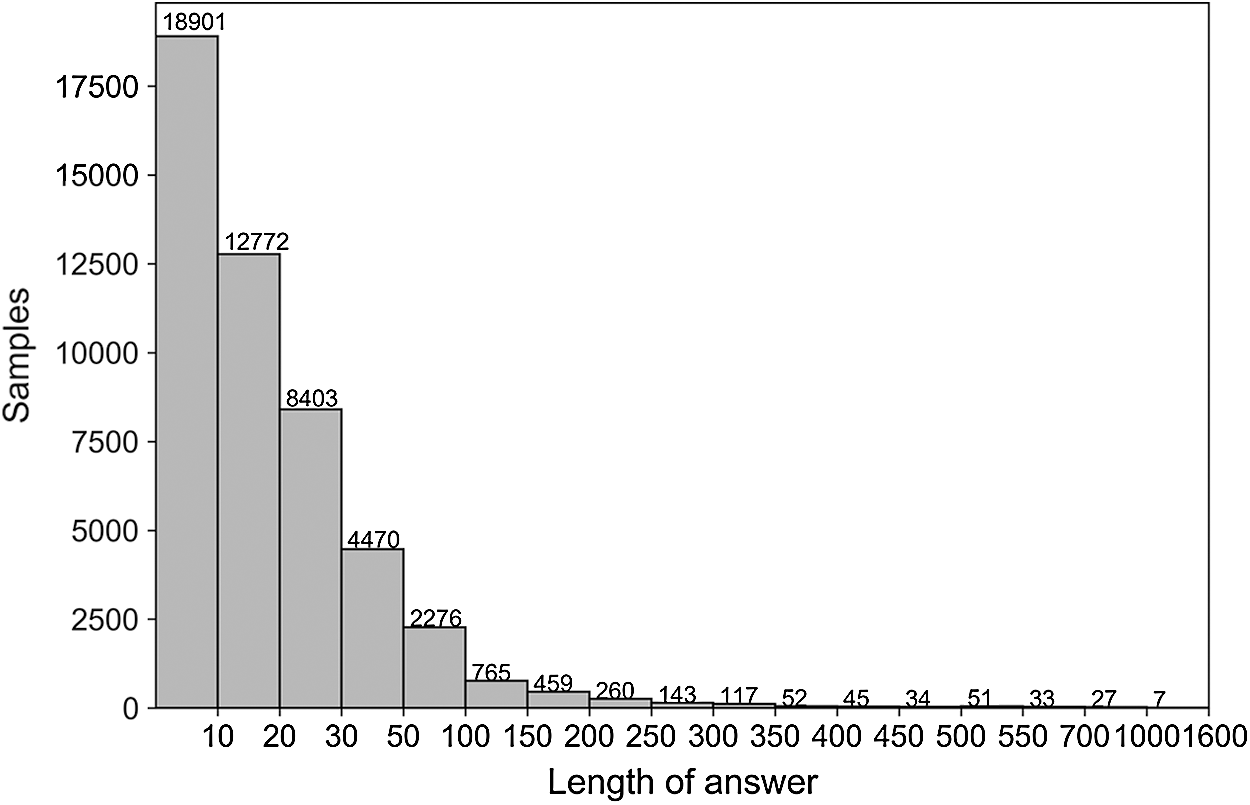
Figure 3: Answer text histogram of different length
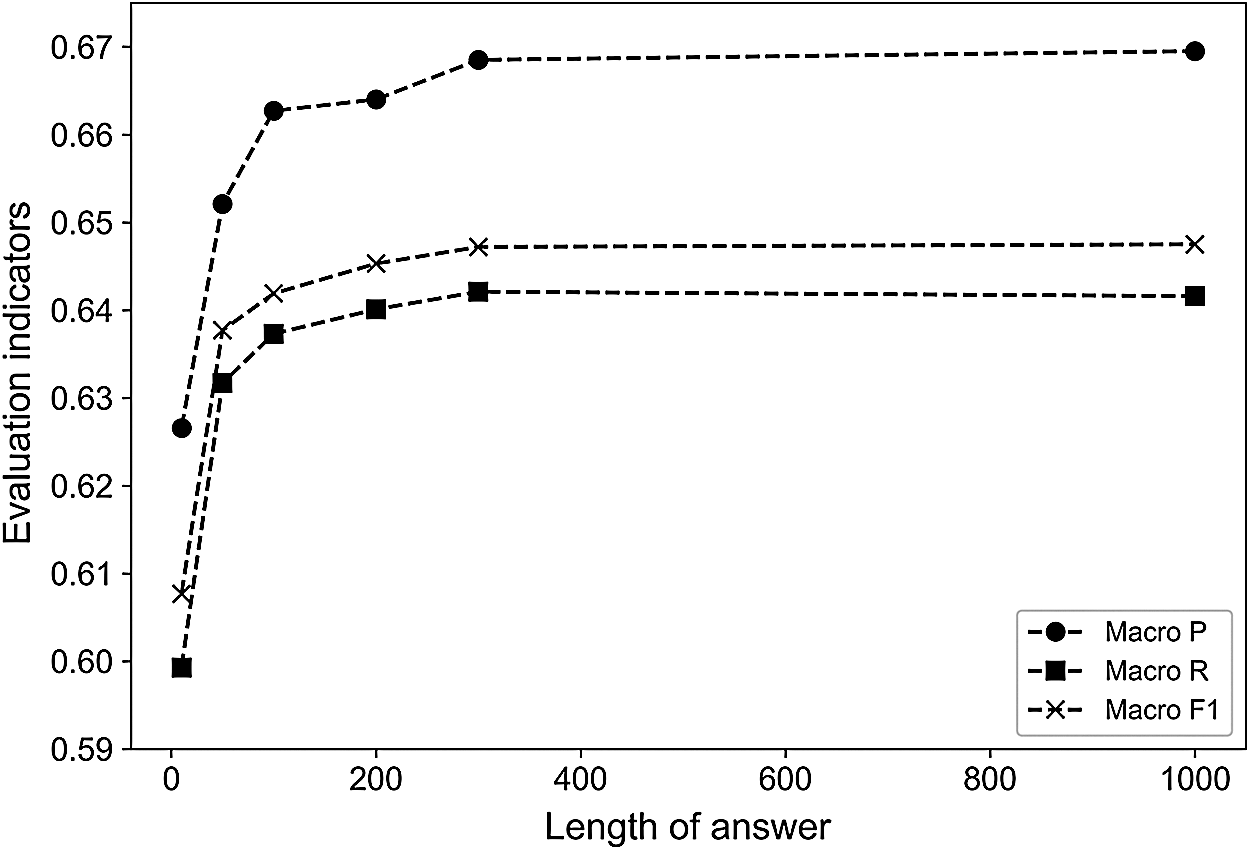
Figure 4: The effect of different lengths of answer text on the model
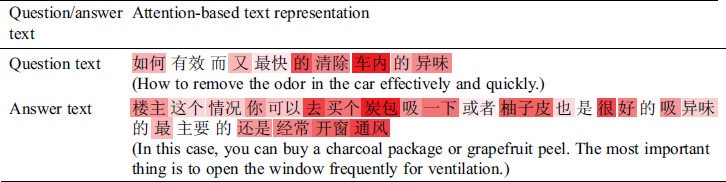
Fig. 5 is a visual display of the attention matrix of a test sample. Tab. 5 is the text representation for the attention-based Q&A. Based on Fig. 5 and Tab. 5, the model can well capture the part related to the semantic meaning of “peculiar smell,” such as “charcoal package,” “grapefruit peel,” “open the window” and “ventilation.” It further clearly shows that the answer quality prediction model proposed in this paper can better learn the dependence between the Q&A pair and better measure the semantic match between them.
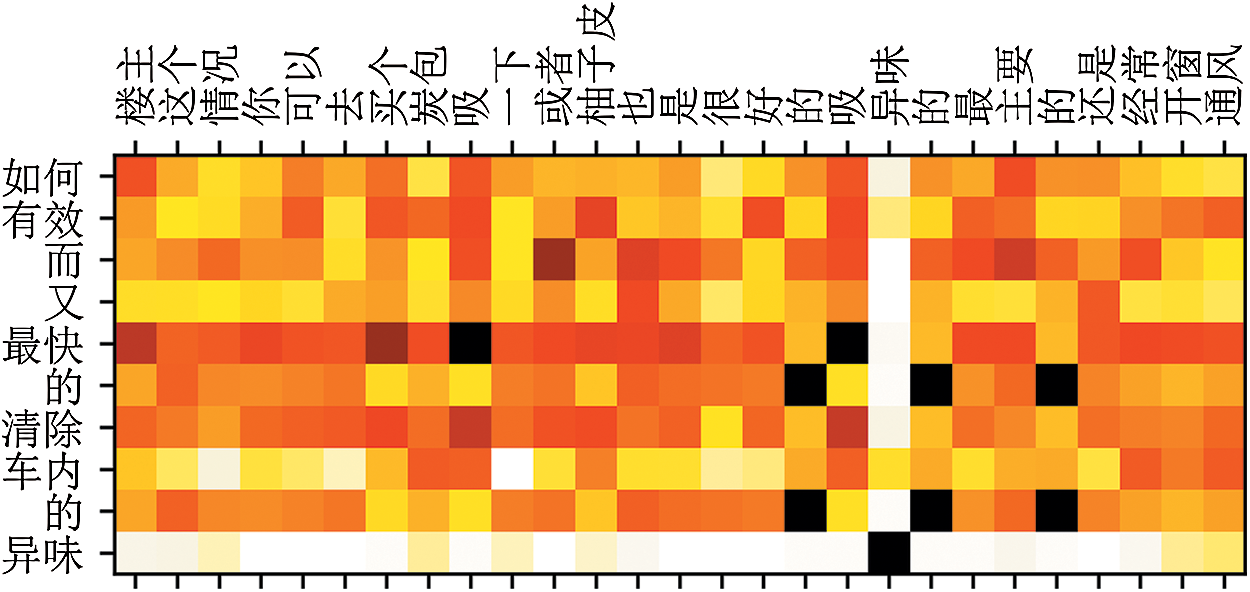
Figure 5: Attention matrix visualization
Table 5: Attention-based text representation visualization
Aiming at the existing problems such as the quality of the answers is uneven, the automatic question answering service is unable to specifically analyzed questions and address individualized user needs, user experience is undermined, etc., this paper takes the Auto Home CQA as the research object, proposes an answer quality prediction model based on question-answer joint learning to filter out high-quality answers that fit the question from the content edited by the respondent. This paper uses CNN based on attention mechanism to learn semantic information of Q&A pairs and extract the local joint features of Q&A pairs, and uses LSTM to extract long-term dependence features of Q&A pairs. The vector representation of obtained Q&A pairs has deep semantic information and can better measure the match between the Q&A pairs. The prediction performance of the model can be further improved by constructing multiple valid extended features.
However, there are still limitations in this paper: the extended feature constructed based on Auto Home CQA is not universal. In the future study, we will further consider the introduction of multiple generic extended features, such as relative position order of the answers, emotional polarity of question / answer texts, etc. Moreover, the prediction ability of the model for medium-quality answers still needs to be further improved.
Acknowledgement: The authors are thankful to their colleagues, especially Z. Chen, Y. L. Zhang and Y. F. Cen who provided expertise that greatly during the research.
Funding Statement: This research was supported by the Zhejiang Provincial Natural Science Foundation of China under Grant No. LGF18F020011.
Conflicts of Interest: The authors declare that they have no conflicts of interest to report regarding the present study.
References
1T. Sakai, D. Ishikawa, N. Kando, Y. Seki, K. Kuriyama et al.. (2011). , “Using graded-relevance metrics for evaluating community QA answer selection. ,” in Proc. ACM Int. Conf. on Web Search and Data Mining, Hong Kong, China: , pp, 187–196, .
2H. Y. Fu, S. H. Wu and S. Oh. (2015), “Evaluating answer quality across knowledge domains: Using textual and non-textual features in social Q&A. ,” in Proc. Association for Information Science and Technology, St. Louis, MO, USA: , pp, 1–5, . [Google Scholar]
3C. Shah and J. Pomerantz. (2010), “Evaluating and predicting answer quality in community QA. ,” in Proc. Int. ACM SIGIR Conf. on Research and Development in Information Retrieval, Geneva, Switzerland: , pp, 411–418, . [Google Scholar]
4F. Calefato, F. Lanubile, M. C. Marasciulo and N. Novielli. (2015), “Mining successful answers in stack overflow. ,” in Proc. Working Conf. on Mining Software Repositories, Florence, Italy: , pp, 430–433, . [Google Scholar]
5J. Liu, H. Shen and L. Yu. (2017), “Question quality analysis and prediction in community question answering services with coupled mutual reinforcement. ,” IEEE Transactions on Services Computing, vol. 10, no. (2), pp, 286–301, . [Google Scholar]
6A. Y. Xu, Z. C. Ji and B. Wang. (2017), “Answer quality predicting on based on the answering order in community question answering. ,” Journal of Chinese Information Processing, vol. 31, no. (2), pp, 132–138, . [Google Scholar]
7J. L. Speiser, M. E. Miller, J. Tooze and E. Ip. (2019), “A comparison of random forest variable selection methods for classification prediction modeling. ,” Expert Systems with Applications, vol. 134, no. (15), pp, 93–101, . [Google Scholar]
8F. Li, S. R. Zhou, J. M. Zhang, D. Y. Zhang and L. Y. Xiang. (2013), “Attribute-based knowledge transfer learning for human pose estimation. ,” Neurocomputing, vol. 116, pp, 301–310, . [Google Scholar]
9H-T. Shiao, V. Cherkassky, J. Lee, B. Veber, E. E. Patterson et al.. (2017). , “SVM-based system for prediction of epileptic seizures from iEEG signal. ,” IEEE Transactions on Biomedical Engineering, vol. 64, no. (5), pp, 1011–1022, . [Google Scholar]
10Y. Chen, J. Xiong, W. Xu and J. Zuo. (2019), “A novel online incremental and decremental learning algorithm based on variable support vector machine. ,” Cluster Computing, vol. 22, no. (3), pp, 7435–7445, . [Google Scholar]
11Z. Zhang, Y. B. Li, C. Wang, M. Y. Wang, Y. Tu et al.. (2018). , “An ensemble learning method for wireless multimedia device identification. ,” Security and Communication Networks, vol. 2018, pp, 5264526, . [Google Scholar]
12G. Gkotsis, K. Stepanyan, C. Pedrinaci, J. Domingue and M. Liakata. (2014), “It’s all in the content: State of the art best answer prediction based on discretisation of shallow linguistic features. ,” in Proc. ACM Web Science Conf., Bloomington, Indiana, USA: , pp, 202–210, . [Google Scholar]
13F. Calefato, F. Lanubile and N. Novielli. (2016), “Moving to stack overflow: Best-answer prediction in legacy developer forums. ,” in Proc. ACM/IEEE Int. Sym. on Empirical Software Engineering and Measurement, Ciudad Real, Spain: , pp, 1–10, . [Google Scholar]
14C. Li, W. H. Chao, X. M. Chen and Z. J. Li. (2011), “Quality evaluation and prediction for question and answer in Chinese community question answering. ,” Computer Science, vol. 38, no. (6), pp, 230–236, . [Google Scholar]
15W. Wang, Y. Q. Ji, H. W. Wang and L. J. Zheng. (2017), “Evaluating Chinese answers’ quality in the community QA system: A case study of Zhihu. ,” Library and Information Service, vol. 61, no. (22), pp, 36–44, . [Google Scholar]
16H. C. Wu, Z. H. Tian, W. Wu and E. H. Chen. (2017), “An unsupervised approach for low-quality answer detection in community question-answering. ,” in Proc. Int. Conf. on Database Systems for Advanced Applications, Suzhou, China: , pp, 85–101, . [Google Scholar]
17Y. Gui and G. Zeng. (2020), “Joint learning of visual and spatial features for edit propagation from a single image. ,” Visual Computer, vol. 36, no. (3), pp, 469–482, . [Google Scholar]
18Y. Tu, Y. Lin, J. Wang and J. U. Kim. (2018), “Semi-supervised learning with generative adversarial networks on digital signal modulation classification. ,” Computers, Materials & Continua, vol. 55, no. (2), pp, 243–254, . [Google Scholar]
19S. R. Zhou and B. Tan. (2020), “Electrocardiogram soft computing using hybrid deep learning CNN-ELM. ,” Applied Soft Computing, vol. 86, 105778. [Google Scholar]
20M. T. Sun, L. Liu and H. Chen. (2018), “An answer quality evaluation algorithm based on semantic in community-based question answering. ,” in Proc. Int. Conf.on Natural Computation, Fuzzy Systems and Knowledge Discovery, Huangshan, China: , pp, 971–978, . [Google Scholar]
21S. P. Suggu, K. N. Goutham, M. K. Chinnakotla and M. Shrivastava. (2016), “Hand in glove: Deep feature fusion network architectures for answer quality prediction in community question answering. ,” in Proc. Int. Conf. on Computational Linguistics: Technical Papers, Osaka, Japan: , pp, 1429–1440, . [Google Scholar]
22X. Zhou, B. Hu, Q. Chen and X. Wang. (2018), “Recurrent convolutional neural network for answer selection in community question answering. ,” Neurocomputing, vol. 274, pp, 8–18, . [Google Scholar]
23W. Yin, H. Schütze, B. Xiang and B. Zhou. (2016), “ABCNN: Attention-based convolutional neural network for modeling sentence pairs. ,” Transactions of the Association for Computational Linguistics, vol. 4, no. (1), pp, 566–567, . [Google Scholar]
24T. Mikolov, K. Chen, G. Corrado and J. Dean. (2013), “Efficient estimation of word representations in vector space. ,” in Proc. Int. Conf. on Learning Representations, Scottsdale, Arizona: , pp, 1–12, . [Google Scholar]
25S. Hochreiter and J. Schmidhuber. (1997), “Long short-term memory. ,” Neural Computation, vol. 9, no. (8), pp, 1735–1780, . [Google Scholar]
26J. Cai, J. Luo, S. Wang and S. Yang. (2018), “Feature selection in machine learning: A new perspective. ,” Neurocomputing, vol. 300, pp, 70–79, . [Google Scholar]
27Y. Shen, J. Li, Z. Zhu, W. Cao and Y. Song. (2015), “Image reconstruction algorithm from compressed sensing measurements by dictionary learning. ,” Neurocomputing, vol. 151, pp, 1153–1162, . [Google Scholar]
28Y. Song, G. Yang, H. Xie, D. Zhang and S. Xingming. (2017), “Residual domain dictionary learning for compressed sensing video recovery. ,” Multimedia Tools and Applications, vol. 76, no. (7), pp, 10083–10096, . [Google Scholar]
29P. Cao, X. Liu, J. Yang, D. Zhao, W. Li et al.. (2017). , “A multi-kernel based framework for heterogeneous feature selection and over-sampling for computer-aided detection of pulmonary nodules. ,” Pattern Recognition, vol. 64, pp, 327–346, . [Google Scholar]
30M. J. Liu, X. F. Zhang and Y. Yan. (2016), “Research on method of determining scope of word set in co-word analysis based on word frequency, number of words, cumulative word frequency in proportion. ,” Library and Information Service, vol. 60, no. (23), pp, 135–142, . [Google Scholar]
31T. H. Chang, H. C. Chen, Y. H. Tseng and J. L. Zheng. (2013), “Automatic detection and correction for Chinese misspelled words using phonological and orthographic similarities. ,” in Proc. SIGHAN Workshop on Chinese Language Processing, Nagoya, Japan: , pp, 97–101, . [Google Scholar]
32M. W. Feng, X. Bing, M. R. Glass, L. Wang and B. W. Zhou. (2015), “Apply deep learning to answer selection: A study and an open task. ,” in Proc. IEEE Automatic Speech Recognition and Understanding Workshop, Scottsdale, AZ, USA: , pp, 813–820, . [Google Scholar]
 | This work is licensed under a Creative Commons Attribution 4.0 International License, which permits unrestricted use, distribution, and reproduction in any medium, provided the original work is properly cited. |