| Congenital Heart Disease |
DOI: 10.32604/CHD.2021.014462
ARTICLE
Systolic and Diastolic Strain Measurements Show Left Ventricular Dysfunction in Women with Turner Syndrome
1Department of Congenital Cardiology, Erasmus MC, Rotterdam, Netherlands
2Department of Cardiology, Radboud University Medical Center, Nijmegen, Netherlands
3Department of Cardiology, Leiden University Medical Center, Rotterdam, Netherlands
*Corresponding Author: Annemien E. van den Bosch. Email: a.e.vandenbosch@erasmusmc.nl
Received: 29 September 2020; Accepted: 07 February 2021
Abstract: Aim: This study aimed to describe the systolic left ventricular global longitudinal strain (LvGLS) and left ventricular peak early diastolic strain rate (Sre) in adult women with Turner syndrome (TS) and to determine its relationship with exercise capacity and clinical parameters. Methods: In this cross-sectional cohort study, consecutively included adult TS women underwent an electrocardiogram, transthoracic echocardiogram (TTE) and cardiopulmonary exercise test (CPET) on the same day. LvGLS and Sre were measured using 2D speckle tracking analysis (STE) and compared with age-matched healthy female controls. Results: Ninety-four adult women (age 36 ± 13 years) with TS and 32 healthy age-matched female controls were included. Women with TS had a significantly impaired/reduced systolic LvGLS (–17.82 ± 2.98% vs. –21.80 ± 1.85%, p < 0.001) and Sre (0.98 ± 0.32 s-1 vs. 1.27 ± 0.19 s-1, p > 0.001), compared to healthy female controls. Furthermore, TS women had reduced diastolic function as measured by conventional echocardiographic parameters: A higher A-wave (p < 0.001), lower E/A-ratio (p = 0.001), longer deceleration time (p = 0.006), and a higher E/E’-ratio (p < 0.001). Women with TS also had a significantly reduced maximal workload (p = 0.033), reduced oxygen uptake (p < 0.001) and a reduced maximal heart rate (p < 0.001) during exercise. Multivariable linear regression analysis revealed that Age, karyotype and QT-duration were significantly associated with Sre, but not with LvGLS, in the TS population. Conclusion: Systolic and diastolic strain and exercise capacity were significantly reduced in TS women compared to healthy women. No correlation between strain itself and exercise capacity could be demonstrated, but correlations with conventional TTE parameters and baseline characteristics were found.
Keywords: Turnersyndrome; speckletracking echocardiography; strain; exercise capacity
Turner syndrome (TS) is caused by a partial or complete loss of the X chromosome and affects approximately 1 in 2000 live-born girls [1]. Besides the classical features, such as short stature and gonadal dysgenesis, these women have an increased risk of cardiovascular disease which is an important cause of morbidity and mortality among TS patients [1,2]. Common congenital heart defects are bicuspid aortic valve (BAV; 25%–39%) [3,4], coarctation of the aorta (CoA; 12%–16%) [3], and partial abnormal pulmonary venous return (PAPVR; 18%–25%) [5,6]. These congenital heart defects may affect left ventricular (LV) function [7]. However, TS has also been associated with increased LV mass and reduced LV dysfunction independent of congenital heart disease [8–10]. The etiology of this predominantly sub-clinical LV impairment that exists in absence of hypertension or poor metabolic control remains enigmatic [8,9]. To date there is very little data on left ventricular global longitudinal strain (LV GLS) and LV diastolic strain rate (Sre) in adult women with Turner syndrome. And studies that did examine left ventricular function in TS patients were often done using conventional echocardiography [9,11]. Where conventional echocardiography may not be able to detect early sub-clinical LV dysfunction and children may not have developed dysfunction yet. Therefore, this study uses deformation measurements by 2D speckle-tracking echocardiography (STE) which may offer advantages, such as angle independency, over conventional echocardiographic markers for diastolic dysfunction [12–14]. Moreover, the myocardial deformation parameters as LvGLS and Sre have not yet been comprehensively described in adult women with TS. Furthermore, the effect of sub-clinical LV dysfunction on exercise capacity has not yet been described in a TS population, whereas this effect is well-studied in non-TS cohorts [15,16]. While these effects may be clinically relevant, especially in a population that often struggles with unexplained fatigue [17]. Therefore, the aims of this study are threefold; firstly, to comprehensively describe systolic (LvGLS) and diastolic LV function (Sre) using STE and compare it to age and gender matched controls. Secondly, to determine exercise capacity in women with TS. Finally, we aim to investigate possible relation between left ventricular function and exercise parameters.
2.1 Study Population and Design
In this multi-center, cross-sectional study 94 consecutive adult women with genetically proven TS were included from October 2014 to April 2016. All patients underwent a physical examination, transthoracic echocardiogram (TTE), electrocardiogram (ECG) and a cardio pulmonary exercise test (CPET) on a bike ergometer on the same day. Electronic patient records were used to collect medical history. A total of 32 age-matched healthy women were selected from a cohort study consisting of 155 healthy volunteers to serve as control group. All healthy controls were free from a history of systemic disease, cardiovascular disease, renal dysfunction or cardiac medication use. Details of this control cohort have been described previously [7]. Hypertension was defined as the prescription of antihypertensive medication or an elevated blood pressure (systolic >140 mmHg and/or diastolic blood pressure >90 mmHg). Hypercholesterolemia and diabetes were defined as the requirement for treatment. Body surface area was determined using the DuBois formula [18]. This study was approved by the medical ethical committee of the Erasmus Medical Center. Written informed consent was obtained from all participants.
Two-dimensional greyscale images were obtained by two experienced sonographers using the ultrasound system iE33 (Philips Medical Systems, Best, The Netherlands) equipped with a S5-1 transducer (1-MHz to 5-MHz, frequency transmitted 1.7 MHz, frequency received 3.4 MHz). A minimum framerate of 60 Hz is obtained to optimize the speckle tracking echocardiograph. Digital images are stored in QLAB workstation (Philips Medical Systems) for further analysis.
Dimensional and functional measurements were done according to the recommendations for cardiac chamber quantification in adults [19]. The mitral- and aortic valve regurgitation were visually graded as none, mild, moderate or severe. Ejection fraction was visually graded as reduced, mildly reduced or good. Left ventricular strain analysis using STE was done by Allard T. van den Hoven and Sultan Yilmazer, blinded to patient specific information. 2D-speckle tracking analysis was done using Tomtec Imaging Systems (2D Cardiac Performance Analysis). Feasibility was assessed by both observers, in case of insufficient imaging quality patients were excluded from further analysis. The peak systolic LV GLS, defined as the maximum strain value during the ejection, was calculated from the apical four-, three- and two-chamber views according to the guidelines of the American Society of Echocardiography and the European Association of Cardiovascular Imaging [19]. Also, LV global longitudinal early diastolic strain rate (Sre) was assessed as the maximum strain rate during early diastole. Sre was calculated for each apical chamber view by averaging the segmental Sre values. The myocardial contours, both end diastolic and end-systolic, are drawn automatically by the software. Contours were checked during the full cardiac cycle and manually adjusted if necessary.
2.2.3 Electrocardiogram and Cardiopulmonary Exercise Test
Participants underwent a 12-lead standard resting electrocardiogram (ECG) and a symptom-limited cardiopulmonary bike exercise test (CPET) including a breath-by-breath analysis. The diastolic and systolic blood pressure was measured at rest, and at maximal exertion. All parameters are determined according to the ATS/ACCP guidelines [20]. Individual standardized reference value are calculated according to the CPET-protocol used in our center using the formula for women: ((2 × length –2.37 × age −73) × 1.01 + 16,6) × 0.8. A workload or VO2max lower than 85% of the predicted value is considered as reduced exercise capacity. The reference group did not complete a bike ergometry as this was a retrospective cohort and this was not included in the protocol at the time of inclusion
Continuous variables are reported as mean ± standard deviation (SD) when normally distributed, and as median and IQR in case of a non-normal distribution. Categorical variables are expressed in frequencies and percentages. Differences between two groups are compared by using the Student unpaired T-test when normally distributed and the Mann-Whitney U test in case of a non-normal distribution. Furthermore, differences between two measurements in a group were compared by using the paired T-test. Correlation analysis is performed by Pearson or Spearman correlation test, as appropriate. Univariable linear regression analysis and subsequent stepwise multivariable linear regression analysis (p < 0.10) was performed to identify patient characteristics that are significantly associated with LV function and exercise capacity. In case of collinearity of variables, we entered the variable with the strongest correlation with the outcome into the multivariate linear regression analysis. A p-value of <0.05 is considered statistically significant. The inter-observer variability was analyzed by using the Bland-Altman analysis. The limits of agreement between two observers were defined as the mean of the differences ±1.96 SD. The coefficient of variation (COV) was calculated as the ratio of the standard deviation of the mean difference to the mean of the two measurements. All statistical analyses were performed with the Statistical Package for Social Sciences, Version 21.0 (SPSS, Chicago, Illinois).
3.1 Characteristics of the Study Population
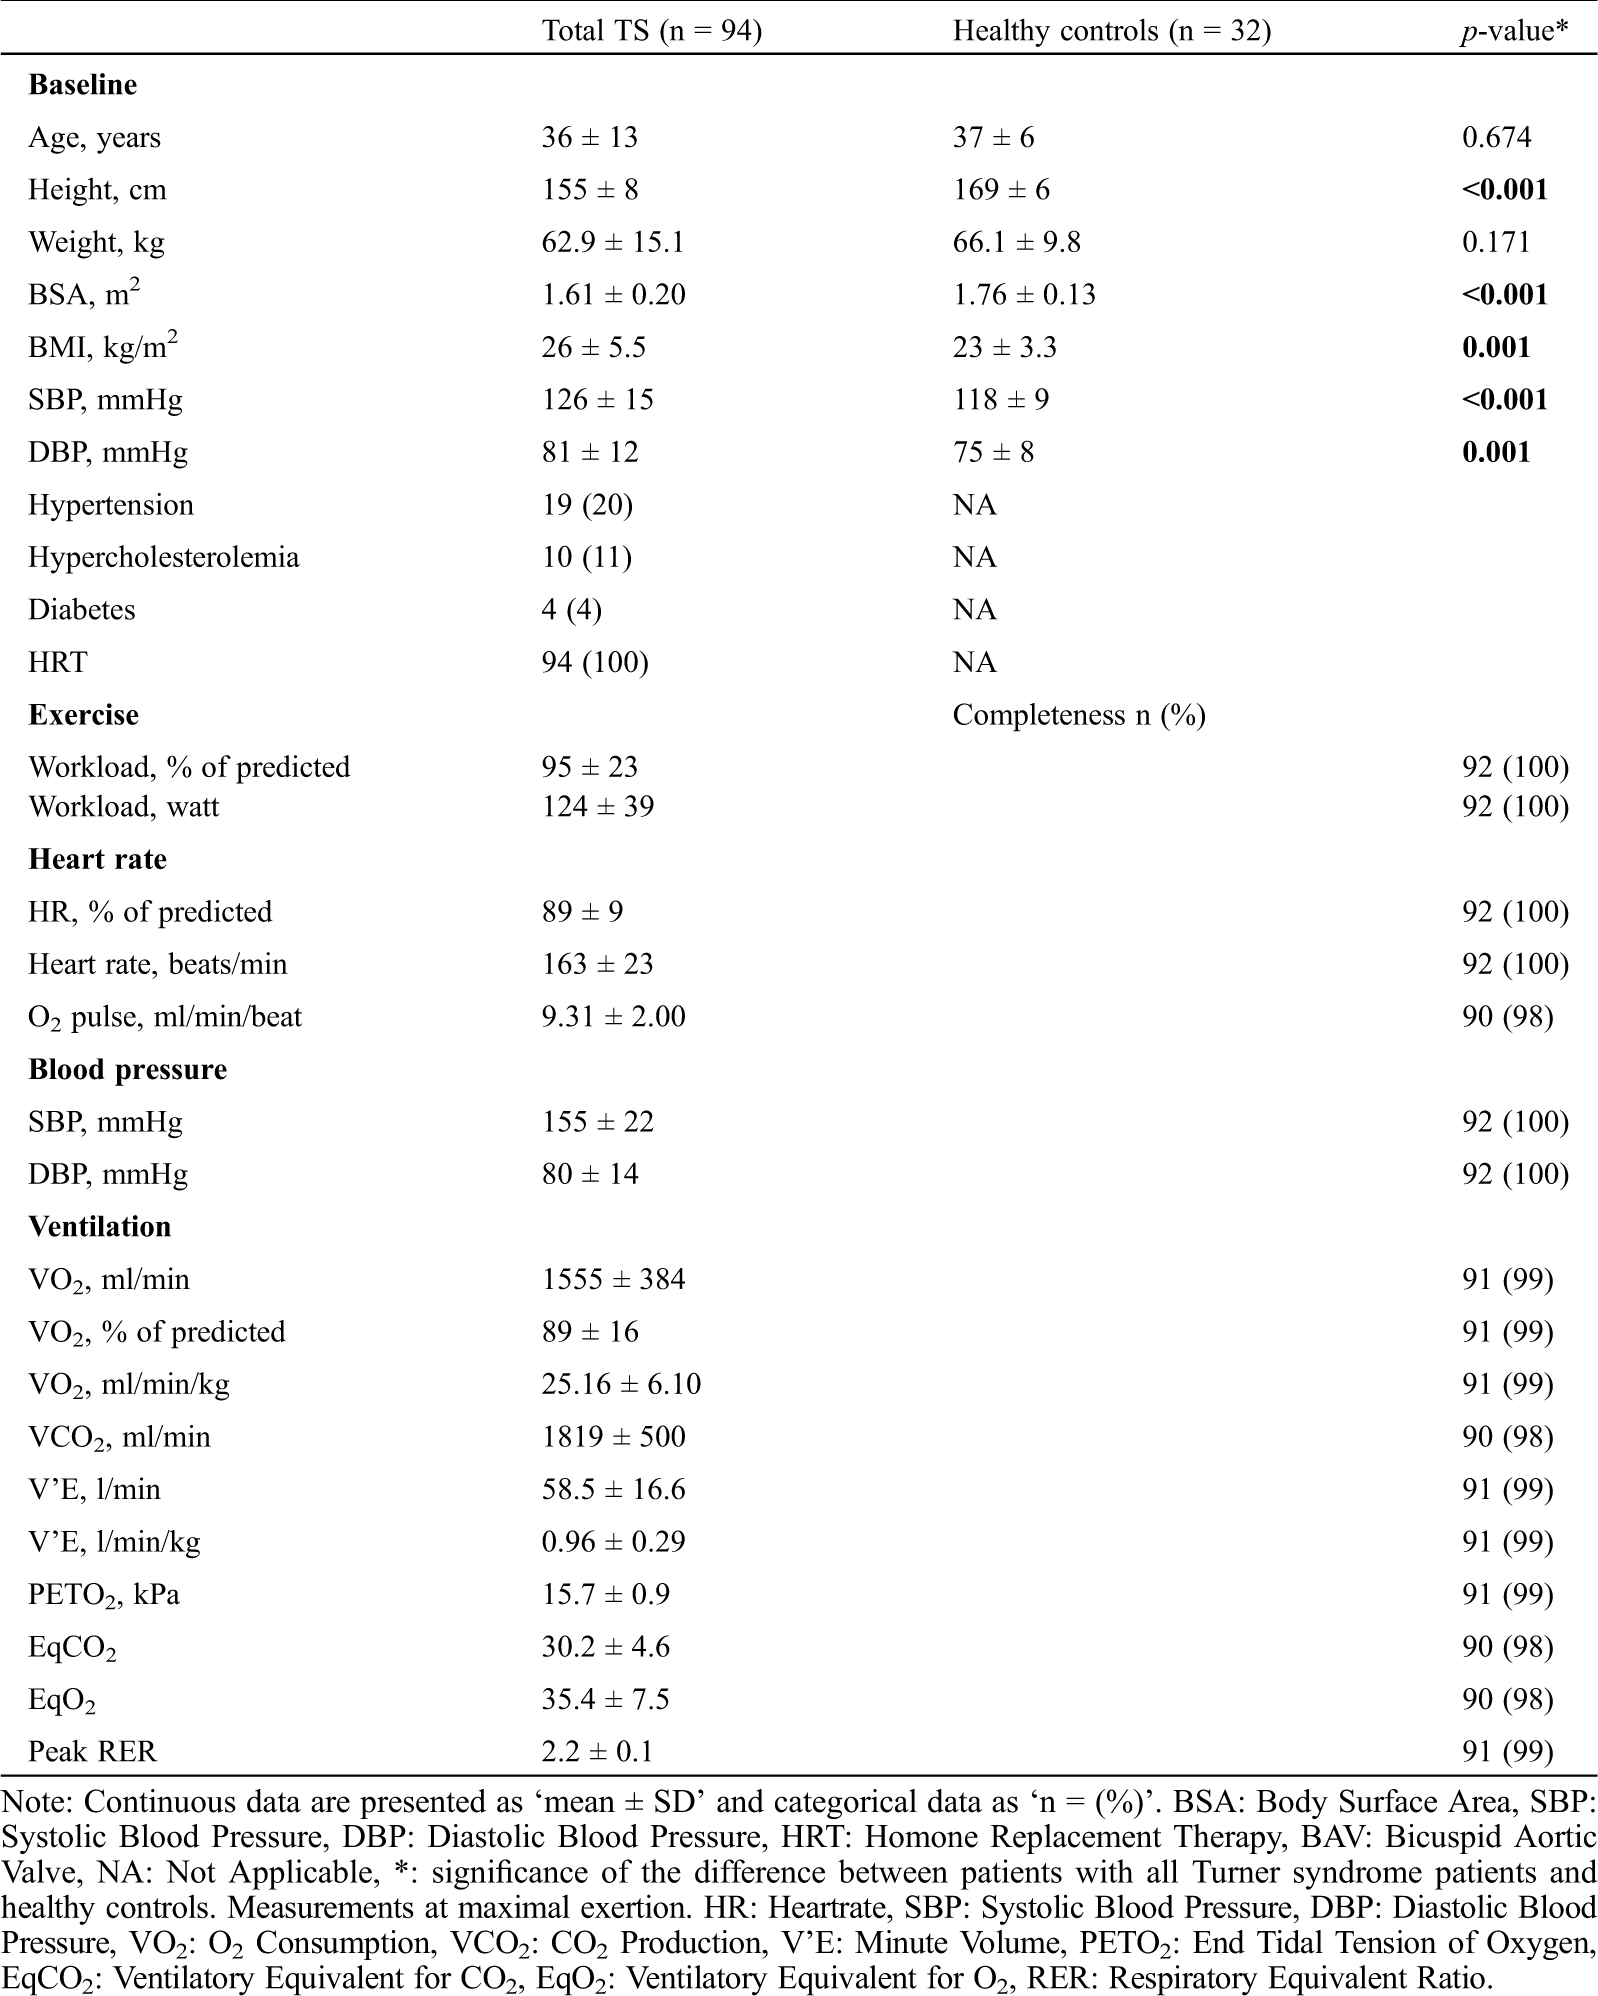
Ninety-four adult women with TS (mean age 36 ± 13 years, all female) were included. The control group consisted of 32 healthy women (mean age 37 ± 6 years). Forty-four women had a monosomy X, 14 had a mosaicism, other karyotypes included isochromosome (n = 14), polyploidy (n = 5), ring chromosome (n = 3), deletion (n = 3), derivative (n = 2).
Of these women, 41 (44%) were known with structural heart disease, such as BAV (n = 27), PAPVR (n = 13), CoA (n = 9), persistent left vena cava superior (n = 4), arteria lusoria (n = 3), persistent ductus arteriosus (n = 2), persistent foramen ovale (n = 3), hypoplastic aortic arch (n = 1), aortic stenosis (n = 1), pulmonary atresia (n = 1), incomplete double aortic arch (n = 1) or tetralogy of Fallot (n = 1). Baseline characteristics for TS patients and healthy controls are shown in Tab. 1. There was no difference in baseline characteristics between TS women with and without structural heart disease. Moreover, eight TS women (9%) had underwent aortic intervention at moment of inclusion including: Coarctation repair (n = 6), coarctation repair and a graft replacement of the aortic root (n = 1), and coronary artery bypass grafting (n = 1). Furthermore, seven patients (7%) had underwent valve intervention. There were 23 (24%) TS women using cardiovascular medication: Statin (n = 8), angiotensin ll receptor blockers (n = 6), beta-blockers (n = 8) or angiotensin converting enzyme inhibitors (n = 7).
Table 1: Baseline characteristics
3.2 Systolic and Diastolic Myocardial Deformation Measurements
Twelve TS patients (13%) and one healthy control (3%) had to be excluded from strain analysis in advance because of poor imaging quality. Women with TS had a significantly impaired systolic LvGLS (−17.82% ± 2.98% vs. –21.80% ± 1.85%, p < 0.001; Fig. 1A) and diastolic Sre (0.98 ± 0.32 s-1 vs. 1.27 ± 0.19 s-1, p > 0.001; Fig. 1B) compared to healthy female controls. Furthermore, 28 TS women (30%) had a systolic LvGLS below normal (<17% [19]). When compared with the lower limit of normal for their age group (<0.89 s-1, [21]), 35 TS patients (37%) had a low Sre value. The intra-observer variability analysis showed low mean differences and good correlation for systolic LvGLS (0.31% ± 1.36, Pearson’s R: 0.885, p-value<0.001, Appendix A: Supplementary Fig. 1) and Sre (–0.07 s-1 ± 0.19, Pearson’s R: 0.817, p-value<0.001, Appendix A: Supplementary Fig. 1).
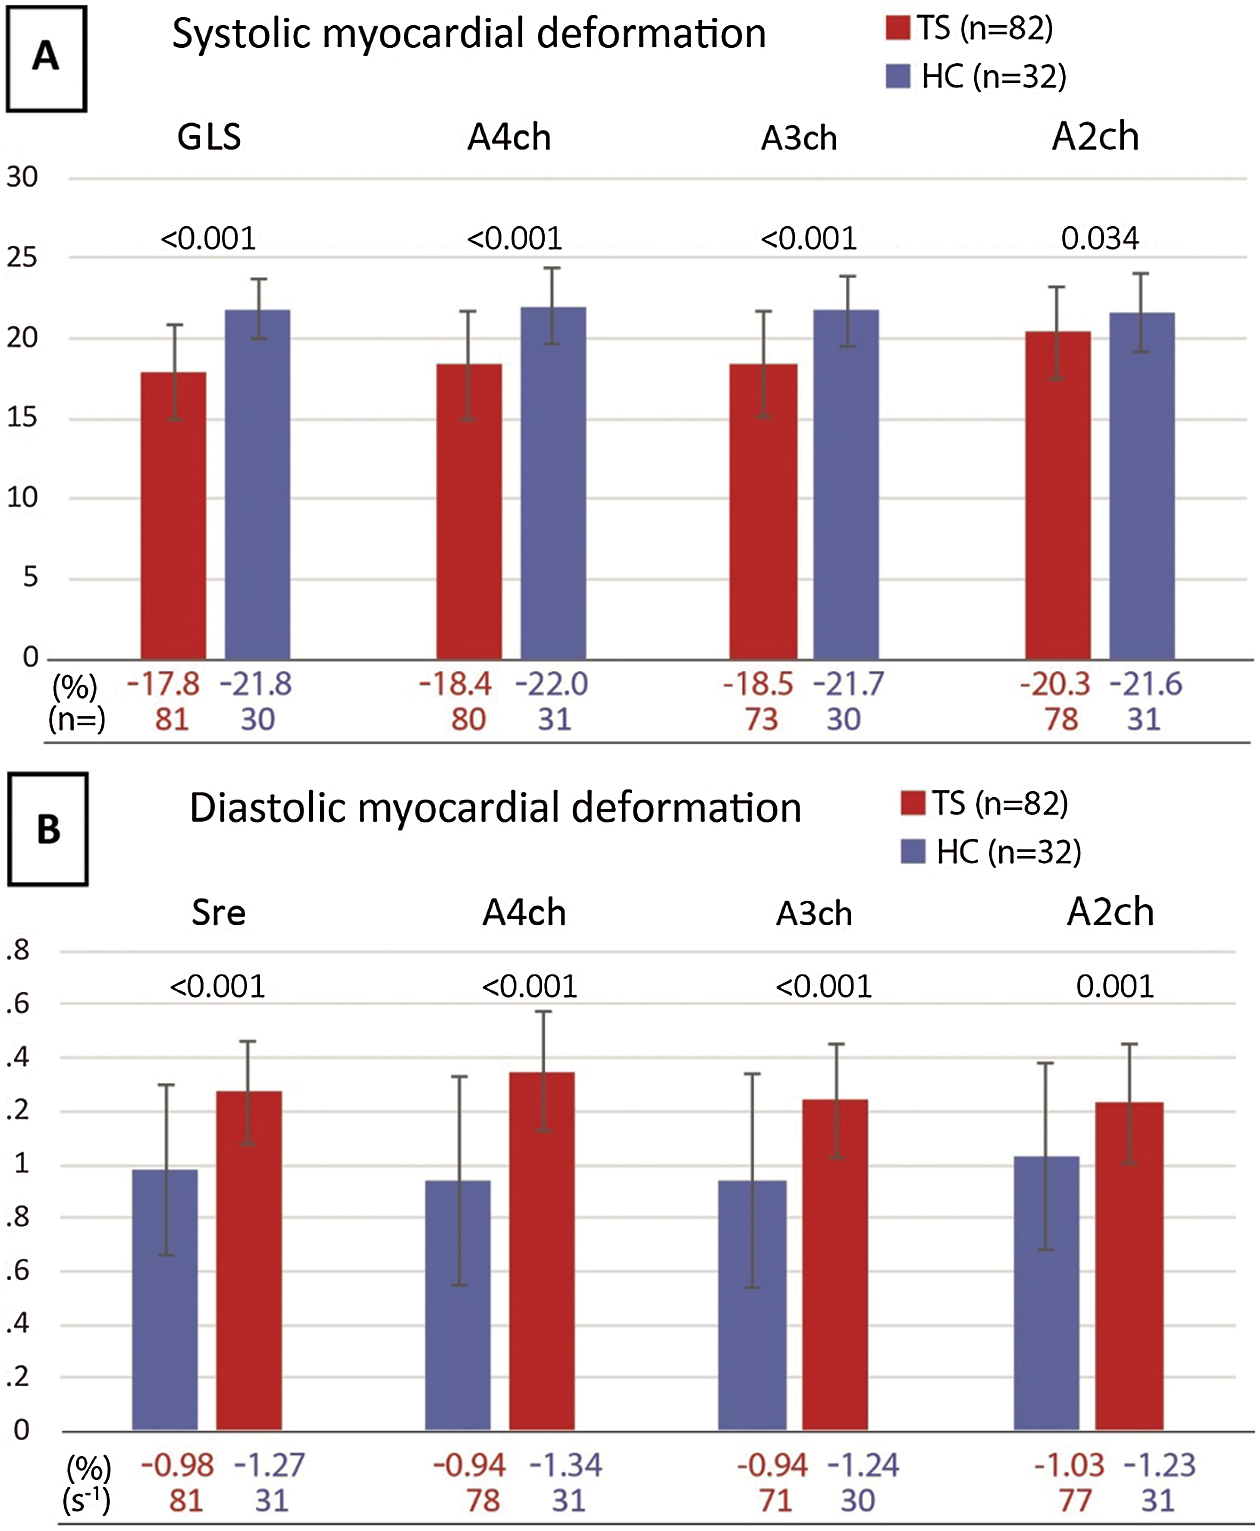
Figure 1: A) Systolic myocardial deformation B) Diastolic myocardial deformation
3.3 Conventional Echocardiography
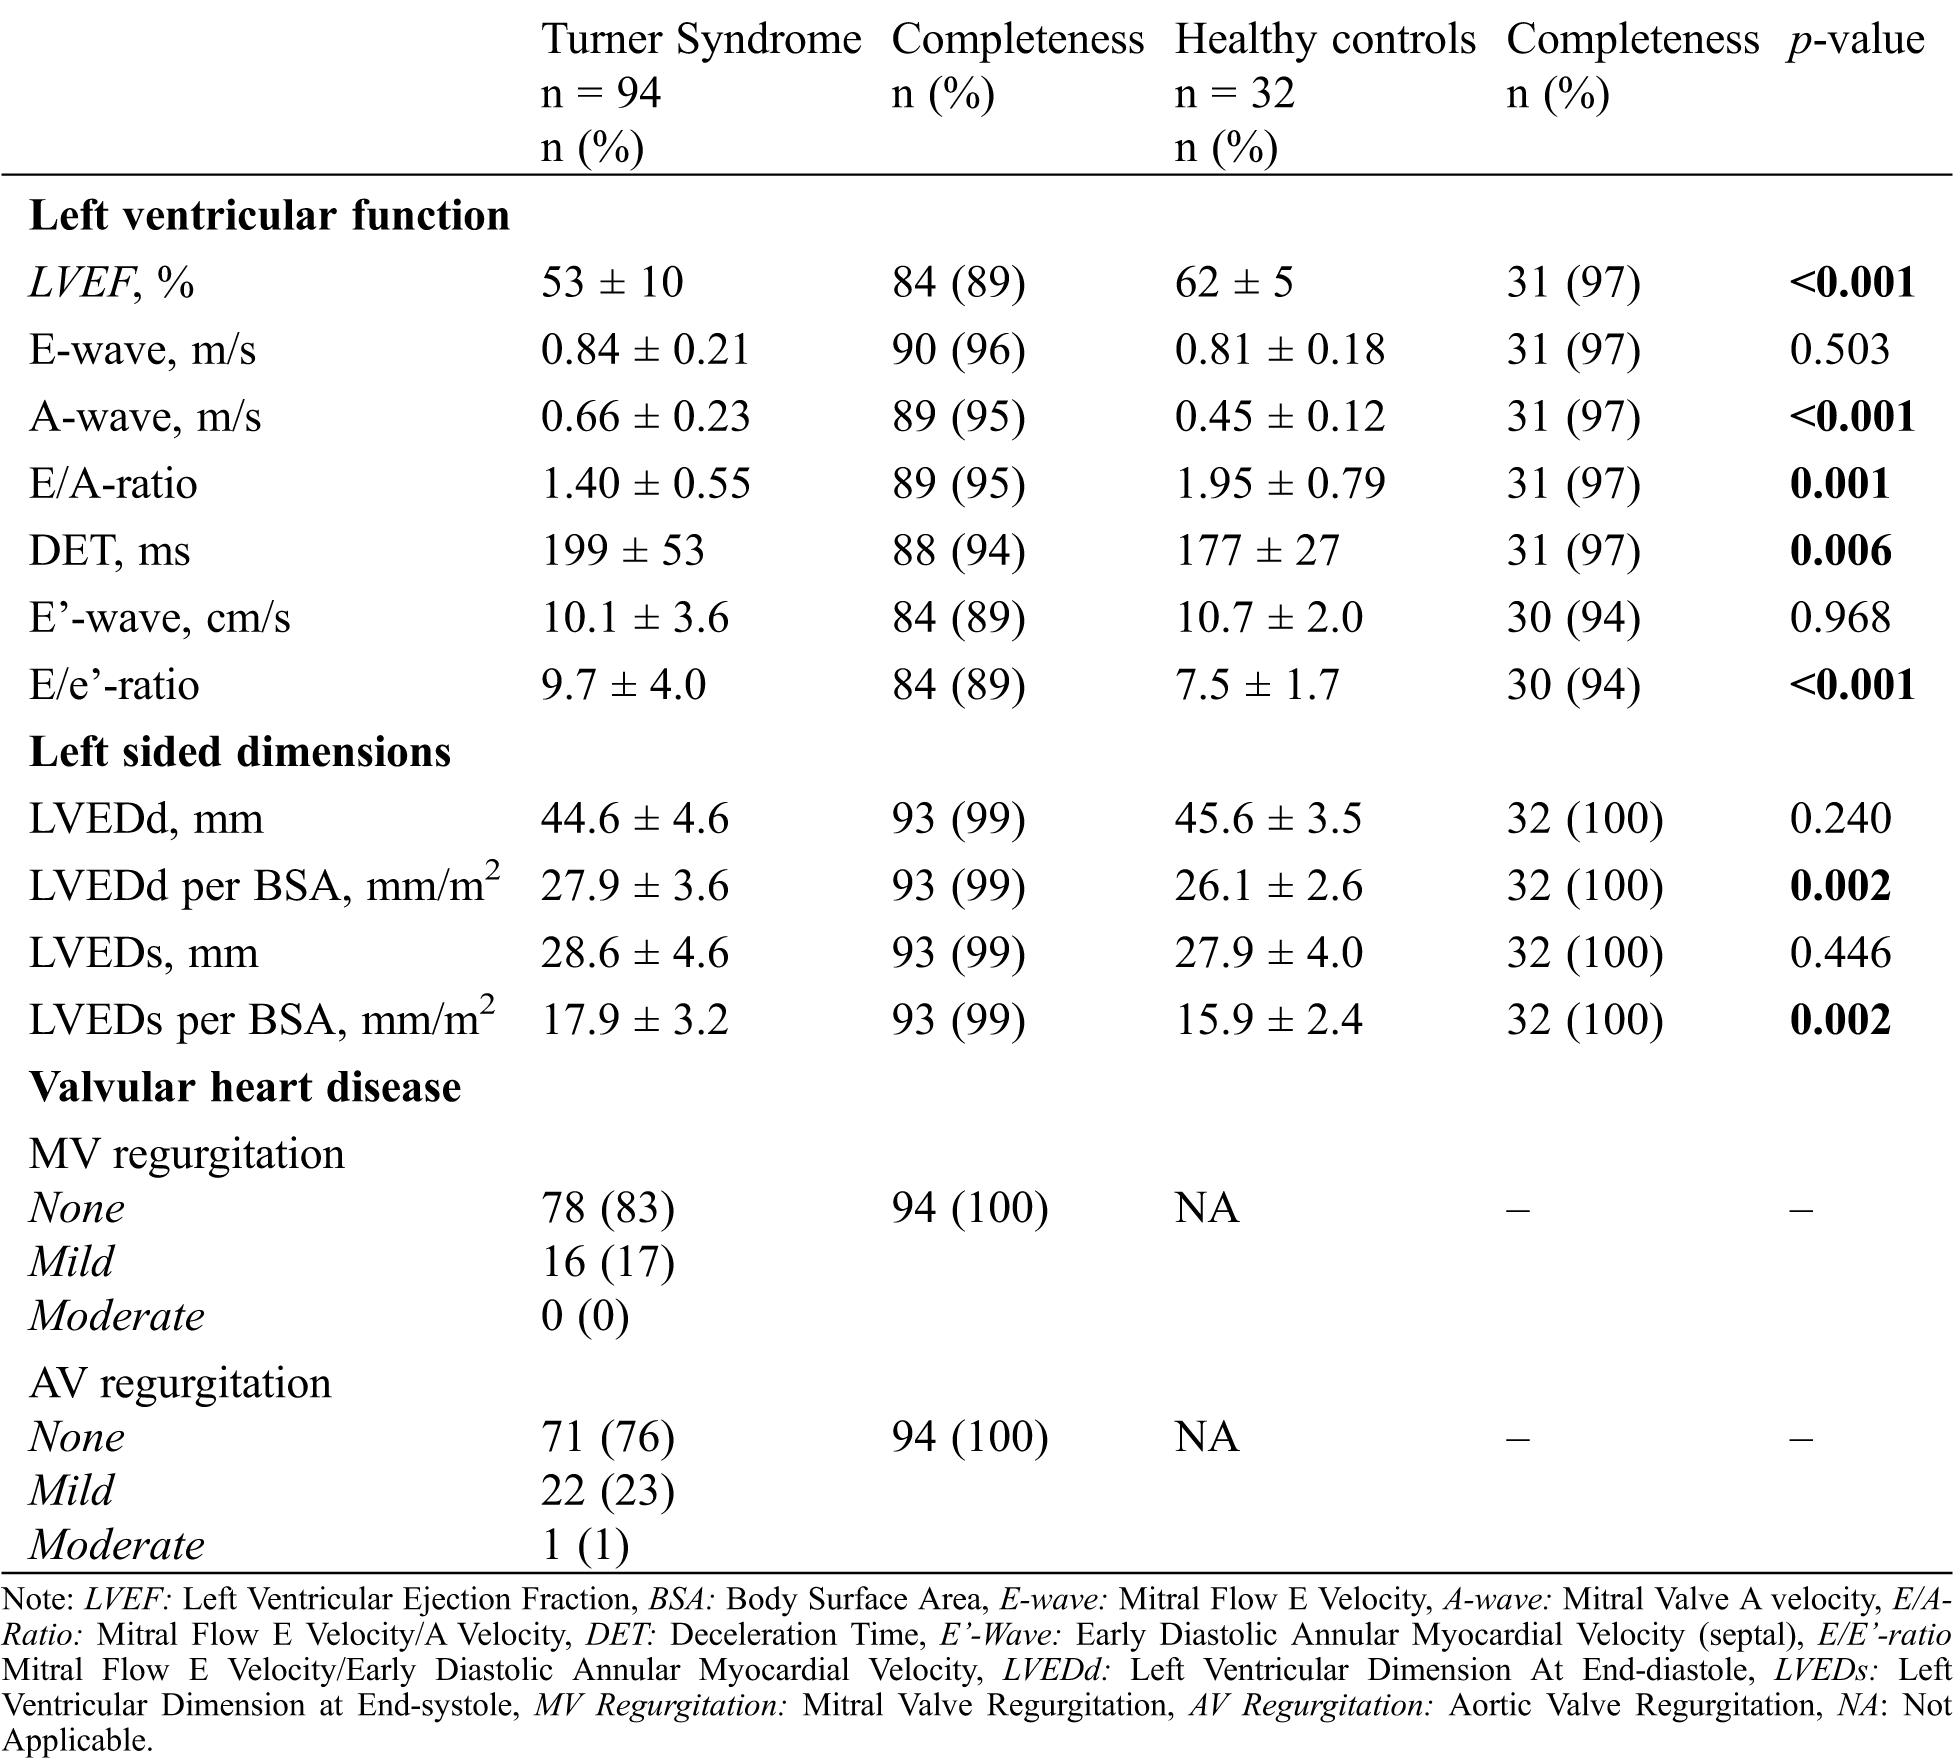
Echocardiographic measurements are shown in Tab. 2. All functional LV parameters, LV chamber function, E-wave, and E’-wave were significantly different in TS patients compared with healthy women. The absolute LV dimensions were not significantly different; however, when corrected for BSA, LV was significantly larger in TS women, both in end-diastole (LVEDd: 28 mm/m2 ± 3.6 vs. 26 mm/m2 ± 2.6, p = 0.002) and in end-systole (LVEDs: 18 mm/m2 ± 3.2 vs. 16 mm/m2 ± 2.4, p = 0.002). TS women may have higher BMI than their non-TS peers, which may influence their BSA. Therefore, we also examined LV dimension corrected for height, where the same statistically significant difference was observed (LVEDd per meter: 29 mm/m ± 2.9 vs. 27 mm/m ± 2.1, p = 0.002) and in end-systole (LVEDs: 18 mm/m ± 3.2 vs. 16.5 mm/m ± 2.4, p = 0.001).
Table 2: Conventional echocardiographic parameters
Women with TS had significantly higher resting heart rate (77 bpm ± 13) compared to healthy controls (60 bpm ± 8, p < 0.001). Also, conduction times differed between groups: The PR-duration was shorter (137 ms ± 25 and 148 ms ± 24, p = 0.029), and QTc-duration was longer (420 ms ± 31 and 395 ms ± 14, p < 0.001) in women with TS compared to healthy women. None of the patients had signs of LV hypertrophy on the electrocardiogram and all TS patients, except one, were in sinus rhythm (n = 92, 99%).
3.5 Cardio Pulmonary Exercise Test
Cardiopulmonary exercise testing was performed in 92 (98%) patients and exercise parameters are shown in Tab. 1. Thirty-two TS women (35%) had a reduced workload and 33 women (36%) had a reduced VO2max (<85%). Moreover, TS women had a significantly reduced maximal heart rate (p < 0.001), reduced oxygen uptake (p < 0.001) and a reduced maximal workload (p = 0.033) when compared with individual standardized reference values. Moreover, exercise capacity did not differ between women with and without cardiac defects (94% vs. 96% of predicted, p = 0.752).
3.6 Associations of Systolic and Diastolic Myocardial Deformation Parameters
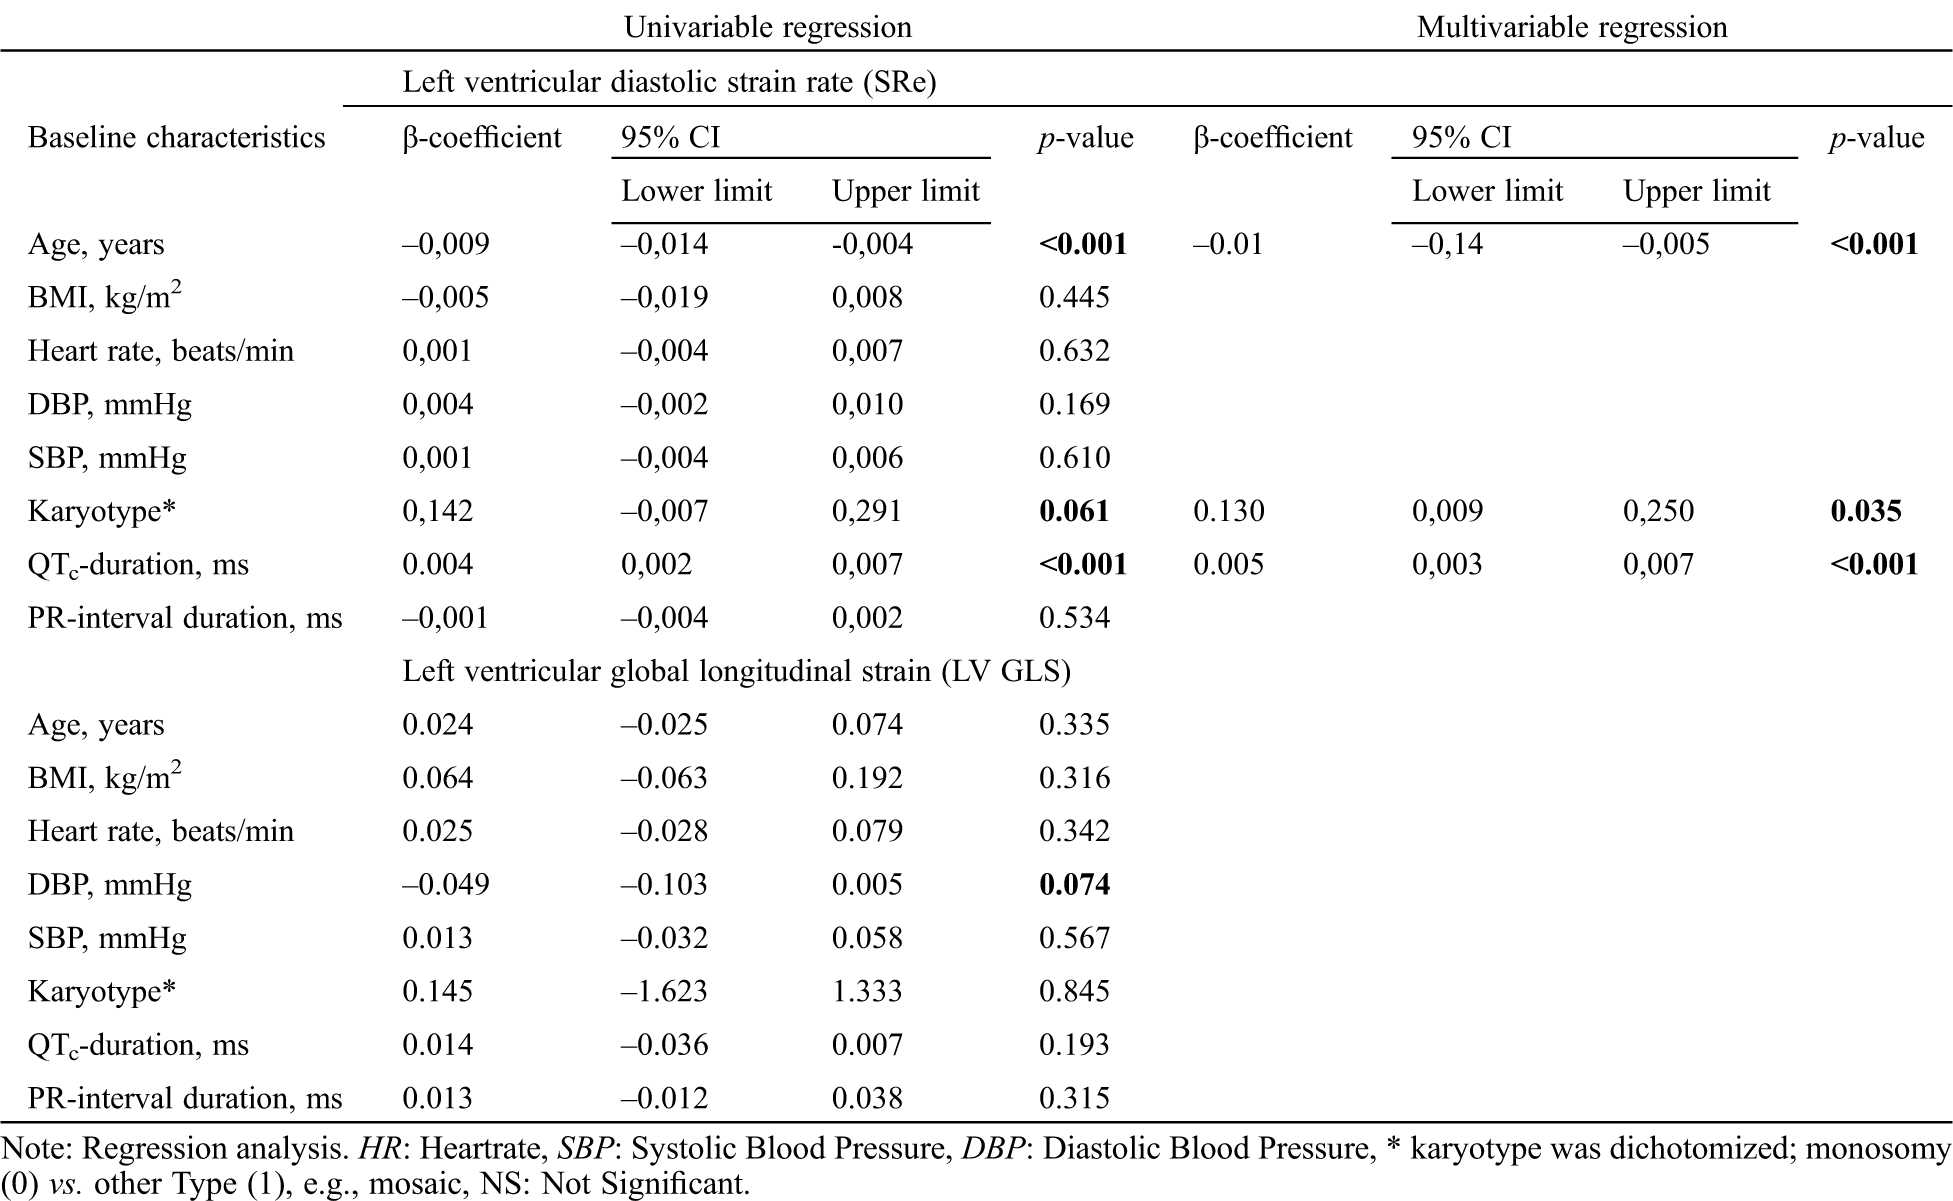
The results of the regression analysis are presented in Tab. 3. In line with previous higher age was significantly associated with reduced Sre, and longer QTc times with a higher Sre. Also karyotype remained significantly associated with Sre (β-coefficient: 0.005, p-value <0.001; R2 = 0.445). For LvGLS no significant associations were found with baseline characteristics (Tab. 3).
Table 3: Linear regression analysis
Although it was not the main objective of our study, we did compare patients with and without cardiovascular disease. We did test for a possible difference in patients with or without structural heart disease. However, no such influence could be found for the main outcome measurements such as strain or exercise capacity. Moreover, some minor differences were observed that may point in the direction of minor diastolic dysfunction in the patient group with cardiac disease. A higher a-wave was observed in (0.7 vs. 0.6 m/s, p = 0.019), a lower e’-wave (9 vs. 11 cm/s, p = 0.031). Patients with cardiac disease also had a larger ‘LVED/BSA’ both in systole and diastole (28.9 vs. 27.2, p = 0.19 and 18.6 and 17.3 p = 0.49). However, this was largely explained by them having a lower BSA (1.56 vs. 1.65; p = 0.02).
This study demonstrates significantly lower myocardial deformation parameters (LvGLS and Sre) in women with TS Furthermore. Furthermore, TS women showed reduced conventional diastolic parameters, significantly different conduction times and a lower exercise capacity. Age, karyoptype and QTc-duration were significantly associated with Sre but not with LvGLS in the TS population. We did observe impaired diastolic function on conventional echocardiography compared to the healthy controls, mainly: lower A-wave and E/A-ratio, shorter DET, and higher E/e’-ratio.
4.1 LV Myocardial Deformation in Women with TS
Although LV myocardial deformation measurement using STE is superior to tissue Doppler imaging (TDI), [22,23] earlier studies have already described a higher A-wave and subsequently a lower E/A-ratio compared to healthy female subjects [8–11]. Our study supports these findings and adds a prolonged deceleration time and higher E/e’-ratio compared to healthy women.
Hypertension is an important risk factor for LV diastolic dysfunction and aortic dilatation. In line with previous studies [24–27], we found an elevated diastolic and systolic blood pressure in women with TS. Therefore, vigilant surveillance of not only systolic but also diastolic blood pressure in TS patients is important as described earlier [25]. We hypothesized that this difference in blood pressure may explain the difference in myocardial deformation parameters between TS and healthy controls. However, our current study shows no significant effect of blood pressure on the myocardial deformation parameters. This finding is in line with earlier studies that have shown that the changes in LV function seem to occur irrespective of hypertension or metabolic control in women with TS [9,10].
An alternative explanation could lie in the increased prevalence of congenital heart disease in this population. Some congenital heart defects such as CoA and BAV are known to cause a reduced LvGLS, [7,28] both of which occur frequently in women with TS. Unfortunately, our study was not designed to and further studies are therefore needed to definitively confirm such a relation in TS women.
A third potential explanation could be offered by the decreased aortic distensibility that is described in women with TS [29–32]. Vascular stiffening reduces compliance and increases arterial pressure which augments overall vascular resistance. Subsequently the LV would have to compensate for this pressure overload by increasing myocardial wall thickness, leading to reduced diastolic compliance or even increased end-diastolic volume. However, to our knowledge no longitudinal studies have been conducted that investigate a possible relation between diastolic function and aortic elasticity in women with TS. We found an indication of increased LV size when corrected for BSA or height in the TS population and a decreased exercise capacity. This could resemble the impaired diastolic reserve seen in HF with preserved ejection fraction (HFpEF) which leads to LV end-diastolic pressure (EDP) resulting in exercise intolerance [33]. However, a follow-up study would be needed to investigate if this holds any relation to the aortic distensibility.
Although hypertension, congenital heart disease and vascular compliance may all contribute to the observed LV dysfunction in women with TS, a common underlying cause could be assumed in TS. Recently, TS women were found to have increased cortisol levels [34]. Several aspects of the TS phenotype may well fit a ‘hypercortisolism theory’. Like in patients with Cushing syndrome, long term exposure to increased levels of cortisol could lead to increased prevalence of left ventricular (LV) hypertrophy, higher frequency of concentric remodeling, and subsequent LV systolic and diastolic dysfunction, and left atrial systolic dysfunction, as well as increased regional LV wall thickness [35–38]. Possibly the electrophysiological changes [39], increased pulse wave velocity [40] and metabolic syndrome [37,41] also fit such an explanation. Also, the higher resting heart rate could fit in this hypothesis.
The main limitation is the small sample size of the study, although this is one of the largest most comprehensive studies to date. Another shortcoming may be the lack of data on the coronary arteries of these patients. This study cannot fully discern the possible influence of the presence of structural heart disease on the cardiac function. We show that no significant difference on the main outcome parameter were found. However, since this was not the primary objective of this study, we suggest future studies to expand upon our current effort. A possible inclusion bias is unlikely as patients were consecutively included into this study. A possible source of bias is the time and effort taken by the study. This may cause only less affected patients to participate. As more severely affected patients may already be intensively monitored. Where less affected individuals may be tempted by a very comprehensive check-up. In this current study we have no information on the behavioral aspects of the deficit in exercise capacity. Future studies should therefore for example include a questionnaire to determine baseline activity levels of TS women.
Systolic LvGLS and Sre were both significantly lower in TS women compared to healthy females and exercise capacity was found to be reduced in TS women. Reduced LVGLS and Sre were not associated with exercise capacity, but correlation with conventional TTE parameters and baseline characteristics were observed.
Data Sharing: Data is available upon reasonable request.
Funding Statement: We gratefully acknowledge funding by the Dutch Heart Foundation (Grant No. 2013T093).
Conflicts of Interest: The authors report no relationships that could be construed as a conflict of interest.
1. Stochholm, K., Juul, S., Juel, K., Naeraa, R. W., Gravholt, C. H. (2006). Prevalence, incidence, diagnostic delay, and mortality in Turner syndrome. Journal of Clinical Endocrinology & Metabolism, 91(10), 3897–3902. DOI 10.1210/jc.2006-0558. [Google Scholar] [CrossRef]
2. Elsheikh, M., Dunger, D. B., Conway, G. S., Wass, J. A. (2002). Turner’s syndrome in adulthood. Endocrine Reviews, 23(1), 120–140. [Google Scholar]
3. Donato, B., Ferreira, M. J. (2018). Cardiovascular risk in Turner syndrome. Revista Portuguesa Cardiologia, 37(7), 607–621. DOI 10.1016/j.repc.2017.08.008. [Google Scholar] [CrossRef]
4. Duijnhouwer, A. L., Bons, L. R., Timmers, H. J. L. M., van Kimmenade, R. R. L., Snoeren, M. et al. (2019). Aortic dilatation and outcome in women with Turner syndrome. Heart, 105(9), 693–700. DOI 10.1136/heartjnl-2018-313716. [Google Scholar] [CrossRef]
5. Kim, H. K., Gottliebson, W., Hor, K., Backeljauw, P., Gutmark-Little, I. et al. (2011). Cardiovascular anomalies in Turner syndrome: Spectrum, prevalence, and cardiac MRI findings in a pediatric and young adult population. American Journal of Roentgenology, 196(2), 454–460. DOI 10.2214/AJR.10.4973. [Google Scholar] [CrossRef]
6. van den Hoven, A. T., Chelu, R. G., Duijnhouwer, A. L., Demulier, L., Devos, D. et al. (2017). Partial anomalous pulmonary venous return in Turner syndrome. European Journal of Radiology, 95(12), 141–146. DOI 10.1016/j.ejrad.2017.07.024. [Google Scholar] [CrossRef]
7. Menting, M. E., McGhie, J. S., Koopman, L. P., Vletter, W. B., Helbing, W. A. et al. (2016). Normal myocardial strain values using 2D speckle tracking echocardiography in healthy adults aged 20 to 72 years. Echocardiography, 33(11), 1665–1675. DOI 10.1111/echo.13323. [Google Scholar] [CrossRef]
8. Mortensen, K. H., Gravholt, C. H., Hjerrild, B. E., Stochholm, K., Andersen, N. H. (2012). Left ventricular hypertrophy in Turner syndrome: A prospective echocardiographic study. Echocardiography, 29(9), 1022–1030. DOI 10.1111/j.1540-8175.2012.01754.x. [Google Scholar] [CrossRef]
9. Andersen, N. H., Hjerrild, B. E., Sorensen, K., Pedersen, E. M., Stochholm, K. et al. (2006). Subclinical left ventricular dysfunction in normotensive women with Turner’s syndrome. Heart, 92(10), 1516–1517. DOI 10.1136/hrt.2005.081471. [Google Scholar] [CrossRef]
10. Sozen, A. B., Cefle, K., Kudat, H., Ozturk, S., Oflaz, H. et al. (2009). Left ventricular thickness is increased in nonhypertensive Turner’s syndrome. Echocardiography, 26(8), 943–949. DOI 10.1111/j.1540-8175.2009.00902.x. [Google Scholar] [CrossRef]
11. Oz, F., Cizgici, A. Y., Ucar, A., Karaayvaz, E. B., Kocaaga, M. et al. (2014). Doppler-derived strain imaging detects left ventricular systolic dysfunction in children with Turner syndrome. Echocardiography, 31(8), 1017–1022. DOI 10.1111/echo.12500. [Google Scholar] [CrossRef]
12. Barbier, P., Mirea, O., Cefalu, C., Maltagliati, A., Savioli, G. et al. (2015). Reliability and feasibility of longitudinal AFI global and segmental strain compared with 2D left ventricular volumes and ejection fraction: Intra- and inter-operator, test–retest, and inter-cycle reproducibility. European Heart Journal–Cardiovascular Imaging, 16(6), 642–652. DOI 10.1093/ehjci/jeu274. [Google Scholar] [CrossRef]
13. Ng, A. C., Delgado, V., Bertini, M., van der Meer, R. W., Rijzewijk, L. J. et al. (2009). Findings from left ventricular strain and strain rate imaging in asymptomatic patients with type 2 diabetes mellitus. American Journal of Cardiology, 104(10), 1398–1401. DOI 10.1016/j.amjcard.2009.06.063. [Google Scholar] [CrossRef]
14. Nakai, H., Takeuchi, M., Nishikage, T., Lang, R. M., Otsuji, Y. (2009). Subclinical left ventricular dysfunction in asymptomatic diabetic patients assessed by two-dimensional speckle tracking echocardiography: Correlation with diabetic duration. European Journal of Echocardiography, 10(8), 926–932. DOI 10.1093/ejechocard/jep097. [Google Scholar] [CrossRef]
15. Barmeyer, A., Mullerleile, K., Mortensen, K., Meinertz, T. (2009). Diastolic dysfunction in exercise and its role for exercise capacity. Heart Failure Reviews, 14(2), 125–134. DOI 10.1007/s10741-008-9105-y. [Google Scholar] [CrossRef]
16. Skaluba, S. J., Litwin, S. E. (2004). Mechanisms of exercise intolerance, insights from tissue Doppler imaging. Circulation, 109(8), 972–977. DOI 10.1161/01.CIR.0000117405.74491.D2. [Google Scholar] [CrossRef]
17. van den Hoven, A. T., Bons, L. R., Dykgraaf, R. H. M., Dessens, A. B., Pastoor, H. et al. (2020). A value-based healthcare approach: Health-related quality of life and psychosocial functioning in women with Turner syndrome. Clinical Endocrinology, 92(5), 434–442. DOI 10.1111/cen.14166. [Google Scholar] [CrossRef]
18. Du Bois, D., Du Bois, E. F. (1916). A formula to estimate the approximate surface area if height and weight be known. 1916. Nutrition, 5(5), 303–313. [Google Scholar]
19. Lang, R. M., Badano, L. P., Mor-Avi, V., Afilalo, J., Armstrong, A. et al. (2015). Recommendations for cardiac chamber quantification by echocardiography in adults, an update from the American Society of Echocardiography and the European Association of Cardiovascular Imaging. European Heart Journal–Cardiovascular Imaging, 16(3), 233–271. DOI 10.1093/ehjci/jev014. [Google Scholar] [CrossRef]
20. American Thoracic Society, American College of Chest Physicians (2003). ATS/ACCP statement on cardiopulmonary exercise testing. American Journal of Respiratory and Critical Care Medicine, 167(2), 211–277. DOI 10.1164/rccm.167.2.211. [Google Scholar] [CrossRef]
21. van Grootel, R., Menting, M. E., McGhie, J., Roos-Hesselink, J. W., van den Bosch, A. E. (2017). Echocardiographic chamber quantification in a healthy Dutch population. Netherlands Heart Journal: Monthly Journal of the Netherlands Society of Cardiology and the Netherlands Heart Foundation, 25(12), 682–690. DOI 10.1007/s12471-017-1035-7. [Google Scholar] [CrossRef]
22. Dandel, M., Lehmkuhl, H., Knosalla, C., Suramelashvili, N., Hetzer, R. (2009). Strain and strain rate imaging by echocardiography - basic concepts and clinical applicability. Current Cardiology Reviews, 5(2), 133–148. DOI 10.2174/157340309788166642. [Google Scholar] [CrossRef]
23. Jia, C., Olafsson, R., Huang, S. W., Kolias, T. J., Kim, K. et al. (2010). Comparison of 2-D speckle tracking and tissue Doppler imaging in an isolated rabbit heart model. IEEE Transactions on Ultrasonics, Ferroelectrics and Frequency Control, 57(11), 2491–2502. DOI 10.1109/TUFFC.2010.1715. [Google Scholar] [CrossRef]
24. Nathwani, N. C., Unwin, R., Brook, C. G., Hindmarsh, P. C. (2000). Blood pressure and Turner syndrome. Clinical Endocrinology, 52(3), 363–370. DOI 10.1046/j.1365-2265.2000.00960.x. [Google Scholar] [CrossRef]
25. Elsheikh, M., Casadei, B., Conway, G. S., Wass, J. A. (2001). Hypertension is a major risk factor for aortic root dilatation in women with Turner’s syndrome. Clinical Endocrinolology, 54(1), 69–73. DOI 10.1046/j.1365-2265.2001.01154.x. [Google Scholar] [CrossRef]
26. Gravholt, C. H., Naeraa, R. W., Nyholm, B., Gerdes, L. U., Christiansen, E. et al. (1998). Glucose metabolism, lipid metabolism, and cardiovascular risk factors in adult Turner’s syndrome. The impact of sex hormone replacement. Diabetes Care, 21(7), 1062– 1070. [Google Scholar]
27. Gravholt, C. H., Juul, S., Naeraa, R. W., Hansen, J. (1998). Morbidity in Turner syndrome. Journal of Clinical Epidemiology, 51(2), 147–158. DOI 10.1016/S0895-4356(97)00237-0. [Google Scholar] [CrossRef]
28. Zhang, X., Zhu, M., He, T., Yuan, J., Zhu, H. et al. (2015). Cardiac mechanics in isolated bicuspid aortic valve disease with normal ejection fraction, A study of various valvular lesion types. Medicine, 94(47), e2085. DOI 10.1097/MD.0000000000002085. [Google Scholar] [CrossRef]
29. Schafer, M., Browne, L. P., Truong, U., Jaggers, J. J., Mitchell, M. B. et al. (2018). Aortic stiffness in adolescent Turner and Marfan syndrome patients. European Journal of Cardio-Thoracic Surgery, 54(5), 926–932. DOI 10.1093/ejcts/ezy168. [Google Scholar] [CrossRef]
30. van den Berg, J., Bannink, E. M., Wielopolski, P. A., Pattynama, P. M., de Muinck Keizer-Schrama, S. M. (2006). Aortic distensibility and dimensions and the effects of growth hormone treatment in the turner syndrome. American Journal of Cardiology, 97(11), 1644–1649. DOI 10.1016/j.amjcard.2005.12.058. [Google Scholar] [CrossRef]
31. Pees, C., Heno, J. A., Hausler, G., Ertl, D. A., Gulesserian, T. et al. (2018). Aortic elasticity deterioration proves intrinsic abnormality of the ascending aorta in pediatric Turner syndrome unrelated to the aortic valve morphology. Heart and Vessels, 33(11), 1350–1357. DOI 10.1007/s00380-018-1187-4. [Google Scholar] [CrossRef]
32. Sharma, J., Friedman, D., Dave-Sharma, S., Harbison, M. (2009). Aortic distensibility and dilation in Turner’s syndrome. Cardiology in the Young, 19(6), 568–572. DOI 10.1017/S1047951109990874. [Google Scholar] [CrossRef]
33. Chattopadhyay, S., Alamgir, M. F., Nikitin, N. P., Rigby, A. S., Clark, A. L. et al. (2010). Lack of diastolic reserve in patients with heart failure and normal ejection fraction. Circulation: Heart Failure, 3(1), 35–43. DOI 10.1161/CIRCHEARTFAILURE.108.824888. [Google Scholar] [CrossRef]
34. Savas, M., Wester, V. L., Dykgraaf, R. H. M., van den Akker, E. L. T., Roos-Hesselink, J. W. et al. (2019). Long-term cortisol exposure and associations with height and comorbidities in Turner syndrome. Journal of Clinical Endocrinology & Metabolism, 104(9), 3859–3867. DOI 10.1210/jc.2019-00148. [Google Scholar] [CrossRef]
35. Toja, P. M., Branzi, G., Ciambellotti, F., Radaelli, P., de Martin, M. et al. (2012). Clinical relevance of cardiac structure and function abnormalities in patients with Cushing’s syndrome before and after cure. Clinical Endocrinology, 76(3), 332–338. DOI 10.1111/j.1365-2265.2011.04206.x. [Google Scholar] [CrossRef]
36. Muiesan, M. L., Lupia, M., Salvetti, M., Grigoletto, C., Sonino, N. et al. (2003). Left ventricular structural and functional characteristics in Cushing’s syndrome. Journals of the American College of Cardiology, 41(12), 2275–2279. DOI 10.1016/S0735-1097(03)00493-5. [Google Scholar] [CrossRef]
37. Isidori, A. M., Graziadio, C., Paragliola, R. M., Cozzolino, A., Ambrogio, A. G. et al. (2015). The hypertension of Cushing’s syndrome, controversies in the pathophysiology and focus on cardiovascular complications. Journal of Hypertension, 33(1), 44–60. DOI 10.1097/HJH.0000000000000415. [Google Scholar] [CrossRef]
38. Kamenicky, P., Redheuil, A., Roux, C., Salenave, S., Kachenoura, N. et al. (2014). Cardiac structure and function in Cushing’s syndrome, a cardiac magnetic resonance imaging study. Journal of Clinical Endocrinology & Metabolism, 99(11), E2144–E2153. DOI 10.1210/jc.2014-1783. [Google Scholar] [CrossRef]
39. Alexandraki, K. I., Kaltsas, G. A., Vouliotis, A. I., Papaioannou, T. G., Trisk, L. et al. (2011). Specific electrocardiographic features associated with Cushing’s disease. Clinical Endocrinology, 74(5), 558–564. DOI 10.1111/j.1365-2265.2011.03975.x. [Google Scholar] [CrossRef]
40. Blain, H., Sinaii, N., Zeltser, D., Lyssikatos, C., Belyavskaya, E. et al. (2019). Aortic pulse wave velocity in children with Cushing syndrome: A window into a marker of early cardiovascular disease. Endocrinology, Diabetes & Metabolism, 2(2), e00054. DOI 10.1002/edm2.54. [Google Scholar] [CrossRef]
41. Walker, B. R. (2006). Cortisol–Cause and cure for metabolic syndrome? Diabetic Medicine, 23(12), 1281–1288. DOI 10.1111/j.1464-5491.2006.01998.x. [Google Scholar] [CrossRef]
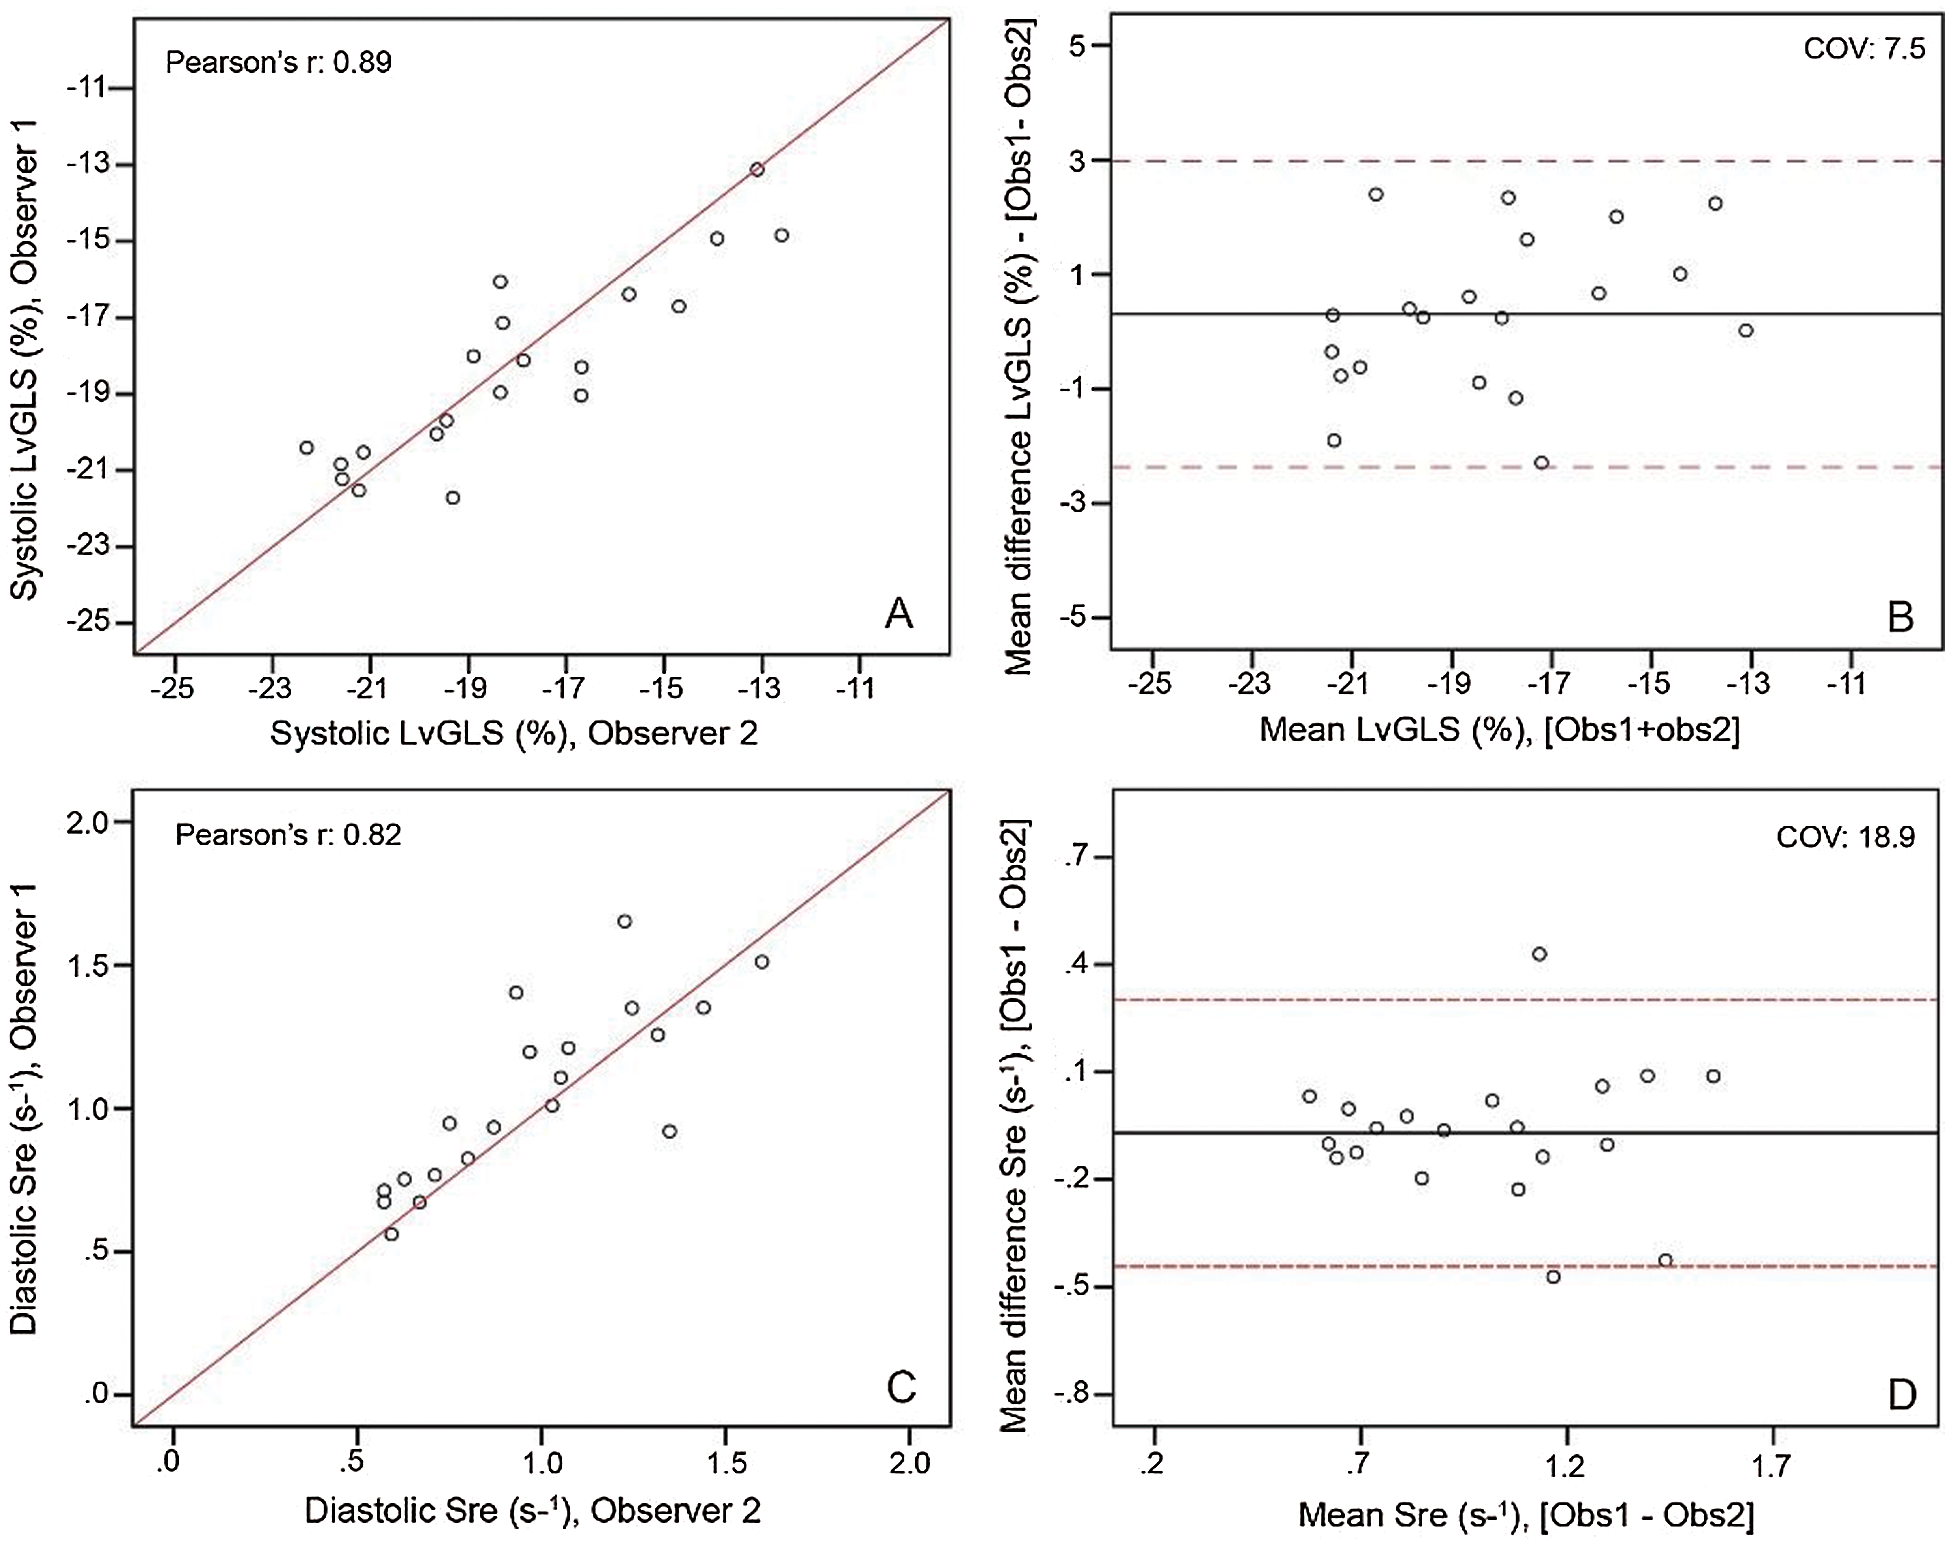
Supplementary Figure 1: Inter observer analysis as linear regression (left) and Blandt-altman plots (right) for systolic LvGLS (top) and diastolic Sre (bottom).
 | This work is licensed under a Creative Commons Attribution 4.0 International License, which permits unrestricted use, distribution, and reproduction in any medium, provided the original work is properly cited. |