
 Submit a Paper
 Propose a Special lssue
 Open Access
ARTICLE

ARPC1A Promotes NSCLC Malignancy via Stimulating the Drug Resistance and Cell Migration
1 School of Life Sciences, Anhui Medical University, Hefei, 230032, China
2 Department of Biochemistry and Molecular Biology, School of Basic Medical Sciences, Anhui Medical University, Hefei, 230032, China
3 Department of Orthopaedics, Hejin Shengji Hospital, Yuncheng, 043300, China
* Corresponding Authors: Kecheng Zhou. Email: ; Minxia Liu. Email:
BIOCELL 2025, 49(3), 483-502. https://doi.org/10.32604/biocell.2025.062143
Received 11 December 2024; Accepted 10 March 2025; Issue published 31 March 2025
 View Full Text
 Download PDF
Abstract
Objectives: Non-small cell lung cancer (NSCLC) represents a formidable malignancy characterized by its marked metastatic potential and intrinsic resistance to therapeutic interventions. The identification of potential biomarkers delineating the progression and metastatic cascade of NSCLC assumes paramount importance in fostering advancements toward enhanced patient outcomes and prognostic stratification. Methods: The expression level of the actin-related protein 2/3 complex; subunit 1A (ARPC1A) in NSCLC was evaluated using The Cancer Genome Atlas (TCGA) and Gene Expression Profiling Interactive Analysis (GEPIA) databases; along with the LinkedOmics database for co-expression genes. Further verification of ARPC1A expression in normal lung cells and NSCLC cells; as well as in normal tissues and lung cancer tissues; was performed using quantitative real-time reverse transcription PCR (RT-qPCR) and Western blotting. The function of ARPC1A was explored through Gene Set Enrichment Analysis (GSEA) and immune infiltration analysis; followed by functional experiments for validation. Results: ARPC1A is upregulated in NSCLC and is associated with unfavorable clinical prognoses. Additionally, the Kyoto Encyclopedia of Genes and Genomes (KEGG) pathway enrichment analysis highlights a potential link between the ARPC1A gene and the cell cycle and p53 signaling pathways. ARPC1A also promotes cell proliferation and resistance to chemotherapeutic drugs, thereby enhancing the oncogenic potential of NSCLC. Relevant cell-based experiments confirm that targeted inhibition of ARPC1A effectively suppresses cellular migratory and invasive capabilities. The immune infiltration analysis showed a close association between ARPC1A expression and various immune components, suggesting ARPC1A may interact with the tumor microenvironment. Mechanistically, ARPC1A promotes cell migration by stimulating the epithelial-to-mesenchymal transition (EMT). Conclusion: The study results revealed the potential of ARPC1A as a valuable prognostic biomarker for NSCLC. Additionally, the associated mechanisms provide insights that may pave the way for therapeutic interventions for NSCLC patients.Keywords
Supplementary Material
Supplementary Material FileLung cancer, a heterogeneous disease traditionally categorized into small cell lung cancer (SCLC) and non-small cell lung cancer (NSCLC) [1], NSCLC is described as the predominant subtype, accounting for approximately 85% of all lung cancer incidences [2]. NSCLC is usually diagnosed at an advanced stage and is prone to distant metastases, and 5-year survival remains low [3]. Evolution in technological landscapes, notably with the advent of next-generation sequencing (NGS) and the inception of comprehensive databases cataloging human tumor molecular profiles, has revolutionized the understanding of NSCLC pathogenesis from conventional histopathological classifications toward intricate molecular and genetic profiling at the single-cell level [4].
Subsequently, treatment paradigms for NSCLC have witnessed substantial transformations encompassing patient-specific targeted therapies and immunomodulatory interventions [4]. Recent developments in uncovering the molecular biology of oncogenesis and cancer metastasis have provided crucial mechanical insights into the progression of NSCLC [5,6]. Nonetheless, an exhaustive elucidation of the precise regulatory frameworks underpinning lung cancer progression remains an imperative area for further exploration.
The actin-related protein 2/3 complex (Arp2/3), pivotal for actin filament branching, comprises two distinct ARPC1 subunit isoforms, ARPC1A and ARPC1B, with the latter exhibiting prominent expression in hematopoietic cells [7]. These isoforms, arising from ARPC1A and ARPC1B, share a noteworthy 68% amino acid sequence homology while encompassing six WD40 repeat motifs, predictive of a beta-propeller conformation [8,9]. Notably, ARPC1A has been characterized as a modulator of migration and invasion in pancreatic cancer [10] and prostate cancer [11]. Moreover, ARPC1A regulates ferroptosis via the signal transducer and activator of transcription 3 (STAT3) signaling pathway in prostate cancer [12].
Herein, our study reveals elevated ARPC1A expression levels in NSCLC tissues compared to neighboring normal counterparts. Bioinformatic analyses underscore a correlative link between heightened ARPC1A expression and adverse prognostic outcomes in NSCLC cohorts. Coupled with associations with epithelial-mesenchymal transition (EMT), our findings delineate the capacity of ARPC1A in dictating NSCLC cell migration, proliferation, and drug resistance. Additionally, our analysis suggests that ARPC1A is potentially crucial in immune infiltration. In summary, the experimental data, together with bioinformatic analysis, collectively demonstrate that the expression status of ARPC1A emerges not only as a valuable prognostic indicator for NSCLC patients but also as a viable therapeutic target warranting investigation in the NSCLC treatment landscape.
The Cancer Genome Atlas Program (TCGA) stands as a seminal achievement in the realm of cancer genomics, providing comprehensive molecular insights derived from nearly 20,000 primary tumors juxtaposed with corresponding normal tissue samples across 33 diverse cancer types. Within this corpus of data, pan-cancer mRNA transcripts per million (TPM) were procured from the TCGA repository, with a specific focus on the TCGA-LUAD dataset encompassing 539 lung adenocarcinoma (LUAD) tissues alongside 59 normal tissue counterparts [13]. Notably, 58 instances of matched cancerous and para-cancerous tissues were examined in this context. Subsequent to data acquisition, visualization was carried out utilizing the R software platform (version 4.2.1).
2.2 Correlation Analysis of Prognosis
The Gene Expression Profiling Interactive Analysis (GEPIA) represents a web-based repository tailored for in-depth investigations encompassing tumor-normal differential expression analysis, patient survival prognosis, and correlation analysis, as succinctly noted within the provided URL (http://gepia.cancer-pku.cn/) (accessed on 09 March 2025) [14]. To conduct a thorough exploration via GEPIA, a sequential protocol is advised. Upon accessing the platform, the initial step entails navigating to the “Survival Analysis” tab followed by entering the search query “ARPC1A” within the gene search interface. Subsequently, “Overall Survival” should be designated as the preferred metric, and datasets pertaining to LUAD selected within the dataset options, culminating in the activation of the plot function to unveil the relevant insights.
2.3 Functional Enrichment Analysis
The LinkedOmics database serves as a comprehensive repository aggregating data sourced from a myriad of established repositories and scholarly reports, as denoted by the provided hyperlink (https://www.linkedomics.org/login.php) (accessed on 09 March 2025) [15]. Primarily designed to enhance data visualization capabilities, this platform stands poised to empower researchers in unraveling the intricate underpinnings of disease etiology. The modus operandi within the LinkedOmics framework necessitates a systematic approach for optimal utilization. Initial steps entail selecting LUAD data within the designated cancer type classification, followed by specifying RNAseq data as the desired search dataset. Subsequently, the search attribute “ARPC1A” is to be entered, focusing on mRNA expression profiles via RNAseq analysis. In tandem, the Pearson Correlation Test is earmarked as the statistical method of choice for the data type selection process, culminating with the activation of the “SUBMIT” function. By delineating the gene most closely associated with ARPC1A, a subsequent phase of gene ontology (GO) functional enrichment analysis and Kyoto Encyclopedia of Genes and Genomes (KEGG) pathway enrichment analysis was conducted, leveraging the analytical capabilities offered by the R software suite.
2.4 Immune Infiltration Analysis
In the comprehensive evaluation of immune infiltration, a spectrum comprising 24 distinct immune cell types was harnessed to quantify immune infiltration levels and ascertain the relative enrichment scores attributed to these immune cell populations. This intricate analysis was facilitated through the application of single-sample Gene Set Enrichment Analysis (GSEA), with computational implementation orchestrated via the GSVA package integrated within the R software environment. Furthermore, an investigation into the potential interplay between ARPC1A expression levels and the various immune cell cohorts was undertaken through rigorous Spearman correlation analysis methodologies, contributing valuable insights into the complex interrelationships existing within the tumor microenvironment [16].
2.5 Predictions for Drug Sensitivity Analysis
The OncoPredictor represents a curated compilation comprising 198 pharmacotherapeutic agents devised under the stewardship of Maeser, with a primary objective geared towards prognosticating the anticipated responses of cancer patients to this array of chemotherapeutic interventions [17]. Preliminary to the ensuing analytical endeavors, a prerequisite involves the preparation of two pivotal data files. The initial file pertains to the gene expression profiles culled from the TCGA repository, specifically focusing on the expression patterns of the ARPC1A gene. Conversely, the second file encapsulates the cancer drug sensitivity genome matrix sourced from the Genomics of Drug Sensitivity in Cancer (GDSC) repository, housing critical information delineating the half-maximal inhibitory concentration (IC50) metrics corresponding to assorted pharmaceutical agents as gauged against various cancer cell lines [18]. The data were visualized by R software (version 4.2.1).
2.6 Human Cell Lines and Tissue Specimens
The human non-small cell lung cancer (NSCLC) cell lines PC9, HCC827, H1975, and H1299, along with the human normal lung epithelial cell line Beas-2B and HFL1, were purchased from the American Type Culture Collection (ATCC, USA). PC9 and Beas-2B cell lines were maintained in Dulbecco’s modified Eagle’s medium (Pricella, PM150210, Wuhan, China) supplemented with 10% Fetal bovine serum (VivaCell Biosciences, C04001-500, Shanghai, China) and 1% Antibiotics (Biosharp, BL505A, Hefei, China), while HCC827 and H1975 cell lines were cultured in Roswell Park Memorial Institute 1640 medium (Pricella, PM150110, Wuhan, China). The cell lines were incubated at 37°C with 5% CO2. All the cell lines were authenticated through short tandem repeat (STR) profiling, and the mycoplasma contamination test was routinely performed.
To create ARPC1A overexpressing cells, we cloned the ARPC1A Coding DNA Sequence (CDS) into the PHAGE-P plasmid at the BamH1 site by one-step cloning kit (Vazyme, C112-02, Nanjing, China). Transfection was conducted using the PolyJet transfection reagent (SignaGen Laboratories, SL100688, America) in HCC827 and H1975 cells. The cells were cultured in a medium with 1 μg/mL puromycin (Biosharp, BL528A, Hefei, China) until a resistant cell pool was established.
Non-small cell lung cancer tissues were surgically obtained from 5 patients at the First Affiliated Hospital of Anhui Medical University. Acquisition of the donor NSCLC tumor tissues and adjacent normal tissues and the following experimental procedures were approved by the Ethics Committee of Anhui Medical University (Date: 1st March 2023; Approval number: 83230318). All the procedures were performed following the instructions from the Declaration of Helsinki. All the donors have provided written consent for the usage of the donor tissue in scientific research.
2.7 RNA Isolation and Quantitative Real-Time PCR
Total RNA was extracted from non-small cell lung cancer (NSCLC) cells and tissue samples using Trizol reagent (Vazyme, R401-01, Nanjing, China). Subsequently, complementary DNA (cDNA) was synthesized utilizing the Hifair® III 1st Strand cDNA Synthesis SuperMix for quantitative polymerase chain reaction (qPCR) (with gDNA digester plus) kit (Yeasen, 11141ES10, Shanghai, China).
Quantitative real-time PCR (qRT-PCR) was carried out employing the Hieff® qPCR SYBR Green Master Mix (High Rox Plus) (Yeasen, 1120ES03, Shanghai, China) as described previously [6]. The qRT-PCR primer sequences utilized in the study were as follows: for ARPC1A (Homo sapiens), the forward primer sequence was 5′-ATTGCCCTCAGTCCCAATAATCA-3′, and the reverse primer sequence was 5′-CAAGTGACAATGCGGTCGC-3′; for the internal control gene GAPDH (Homo sapiens), the forward primer sequence was 5′-ATTGCCCTCAGTCCCAATAATCA-3′, and the reverse primer sequence was 5′-CAAGTGACAATGCGGTCGC-3′. The siRNA sequences utilized in the study were as follows: ARPC1A siRNA 1: GCAAGATTGTCGCAAATTT; ARPC1A siRNA 2: GCTGCCCAATGCTCTTTAA. NC siRNA: 5′-UUCUCCGAACGUGUCACGUTT-3′.
Cell proliferation was assessed using the Cell Counting Kit-8 (Dojindo, CK04, Shanghai, China). HCC827 and H1975 cells were transfected with ARPC1A non-targeting control (NC) or small interfering RNA (siRNA) at a concentration of 20 nM. Cell counts were conducted 24 h post-transfection with an initial seeding density of 5 × 10³ cells per well in a 96-well plate, at 0, 24, 48, and 72-h time points. Subsequently, 10 μL of the CCK-8 reagent was added to each well, and the plates were incubated for 1 h. The absorbance at 450 nm was then measured using a microplate reader (TECAN, Spark, Switzerland). This analysis was repeated after 24, 48, and 72 h of incubation. The ARPC1A overexpressing HCC827 and H1975 cells, together with the control cells, were seeded at a density of 5 × 10³ cells per well in a 96-well plate, at 0, 24, 48, and 72-h time points.
Initially, HCC827 and H1975 cells were transfected with ARPC1A non-targeting control (NC) or small interfering RNA (siRNA) at a concentration of 20 nM. Cell counting is carried out, with 2000 cells seeded per well in a 6-well plate. After seeding, the cells are maintained in a cell culture incubator at 37°C for 12–15 days. The cells are then fixed using 4% paraformaldehyde for 30 min and subsequently stained with 2% crystal violet (BBI Life Sciences Corporation, E607309-0100, Shanghai, China) for an additional 30 min. Following the staining process, images are captured using an inverted microscope (Mshot, MF52-N, Guangzhou, China) at a magnification level of 4X.
To assess cellular migration, a wound healing assay was conducted. Following transfection with small interfering RNA (siRNA) for 24 h, a 200 μL pipette tip was employed to create a scratch along the confluent monolayer of cells in a 12-well plate. The resultant wounds were documented and evaluated at 0, 24, and 48 h post-scratch. Analysis of the wound healing assay was carried out using the ImageJ software version 1.53C (NIH, Bethesda, MD, USA; https://imagej.net/ij) for quantification of the results.
The cell migration assays were performed as described previously [19]. Briefly, cells (8 × 10⁴) were resuspended in 200 μL of serum-free medium and seeded into the upper compartment of inserts with 8 μm pore size (Corning Costar, CLS3422, Shanghai, China). Concurrently, 600 μL of medium containing 10% fetal bovine serum (FBS) was added to the lower compartment. Following a 12-h incubation period for the migration assessment, cells that successfully migrated through the membrane were fixed using methanol and subsequently stained with 2% crystal violet (BBI, E607309-0100, Shanghai, China). Subsequently, images of the migrated cells were captured using an inverted microscope at a magnification of 10X. All experimental procedures were conducted in triplicate. The quantification of the outcomes from the transwell and migration assays was performed using the ImageJ software version 1.53C (NIH, Bethesda, MD; https://imagej.net/ij).
Western blotting was performed as described previously [20]. Briefly, Cellular proteins were separated via SDS-PAGE, then transferred onto polyvinylidene fluoride (PVDF) (Millipore, IPVH00010, Shanghai, China) or nitrocellulose filter membrane (NC) (Millipore, HATF00010, Shanghai, China) Transfer Membrane. Following a 2-h blocking step at room temperature, the membranes were subjected to an overnight incubation at 4°C with specific antibodies targeting GAPDH (1:50000) and ARPC1A (1:1000). Sequentially, the membranes underwent incubation with secondary antibodies for 1 h at room temperature. Subsequent washing steps were followed by exposure to Ultrasensitive ECL Chemiluminescent Substrate (Biosharp, BL523B, Hefei, China), and imaging was performed using the ChemiCapture Imaging System (Clinx, 6000Exp, Shanghai, China). The quantification of protein levels was performed by normalizing to the internal control protein GAPDH using ImageJ software version 1.53C (NIH, Bethesda, MD; https://imagej.net/ij).
The primary antibodies employed included anti-ARPC1A (Proteintech, 17538-1-AP, Wuhan, China, 1:1000 for WB); GAPDH (Proteintech, 60004-1-Ig, Wuhan, China, 1:50000 for WB), E-cadherin (CST, 3195, America, 1:1000 for WB), Vimentin (CST, 5741, America, 1:1000 for WB), and Slug (CST, 9585, America, 1:1000 for WB). HRP-conjugated Goat Anti-Rabbit IgG(H+L) (Proteintech, SA00001-2, Wuhan, China, 1:10000 for WB). HRP-conjugated Goat Anti-Mouse IgG(H+L) (Proteintech, SA00001-1, Wuhan, China, 1:10000 for WB).
All the data are presented as the mean ± standard error of the mean (SEM) from at least three independent experiments. Statistical significance was calculated using the Student’s t-test for pairwise comparisons. * indicates p < 0.05. ** indicates p < 0.01, *** indicates p < 0.001.
3.1 Upregulation of ARPC1A in NSCLC
To investigate the expression patterns of ARPC1A within tumor and normal tissues, we initially mined the data from The Cancer Genome Atlas (TCGA). The dataset encompassed 33 tumor types, including LUAD, lung squamous cell carcinomas (LUSC), breast cancer (BRCA), and a diverse spectrum of 19 other malignancies. Our analysis demonstrated the expression levels of ARPC1A in tumors and adjacent normal tissues (Fig. 1A). Subsequent scrutiny of non-paired TCGA datasets unveiled a statistically significant upregulation of ARPC1A expression in NSCLC (Fig. 1B). Noteworthy insight emerged from paired expression data analysis sourced from TCGA, elucidating a substantial augmentation in ARPC1A expression in tumor tissues (Fig. 1C). Leveraging the GEPIA database, it was further elucidated that heightened ARPC1A expression in NSCLC correlated with a markedly poorer prognosis in terms of survival outcomes compared to cases with lower ARPC1A expression levels (Fig. 1D).
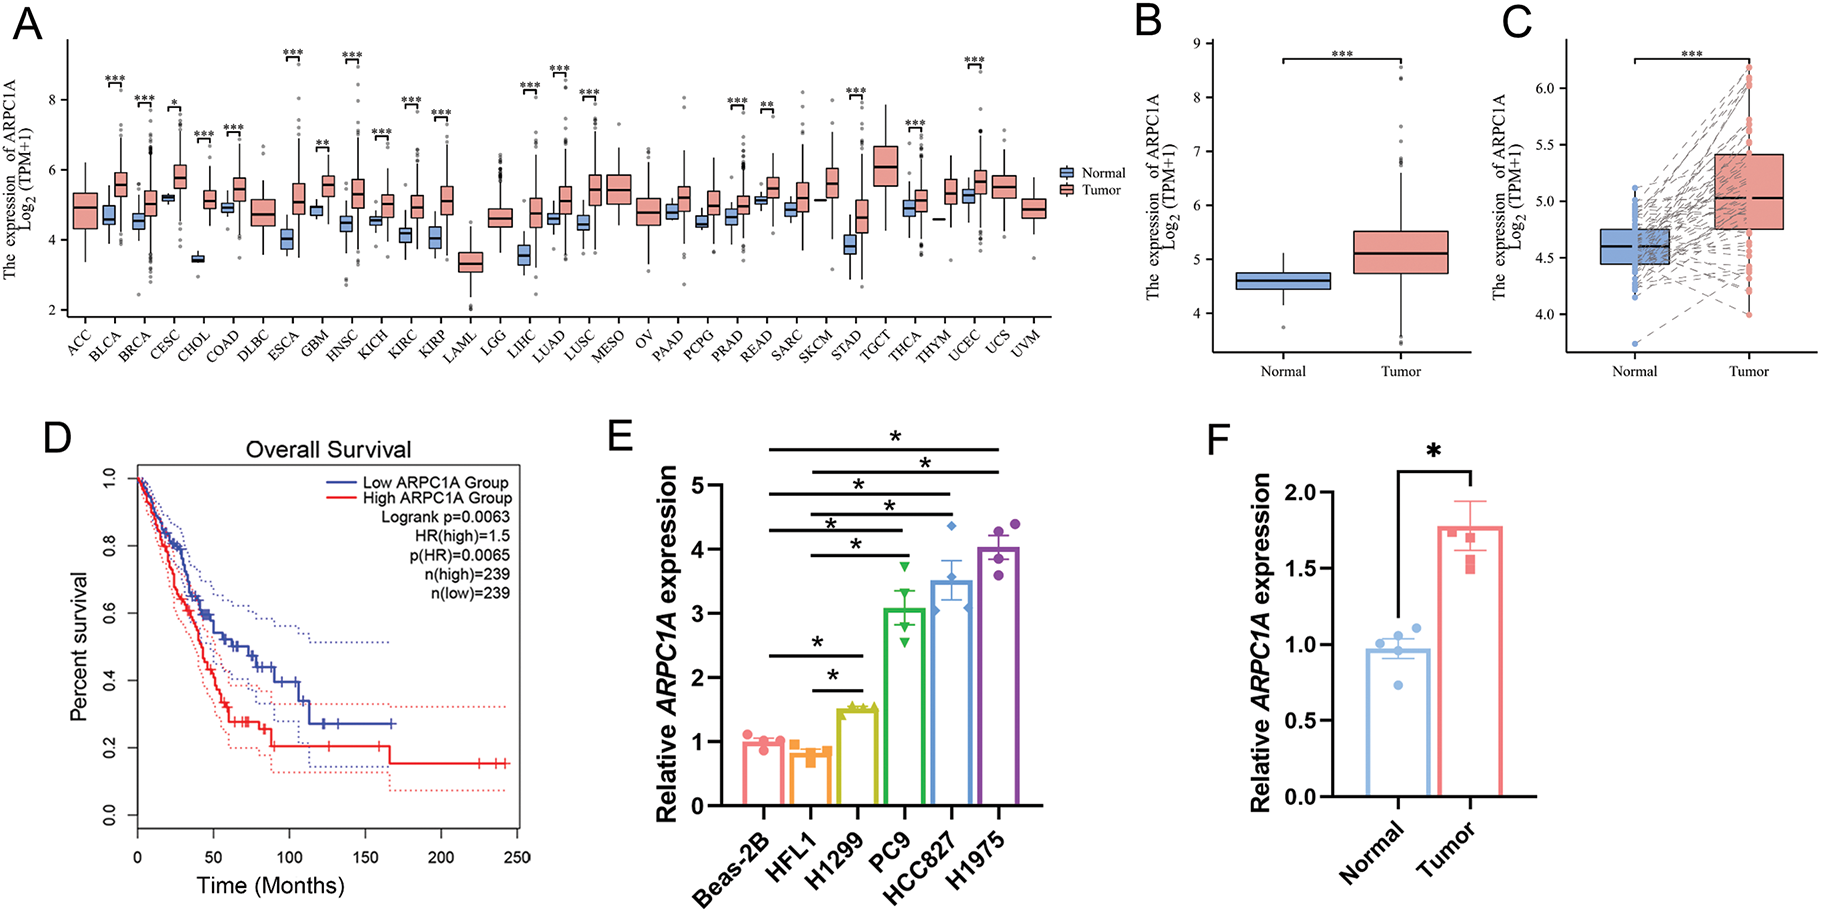
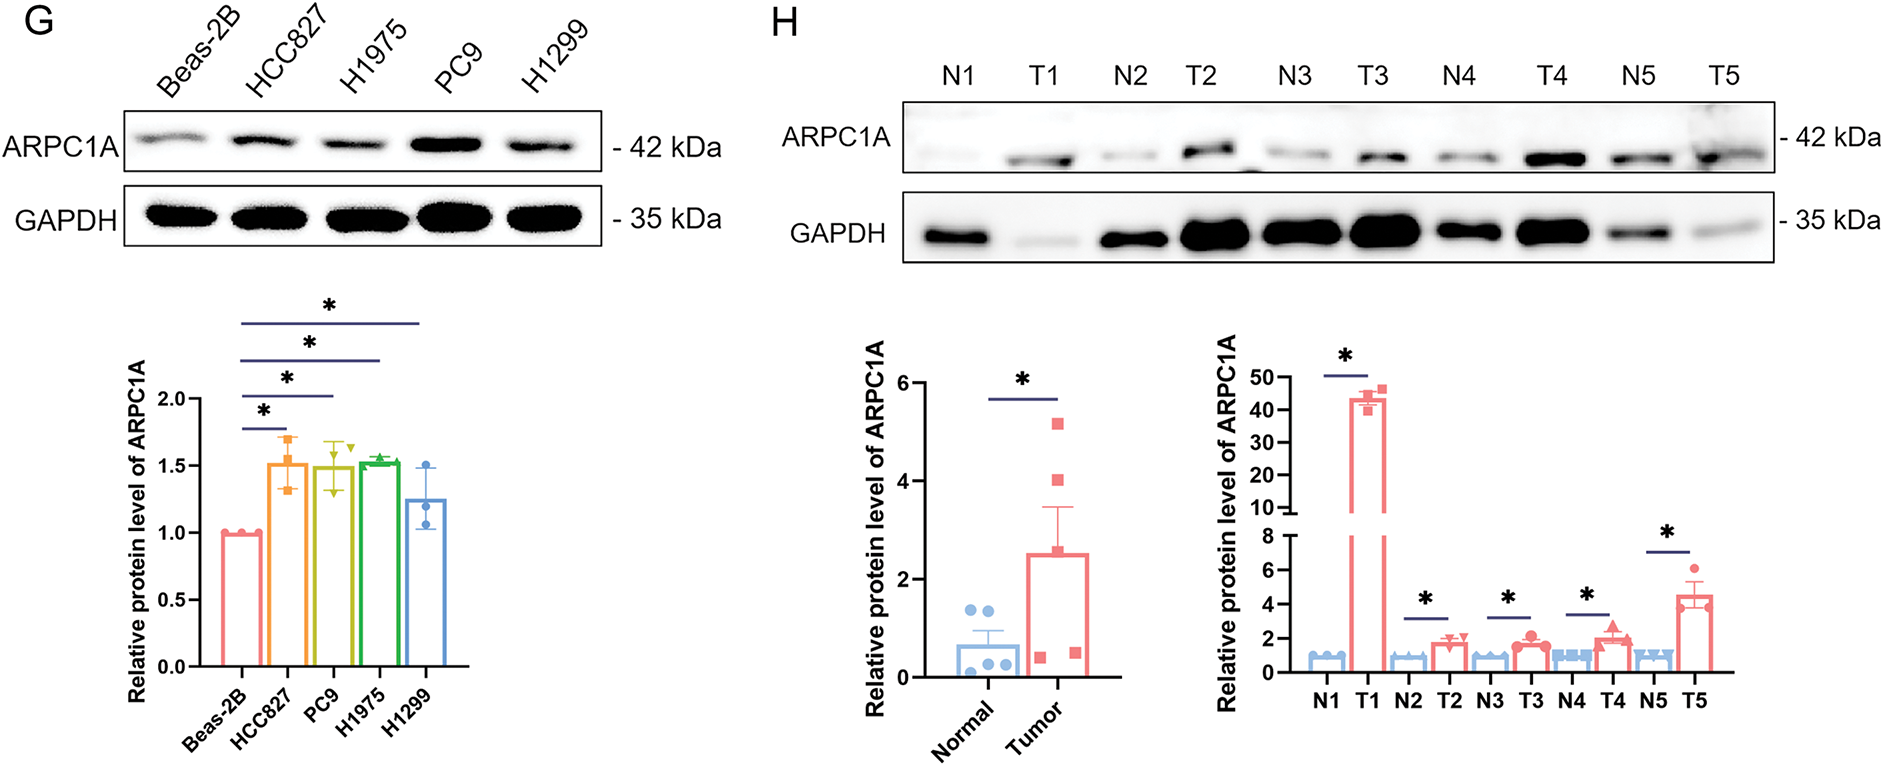
Figure 1: Upregulation of ARPC1A in NSCLC cell lines and tissues. (A) The expression level of ARPC1A in pan-cancer based on the data from the TCGA database. * indicates p < 0.05, ** indicates p < 0.01. *** indicates p < 0.001. (B) The expression level of ARPC1A in NSCLC in non-paired samples based on the data from the TCGA database. *** indicates p < 0.001. (C) The expression level of ARPC1A in NSCLC in paired samples from TCGA data. *** indicates p < 0.001. (D) The relationship between ARPC1A and Overall Survival Probability in patients with NSCLC. (E) The expression level of ARPC1A in NSCLC cell lines and normal lung epithelial cell lines were determined by qPCR. Quantification of n = 3 experiments, mean ± SEM, * indicates p < 0.05. (F) The expression level of ARPC1A in collected NSCLC surgery samples (n = 5) was determined by q-PCR. The red color represents “NSCLC tumor tissue”, and the blue color represents “adjacent normal tissue”. * indicates p < 0.05. (G) The expression level of ARPC1A in NSCLC cell lines and normal lung epithelial cell lines were determined by Western blotting. Up panel: representative experiment. Down panel: quantification of n = 3 experiments, mean ± SEM. * indicates p < 0.05. (H) The expression level of ARPC1A in collected NSCLC surgery samples (n = 5) was determined by Western blotting. Up panel: representative experiment. Down panel: quantification of n = 3 experiments, mean ± SEM. * indicates p < 0.05
Subsequent validation experiments were undertaken to corroborate the expression levels of ARPC1A in normal lung epithelial cell lines, namely Beas-2B and HFL1, together with NSCLC cell lines H1299, PC9, HCC827, and H1975, employing both quantitative-PCR and Western blotting analyses. Our quantitative-PCR experiments reported elevated ARPC1A expression in NSCLC cell lines, compared to the normal lung epithelial cell lines (Fig. 1E). Accordingly, the upregulated transcript level of ARPC1A was observed in NSCLC tissues compared to the adjacent normal tissues (Fig. 1F, Fig. S1). Western blotting further indicated that the protein level of ARPC1A was upregulated in NSCLC cell lines (Fig. 1G), as well as in NSCLC tissues (Fig. 1H). These results from datamining and experiments reveal that ARPC1A was upregulated in NSCLC, suggesting it may act roles during oncogenesis or cancer progression.
3.2 ARPC1A Is a Potential Early Diagnostic Biomarker for NSCLC
To elucidate the clinical features linked to ARPC1A expression, a cohort analysis was conducted utilizing the TCGA dataset whereby individuals were stratified into either ARPC1A high-expression or low-expression groups based on the median expression levels for subsequent clinical assessment. The outcomes of this investigation revealed a discernible association between ARPC1A expression and TNM staging, with a marked elevation observed in T2 and T3 stages, compared to the T1 stage (Fig. 2A,B). Notably, disparities in N-staging were also observed, with N0 exhibiting lower ARPC1A expression levels compared to N2 and N3 stages (Fig. 2C). Furthermore, an analysis of M staging unveiled a significant increase in ARPC1A expression in the M1 stage relative to the M0 stage (Fig. 2D). Nevertheless, no distinct trends were discerned in ARPC1A expression concerning sex, age, and overall staging (Fig. 2E–G). These revelations substantiate the premise that ARPC1A may act a pivotal role in the early progression of lung cancer and could potentially serve as a promising candidate for early-stage diagnostic biomarker applications in lung cancer management.
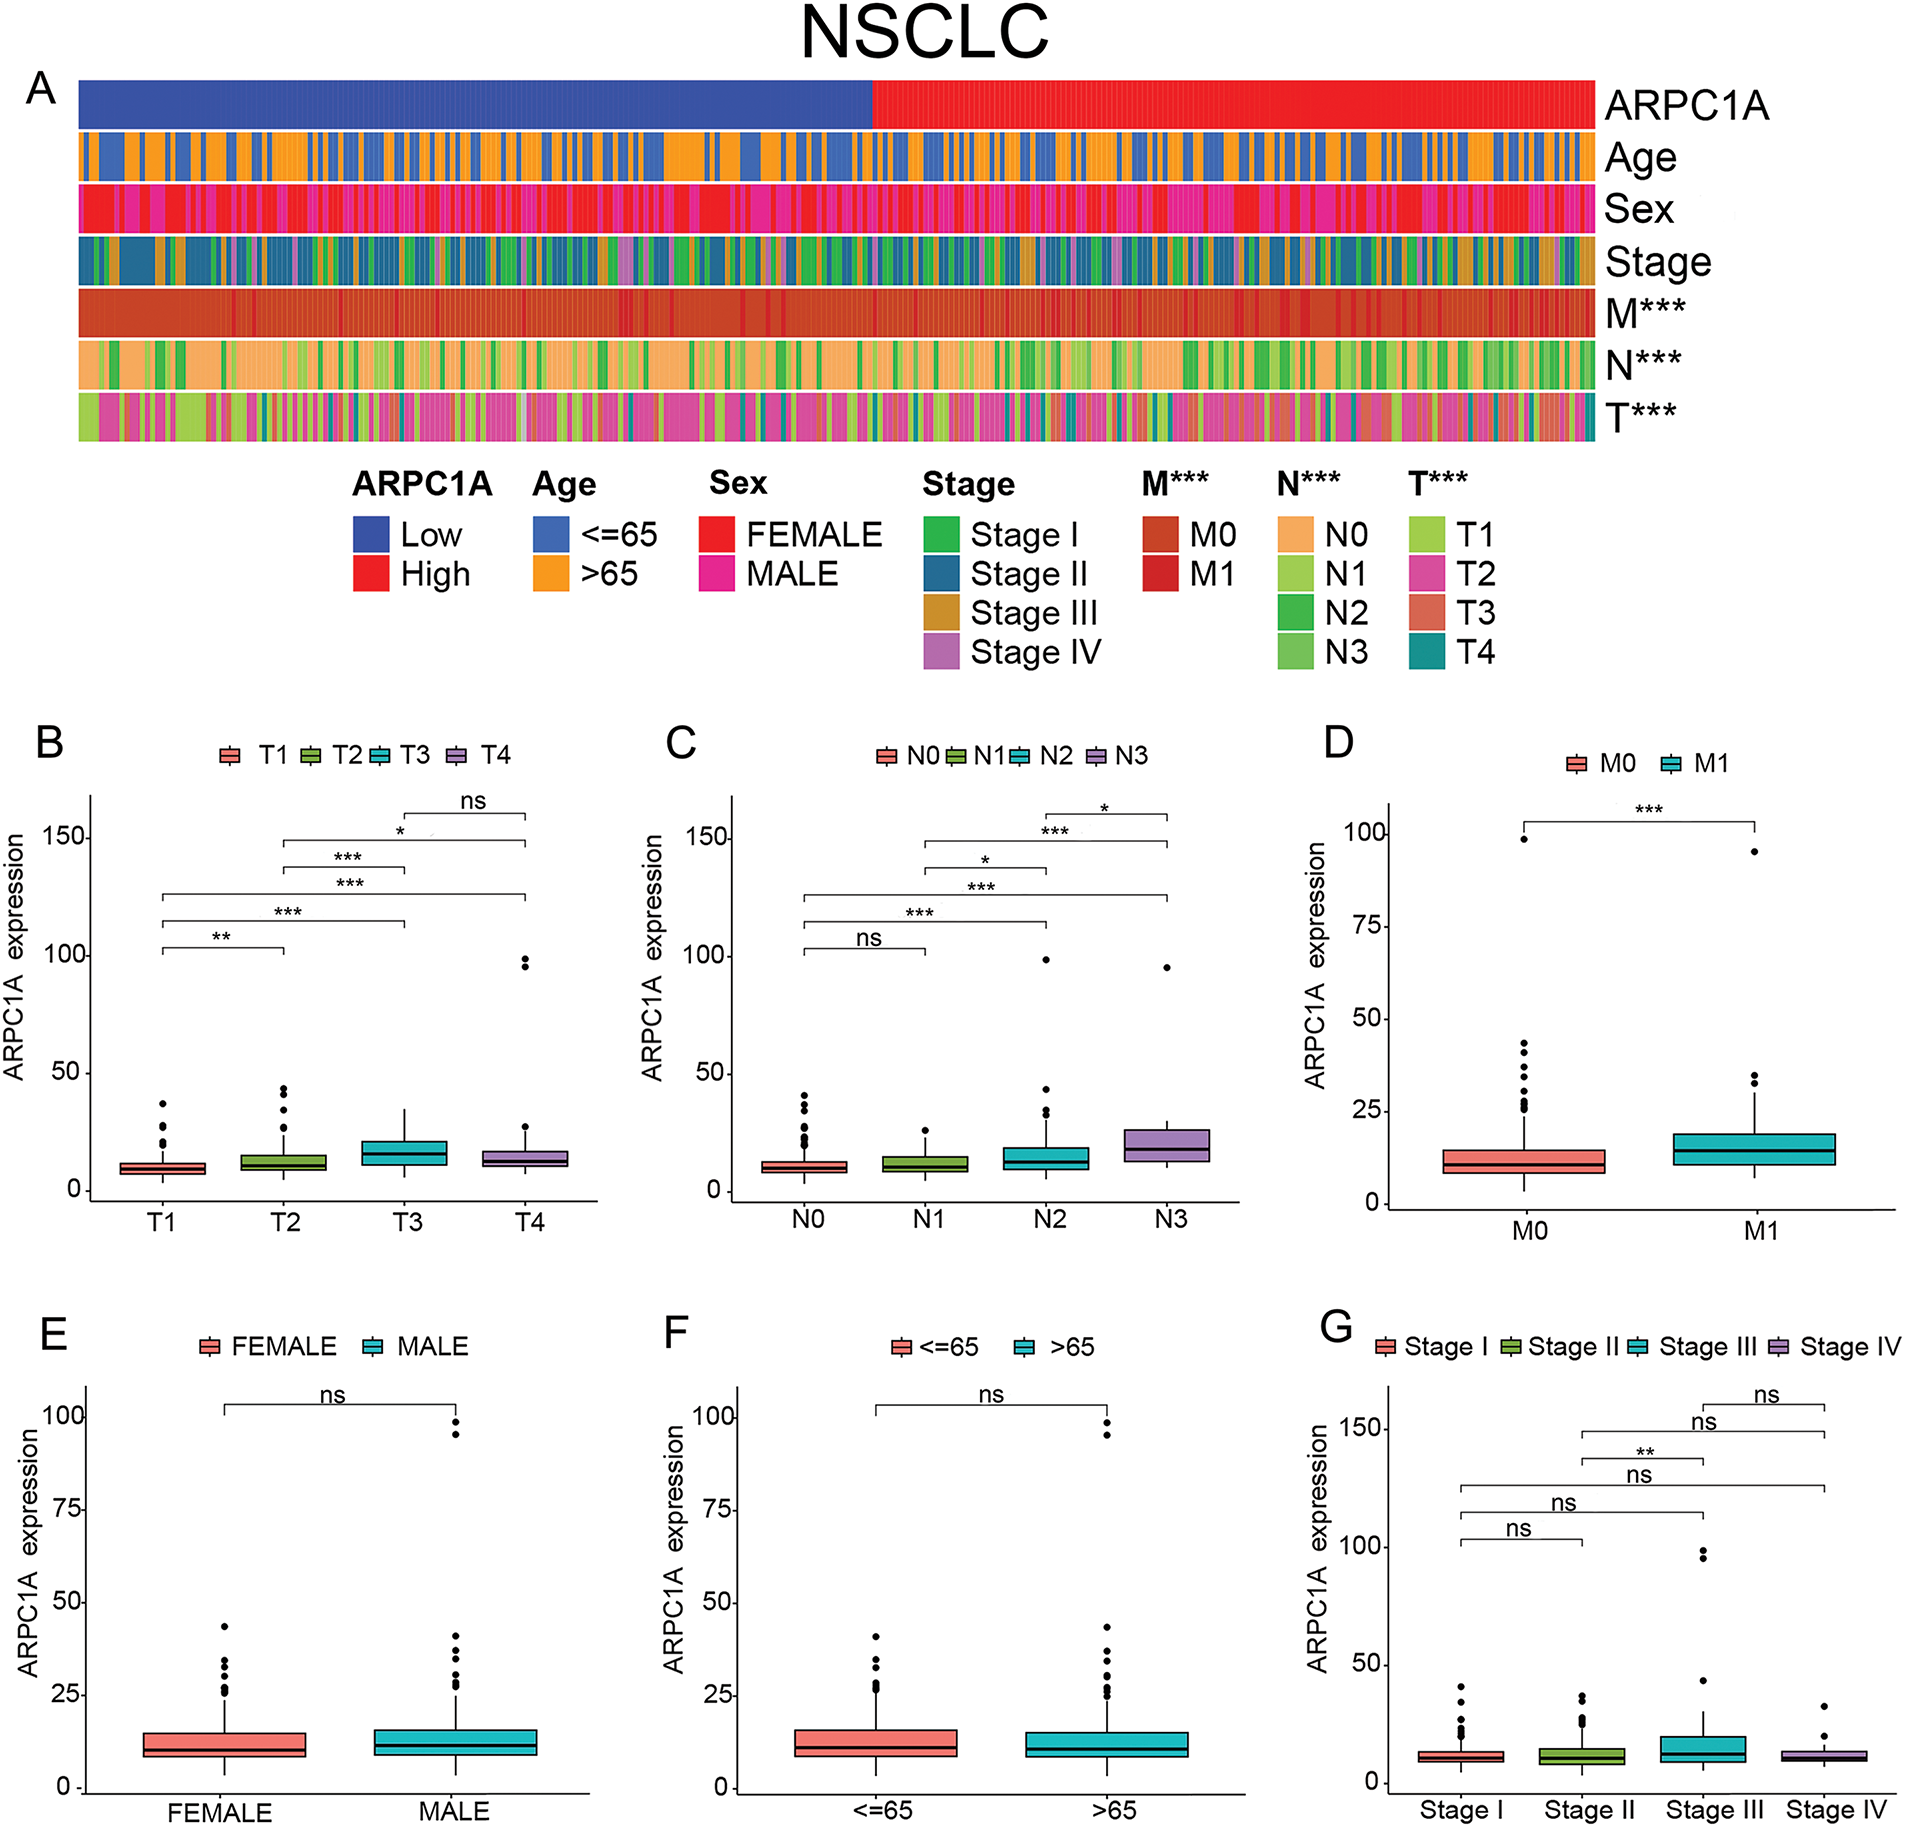
Figure 2: ARPC1A is a potential early diagnostic biomarker for NSCLC. (A) The heatmap showing the association between the ARPC1A expression and clinical features in NSCLC patients. *** indicates p < 0.001. (B) Box plot showing the ARPC1A expression in different T stages in patients with NSCLC. * indicates p < 0.05. ** indicates p < 0.01. *** indicates p < 0.001. “ns” indicates no significance. (C) Box plot showing the ARPC1A expression in different N stages in patients with NSCLC. * indicates p < 0.05. *** indicates p < 0.001. “ns” indicates no significance. (D) Box plot showing the ARPC1A expression in different M stages in patients with NSCLC. *** indicates p < 0.001. (E) Box plot showing the ARPC1A expression in different sexes in patients with NSCLC. “ns” indicates no significance. (F) Box plot showing the ARPC1A expression in different ages in patients with NSCLC. “ns” indicates no significance. (G) Box plot showing the ARPC1A expression in different Stages in patients with NSCLC. ** indicates p < 0.01. “ns” indicates no significance.
3.3 ARPC1A Is Potentially Involved in Multiple Gene Network
Through an exhaustive examination of the interplay between the ARPC1A gene and its interactors within the TCGA dataset, we meticulously illustrated the landscape of ARPC1A co-expressed genes via a visually informative volcano plot (Fig. 3A), subsequently spotlighting the top 50 correlated genes through a comprehensive heatmap depiction (Fig. 3B). Further augmenting our comprehensive analysis, we embarked on a detailed exploration of the functional enrichment profiles of ARPC1A and its interacting partners (Table S1). Delving into subcellular localization components, our scrutiny unveiled a prominent enrichment of the target genes within key locales encompassing the mitochondrial matrix, mitochondrial inner membrane, and ribosomal structures (Fig. 3C). At the molecular function level, the interactions primarily showcased enrichments in pivotal activities such as protein kinase regulator functions, RNA methyltransferase activities, and cyclin-associated roles (Fig. 3D). Pertaining to biological processes, the interactions predominantly clustered around essential cellular processes, including DNA replication, mitotic cell cycle progression, and RNA methylation cascades (Fig. 3E). A comprehensive survey of the KEGG pathways further underscored the involvement of ARPC1A and its co-expressed genes in pivotal pathways such as cell cycle regulation, DNA replication mechanisms, drug metabolism pathways, and the renowned P53 signaling network (Fig. 3F). These data collectively demonstrated a prospective regulatory nexus where ARPC1A potentially influences NSCLC progression through its modulatory roles within these intricate signaling cascades.
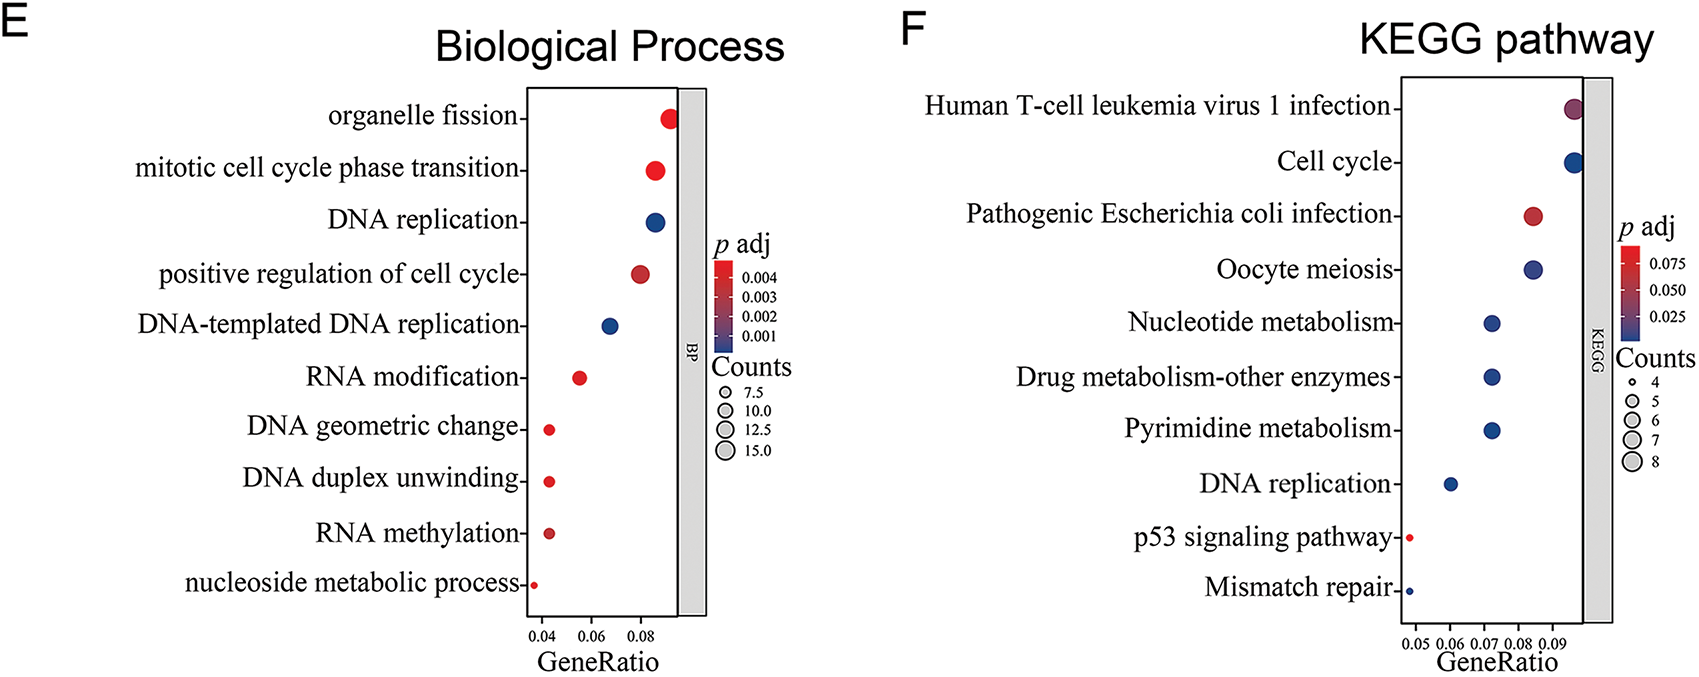
Figure 3: Bioinformatic analysis reveals multiple biological progresses ARPC1A potentially involved in (A) Volcano Plot of gene co-expressed with ARPC1A. (B) Heat map displays the expression level of ARPC1A co-expressed genes. (C) The GO analysis of cellular components was performed on ARPC1A and its co-expressed gene set. (D) The GO analysis of molecular function was performed on ARPC1A and its co-expressed gene set. (E) The GO analysis of biological process was performed on ARPC1A and its co-expressed gene set. (F) KEGG analysis was performed on ARPC1A and its co-expressed gene set
3.4 ARPC1A Stimulates the Resistance to Chemotherapeutic Drugs
We thereafter set to examine the role of ARPC1A in cell proliferation and drug resistance. ARPC1A siRNA was introduced into HCC827 and H1975 cells, and the efficacy of knockdown was duly verified through quantitative-PCR and Western blotting analysis (Fig. 4A,B). Due to ARPC1A siRNA1 displayed high efficiency of gene silencing, we selected it in subsequent experiments (referred to as “ARPC1A siRNA” in the following text). In the Cell Counting Kit-8 (CCK8) experiment, the proliferation ability of HCC827 and H1975 cell lines significantly decreased when ARPC1A was knocked down (Fig. 4C). Furthermore, we overexpressed ARPC1A in HCC827 and H1975 cells, which were verified by Western blotting (Fig. S2A,B). As anticipated, enhanced cell proliferative capabilities were documented in ARPC1A expressing cells (Fig. S2C,D). Moreover, subsequent colony formation assays independently confirmed the reduced proliferation induced by ARPC1A depletion in lung cancer cells (Fig. 4D). These results together indicate a suppressive role of ARPC1A in the NSCLC cell growth.
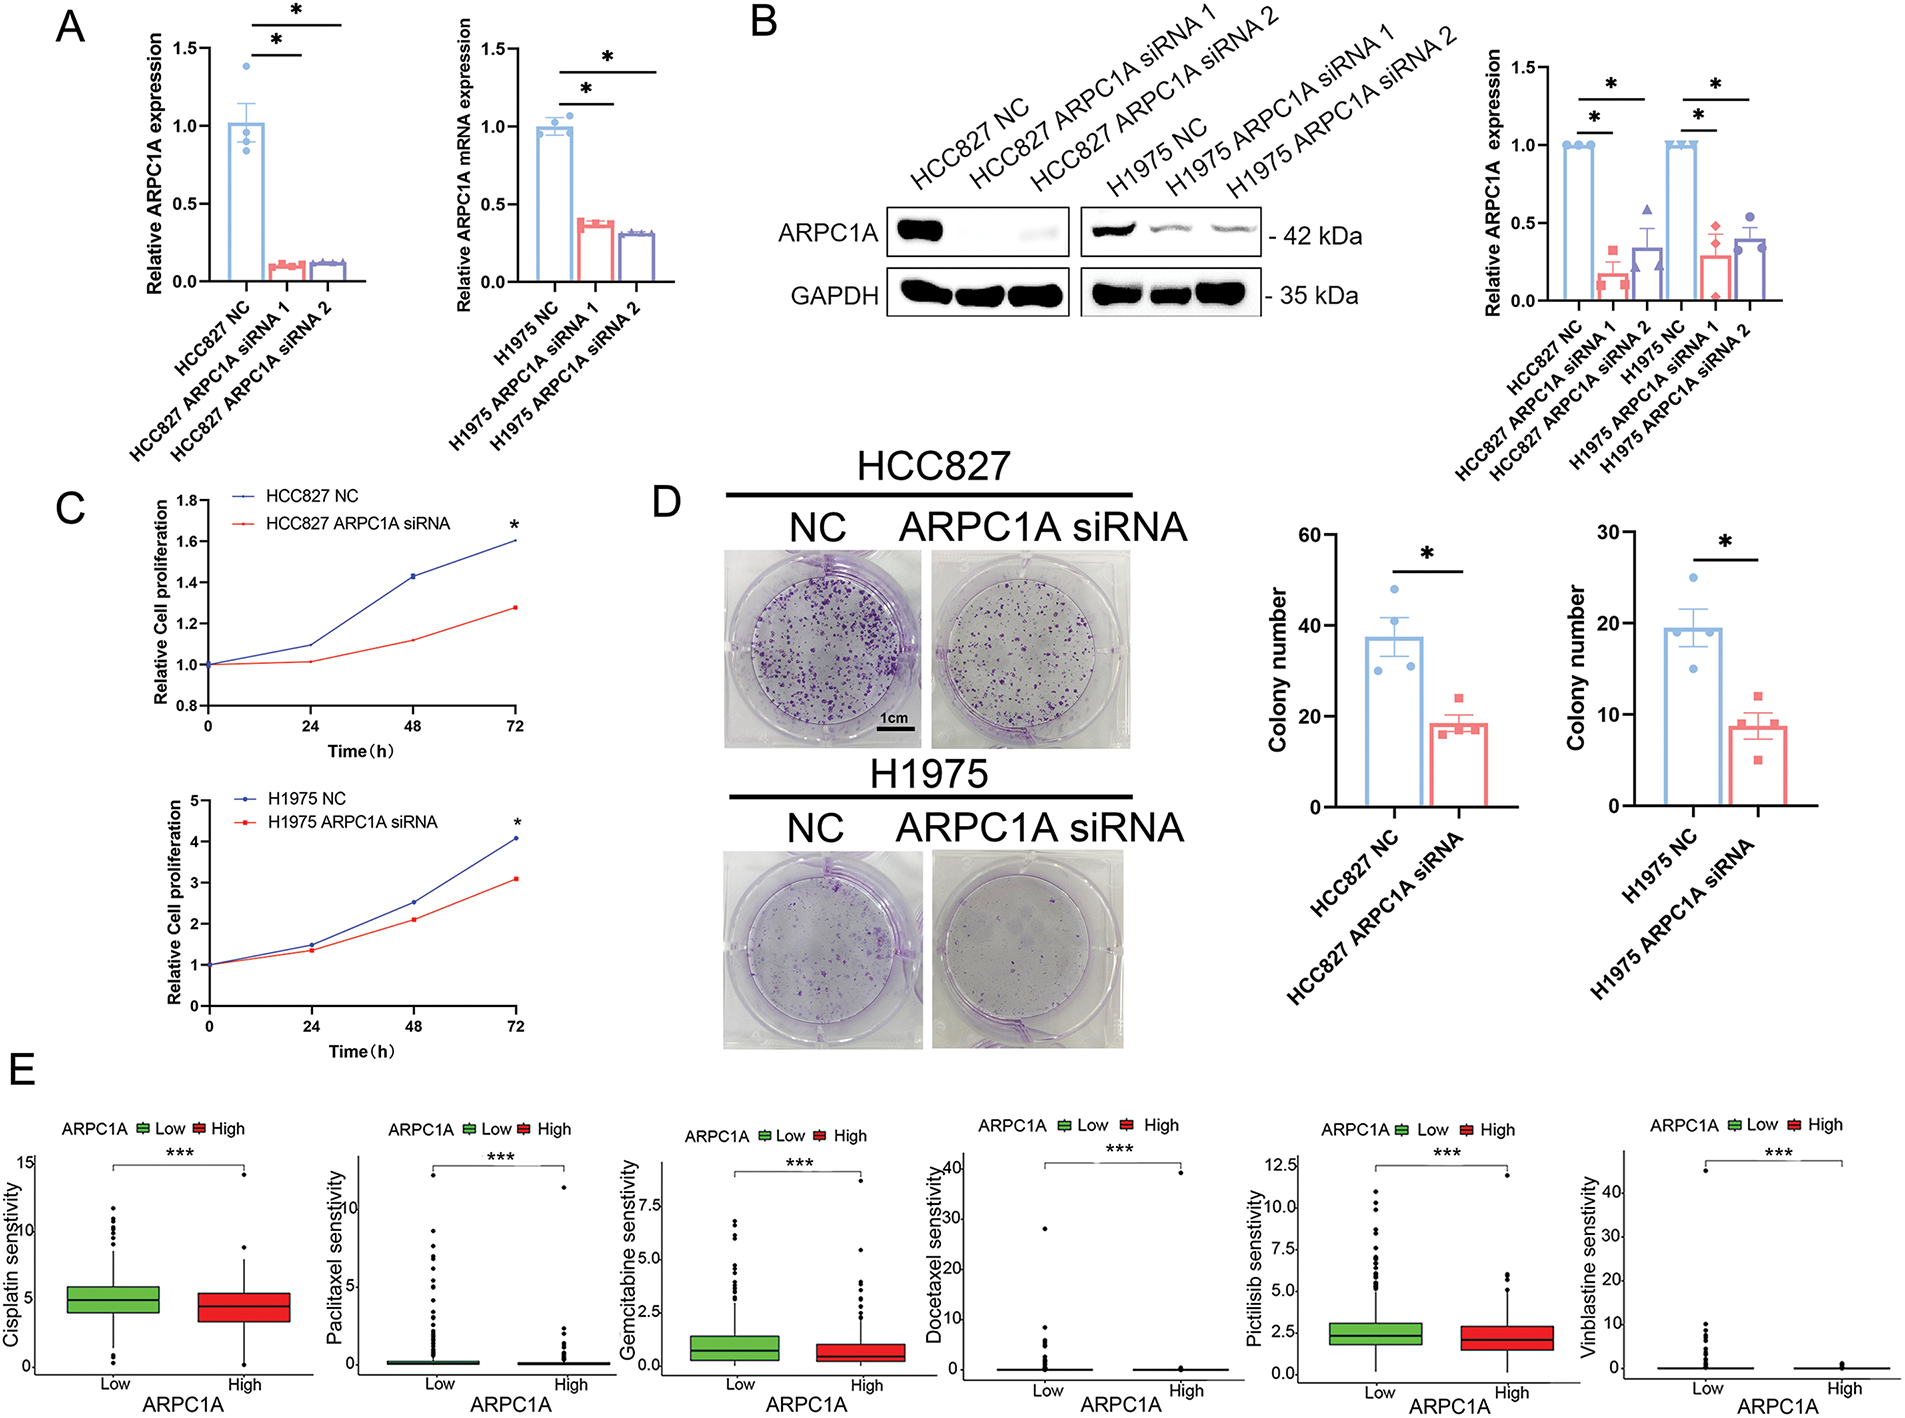
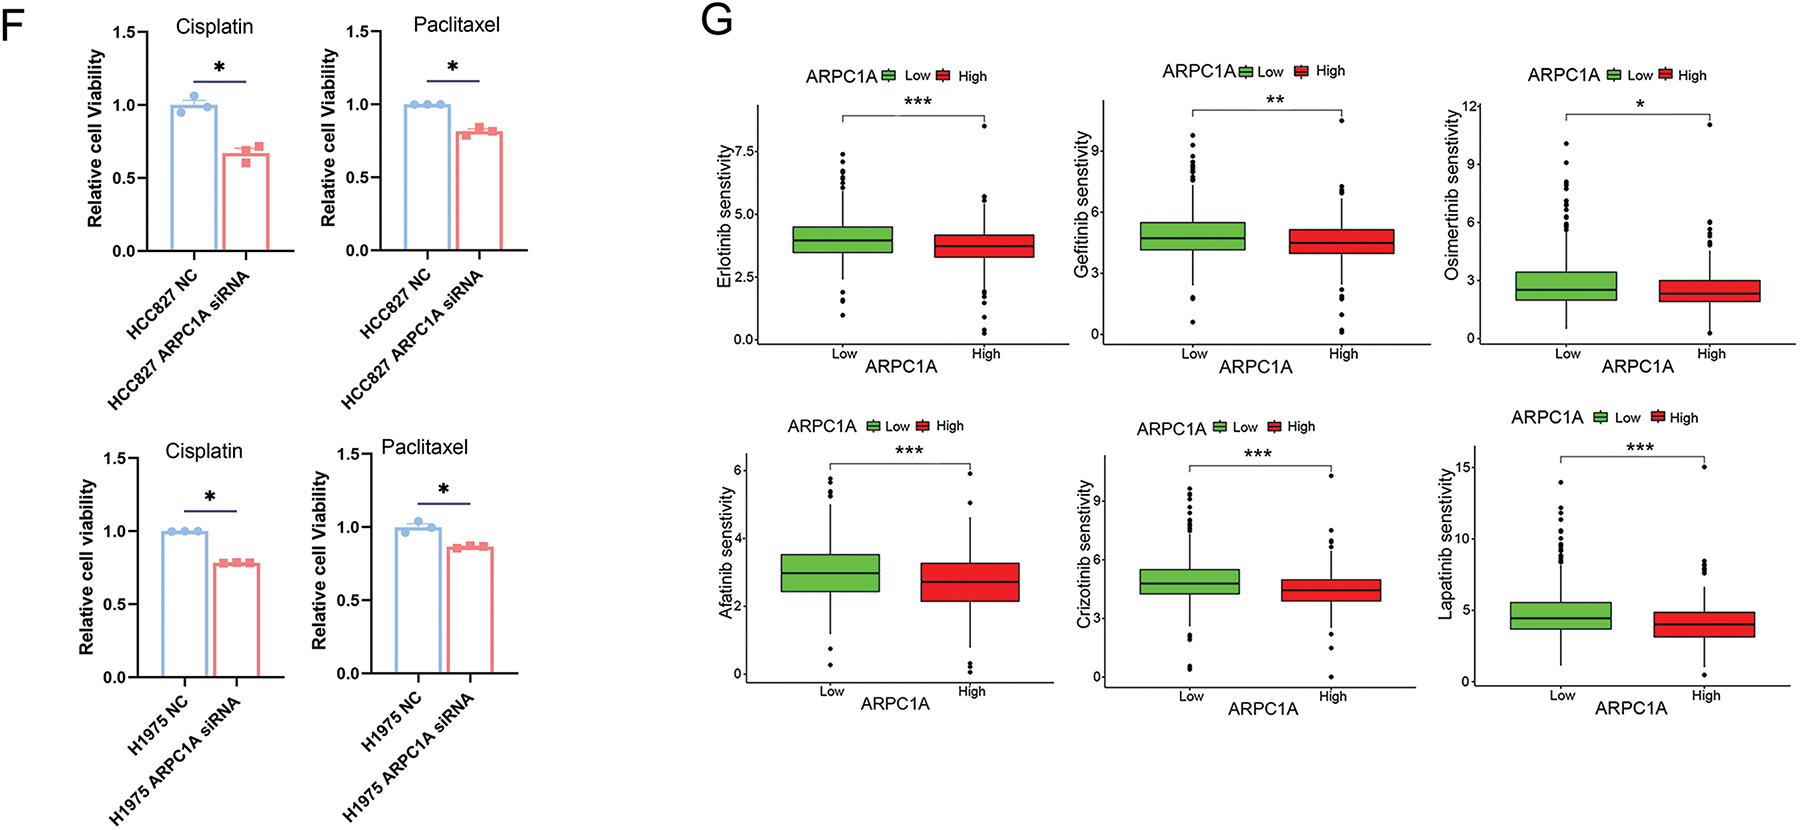
Figure 4: ARPC1A promotes cell proliferation and the resistance to chemotherapeutic drugs. (A) The expression of ARPC1A was examined by qRT-PCR in HCC827 and H1975 transfected with the ARPC1A siRNA or negative control (NC). Mean ± SEM. * indicates p < 0.05. (B) The expression of ARPC1A was examined by Western blotting in HCC827 and H1975 transfected with the ARPC1A siRNA and negative control (NC). Mean ± SEM. * indicates p < 0.05. (C) HCC827 cells and H1975 cells were treated with negative control (NC) and ARPC1A siRNA, the cell proliferation was then measured using a CCK8 assay. Quantification of 3 experiments, mean ± SEM. * indicates p < 0.05. (D) The efficiencies of cell colony formation in HCC827 and H1975 cells transfected with negative control (NC) and ARPC1A siRNA. Left panel: Representative images. Scale bar = 1 cm. Right panel: Quantification of 4 experiments. Mean ± SEM. * indicates p < 0.05. (E) The cisplatin, paclitaxel, gemcitabine, Docetaxel, Pictilisib, and Vinblastine sensitivity between ARPC1A high-expressed group and ARPC1A low-expressed group in NSCLC. *** indicates p < 0.001. (F) HCC827 cells or H1975 cells were treated with negative control (NC) and ARPC1A siRNA for 24 h, cells were subjected to drug sensitivity experiments using the CCK8 assay. Quantification of 3 experiments, mean ± SEM. * indicates p < 0.05. The Erlotinib, Gefitinib, Osimertinib, Afatinib, Crizotinib, and Lapatinib sensitivity between ARPC1A high-expressed group and ARPC1A low-expressed group in NSCLC. * indicates p < 0.05. ** indicates p < 0.01. *** indicates p < 0.001.
To elucidate whether ARPC1A regulates drug sensitivity, we conducted an analysis comparing drug responses between groups with high and low ARPC1A expression. Our findings demonstrated a negative association between ARPC1A expression levels and susceptibility to broad-spectrum chemotherapeutic agents like cisplatin, paclitaxel, and gemcitabine in NSCLC (Fig. 4E). Specifically, further validation with cisplatin and paclitaxel revealed varying levels of drug sensitivity. Previous investigations have shown the half-maximal inhibitory concentration (IC50) values of cisplatin to be 13.7 and 9.6 μM and of paclitaxel to be 0.512 and 2.59 μM for HCC827 and H1975 cells, respectively [21–24]. Employing these established IC50 concentrations, drug sensitivity assessments in ARPC1A siRNA-transfected cells uncovered heightened susceptibility to cisplatin and paclitaxel in both HCC827 and H1975 cell lines compared to the control groups (Fig. 4F). The ARPC1A expression level is intricately linked to responsiveness to a range of targeted pharmaceutical agents. In NSCLC, mutations within the epidermal growth factor receptor (EGFR) gene are prevalent, occurring in approximately 40% of cases [21]. Therapeutic strategies often revolve around EGFR-targeted kinase inhibitors (TKIs) like erlotinib, gefitinib, osimertinib, and afatinib, tailored to combat EGFR mutations. Among these, erlotinib and gefitinib belong to the first generation of drugs, afatinib to the second, and osimertinib to the third. Around 3%–10% of NSCLC patients exhibit fusion mutations within the anaplastic lymphoma kinase (ALK) gene, a genetic alteration recognized for its role in promoting tumor proliferation and invasiveness. Crizotinib represents the primary targeted therapeutic option for ALK-positive NSCLC. Our investigation from mining the database has suggested a discernible inverse relationship between ARPC1A expression levels and the efficacy of erlotinib, gefitinib, osimertinib, and afatinib, while a similar negative correlation was observed in conjunction with crizotinib. Moreover, an adverse association was documented with lapatinib, a targeted agent commonly employed in treating breast cancer (Fig. 4G). These data indicate that ARPCIA may display a broad regulatory role in the resistance not only to chemotherapeutic drugs but also to targeted drugs.
The Erlotinib, Gefitinib, Osimertinib, Afatinib, Crizotinib, and Lapatinib sensitivity between ARPC1A high-expressed group and ARPC1A low-expressed group in NSCLC. * indicates p < 0.05. ** indicates p < 0.01. *** indicates p < 0.001.
3.5 ARPC1A Prompts Cell Migration via Stimulating EMT
To elucidate the potential involvement of ARPC1A in the NSCLC, we utilized a wound healing assay to determine the capability of cell migration, our experiments report a marked reduction in cell migration rates following ARPC1A knockdown (Fig. 5A,B). Conversely, an increased migratory capacity was observed in cells expressing ARPC1A (Fig. S3A,B). We, therefore, employed Transwell assay analyses and found that the downregulation of ARPC1A leads to a significant reduction in the migratory capability. Importantly, similar results were obtained in both HCC827 cell and H1975 cells (Fig. 5C,D).
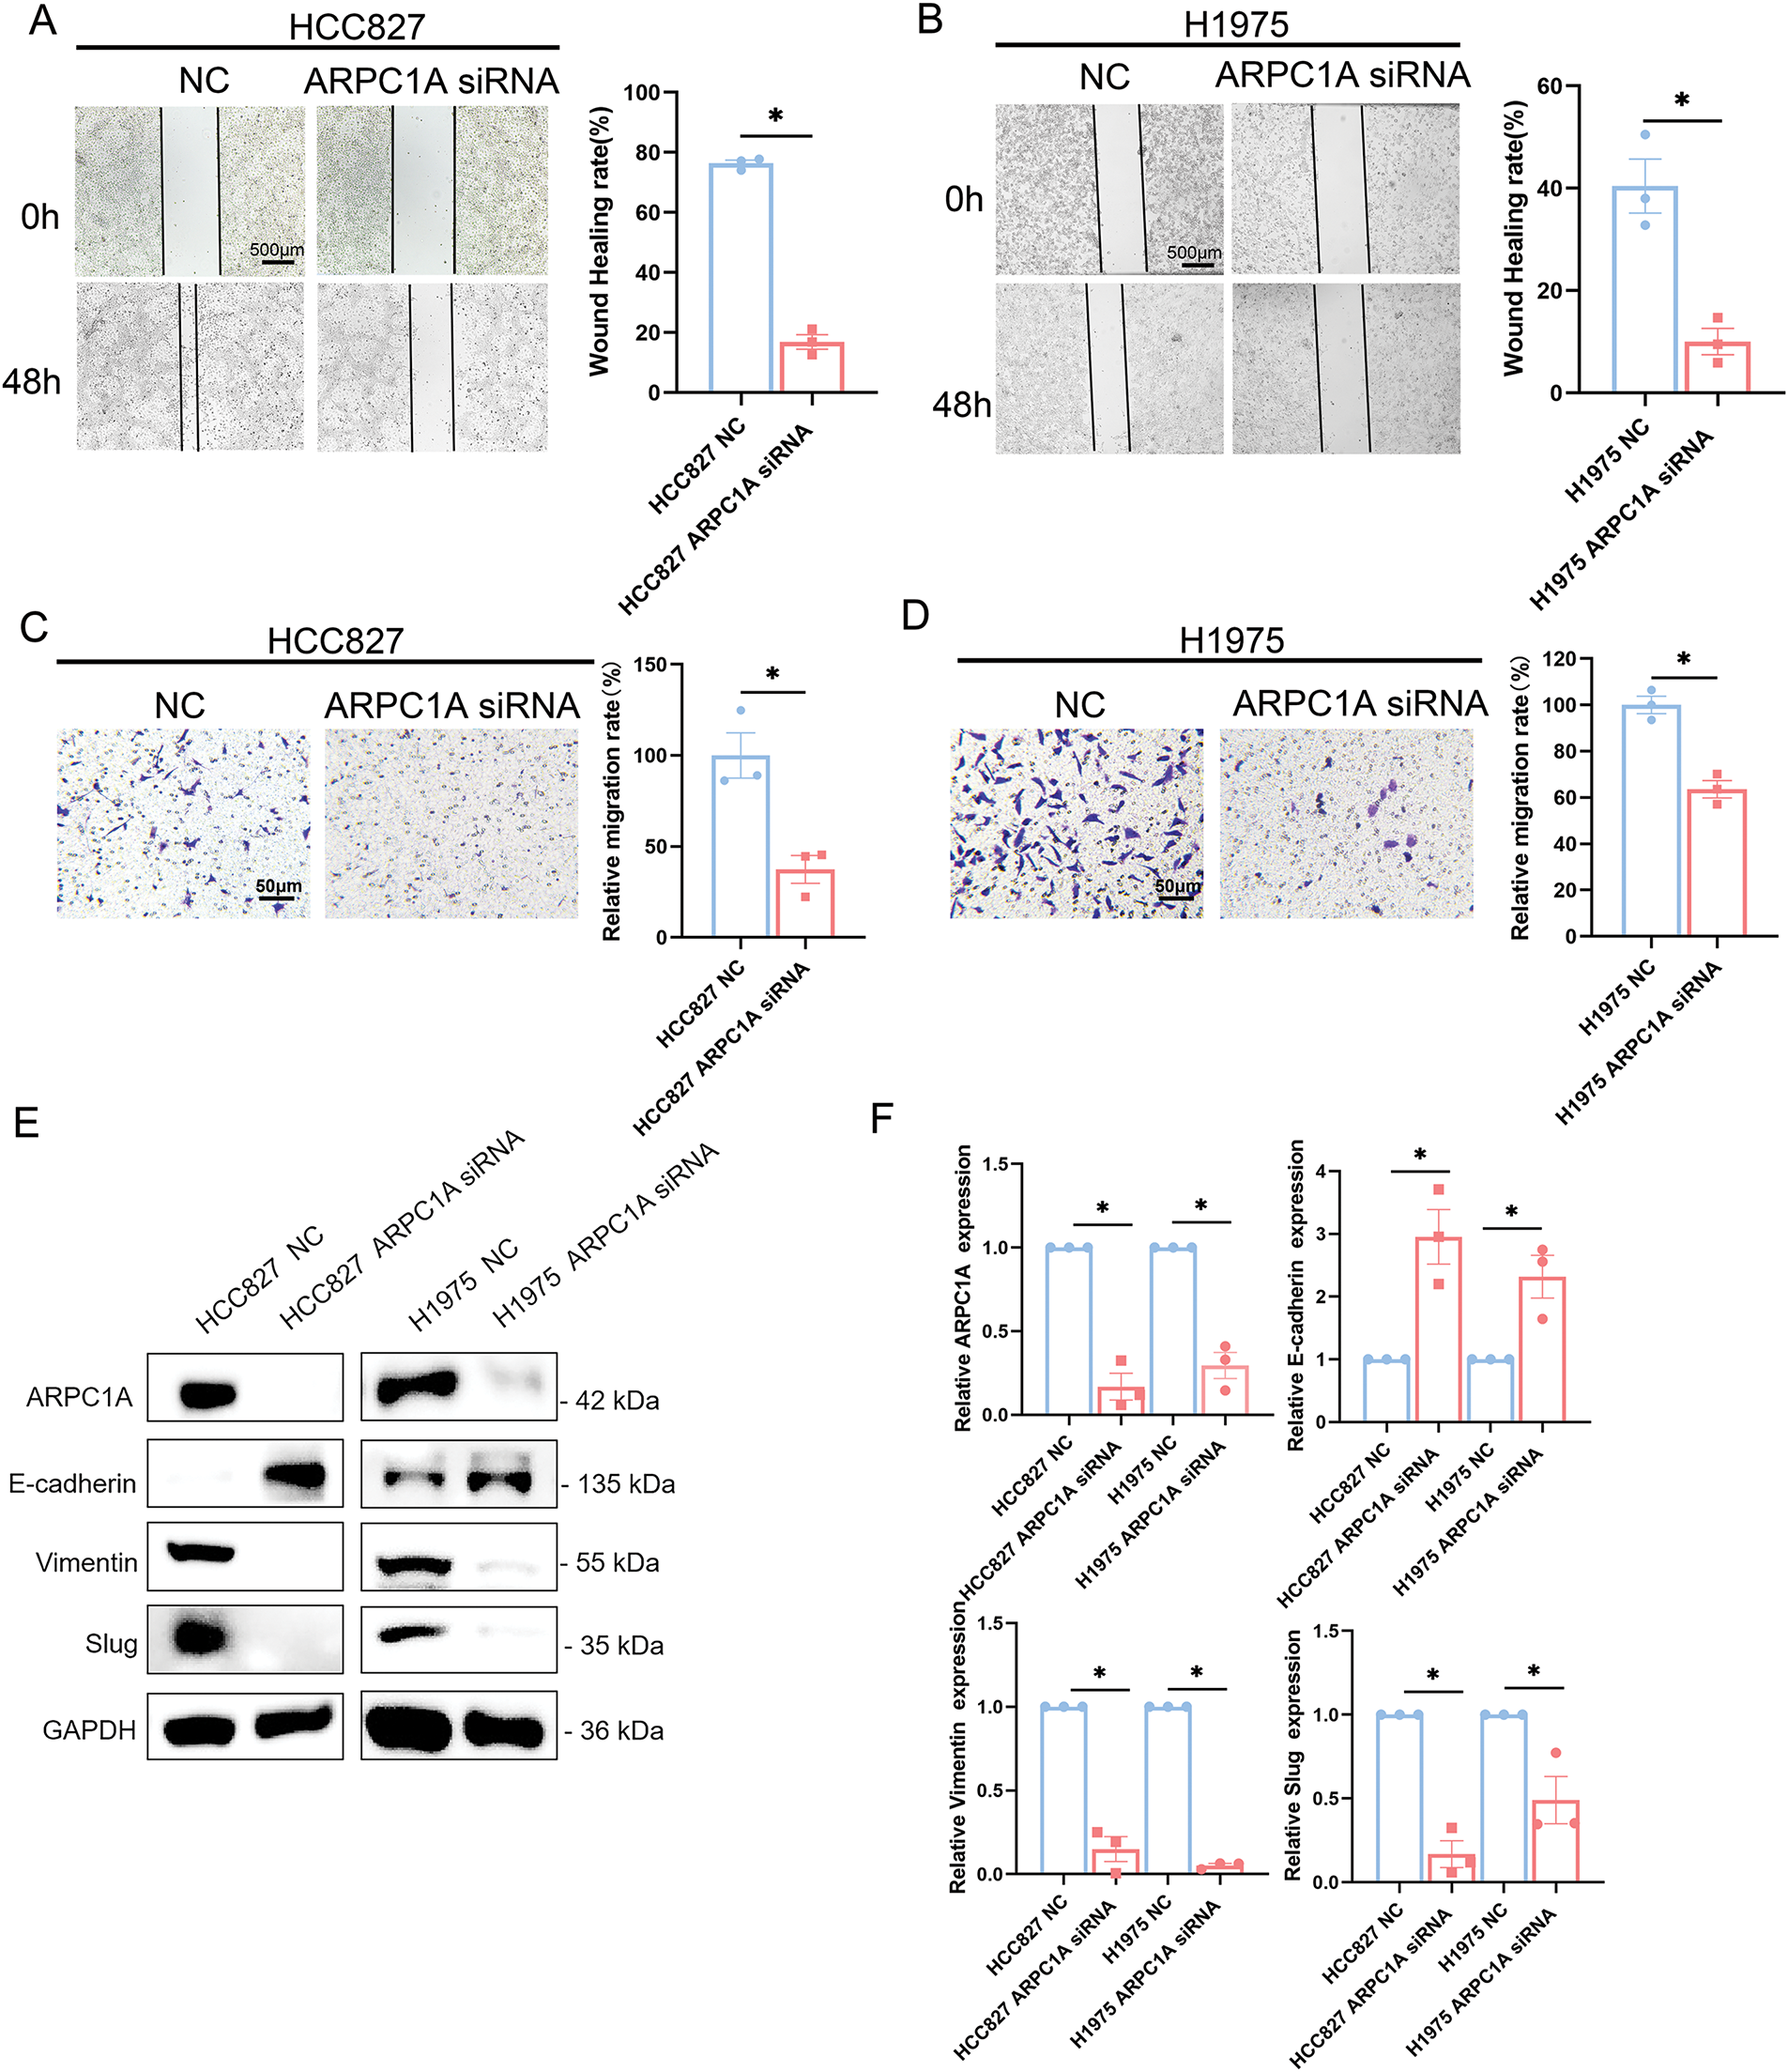
Figure 5: ARPC1A prompts NSCLC cell migration via stimulating EMT. (A) The effect of negative control (NC) and ARPC1A siRNA on cell migration in HCC827 cell lines were measured by wound healing assay. Left panel: Representative images. Scale bar = 500 µm. Right panel: Quantification of 3 experiments. N = 3 experiments, mean ± SEM. * indicates p < 0.05. (B) The effect of negative control (NC) and ARPC1A siRNA on cell migration in H1975 cell lines were measured by wound healing assay. Left panel: Representative images. Scale bar = 500 µm. Right panel: Quantification of 3 experiments. N = 3 experiments, mean ± SEM. * indicates p < 0.05. (C) The effect of negative control (NC) and ARPC1A siRNA on cell migration in HCC827 cell lines were measured by transwell assay. Left panel: Representative images. Scale bar = 50 µm. Right panel: Quantification of 3 experiments. N = 3 experiments, mean ± SEM. For HCC827 cell lines, * indicates p < 0.05. (D) The effect of negative control (NC) and ARPC1A siRNA on cell migration in H1975 cell lines were measured by transwell assay. Left panel: Representative images. Scale bar = 50 µm. Right panel: Quantification of 3 experiments. N = 3 experiments, mean ± SEM. For H1975 cell lines, * indicates p < 0.05. (E) HCC827 and H1975 cells were transfected with negative control (NC) and ARPC1A siRNA for 72h, and the ARPC1A, E-cadherin, Vimentin, and Slug protein levels were assessed by Western blotting. (F) Quantification of the data in (E) quantification of n = 3 experiments, mean ± SEM. For ARPC1A protein, * indicates p < 0.05
To delve deeper into the mechanistic underpinnings of ARPC1A-mediated regulation of lung cancer cell migration, we scrutinized the expression profiles of epithelial-mesenchymal transition (EMT) pathway-associated proteins in HCC827 and H1975 cells using Western blotting. Our experiments unveiled a prominent upregulation in E-cadherin protein expression concomitant with significant downregulation of Vimentin protein level upon ARPC1A knockdown (Fig. 5E). Importantly, Slug, one key driver of EMT progress, is downregulated by the silencing of ARPC1A in both HCC827 and H1975 cells (Fig. 5E). Collectively, these experimental results underscore the pivotal role of ARPC1A in shaping tumor dissemination dynamics via modulation of EMT pathway-related protein expression profiles.
3.6 ARPC1A May Regulate Immune Infiltration Dynamics In Vivo
The intricate interplay between the tumor microenvironment (TME) and lung cancer progression stands as a critical axis in oncological research. Delving into the nexus between ARPC1A and the TME, we harnessed the power of the ESTIMATE algorithm to decipher the immune and stromal compositions within the samples under scrutiny. Notably, our analyses in NSCLC unveiled an inverse relationship between ARPC1A protein expression and the proportion of immune components (Fig. 6A). Interestingly, within the confines of the TME, the expression patterns of ARPC1A exhibited associations with immune components.
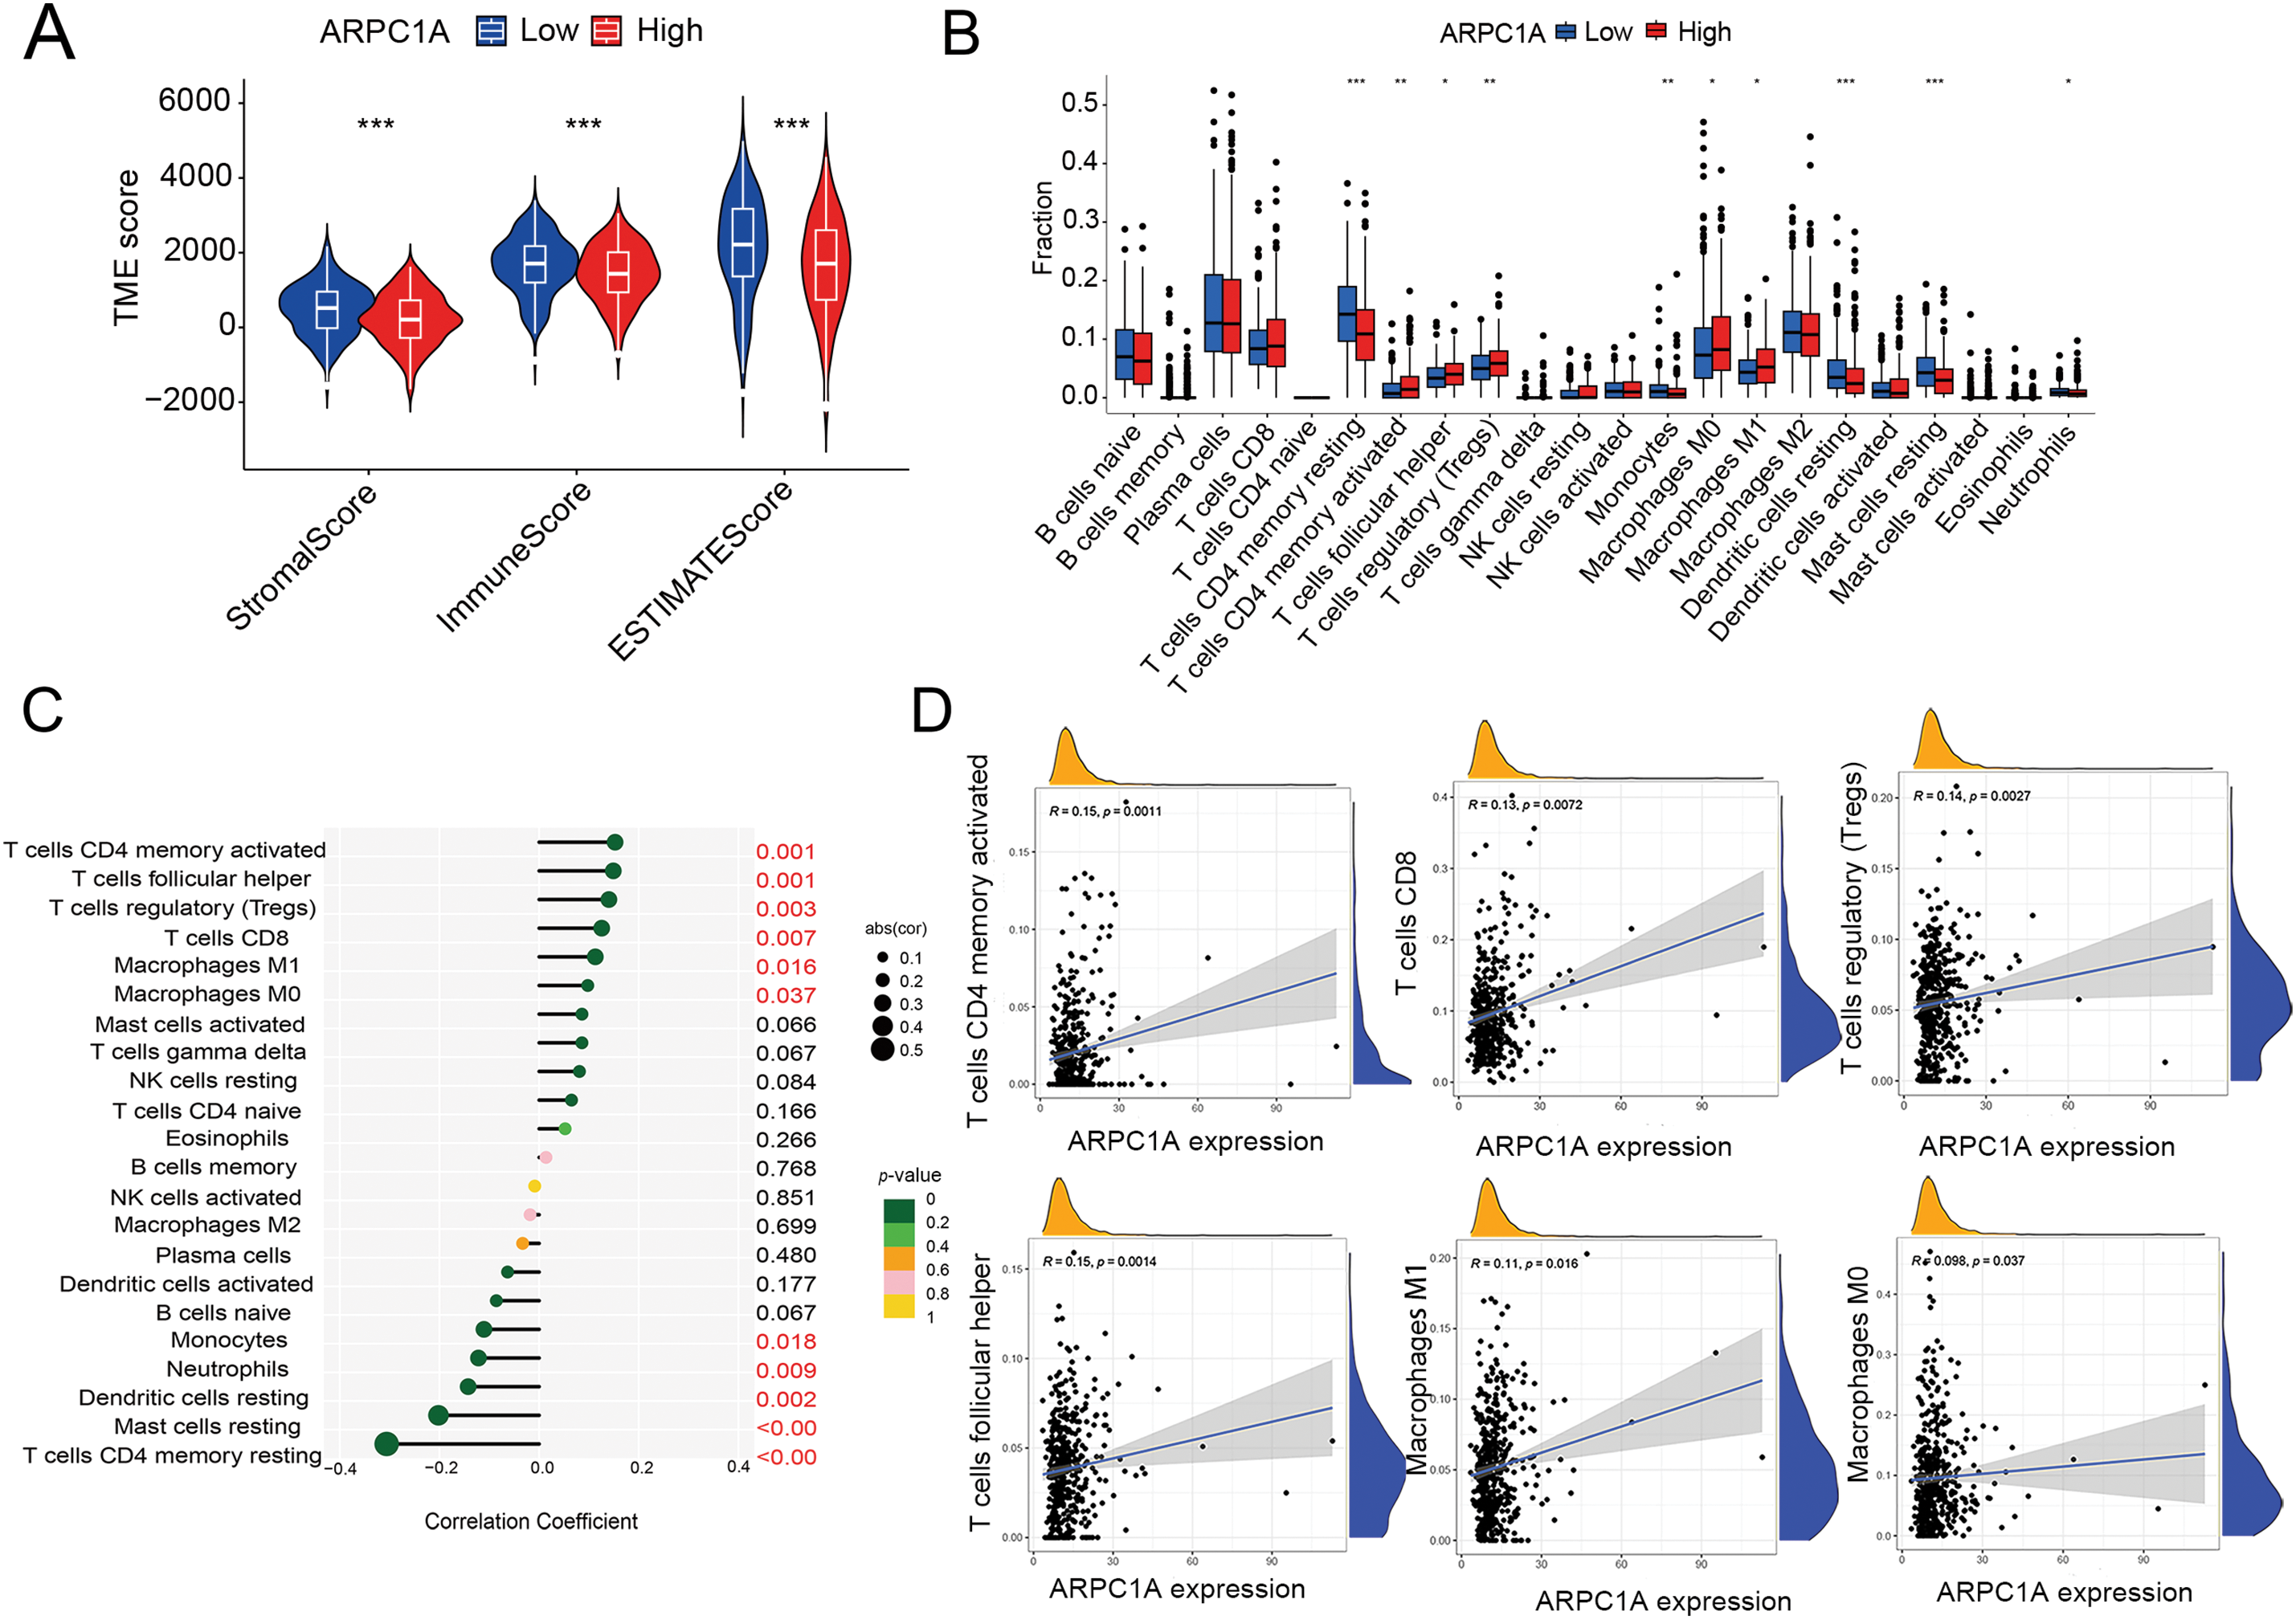
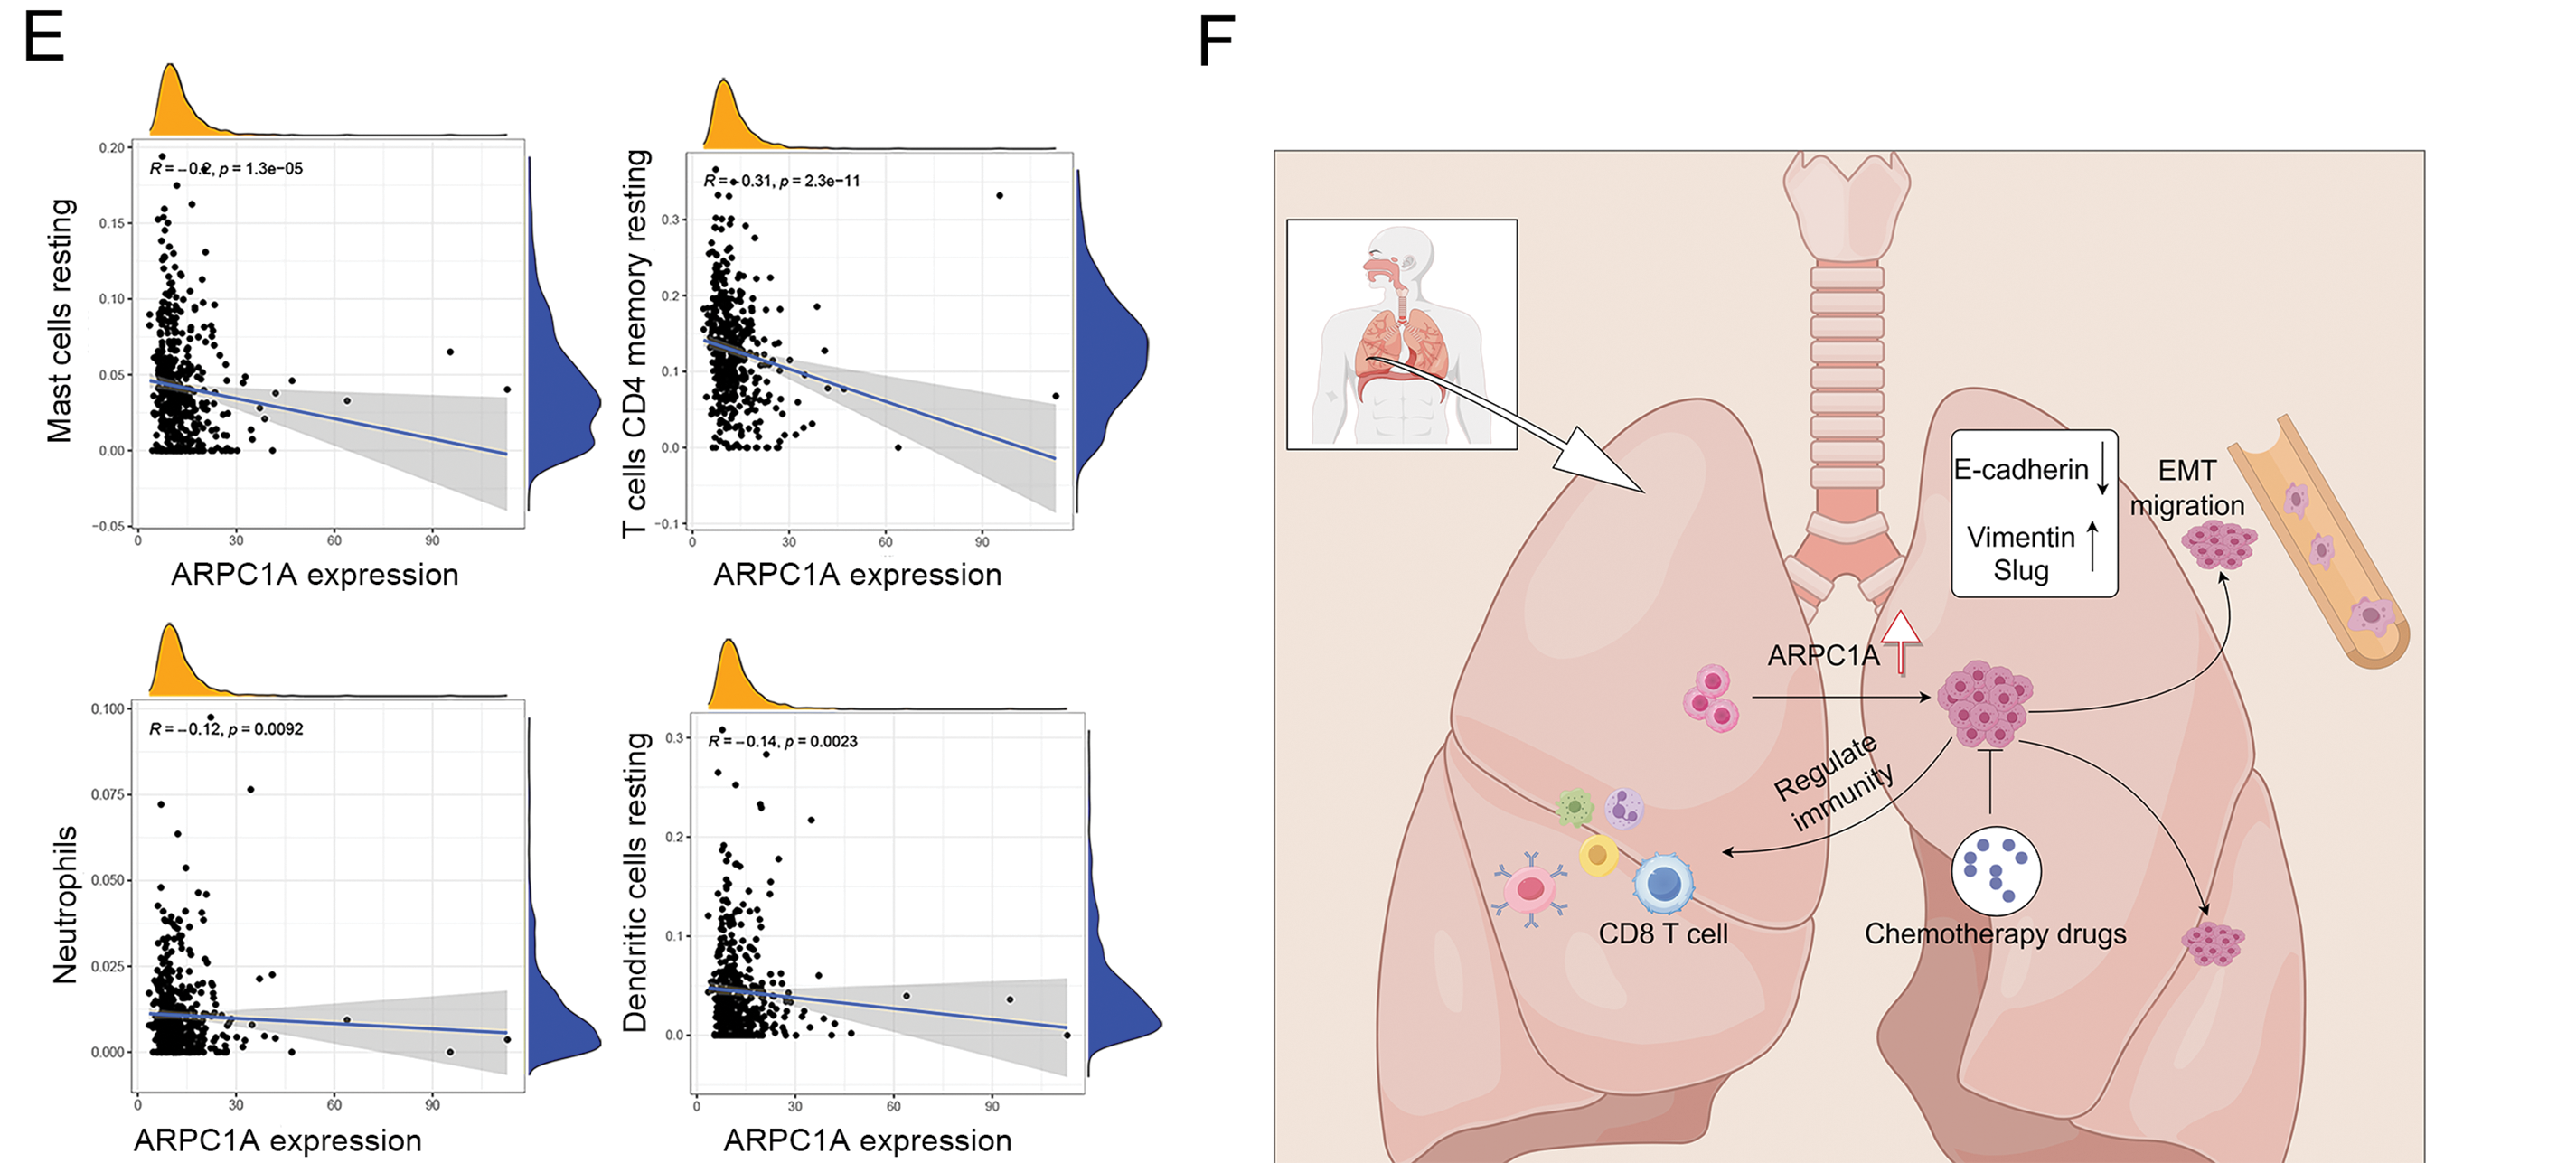
Figure 6: The potential regulation of ARPC1A in immune infiltrating cells. (A) The immune matrix component ratio in ARPC1A high-expression group and ARPC1A low-expression group. *** indicates p < 0.001. (B) A different infiltrating abundance of immune cells in ARPC1A high-expression group and ARPC1A low-expression group in NSCLC. * indicates p < 0.05. ** indicates p < 0.01. *** indicates p < 0.001. (C) The relationship between ARPC1A expression and immune-infiltration level in NSCLC. (D) The positive correlation between ARPC1A expression and immune checkpoint-related genes. (E) The negative correlation between ARPC1A expression and immune checkpoint-related genes. (F) The schematic representation delineates the conceptual framework and principal discoveries of the present investigation. These results unveil the perturbation in ARPC1A expression within non-small cell lung cancer (NSCLC). Across the course of NSCLC advancement, ARPC1A expression exhibits a progressive escalation. Experimental assays demonstrate that the inhibition of ARPC1A expression attenuates the malignant properties of cancer cells. Furthermore, the heightened expression of ARPC1A diminishes the responsiveness to chemotherapeutic agents. This study underscores the functional role and molecular underpinnings of ARPC1A in the progression of NSCLC. Figure created with BioRender.com.
To gain further insight into the intricate relationship between ARPC1A expression and immune-infiltration dynamics, we leveraged CIBERSORT to dissect the intricate tapestry of immune cell populations. Our investigations in NSCLC unveiled compelling correlations between ARPC1A expression levels and various immune cell subsets (Fig. 6B), including T cells CD4 memory activated (R = 0.15, p = 0.0011), T cells CD8 (R = 0.13, p = 0.0072), T cells regulatory (R = 0.14, p = 0.0027), T cells follicular helper (R = 0.15, p = 0.0014), Macrophages M1 (R = 0.11, p = 0.016), Macrophages M0 (R = 0.098, p = 0.0037) (Fig. 6C,D), Mast cells resting (R = −0.2, p = 1.3e − 05), T cells CD4 memory resting (R = −0.31, p = 2.3e − 11), Neutrophils (R = −0.12, p = 0.0092) and Dendritic cells resting (R = −0.14, p = 0.0023) (Fig. 6E). These results showed that ARPC1A expression is closely associated with immunity. For instance, its positive correlation with M1 macrophages may suggest that ARPC1A could be involved in macrophage polarization, ultimately contributing to pro-cancer effects.
In summary, this study sheds light on the dysregulation of ARPC1A in the landscape of NSCLC. Through a comprehensive amalgamation of bioinformatics analyses and experimental cell studies, we illuminate the pivotal role of ARPC1A in orchestrating NSCLC metastasis via the EMT pathway. Our experimental data further indicates that.
ARPC1A promotes cell proliferation and drug resistance. The bioinformatic analysis additionally suggests the potential interplay between ARPC1A and immune infiltration dynamics, which need experimental verification (e.g., measurement of the index of immune cells and immune response in ARPC1A knockout mice) in further studies. Moreover, insights gained from our scrutiny of clinical specimens and cancer databases accentuate the potential significance of ARPC1A, underscoring its promise as a prospective candidate for driving advancements in clinical diagnostic and therapeutic landscapes (Fig. 6F).
Lung cancer stands at the forefront of cancer-related mortality worldwide, with an annual toll exceeding 1.8 million deaths. Shockingly, lung cancer has a five-year survival rate of 19%, making it one of the lowest survival cancer types of all malignancies [25]. NSCLC constitutes 80%–85% of all lung cancer cases, primarily manifesting as adenocarcinoma (AdC) and squamous cell carcinoma (SqCC) [26]. However, the majority of NSCLC diagnoses occur in advanced stages, presenting formidable treatment obstacles. Hence, unraveling the molecular intricacies of NSCLC and pinpointing fresh prognostic indicators and therapeutic avenues looms as paramount. Timely scrutiny of prognostic factors and the discovery of sensitive diagnostic markers emerge as pivotal focal points in NSCLC clinical exploration. Exhaustive analyses delving into expression patterns and survival trajectories derived from database mining underscore the promise of ARPC1A as a groundbreaking biomarker for the diagnosis, prognosis, and management of NSCLC. Our current study revealed a noteworthy elevated expression of ARPC1A in NSCLC, showcasing its mettle as an autonomous prognostic determinant for this cancer type.
ARPC1A is a member of the ARP2/3 complex family [27]. The ARP2/3 complex was originally identified in Acanthamoeba and consists of seven proteins [28,29]. In mammalian systems, this complex embraces five fundamental elements: ARP2, ARP3, ARPC2, ARPC3, and ARPC4, alongside isoforms ARPC1A and ARPC1B, and a singular representative each of ARPC5A and ARPC5B [7]. Functioning as an actin-nucleating powerhouse within cells, ARP2/3 exerts a profound influence on actin filament generation and is intricately intertwined with cellular motility. Mounting evidence accentuates the upregulation of Arp2/3 subunits across diverse cancer tissues and cells, correlating with cancer proliferation, invasion, and metastasis [30]. Antecedent investigations have documented escalated ARPC1A levels in pancreatic cancer, fomenting metastatic progression and infiltration [10]. Analogously, prostate cancer witnesses the upregulation of its homolog, ARPC1B, fostering tumor metastasis [31]. The ARP2/3 complex, subject to regulation by polo-like kinase 4 (PLK4) in cancer realms, steers actin cytoskeleton rearrangements [32]. ARPC2 emerges as a novel marker in breast, gastric, and liver cancers, playing a pivotal role in regulating cancer cell proliferation and tumor metastasis [33–35]. Likewise, ARPC4 mirrors this function in pancreatic and gastric cancers [36], while ARPC5 in liver cancer orchestrates cell proliferation, inhibiting apoptosis through modulation of the miR-22-3p-ARPC5 axis [37]. Our current study highlighted multiple critical functions of ARPC1A in the development of NSCLC.
The expression of ARPC1A is intricately linked to the dynamics of immune infiltration and the responsiveness to therapeutic interventions. Subsequent experimental investigations have elucidated the critical role of ARPC1A in modulating cell proliferation and the motility of cancer cells through the complex EMT pathway. The activation of EMT is a fundamental process in the invasion and metastasis of cancer cells [38]. In experiments utilizing the HCC827 and H1975 cell lines, the knockdown of ARPC1A resulted in a significant reduction in the migratory capacity of NSCLC cells. Notably, ARPC1A knockdown led to an increase in E-cadherin expression, concomitant with a decrease in the expression of Vimentin and Slug proteins. The EMT process is characterized by a dynamic interplay, where a reduction in E-cadherin expression is typically associated with an increase in N-cadherin expression, which is critical for tumor cell invasion. Furthermore, the upregulation of the Slug protein is known to facilitate cancer metastasis [39]. Collectively, these findings underscore the pivotal role of ARPC1A in the EMT process, suggesting its potential as a biomarker.
The incorporation of ARPC1A as a novel biomarker and therapeutic target for NSCLC presents several significant challenges. Primarily, targeted therapies consist of two main categories: monoclonal antibodies and small molecule drugs. While these approaches may help alleviate patient side effects, the emergence of drug resistance is often unavoidable. As a new therapeutic target, ARPC1A is likely to face similar issues related to drug resistance; nonetheless, investigating combination therapies could yield effective treatment strategies.
ARPC1A is known to regulate ferroptosis through the STAT3 signaling pathway, thereby promoting tumor progression [12]. Consequently, it may be beneficial to consider the co-administration of ARPC1A-targeting agents with ferroptosis inducers or STAT3 inhibitors to inhibit tumor growth effectively.
In contrast to established NSCLC biomarkers, programmed death ligand 1 (PD-L1) serves as a transmembrane protein that inhibits T cell activation and proliferation, rendering it a prominent biomarker for NSCLC [40]. Tumors may be categorized as “hot” or “cold,” with high PD-L1 expression observed in hot tumors and low expression in cold tumors [41]. However, unlike PD-L1, the expression of ARPC1A in tumors is not modulated by immune responses, thereby enhancing its accuracy and effectiveness as a biomarker. Thyroid transcription factor-1 (TTF-1) is a widely utilized immune marker in NSCLC; however, it fails to reflect the metastatic status of tumors [42]. ARPC1A, a member of the Arp2/3 family, has been shown in existing literature to regulate the cytoskeleton, influencing filopodia formation and thereby modulating metastasis and invasion [11]. Consequently, ARPC1A may serve as a more reliable indicator of tumor metastasis compared to TTF-1. Nevertheless, it is important to note that ARPC1A currently lacks specificity and clinical validation.
Additionally, ARPC1A is implicated in ferroptosis, a process critical for the assessment of tumor metastasis and proliferation [12]. Based on data analysis from the current study, the expression level of ARPC1A correlates positively with various immune infiltrating cells, particularly CD4+ memory-activated T cells, regulatory T cells, and M1 macrophages, suggesting that ARPC1A may play a role in macrophage polarization and exert a pro-cancer function.
The limitations of this study include the necessity for further exploration of the clinical applicability of findings derived from the analysis of clinical data from cancer databases. Moreover, a larger sample size of NSCLC patients is required to substantiate the relationship between ARPC1A expression and clinical parameters. The mechanisms by which ARPC1A influences immune responses, drug resistance, and metastasis warrant further investigation. Finally, current research is primarily in vitro, necessitating additional in vivo studies, such as the use of ARPC1A knockout mice, to validate the potential of ARPC1A as a biomarker for NSCLC.
This study demonstrates that the expression of ARPC1A is significantly increased in non-small cell lung cancer, affecting cell survival and migration abilities and influencing the sensitivity to a broad-spectrum chemotherapy drug.
Acknowledgement: We gratefully acknowledge all the patients involved in the study.
Funding Statement: This work was supported by the Natural Science Foundation of Anhui Province (ML 2308085MC80) and the Anhui Medical University Research and Innovation Talent Team (KZ).
Author Contributions: The authors confirm contribution to the paper as follows: study conception and design: Hongjuan Guo and Dan Liu; data collection: Hongjuan Guo and Ruyu Yan; analysis and interpretation of results: Hongjuan Guo, Dan Liu, and Tianjing Zhang; draft manuscript preparation: Hongjuan Guo, Minxia Liu, and Kecheng Zhou. All authors reviewed the results and approved the final version of the manuscript.
Availability of Data and Materials: All the data generated during the current study are available from the corresponding author upon reasonable request.
Ethics Approval: Acquisition of the donor NSCLC tumor tissues and adjacent normal tissues and the following experimental procedures were approved by the Ethics Committee of Anhui Medical University (Date: 01 March 2023; Approval number: 83230318). All the procedures were performed following the instructions from the Declaration of Helsinki. All authors reviewed the results and approved the final version of the manuscript.
Conflicts of Interest: The authors declare no conflicts of interest to report regarding the present study.
Supplementary Materials: The supplementary material is available online at https://doi.org/10.32604/biocell.2025.062143.
References
1. Tan AC. Targeting the PI3K/Akt/mTOR pathway in non-small cell lung cancer (NSCLC). Thorac Cancer. 2020;11(3):511–8. doi:10.1111/1759-7714.13328. [Google Scholar] [PubMed] [CrossRef]
2. Li J, Zhang D, Wang S, Yu P, Sun J, Zhang Y, et al. Baicalein induces apoptosis by inhibiting the glutamine-mTOR metabolic pathway in lung cancer. J Adv Res. 2025;68(3):341–57. doi:10.1016/j.jare.2024.02.023. [Google Scholar] [PubMed] [CrossRef]
3. Huang X, Yu G, Jiang X, Shen F, Wang D, Wu S, et al. ITGB4/GNB5 axis promotes M2 macrophage reprogramming in NSCLC metastasis. Int Immunopharmacol. 2025;144(2):113564. doi:10.1016/j.intimp.2024.113564. [Google Scholar] [PubMed] [CrossRef]
4. Herbst RS, Morgensztern D, Boshoff C. The biology and management of non-small cell lung cancer. Nature. 2018;553(7689):446–54. doi:10.1038/nature25183. [Google Scholar] [PubMed] [CrossRef]
5. Chen Z, Chen X, Lu B, Gu Y, Chen Q, Lei T, et al. Up-regulated LINC01234 promotes non-small-cell lung cancer cell metastasis by activating VAV3 and repressing BTG2 expression. J Hematol Oncol. 2020;13(1):7. doi:10.1186/s13045-019-0842-2. [Google Scholar] [PubMed] [CrossRef]
6. Yan R, Liu D, Wang J, Liu M, Guo H, Bai J, et al. miR-137-LAPTM4B regulates cytoskeleton organization and cancer metastasis via the RhoA-LIMK-Cofilin pathway in osteosarcoma. Oncogenesis. 2023;12(1):25. doi:10.1038/s41389-023-00471-5. [Google Scholar] [PubMed] [CrossRef]
7. Kahr WHA, Pluthero FG, Elkadri A, Warner N, Drobac M, Chen CH, et al. Loss of the Arp2/3 complex component ARPC1B causes platelet abnormalities and predisposes to inflammatory disease. Nat Commun. 2017;8(1):14816. doi:10.1038/ncomms14816. [Google Scholar] [PubMed] [CrossRef]
8. UniProt Consortium. UniProt: a hub for protein information. Nucleic Acids Res. 2015;43(D1):D204–12. doi:10.1093/nar/gku989. [Google Scholar] [PubMed] [CrossRef]
9. Robinson RC, Turbedsky K, Kaiser DA, Marchand JB, Higgs HN, Choe S, et al. Crystal structure of Arp2/3 complex. Science. 2001;294(5547):1679–84. doi:10.1126/science.1066333. [Google Scholar] [PubMed] [CrossRef]
10. Laurila E, Savinainen K, Kuuselo R, Karhu R, Kallioniemi A. Characterization of the 7q21-Q22 amplicon identifies ARPC1A, a subunit of the Arp2/3 complex, as a regulator of cell migration and invasion in pancreatic cancer. Genes Chromo Cancer. 2009;48(4):330–9. doi:10.1002/gcc.20643. [Google Scholar] [PubMed] [CrossRef]
11. Chen YH, Chen H, Lin TT, Zhu JM, Chen JY, Dong RN, et al. ARPC1A correlates with poor prognosis in prostate cancer and is up-regulated by glutamine metabolism to promote tumor cell migration, invasion and cytoskeletal changes. Cell Biosci. 2023;13(1):38. doi:10.1186/s13578-023-00985-w. [Google Scholar] [PubMed] [CrossRef]
12. Ji J, Li H, Wang W, Yuan B, Shen T. ARPC1A is regulated by STAT3 to inhibit ferroptosis and promote prostate cancer progression. Hum Cell. 2022;35(5):1591–601. doi:10.1007/s13577-022-00754-w. [Google Scholar] [PubMed] [CrossRef]
13. Yu S, Tang L, Zhang Q, Li W, Yao S, Cai Y, et al. A cuproptosis-related lncRNA signature for predicting prognosis and immunotherapy response of lung adenocarcinoma. Hereditas. 2023;160(1):31. doi:10.1186/s41065-023-00293-w. [Google Scholar] [PubMed] [CrossRef]
14. Tang Z, Li C, Kang B, Gao G, Li C, Zhang Z. GEPIA a web server for cancer and normal gene expression profiling and interactive analyses. Nucleic Acids Res. 2017;45(W1):W98–102. doi:10.1093/nar/gkx247. [Google Scholar] [PubMed] [CrossRef]
15. Vasaikar SV, Straub P, Wang J, Zhang B. LinkedOmics: analyzing multi-omics data within and across 32 cancer types. Nucleic Acids Res. 2018;46(D1):D956–63. doi:10.1093/nar/gkx1090. [Google Scholar] [PubMed] [CrossRef]
16. Deng M, Xiong C, He ZK, Bin Q, Song JZ, Li W, et al. MCTS1 as a novel prognostic biomarker and its correlation with immune infiltrates in breast cancer. Front Genet. 2022;13:825901. doi:10.3389/fgene.2022.825901. [Google Scholar] [PubMed] [CrossRef]
17. Maeser D, Gruener RF, Huang RS. oncoPredict: an R package for predicting in vivo or cancer patient drug response and biomarkers from cell line screening data. Brief Bioinform. 2021;22(6):bbab260. doi:10.1093/bib/bbab260. [Google Scholar] [PubMed] [CrossRef]
18. Yang W, Soares J, Greninger P, Edelman EJ, Lightfoot H, Forbes S, et al. Genomics of drug sensitivity in cancer (GDSCa resource for therapeutic biomarker discovery in cancer cells. Nucleic Acids Res. 2013;41(D1):D955–61. doi:10.1093/nar/gks1111. [Google Scholar] [PubMed] [CrossRef]
19. Zheng W, Ye S, Liu B, Liu D, Yan R, Guo H, et al. Crosstalk between GBP2 and M2 macrophage promotes the ccRCC progression. Cancer Sci. 2024;115(11):3570–86. doi:10.1111/cas.16287. [Google Scholar] [PubMed] [CrossRef]
20. Yan R, Liu D, Guo H, Liu M, Lv D, Björkblom B, et al. LAPTM4B counteracts ferroptosis via suppressing the ubiquitin-proteasome degradation of SLC7A11 in non-small cell lung cancer. Cell Death Dis. 2024;15(6):436. doi:10.1038/s41419-024-06836-x. [Google Scholar] [PubMed] [CrossRef]
21. Rho JK, Choi YJ, Choi YR, Kim SY, Choi SJ, Choi CM, et al. The effect of acquired cisplatin resistance on sensitivity to EGFR tyrosine kinase inhibitors in EGFR mutant lung cancer cells. Oncol Res. 2011;19(10–11):471–8. doi:10.3727/096504012x13285365944337. [Google Scholar] [PubMed] [CrossRef]
22. Soares RB, Manguinhas R, Costa JG, Saraiva N, Gil N, Rosell R, et al. MnTnHex-2-PyP5+ displays anticancer properties and enhances cisplatin effects in non-small cell lung cancer cells. Antioxidants. 2022;11(11):2198. doi:10.3390/antiox11112198. [Google Scholar] [PubMed] [CrossRef]
23. Tang ZH, Su MX, Guo X, Jiang XM, Jia L, Chen X, et al. Increased expression of IRE1α associates with the resistant mechanism of osimertinib (AZD9291)-resistant non-small cell lung cancer HCC827/OSIR cells. Anticancer Agents Med Chem. 2018;18(4):550–5. doi:10.2174/1871520617666170719155517. [Google Scholar] [PubMed] [CrossRef]
24. Barak D, Engelberg S, Assaraf YG, Livney YD. Selective targeting and eradication of various human non-small cell lung cancer cell lines using self-assembled aptamer-decorated nanoparticles. Pharmaceutics. 2022;14(8):1650. doi:10.3390/pharmaceutics14081650. [Google Scholar] [PubMed] [CrossRef]
25. Sun Q, Li W, Yang D, Lin PP, Zhang L, Guo H. The presence of small-size circulating tumor cells predicts worse prognosis in non-small cell lung cancer patients. Arch Pathol Lab Med. 2025;149(1):39–49. doi:10.5858/arpa.2023-0455-oa. [Google Scholar] [PubMed] [CrossRef]
26. Wang X, Qiao Z, Aramini B, Lin D, Li X, Fan J. Potential biomarkers for immunotherapy in non-small-cell lung cancer. Cancer Metastasis Rev. 2023;42(3):661–75. doi:10.1007/s10555-022-10074-y. [Google Scholar] [PubMed] [CrossRef]
27. Abella JVG, Galloni C, Pernier J, Barry DJ, Kjær S, Carlier MF, et al. Isoform diversity in the Arp2/3 complex determines actin filament dynamics. Nat Cell Biol. 2016;18(1):76–86. doi:10.1038/ncb3286. [Google Scholar] [PubMed] [CrossRef]
28. Beltzner CC, Pollard TD. Identification of functionally important residues of Arp2/3 complex by analysis of homology models from diverse species. J Mol Biol. 2004;336(2):551–65. doi:10.1016/j.jmb.2003.12.017. [Google Scholar] [PubMed] [CrossRef]
29. Machesky LM, Atkinson SJ, Ampe C, Vandekerckhove J, Pollard TD. Purification of a cortical complex containing two unconventional actins from Acanthamoeba by affinity chromatography on profilin-agarose. J Cell Biol. 1994;127(1):107–15. doi:10.1083/jcb.127.1.107. [Google Scholar] [PubMed] [CrossRef]
30. Huang S, Li D, Zhuang L, Sun L, Wu J. Identification of Arp2/3 complex subunits as prognostic biomarkers for hepatocellular carcinoma. Front Mol Biosci. 2021;8:690151. doi:10.3389/fmolb.2021.690151. [Google Scholar] [PubMed] [CrossRef]
31. Gamallat Y, Zaaluk H, Kish EK, Abdelsalam R, Liosis K, Ghosh S, et al. ARPC1B is associated with lethal prostate cancer and its inhibition decreases cell invasion and migration in vitro. Int J Mol Sci. 2022;23(3):1476. doi:10.3390/ijms23031476. [Google Scholar] [CrossRef]
32. Kazazian K, Go C, Wu H, Brashavitskaya O, Xu R, Dennis JW, et al. Plk4 promotes cancer invasion and metastasis through Arp2/3 complex regulation of the actin cytoskeleton. Cancer Res. 2017;77(2):434–47. doi:10.1158/0008-5472.CAN-16-2060. [Google Scholar] [PubMed] [CrossRef]
33. Huang S, Dong C, Li D, Xu Y, Wu J. ARPC2: a pan-cancer prognostic and immunological biomarker that promotes hepatocellular carcinoma cell proliferation and invasion. Front Cell Dev Biol. 2022;10:896080. doi:10.3389/fcell.2022.896080. [Google Scholar] [PubMed] [CrossRef]
34. Zhang J, Liu Y, Yu CJ, Dai F, Xiong J, Li HJ, et al. Role of ARPC2 in human gastric cancer. Mediators Inflamm. 2017;2017(s3):5432818. doi:10.1155/2017/5432818. [Google Scholar] [PubMed] [CrossRef]
35. Chen P, Yue X, Xiong H, Lu X, Ji Z. RBM3 upregulates ARPC2 by binding the 3′UTR and contributes to breast cancer progression. Int J Oncol. 2019;54(4):1387–97. doi:10.3892/ijo.2019.4698. [Google Scholar] [PubMed] [CrossRef]
36. Rauhala HE, Teppo S, Niemelä S, Kallioniemi A. Silencing of the ARP2/3 complex disturbs pancreatic cancer cell migration. Anticancer Res. 2013;33(1):45–52. [Google Scholar] [PubMed]
37. Huang JN, Zhang HM, Cai JD, Wang WL, Wang P. Long noncoding RNA DSCR8 promotes the proliferation of liver cancer cells and inhibits apoptosis via the miR-22-3p/ARPC5 Axis. J Cancer. 2023;14(1):35–49. doi:10.7150/jca.79475. [Google Scholar] [PubMed] [CrossRef]
38. Xue W, Yang L, Chen C, Ashrafizadeh M, Tian Y, Sun R. Wnt/β-catenin-driven EMT regulation in human cancers. Cell Mol Life Sci. 2024;81(1):79. doi:10.1007/s00018-023-05099-7. [Google Scholar] [PubMed] [CrossRef]
39. Hung PF, Hong TM, Chang CC, Hung CL, Hsu YL, Chang YL, et al. Hypoxia-induced Slug SUMOylation enhances lung cancer metastasis. J Exp Clin Cancer Res. 2019;38(1):5. doi:10.1186/s13046-018-0996-8. [Google Scholar] [PubMed] [CrossRef]
40. Kloten V, Lampignano R, Krahn T, Schlange T. Circulating tumor cell PD-L1 expression as biomarker for therapeutic efficacy of immune checkpoint inhibition in NSCLC. Cells. 2019;8(8):809. doi:10.3390/cells8080809. [Google Scholar] [PubMed] [CrossRef]
41. Khosravi GR, Mostafavi S, Bastan S, Ebrahimi N, Gharibvand RS, Eskandari N. Immunologic tumor microenvironment modulators for turning cold tumors hot. Cancer Commun (Lond). 2024;44(5):521–53. doi:10.1002/cac2.12539. [Google Scholar] [PubMed] [CrossRef]
42. Wu Y, Li J, Ding L, Huang J, Chen M, Li X, et al. Differentiation of pathological subtypes and Ki-67 and TTF-1 expression by dual-energy CT (DECT) volumetric quantitative analysis in non-small cell lung cancer. Cancer Imag. 2024;24(1):146. doi:10.1186/s40644-024-00793-6. [Google Scholar] [PubMed] [CrossRef]
Cite This Article
 Copyright © 2025 The Author(s). Published by Tech Science Press.
This work is licensed under a Creative Commons Attribution 4.0 International License , which permits unrestricted use, distribution, and reproduction in any medium, provided the original work is properly cited.
 Downloads
 Citation Tools