
 Submit a Paper
 Propose a Special lssue
 Open Access
ARTICLE

Identification of TMEM159 as a biomarker of glioblastoma progression based on immune characteristics
1 Graduate School, Dalian Medical University, Dalian, 116000, China
2 Department of Neurosurgery, Liaoning Cancer Hospital & Institute, Shenyang, 110042, China
3 Department of Neurosurgery, Affiliated Hospital of Xuzhou Medical University, Xuzhou, 221000, China
* Corresponding Authors: TANGJUN GUO. Email: ; HAOZHE PIAO. Email:
BIOCELL 2024, 48(8), 1241-1263. https://doi.org/10.32604/biocell.2024.051049
Received 26 February 2024; Accepted 27 May 2024; Issue published 02 August 2024
 View Full Text
 Download PDF
Abstract
Background: Glioblastoma multiforme (GBM) is the most general malignancy of the primary central nervous system that is characterized by high aggressiveness and lethality. Transmembrane protein 159 (TMEM159) is an endoplasmic reticulum protein that can form oligomers with seipin. The TMEM159-seipin complex decides the site of lipid droplet (LD) formation, and the formation of LDs is a marker of GBM. However, the role of TMEM159 in the progression of GBM has not been investigated to date. Methods: In this study, we examined the genes that may be associated with patient prognosis in GBM by bioinformatics analyses, and identified the key genes that affect the development of GBM using single-cell RNA sequencing technology. The biological functions of TMEM159 in GBM cells were additionally assessed by clone formation and transwell assays as well as using a model of chick embryo chorioallantois membrane (CAM) and western blotting. The association between TMEM159 and epidermal growth factor receptor (EGFR) was finally analyzed in GBM cells. Results: A prognostic model was established and validated for predicting the prognosis. Survival curve analysis showed a critical difference in the prognosis of the high- and low-risk groups predicted by the prognostic model. The results demonstrated that TMEM159 affected the proliferation and invasion of GBM cells. The chick embryo CAM assays demonstrated that the inhibition of TMEM159 expression reduced angiogenesis in the CAM model. Conclusions: The prognostic model achieved good predictive potential for high-risk patients. The findings also revealed that TMEM159 might be an important prognostic factor for GBM, indicating that the protein may be a promising therapeutic target for suppressing the development of GBM.Keywords
Glioblastoma (GBM), the most prevalent primary central nervous system malignancy, is known for its extreme aggressiveness and high lethality. The comprehensive treatment strategies for GBM, including surgery, radiotherapy, and chemotherapy, are unable to achieve satisfactory results owing to the high aggressiveness and chemotherapy resistance, and the overall survival of patients with GBM is less than 15 months [1]. Scientists are therefore paying increasing attention to molecular targeted therapies for identifying novel therapeutic breakthroughs. The rapid development of targeted sequencing methods and immunotherapy technologies have enabled the identification and validation of increasing numbers of markers associated with tumor development and prognosis in immunotherapy research, which holds promise for the targeted therapy of GBM. It is widely accepted that the co-deletion of 1p/19q, mutations in the isocitrate dehydrogenase (IDH) gene, and methylation in the promoter region of the gene encoding O6-methylguanine-DNA methyltransferase (MGMT) have important effects on the treatment outcome and survival of patients with GBM [2,3].
The fifth edition of the Classification of Tumors of the Central Nervous System published by the World Health Organization (WHO CNS5) further integrates the molecular changes in CNS tumors during classification, suggesting that molecular markers are important in guiding the diagnosis and predicting the prognosis of gliomas cases [4]. It is therefore necessary to further discover more important markers for the diagnosis and prediction of gliomas. In a recent study, it was found that the level of thyroid receptor-interacting protein 13 (TRIP13) was upregulated in GBM tissues, which was associated with poor patient outcomes [5]. The study further demonstrated that TRIP13 and epidermal growth factor receptor (EGFR) form a feedforward loop to potentiate EGFR signaling during the growth of GBM, and identified a previously unrecognized mechanism of action of TRIP13 that occurs independent of ATPase activity. The gene encoding cyclin-dependent kinase inhibitor 2A/B (CDKN2A/B) is located in chromosome 9 and functions as an important tumor suppressor gene. According to the WHO CNS5 classification, CDKN2A/B is an important marker for the integrated diagnosis and prognostic evaluation of astrocytoma. It has been reported that homozygosity of the gene encoding CDKN2A/B leads to poor prognosis [6]. Another study demonstrated that the L1 cell-adhesion molecule (L1CAM) serves as both a prognostic factor and therapeutic target for gliomas, especially supratentorial ependymoma [7]. The results of extensive bioinformatics analyses have revealed that long non-coding RNAs (lncRNAs) hold immense potential as molecular markers for glioma. The diagnosis of gliomas is presently achieved based on the molecular pathology of the disease [8]. However, in addition to the aforementioned molecular entities, circular RNAs (circRNAs), exosomes, microRNAs, and other molecular processes can alter the immune microenvironment of gliomas by regulating the activation of immune cells and the immune response, and work as novel tools for diagnostic prediction, prognostic evaluation, and serving as a target of immunotherapy. Therefore, novel biomarkers provide a unique avenue for the diagnosis and therapy of various malignant tumors, including gliomas [9].
In this study, we constructed a prognostic model consisting of certain genes that might be related to patient prognosis in GBM as identified by bioinformatics analysis from the perspective of the immune microenvironment. Single-cell RNA sequencing (scRNA-seq) provides a promising strategy for exploring tumor heterogeneity. The accuracy of the developed prognostic model was confirmed by scRNA-seq, the findings revealed that the proportions of different subpopulations of immune cells, tumor cells, and especially vascular cells in the tumor tissues determined the prognosis and risk of patients with GBM.
Among the genes used for constructing the prognostic model, the role of one gene in the progression of GBM was considered to be noteworthy. TMEM159, known as lipid droplet assembly factor 1 (LDAF1), is an endoplasmic reticulum (ER) protein that can form oligomers with seipin in the bilayer membrane of the ER [10]. The TMEM159-seipin complex dictates the site of lipid droplet (LD) formation in the ER through phase separation. A previous study reported that the levels of lipids can affect the development of GBM, and further demonstrated that cholesterol esterification and the formation of LDs serve as biomarkers of GBM [11]. It has been additionally reported that high levels of LDs in patients with GBM are associated with the progression of GBM and poor prognosis. In our previous study, we screened for genes that encode proteins that bind to EGFR by mass spectrometry (MS), and the findings revealed that TMEM159 binds to the EGFR protein [5]. However, there are no studies on the function of TMEM159 in the development of GBM or other tumors to date.
Herein, we firstly demonstrated that TMEM159 can affect EGFR signaling and other downstream signaling pathways and that the inhibition of TMEM159 can suppress the development of GBM, thus making it a potential therapeutic target for GBM.
Dataset retrieval and preprocessing
The gene expression profiles and clinical information for GBM were retrieved from The Cancer Genome Atlas (TCGA) database (https://cancergenome.nih.gov/, accessed on 12/04/2024). The dataset consisted of 174 samples, including 5 from normal individuals and 169 from patients with GBM. The transcriptome sequencing data of GBM tissues were sourced from the Gene Expression Omnibus (GEO) database (accession number: GSE4412), comprising 85 GBM samples.
Single-cell transcriptome sequencing data were retrieved from the GEO database (accession number: GSE84465), including 3589 cells. Quality control analysis was initially performed for all the cells, excluding those with fewer than 200 or more than 6000 expressed genes which were insufficient gene expression represent low-quality cells and excessive gene expression may reflect doublet cells. A total of 3542 cells were retained following quality control analysis.
Immunoinfiltration analysis of GBM tissues
The immune scores of the GBM samples from the TCGA were decided using the “estimate” package of R, and the infiltration levels of 22 types of immune cells in the tissues were calculated using the “CIBERSORT” package of R. Default parameters were used for both the “filterCommonGenes” and “estimateScore” functions in the “estimate” package of R. Infiltration scores for 22 types of immune cells in each sample were calculated using ‘CIBERSORT’ with the LM22 background gene set to assess infiltration levels. The value of the “perm” parameter was adjusted to 100, and default values were used for the other parameters.
To determine the optimal number of clusters, the ‘fviz_Nbcluster’ function in the ‘factoextra’ package of R was used first. Clustering was then performed using the k-means method based on this optimal number, and the results were visualized through principal component analysis (PCA). Box plots, created with the ‘ggplot2’ and ‘ggpubr’ packages of R, were used to display the infiltration levels of 22 types of immune cells in each sample cluster, with statistical analysis conducted using the Wilcox rank sum test. Heatmaps generated by the ‘pheatmap’ package of R visualized immune scores and immune cell infiltration levels.
Comparative analysis of the immune characteristics between clusters
To further analyze the similarities and differences between the immune characteristics, the correlation among the 22 types of immune cells in each cluster was counted using the “corolot” package of R, and the results were visualized using correlation heatmaps. The differential expression of genes between the clusters was analyzed using the “DESeq2” package of R, using the following threshold criteria: corrected p < 0.05 and log2|fold change (FC)| > 1. The significantly differentially expressed genes (DEGs) were visualized using a volcano map and heatmap prepared using the “ggplot2” and “pheatmap” packages in R, respectively.
Weighted gene co-expression network analysis (WGCNA)
In this study, WGCNA was utilized to identify the gene modules related to the immune grouping of the DEGs. The WGCNA method analyzes gene expression patterns [12]. The “WGCNA” package of R was conducted to select the significant DEGs between clusters for subsequent analysis. The “pickSoftThreshold” function was used to determine the optimal soft threshold, following which the “blockwiseModules” function was used to construct the one-step network. The gene modules were subsequently visualized using the “plotDendroAndColors” function, and the correlation between the gene modules was visualized using a heatmap. The gene modules related to the immune clustering of the samples were finally identified by correlation analysis. The results were visualized using heatmaps prepared with the “labeledHeatmap” function.
The biological functions of the associated gene modules were further analyzed by Gene Ontology (GO) and Kyoto Encyclopedia of Genes and Genomes (KEGG) gene enrichment analyses. The genes in the associated gene module were subjected to GO functional annotation and KEGG pathway enrichment using the “clusterProfiler” package of R for identifying the significantly enriched biological features.
Construction and verification of prognostic model
The relationship between the immune characteristics of GBM and patient prognosis in GBM was investigated. A prognostic model was built based on the previously identified gene modules by univariate COX regression analysis and lasso regression analysis. The validity and reliability of the model were verified using an external dataset.
Univariate COX analysis was conducted with the “coxph” function in the “survival” package of R, considering statistical significance at p < 0.05. The genes that met the statistical threshold were used as inputs for establishing the lasso regression model using the “glmnet” package of R. The model was constructed using the “cv. glmnet” function, in which the “family” parameter was set to cox, and the value of the “alpha” parameter was set to 1. The invalid genes having a coefficient of 0 were removed and the model was finally established. The developed model was used to score the GBM dataset retrieved from TCGA, following which the optimal grouping threshold was selected. Stratified survival analysis was performed on these groups, and the Kaplan-Meier (KM) survival curve was generated to assess predictive potential.
For model validation, the predictive receiver operator curves (ROC) of the half-year, one-year, and three-year survival rates were prepared with the original dataset using the “timeROC” package of R. The GSE4412 dataset was subsequently scored.
Comparative analysis of the biological functions of groups
The Gene Set Enrichment Analysis (GSEA) method in the “clusterProfiler” package of R was used for GO and KEGG enrichment analyses and visualization. GSEA is performed to determine whether a set of genes shows statistically significant differences between two biological states, commonly estimating the changes in the signaling pathways and activities of biological processes in a sample. Differential gene expression analysis was performed as described in Comparative analysis of the immune characteristics between clusters.
Comparative analysis of the gene mutation characteristics of the groups
Mutation analysis was performed at the genome level to identify the differences in the mutation characteristics. Gene mutation data for GBM were obtained using the “tcga_load” function in the “TCGAmutations” package of R and analyzed using the “maftools” package of R. The “oncoplot” function was used to generate the mutation waterfall map.
Clustering of GBM cells based on scRNA-seq data
The “Seurat” package of R is widely used for the systematic processing of scRNA-seq data. In this study, the genes that were not expressed in the cells were removed during quality control. Gene feature selection was initially performed to speed up downstream analyses and enhance accuracy. The “FindVariableFeatures” function was used with default parameters to screen for high-variant genes. The features of the highly variable genes were then extracted by PCA, and the optimum number of primary components was decided by combining the JackStraw and Elbow methods. Batch effect data correction was performed based on patient labels using the “harmony” package of R. The cells were then subjected to unsupervised clustering based on the corrected principal components using the “FindClusters” function. The results of clustering were visualized using the Uniform Manifold Approximation and Projection for Dimension Reduction (UMAP) method. The significant DEGs across the cell clusters were visualized using heatmaps. The cell types in each cell cluster were identified based on the known tags provided in the original literature with the dataset, which contained a total of 7 cell types, namely, astrocytes, immune cells, neoplastic cells, neurons, oligodendrocytes, oligodendrocyte precursor cells, and vascular cells.
Identification of high-risk cell subsets
For identifying the high-risk cell subsets, each of the cells was assigned a risk score. The results of risk scoring were visualized based on the UMAP and t-distributed Stochastic Neighbor Embedding (TSNE) dimensionality reduction methods, following which the cell subsets with higher risk scores were identified. The DEGs of the high-risk subpopulations were subjected to GSEA to identify their biological characteristics.
Validation of prognostic model at the single-cell level
For validating the prognostic model at the single-cell level, the data pertaining to the GBM datasets in TCGA were deconvoluted for assessing the proportion of cell subsets in the tissues. The “CIBERSORT” package of R was utilized to infer the contents of the cell subpopulations in each of the tissue samples. The expression profiles of the significant DEGs between the cell subpopulations were used as background gene sets for deconvolution. These genes can reflect the biological characteristics of each cell subpopulation, and can thus enhance the reliability and accuracy during assessment of the proportion of a particular cell subpopulation.
The samples were then automatically grouped using the “surv_cutpoint” function based on the proportion of high-risk cell subsets. A stratified survival analysis was subsequently performed, and the KM survival curve was prepared to verify the model's predictive effect at the single-cell level.
The osimertinib resistance of the cell subsets was predicted using the “OncoPredict” package of R, based on the resistance data obtained from the Genomics of Drug Sensitivity in Cancer (GDSC) database. The results were visualized using box and violin plots, and the statistical significance was evaluated using the Kruskal-Wallis method.
LN229, T98G, and GBM1492 cells were purchased from the American Type Culture Collection. The LN229 and GBM1492 cells were cultured with 5% and 10% Dulbecco’s Modified Eagle Medium (DMEM; Hyclone, SH30022.LS, Shanghai, China) supplemented with 1% Penicillin-Streptomycin Solution (PS; Hyclone, SV30010, Shanghai, China). The T98G cells were cultured with 10% Minimum Essential Medium (MEM; Hyclone, SH30008.12, Shanghai, China) supplemented with 1% PS.
Short hairpin RNA (shRNA) knockdown and transfection
In this study, shRNA knockdown was performed by lentiviral transfection, and the vector was constructed by transfecting the exogenous cDNA into HEK293T cells using the pMD2.G and psPAX2 plasmids. After 72 h of infection, the transfected cells were screened with puromycin, and protein expression was tested by western blotting. The sequences of the shRNA targets are enlisted in Table A1.
The target proteins of different molecular weights were separated by polyacrylamide gel electrophoresis and subsequently transferred to a nitrocellulose membrane. The antibodies were diluted according to the instructions (Table A2). The membranes were then blocked with the primary antibody incubated overnight, and subsequently incubated with the corresponding secondary antibodies. The developer solution was prepared following the instructions provided with the luminescence kit. The developer solution was applied evenly on the strip, and incubated in the absence of incident light for 2 min. The strip was finally developed using a gel imager (Bio-Rad, ChemiDoc XRS+, Hercules, CA, USA). The antibodies used in the study are enlisted in Table A2. Written informed consent was obtained from the patients, and all the samples and data used were obtained under the approval of the Ethics Committee of Liaoning Cancer Hospital & Institute (approval numbers: 20220429, date: 20220412).
Colony formation and cell invasion assays
For analyzing colony formation, different glioma cell lines (2000 cells per plate) were cultured in the corresponding medium for nearly 2 weeks. The number of colonies was determined by light microscopy (OLYMPUS, IX81, Tokyo, Japan). Then 200 μL of serum-free suspension cells were added to the upper chamber, with 700 μL of the complete culture medium in the lower chamber. After culturing for 12–24 h, the cells were fixed with 4% formaldehyde (Solarbio, P1110, Shanghai, China) and stained with 0.1% crystal violet (Beyotime Biotechnology, C0121, Shanghai, China). The Transwell membranes were pre-coated with 24 μg/μL matrigel (R&D Systems, Inc., Minneapolis, MN, USA). Cell invasion assays require the use of matrigel. The cells cultured in media without fetal bovine serum were seeded at a density of 5 × 10⁴ cells/100 μL on a fibronectin-coated polycarbonate membrane insert in a transwell apparatus (Costar, Corning, NY, USA). Then 500 μL of the medium supplemented with 10% fetal bovine serum was added as a chemoattractant. The cells that adhered to the lower surface were counted using the protocol used for cell migration assays. The invasion capacity of the cells was determined based on the total number of cells in randomly selected fields under the light microscope.
Chick embryo chorioallantoic membrane (CAM) assays
Fertilized chicken eggs were purchased from MERIAL (Beijing, China) and incubated at 37°C with a relative humidity of 65% for 1–2 weeks. Then 1 × 10⁶ serum-free suspension cells were applied on the surface of the CAM (n = 4 eggs per group), and angiogenesis was studied at days 7–10. All the animal experiments were performed according to the approval of the Ethics Committee of Dalian Medical University (approval number: AEE23015, date: 20230515).
All the calculations and statistical analyses were conducted using R software (https://www.r-project.org, accessed on 12/04/2024, version 4.1.2) and GraphPad Prism 9 (GraphPad Software, La Jolla, CA, USA). The Wilcox rank-sum test was used to compare two groups of continuous variables, analyzing differences between non-normally distributed variables. Correlation analysis was performed by Spearman correlation analysis using the “cor” function in R software unless otherwise specified. All the p-values were bilateral, and p < 0.05 was considered to be statistically significant unless otherwise specified. All the assays were independently repeated at least thrice.
As depicted in Fig. 1, the study was performed in four steps. The immune grouping of GBM was performed in step 1. Briefly, information pertaining to patients with GBM was retrieved from the TCGA database and the patients were grouped based on their immune characteristics. The immune characteristics of each group were re-analyzed, and the key genes linked to the progression of GBM were finally identified by WGCNA. In step 2, a prognostic model was built using genes related to the immune features. We first used univariate COX regression analysis and LASSO for screening the genes that were associated with patient prognosis and constructed the prognostic model. Internal and external validation were subsequently performed, and the differences between the biological characteristics of the groups were explored. In step 3, the high-risk cell clusters were identified at the single-cell level. To this end, scRNA-seq data for GBM (accession number: GSE84465) were retrieved from the GEO database and clustered. Risk assessment was then performed for each cell subpopulation using the prognostic model, and the biological characteristics of the high-risk cell subpopulations was explored. The prognostic model was finally re-verified at the single-cell level. In step 4, the impact of the high-risk cell subpopulations on drug resistance in GBM was explored, and the effect of TMEM159 on GBM was verified experimentally. The workflow of the study is depicted in Fig. 1.
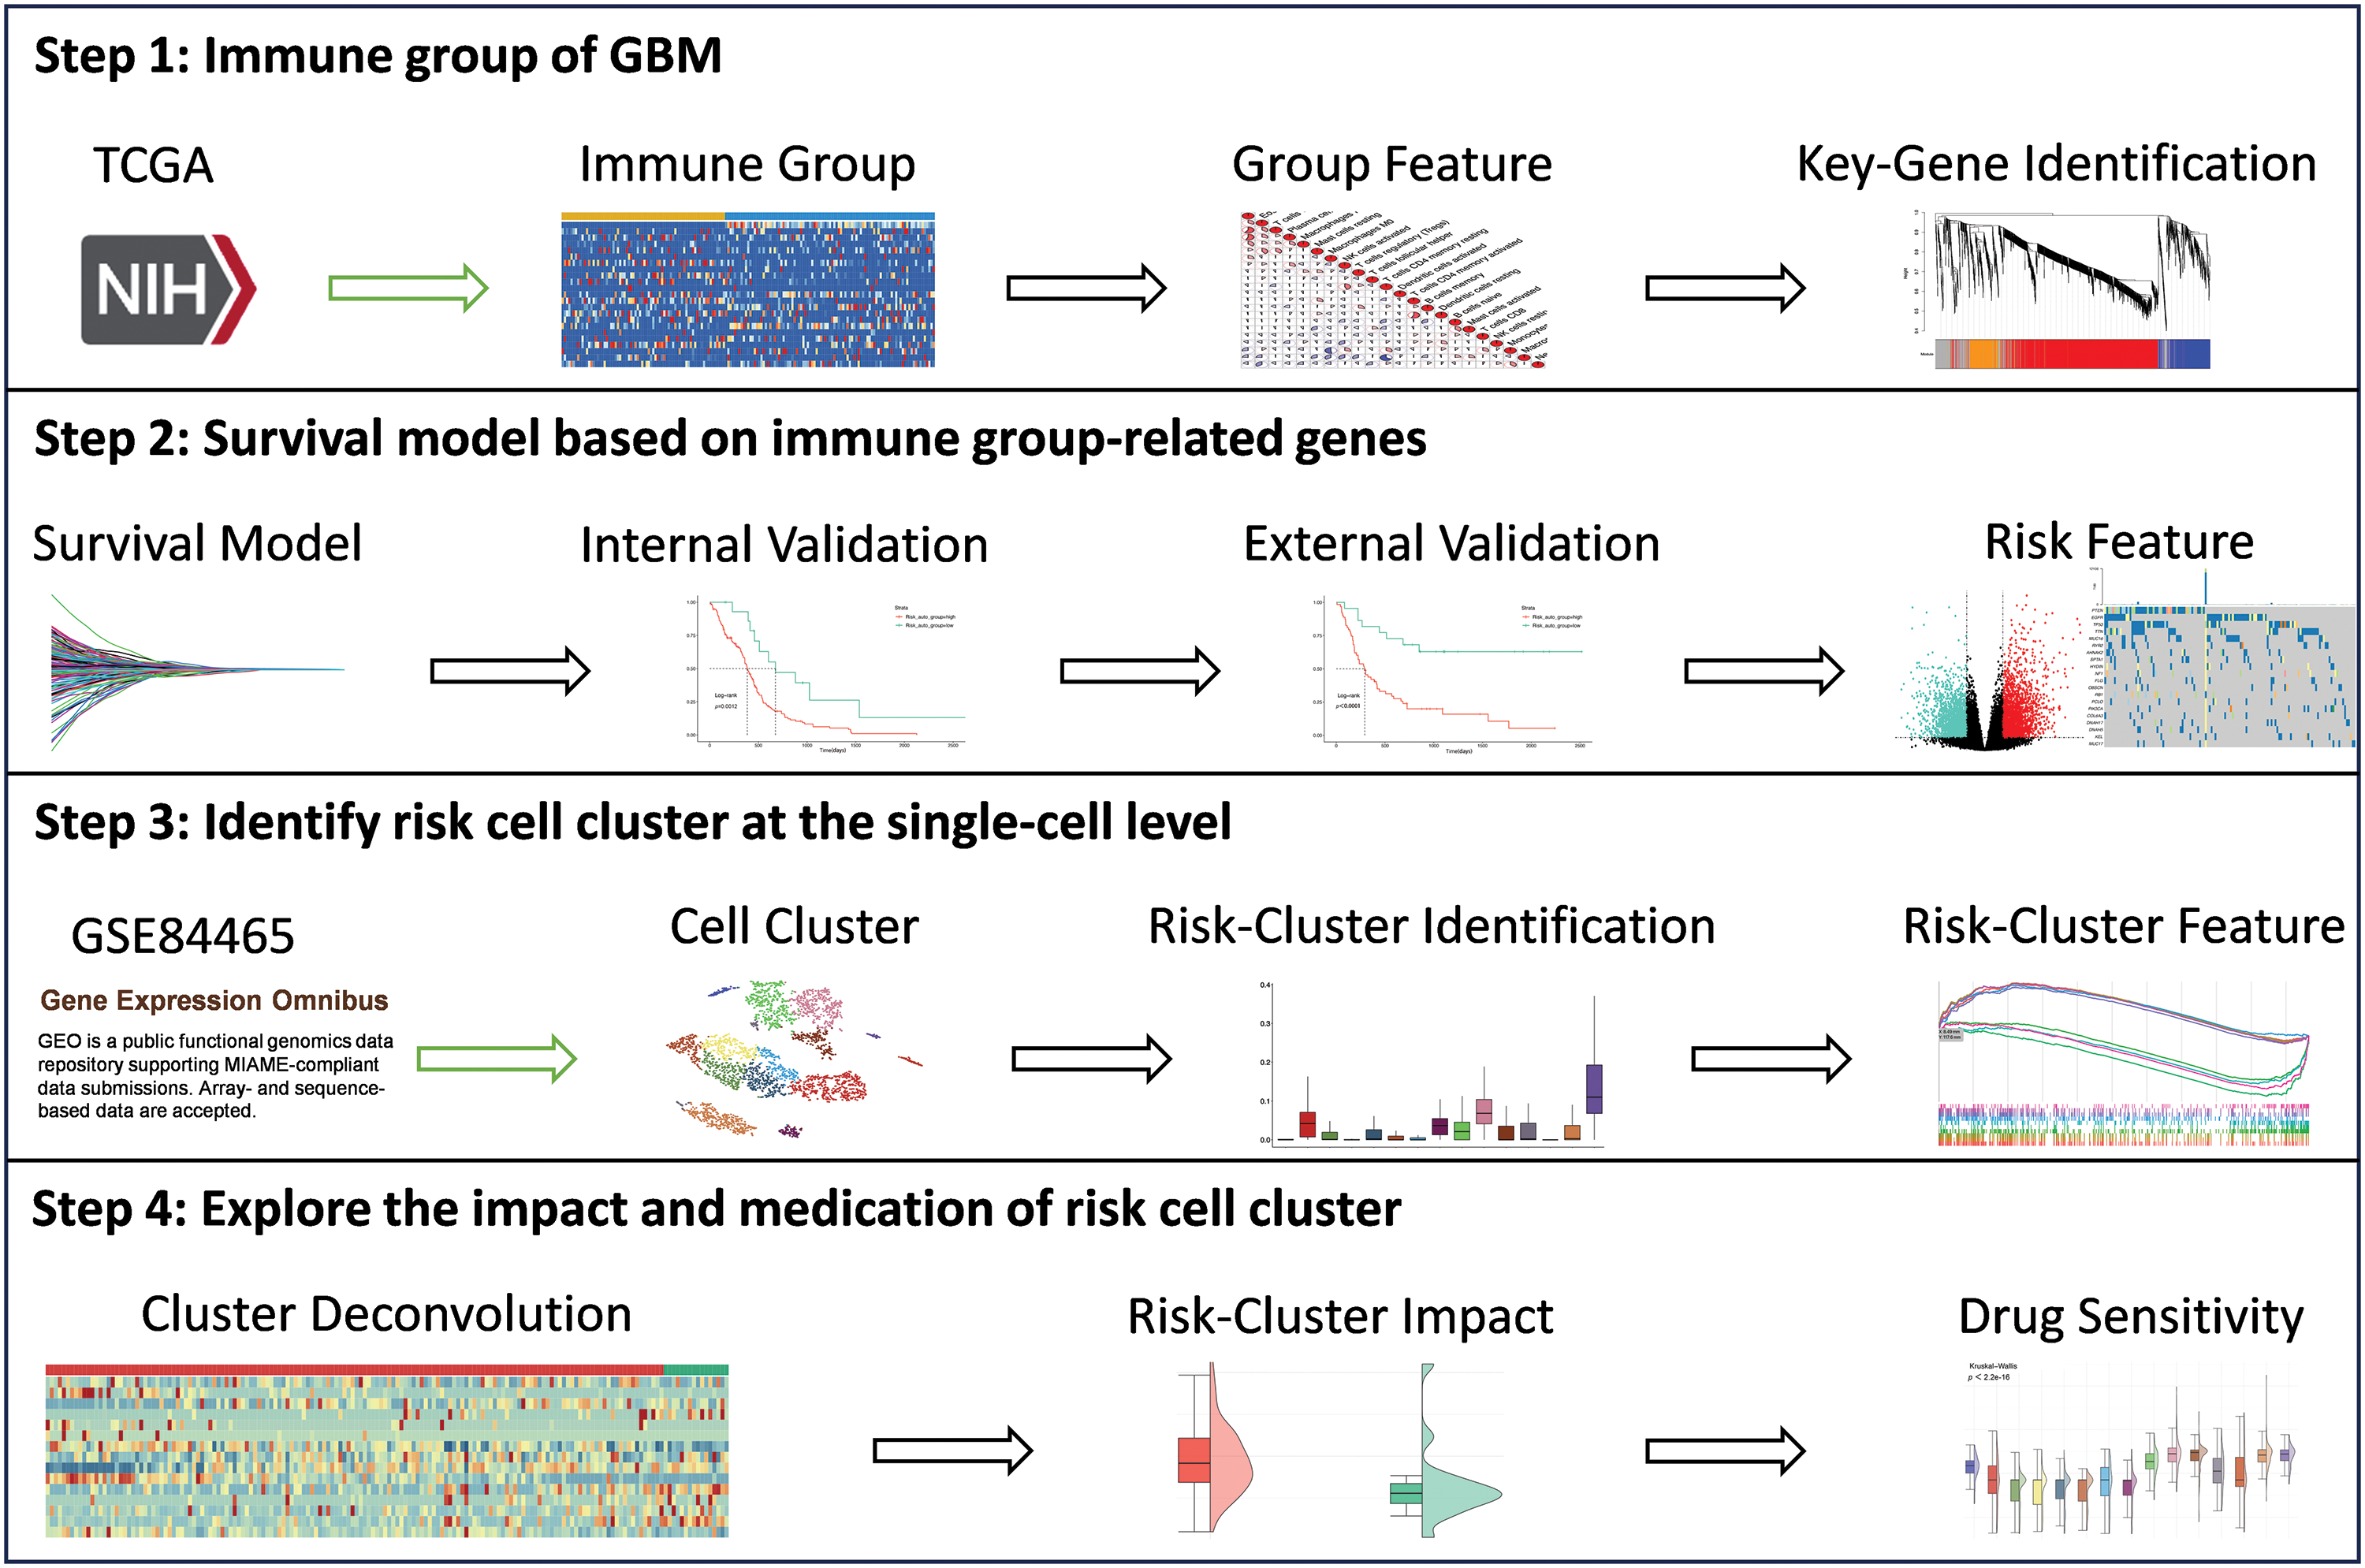
Figure 1: Schematic depiction of the research workflow.
Exploration of the immune characteristics of GBM
GBM is a highly heterogeneous malignancy, and researchers have been paying increasing attention to the effects of the immune microenvironment and immune signatures on cancer in recent years. To explore the immune characteristics of GBM, 169 samples of GBM tissue were subjected to unsupervised clustering, and the results of clustering were evaluated based on the infiltration levels and immune scores of immune cells.
The k-means clustering method determined the optimal number of clusters to be 2 (Fig. 2A). The results of PCA showed that there was a clear boundary between the two clusters in the dimensionality reduction space, indicating a good clustering effect (Fig. 2B). Box plots illustrated the differences in infiltration levels of 22 immune cell types between the two clusters, revealing significant differences in 14 of these cell types (Fig. 2C). The immune scores of the two clusters were depicted in a heatmap, and the results presented that the immune scores of the cells in cluster 2 were greatly higher than those of cluster 1, indicating that the immunophenotyping of cluster 2 was more remarkable (Fig. 2D). These results supported the heterogeneity of the immune microenvironment in GBM. It was worth noting that the major immune killer cells, including CD8+ T cells, natural killer cells, monocytes, and macrophages, had higher infiltration levels in cluster 2, while the cells with immunosuppressive effects, including T helper cells, had a higher infiltration level in cluster 1, which was consistent with the result of immune score analysis.
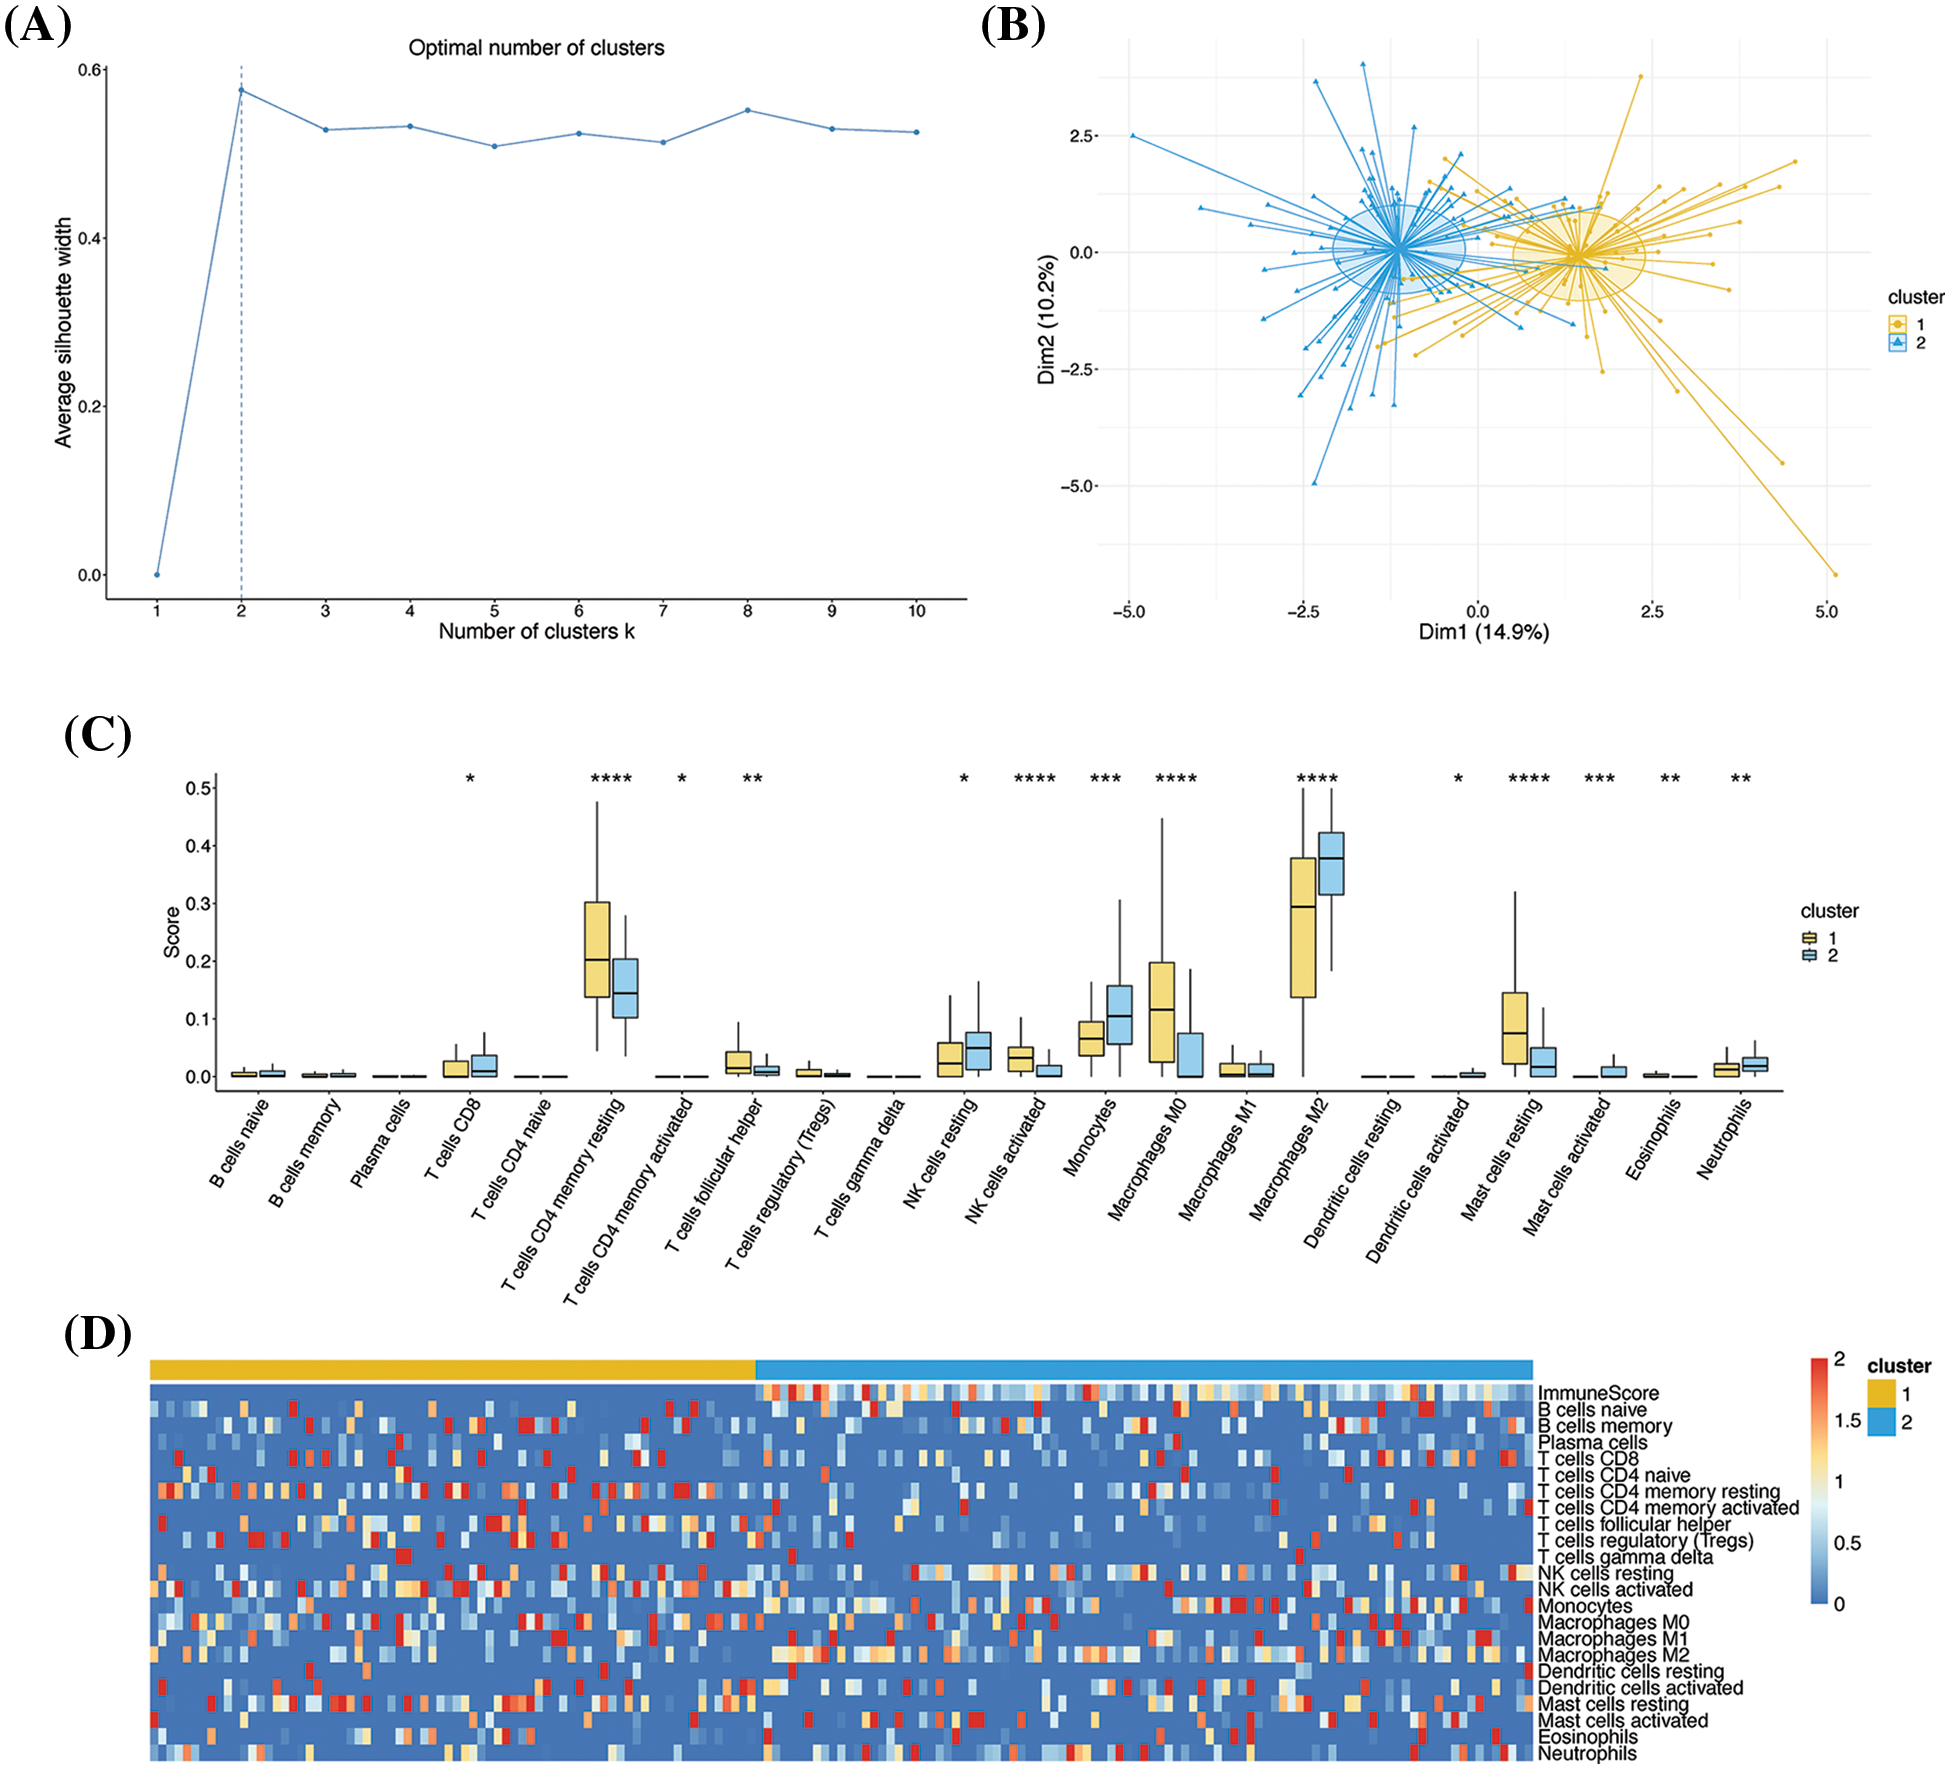
Figure 2: Clustering based on immune characteristics. (A) Determination of the optimal number of clusters. The number of clusters and the average contour values are denoted in the X- and Y-axes, respectively. The optimal number of clusters was identified by calculating the average contour value with the largest contour value (dashed line) indicating the optimal number. (B) PCA dimensionality reduction graph depicting the results of k-means clustering. The X- and Y-axes represent the two dimensions, and each point represents a sample. All the samples were clustered into two groups. The subgroups are indicated by different colors, and the shadows denote the confidence intervals. (C) Box diagram depicting the infiltration levels of 22 types of immune cells. The X- and Y-axes represent the 22 types of immune cells and their infiltration levels, respectively. (D) Heatmap depicting the immune scores. The colors represent the infiltration levels or scores; *p < 0.05, **p < 0.01, ***p < 0.001, and ****p < 0.0001.
Differences between the immune characteristics of sample clusters
To analyze the differences in the immune characteristics, the correlation among the different types of immune cells was examined. The results demonstrated that the correlation between certain cells exhibited opposite trends (Fig. 3A,B). For instance, gamma delta T cells positively correlated with plasma cells and CD4 naive T cells in cluster 1 but exhibited a negative correlation in cluster 2. To a certain extent, these results reflected the differences in the immune microenvironment of the two clusters. The differential gene expression between the two clusters was subsequently analyzed. Taking cluster 1 as the control, 2796 significant DEGs were identified, comprising 2108 upregulated and 688 downregulated genes (Fig. 3C). Analysis of the heatmap revealed that the majority of genes were highly expressed in cluster 2, while a few genes were highly expressed in cluster 1 (Fig. 3D). Programmed death-1 (PD-1) and programmed cell death-ligand 1 (PD-L1) are two important immune checkpoint proteins [13]. We analyzed the expression of PD-1 and PD-L1 in the two clusters, and the results demonstrated that PD-1 and PD-L1 were typically overexpressed in cluster 2 (Fig. 3E), which was consistent with the high immune scores of cluster 2.
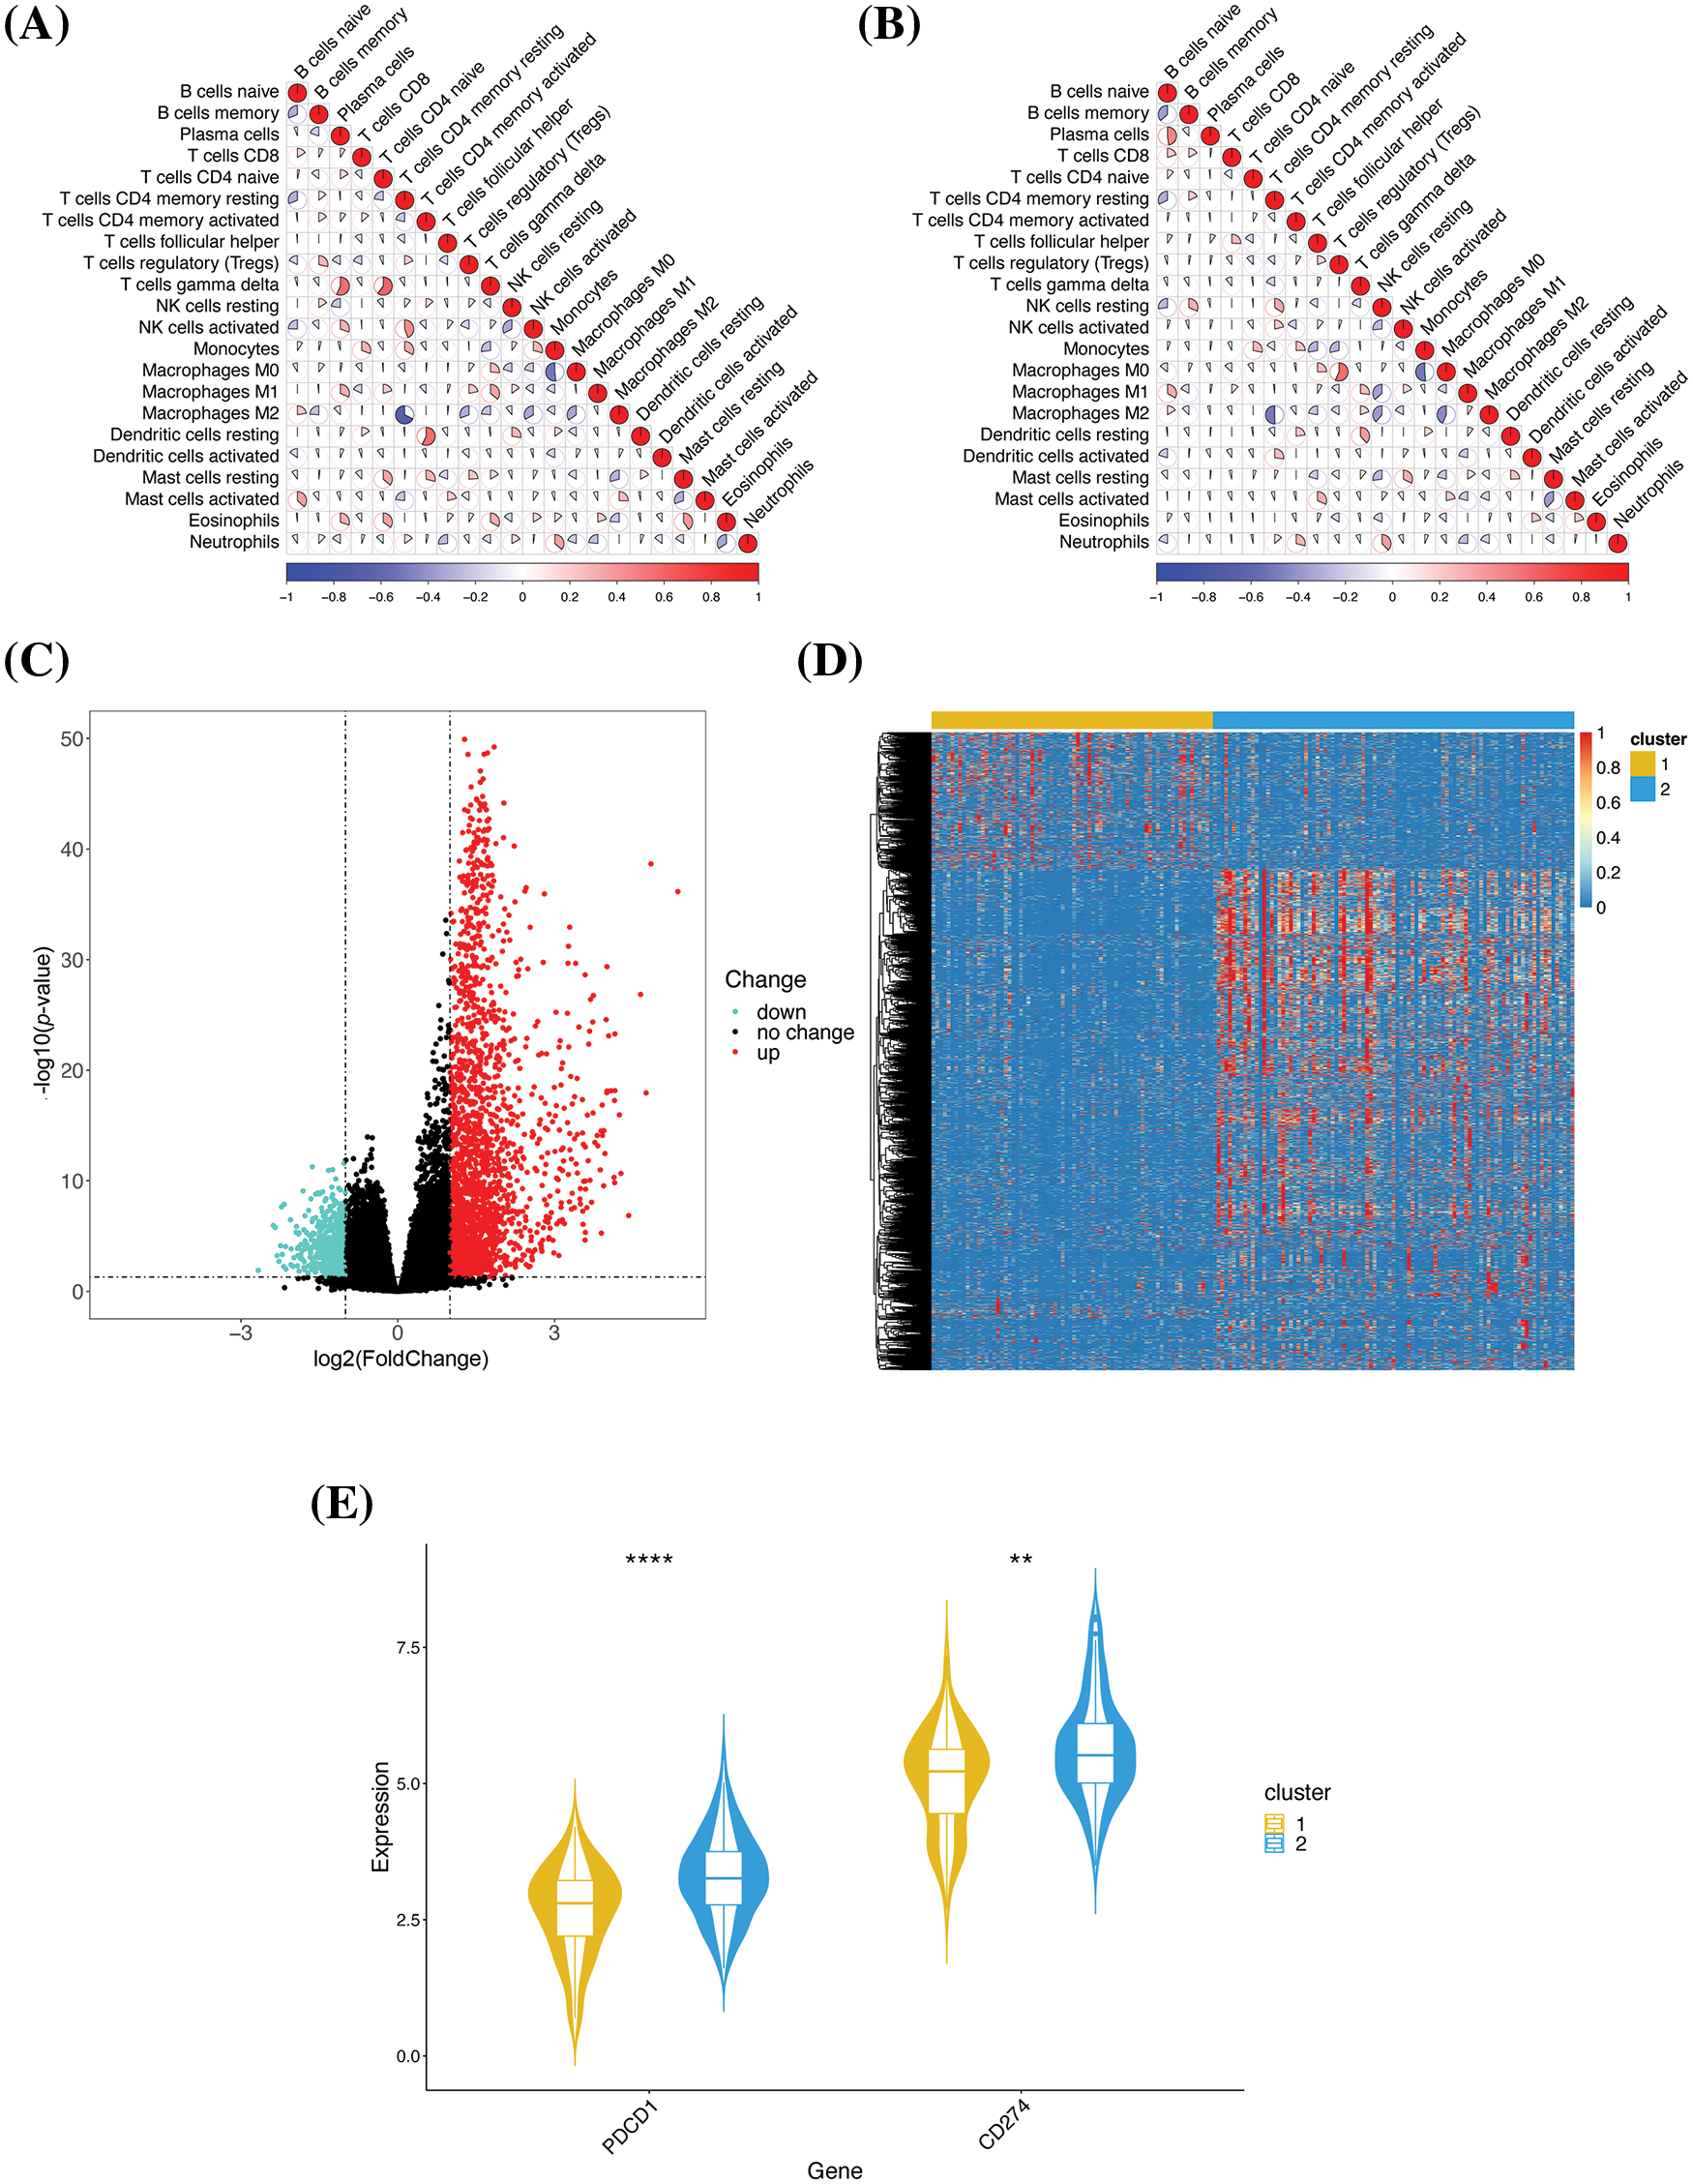
Figure 3: Comparative analysis of the immune characteristics of the two clusters. (A) Correlation among the immune cells in cluster 1. The color and area of each sector represent the degree of correlation; positive and negative correlations are denoted in red and blue, respectively. A higher sector area corresponds to a higher absolute value of correlation. (B) Correlation among the immune cells in cluster 2. (C) Volcano map of the DEGs. The individual genes are represented by dots, and the downregulated and upregulated genes are denoted by green and red, respectively. Genes with no significant change in expression are denoted in black. (D) Heatmap of the DEGs. (E) Gene expression profiles of the immune checkpoint proteins. The genes and their expression values are denoted in the X- and Y-axes, respectively; **p < 0.01 and ****p < 0.0001.
These results further confirmed that there were meaningful differences in the biological characteristics of the two clusters, which were reflected in the immune microenvironment and gene expression profiles, and the differences in the immune microenvironment could be attributed to differences in the expression of key genes.
Identification of immune-related gene modules by WGCNA
To explore the gene modules associated with immunophenotyping, the gene modules of the significant DEGs were identified by WGCNA, and the phenotypic associations of the identified gene modules were analyzed. The optimal soft threshold was determined to be 3 by WGCNA (Fig. 4A). The one-step network construction method was subsequently used to search for the gene modules. 3 effective gene modules were pinpointed, of which the red, blue, and orange modules comprised 998, 267, and 206 genes, respectively (Fig. 4B). Correlation analysis among the gene modules acknowledged a higher positive correlation between the red and orange modules, while the blue module showed a higher negative correlation with both the red and orange modules (Fig. 4C). Analysis of the phenotypic association revealed the highest correlation coefficient of the red module with cluster 2 (Fig. 4D), and we speculated that there might be key genes in the red module that are closely related to the immune characteristics of cluster 2.
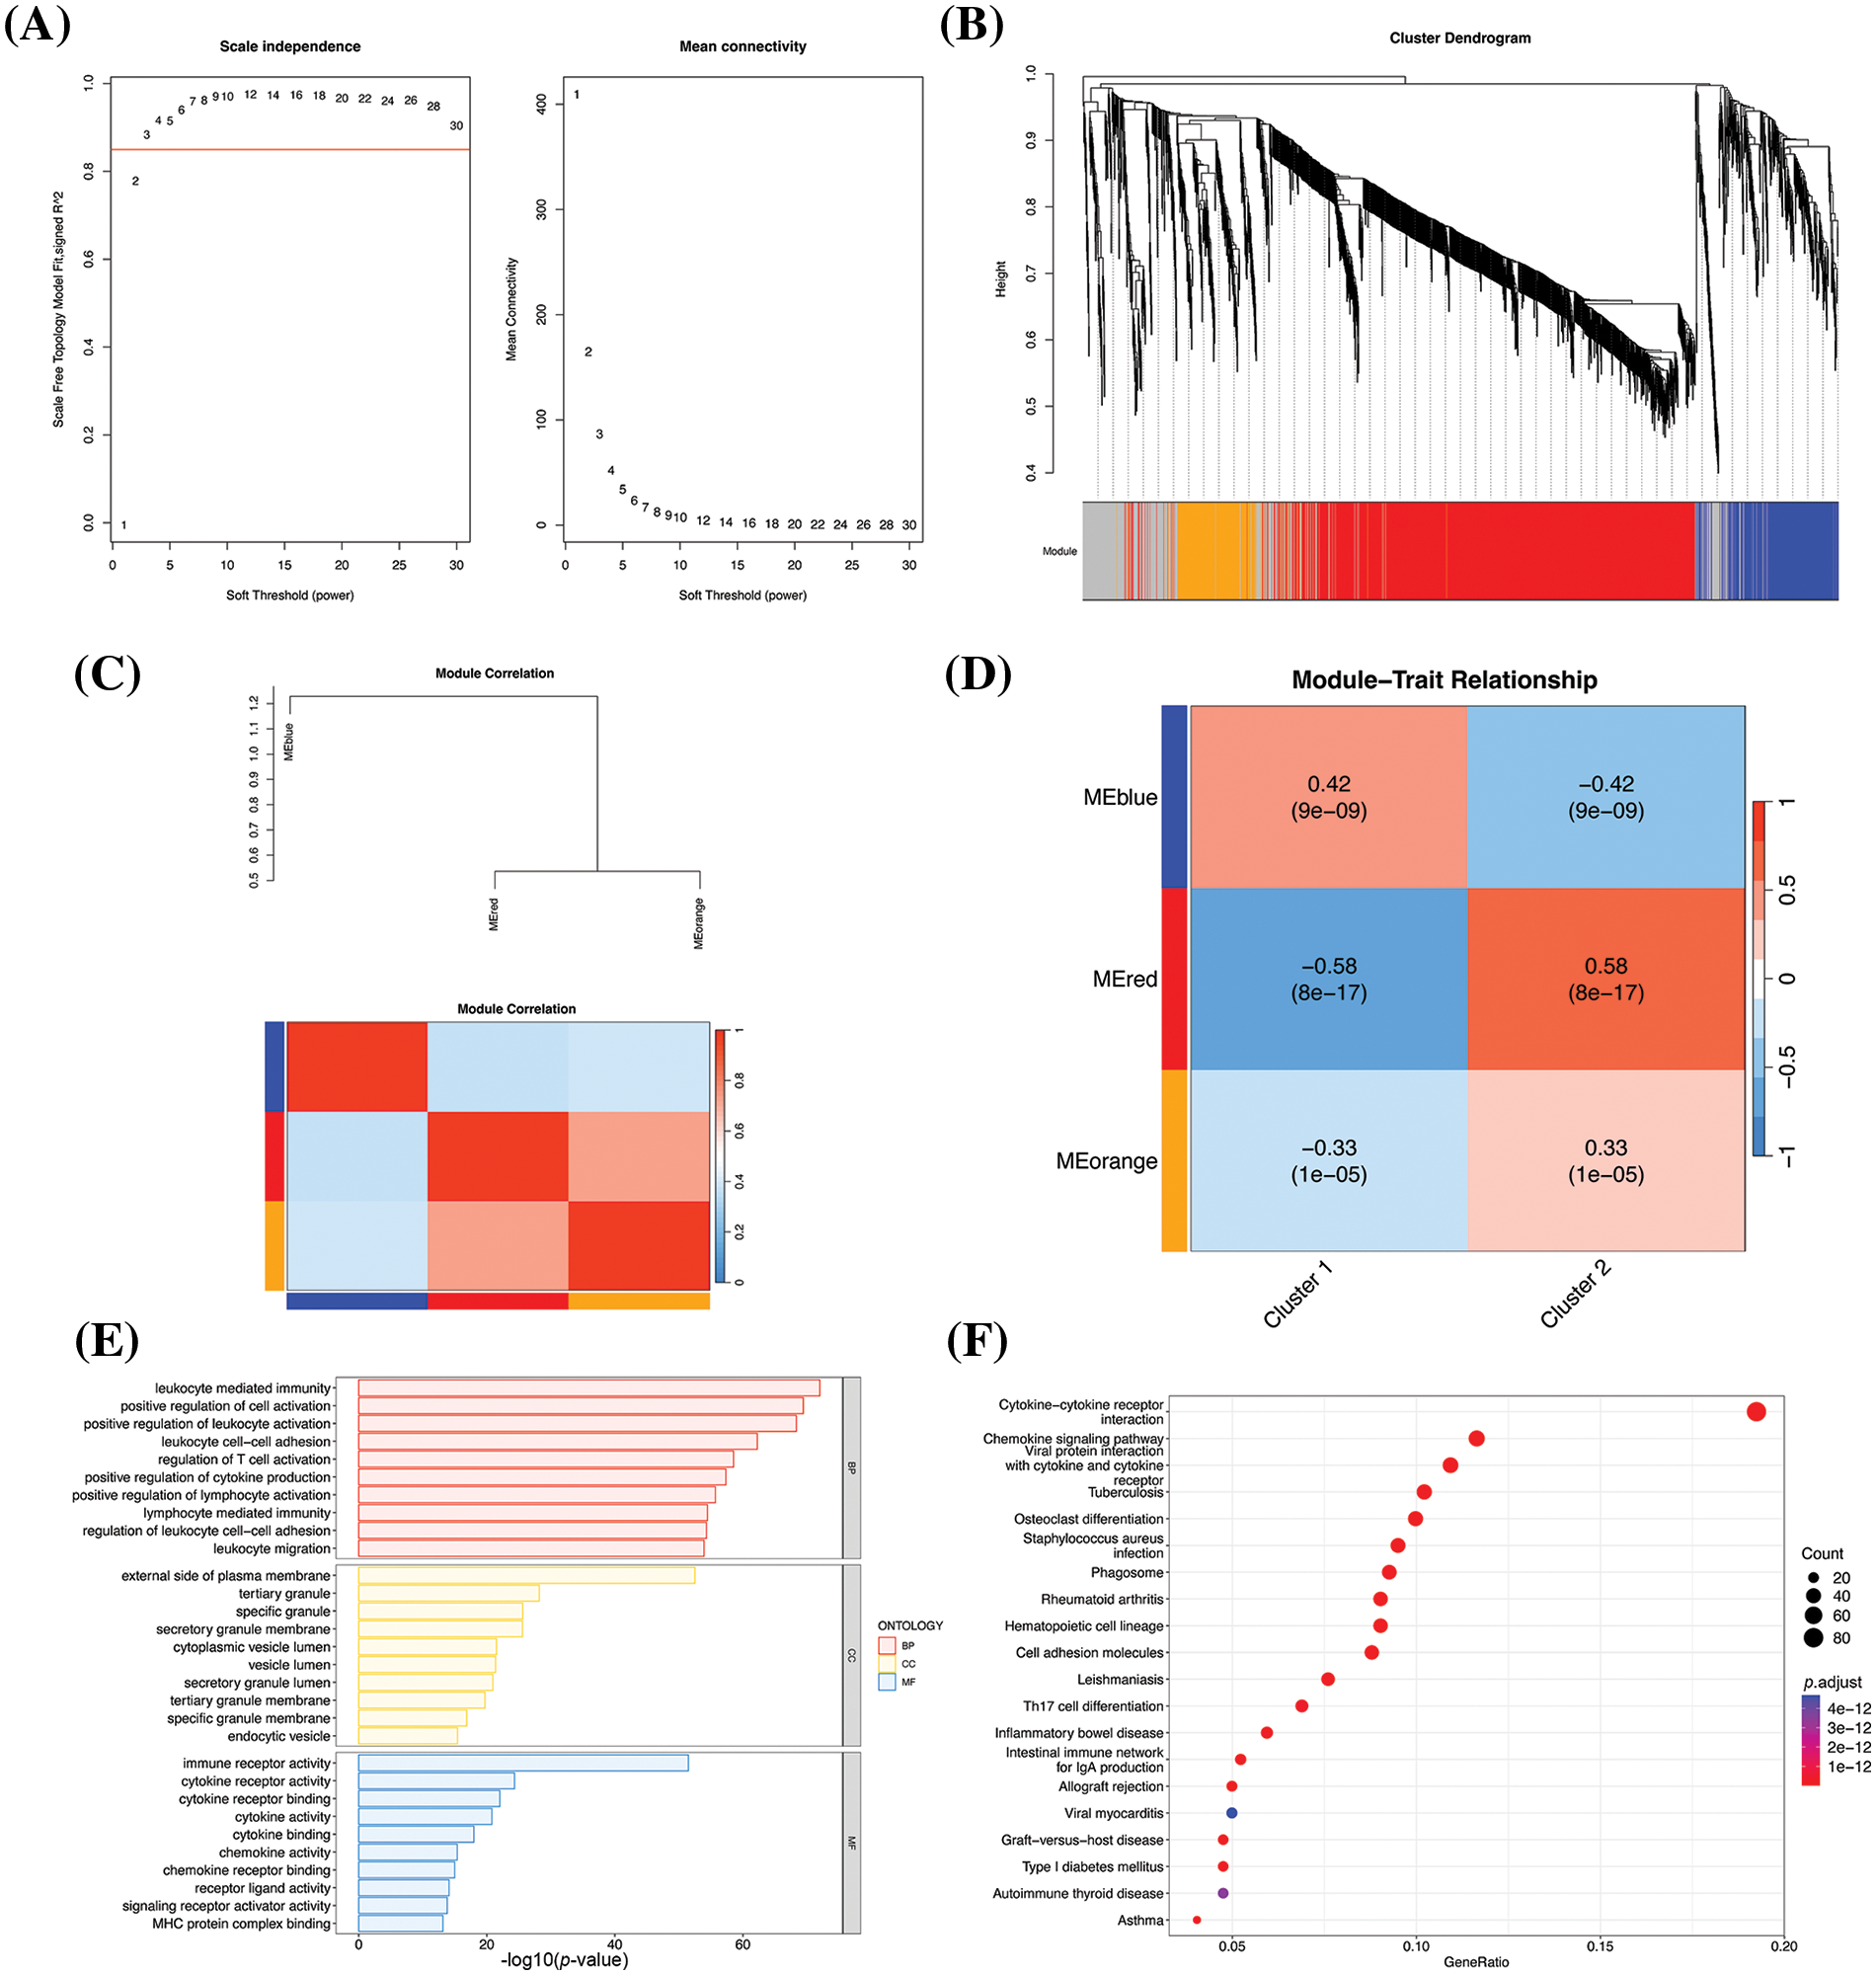
Figure 4: Results of WGCNA. (A) Selection of the optimal soft threshold value. The best soft threshold value in the panel on the left is represented by the value that exceeds the red line for the first time, and the best soft threshold value in the panel on the right appears at the inflection point. The optimal soft threshold was thus determined to be 3 based on the two figures. (B) WGCNA-based hierarchical clustering. The hierarchical clustering tree is provided in the upper panel, and the modules corresponding to the respective genes are denoted below. The modules are indicated by different colors, and the invalid module is denoted in gray. (C) Correlation between the modules. (D) Heatmap of phenotypic association obtained by WGCNA, depicting the association between the gene modules and group labels. The numerical values indicate correlation, and the p values are indicated in brackets. (E) Bar chart depicting the results of GO enrichment analysis. The X-axis denotes the –log10 p-values and the Y-axis represents the enriched GO terms. The 10 most significantly enriched GO terms in the biological process (BP), cellular component (CC), and molecular function (MF) categories are depicted. (F) Bubble map depicting the results of KEGG enrichment analysis. The X-axis denotes the proportion of genes enriched in the pathway to the total number of DEGs, and the Y-axis represents the enriched pathways. The colors represent the corrected p-values; the smaller the p-values, the closer to red. The 20 most significantly enriched pathways are depicted.
To verify our hypothesis, the genes in the red module were performed on GO and KEGG enrichment analyses. The GO enrichment results demonstrated that 5 most significantly enriched terms were leukocyte mediated immunity, positive regulation of cell activation, positive regulation of leukocyte activation, leukocyte cell-cell adhesion, and regulation of T cell activation (Fig. 4E), and these functions are primarily involved in the immune activation of white blood cells and T cells. The KEGG results demonstrated that the 5 most significantly enriched pathways were cytokine-cytokine receptor interaction, viral protein interaction with cytokine and cytokine receptor, Staphylococcus aureus infection, rheumatoid arthritis, and hematopoietic cell lineage (Fig. 4F). These pathways were primarily related to the functions of cytokines, which are crucial in the immune system. The results of KEGG pathway analysis were consistent with the results of GO enrichment analyses, and both findings suggested that the red module contained genes related to immune characteristics, and was thus responsible for the higher immune characteristics of cluster 2.
Establishment and validation of prognostic model
A prognostic model was established using the 998 genes in the red module to decide the relationship between immune-related genes and GBM patient prognosis. The genes that were significantly related to patient prognosis were screened by univariate COX regression analysis based on the survival data for GBM retrieved from the TCGA, and 200 genes were identified in total. The genes were subjected to LASSO, and the optimal lambda value was determined (Fig. 5A,B). Finally, a total of 9 known protein-coding genes with non-zero coefficients were obtained, and the following predictive model was established:
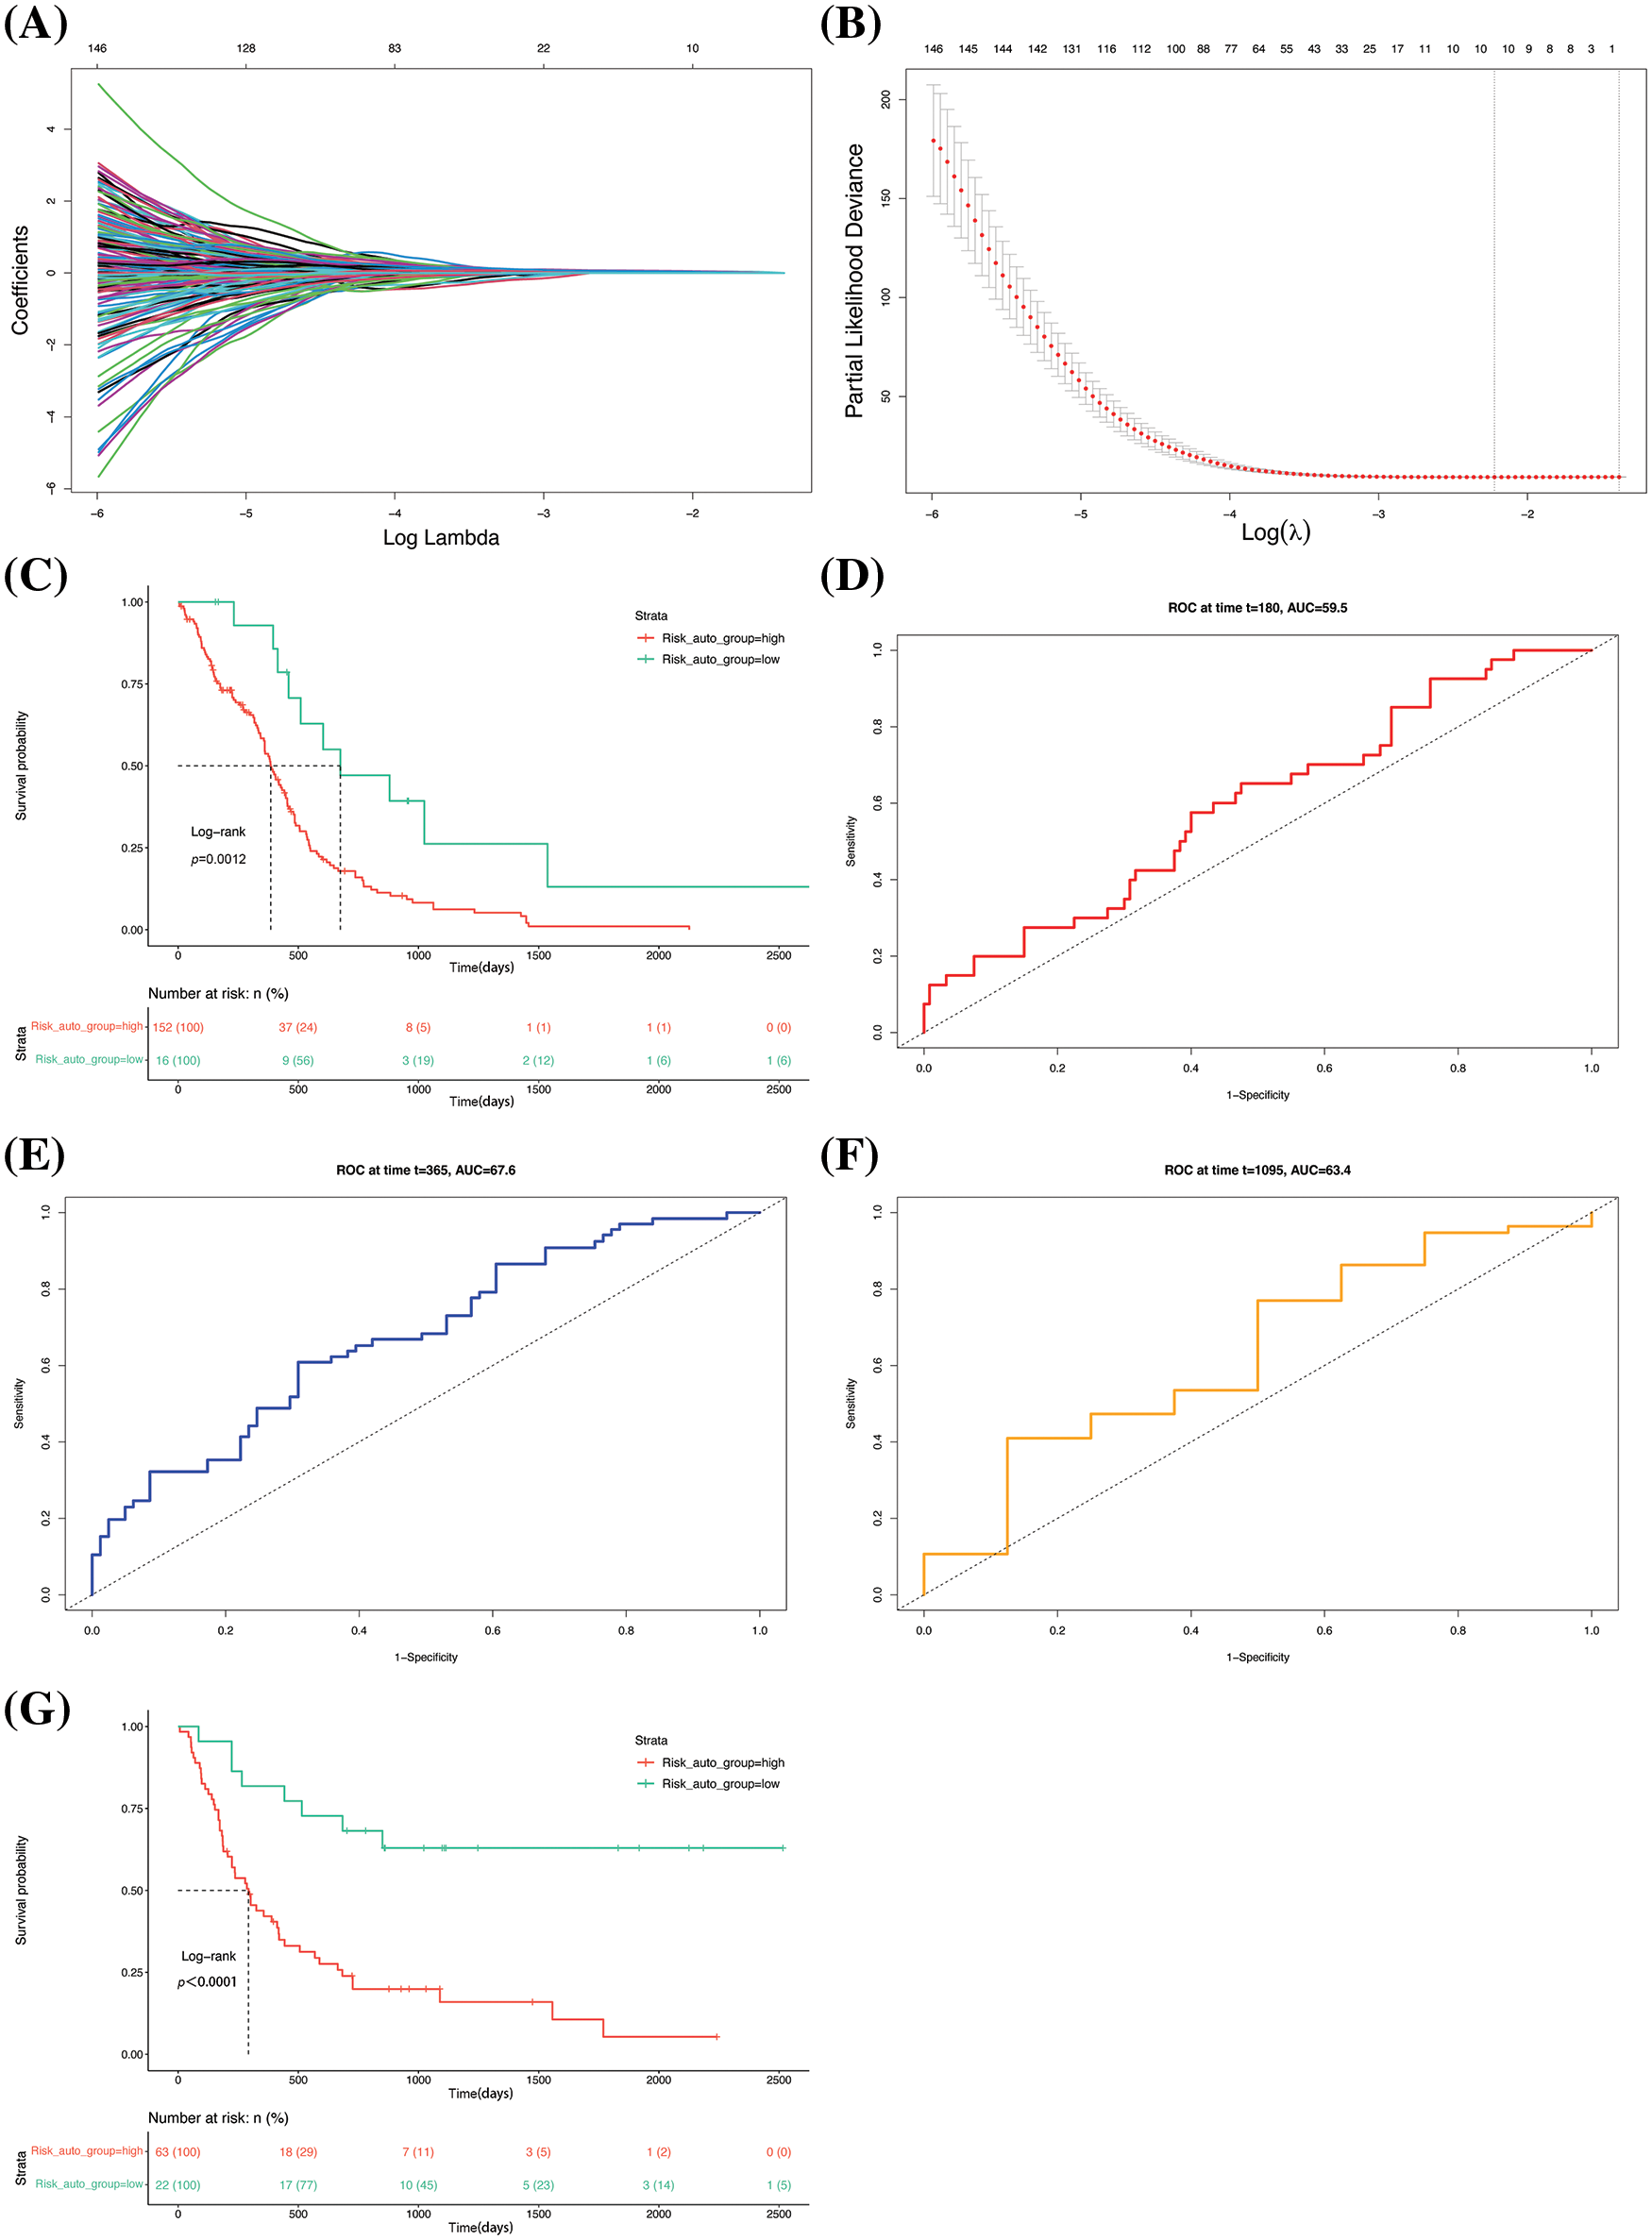
Figure 5: Establishment and validation of the prognostic model. (A) Lasso regression curve depicting the convergent screening of gene features with lasso regression analysis. The X- and Y-axes represent the log lambda values and regression coefficients, respectively, and the various colored lines denote different features. (B) Optimal lambda selection curve. The best value is usually selected from the first dotted line. (C) Survival curve of the groups. The dashed line corresponds to the median survival time. ROC curves for prediction of (D) half-year, (E) 1-year, and (F) 3-year survival rates. (G) Survival curve of the GSE4412 dataset.
The model was utilized to determine the risk scores of the original samples. Analysis of the KM survival curve revealed that there were great differences in patient prognosis (Fig. 5C). The predictive potential of the model was assessed from the ROC curves of the six-month, 1-year, and 3-year survival rates of the samples. The results demonstrated that the area under the curve (AUC) values of prediction for the half-year (Fig. 5D), 1-year (Fig. 5E), and 3-year (Fig. 5F) survival rates of the samples were 0.595, 0.676, and 0.634, all of which were greater than 0.5. The GSE4412 dataset was subjected to risk score and survival analyses. The results demonstrated that there was a remarkable difference in patient prognosis between the two groups (Fig. 5G), presenting that the model has a good generalization ability and robustness.
Biological differences between the high- and low-risk groups
The biological differences between the groups were further analyzed to determine the reasons underlying the differences between the survival characteristics. In this study, differential gene expression was analyzed at the transcriptome level. Taking the low-risk group as a control, 4806 significant DEGs were described in the high-risk group, including 2177 and 2629 upregulated and downregulated genes, respectively (Fig. 6A). Analysis of the DEG heatmap revealed that a larger number of DEGs were upregulated in the low-risk group (Fig. 6B). The DEGs were then subjected to GSEA to identify their biological functions. The KEGG enrichment analysis declared that the five most significantly enriched pathways were mainly related to the functions of cytokines in immune processes (Fig. 6C). The GO-based enrichment analysis revealed that the five most significantly enriched terms in the BP category were all related to immune functions (Fig. 6D).
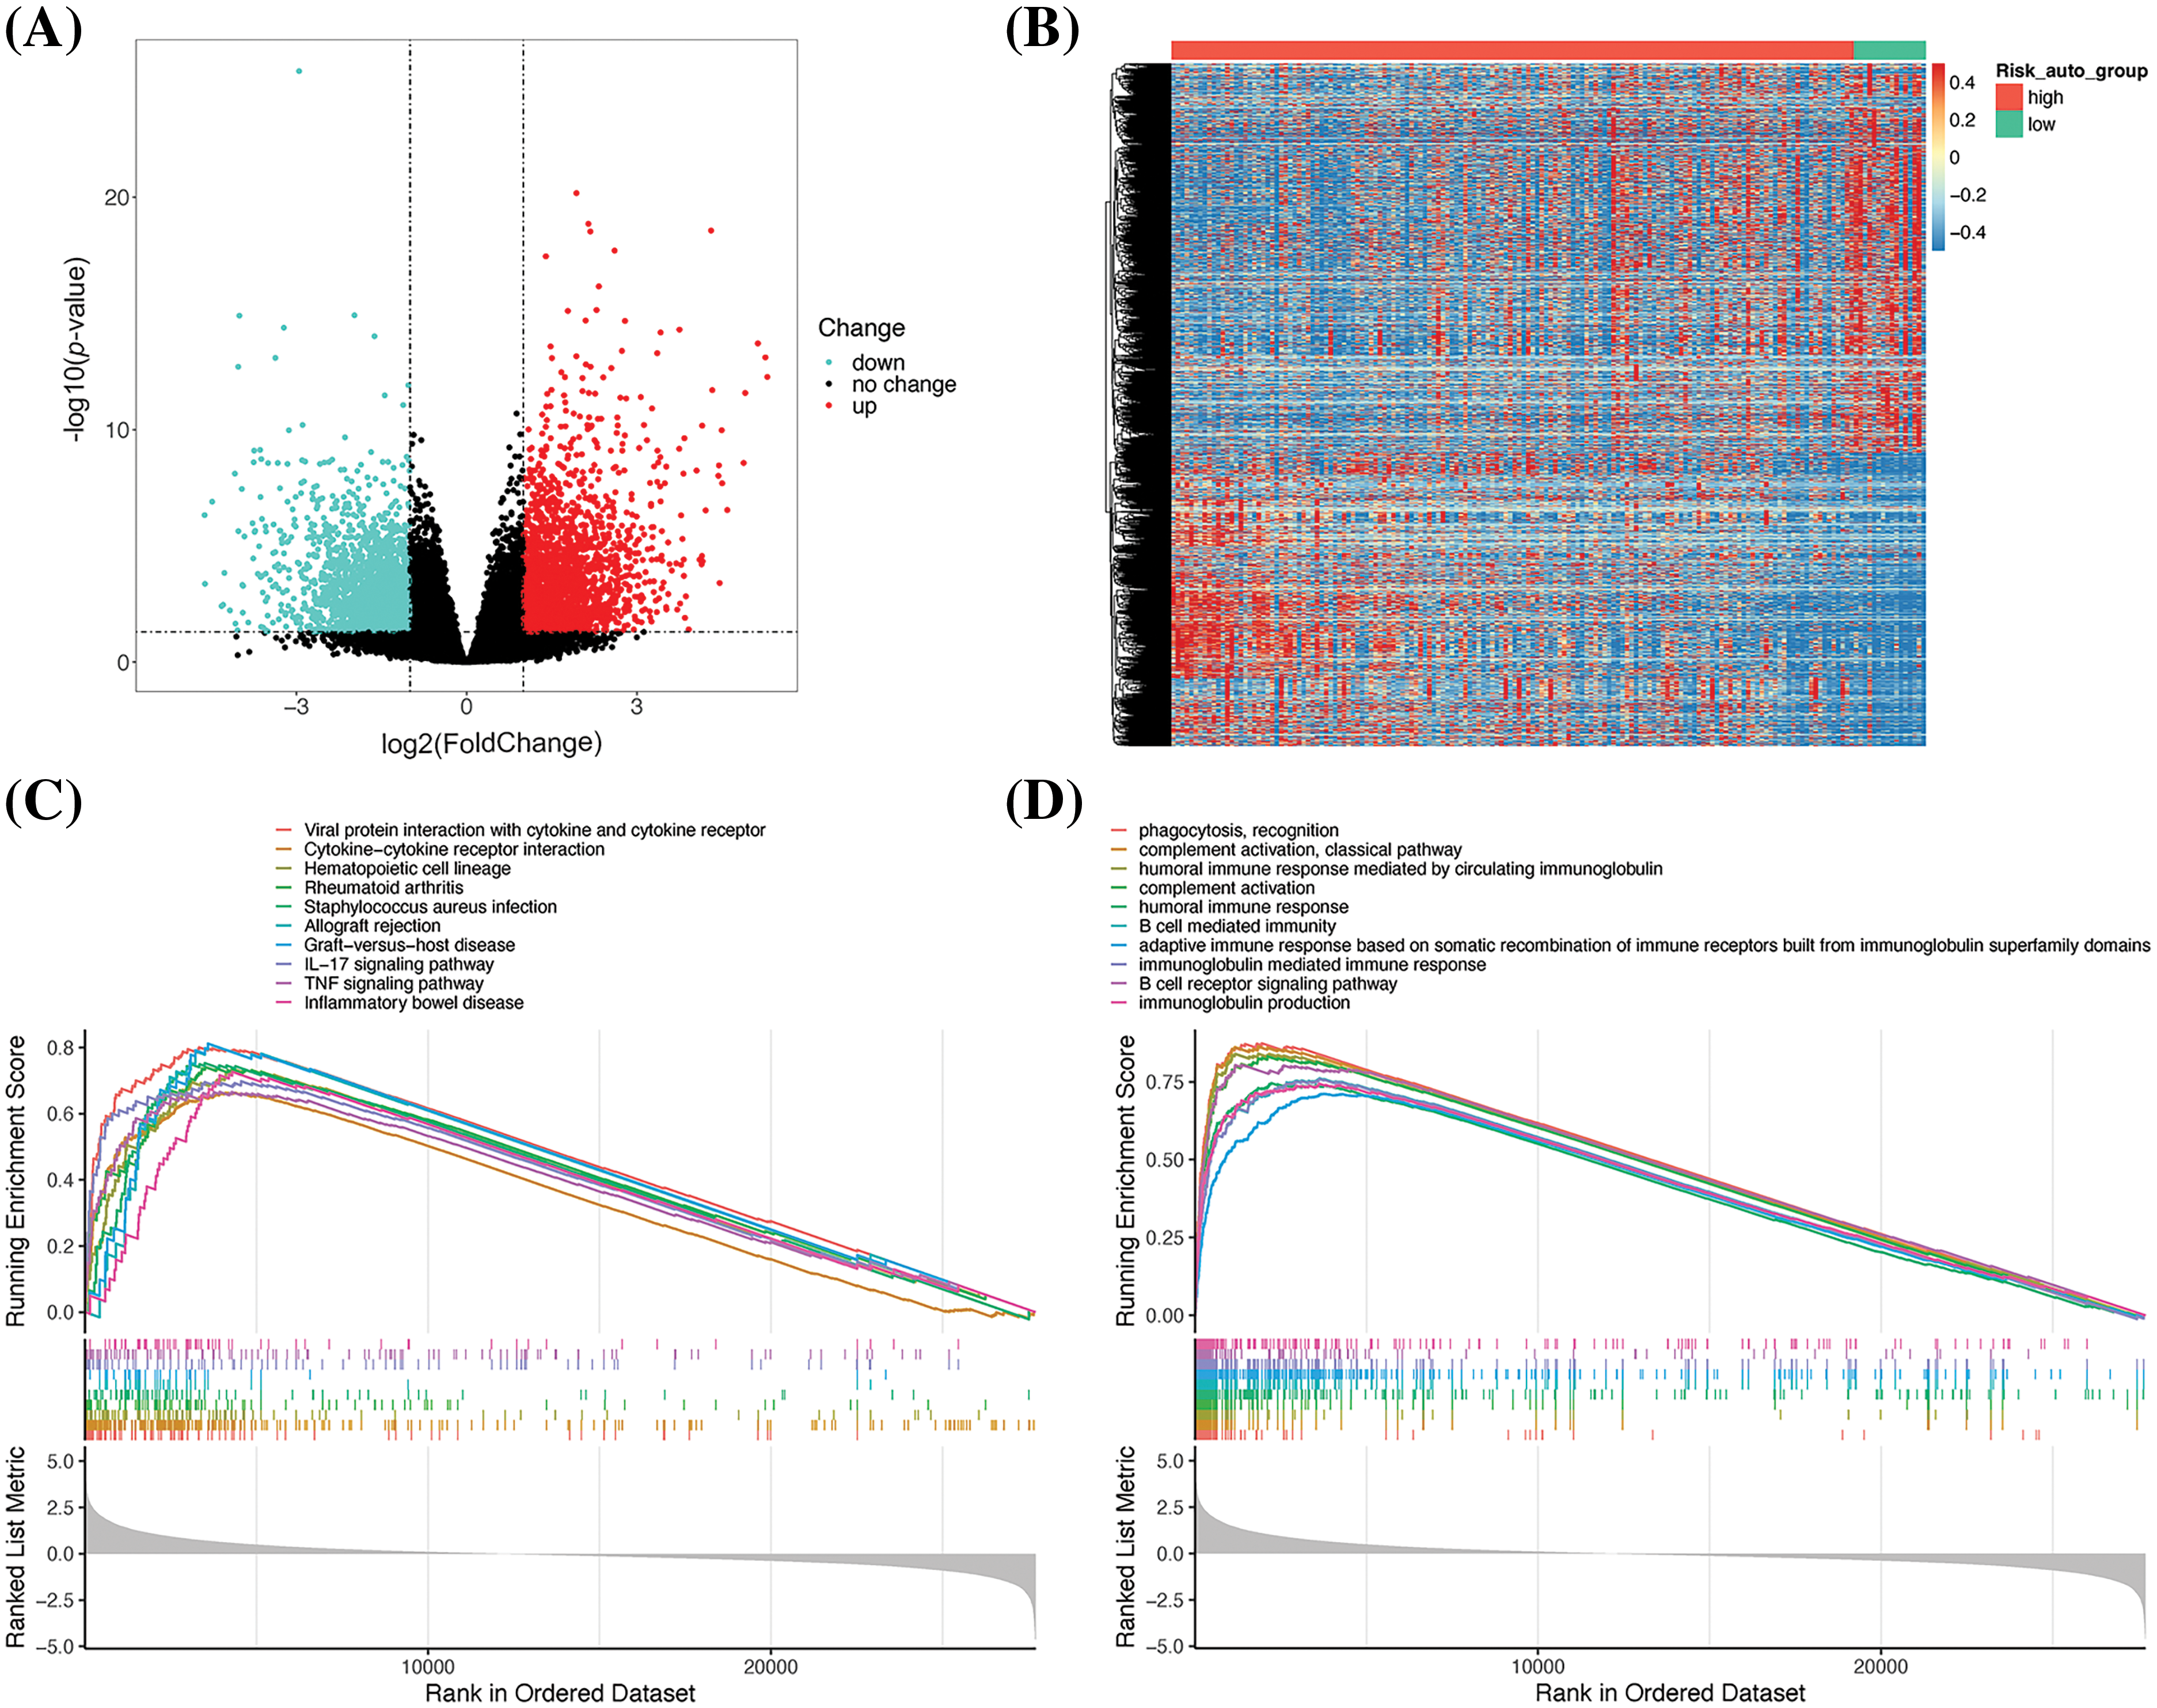
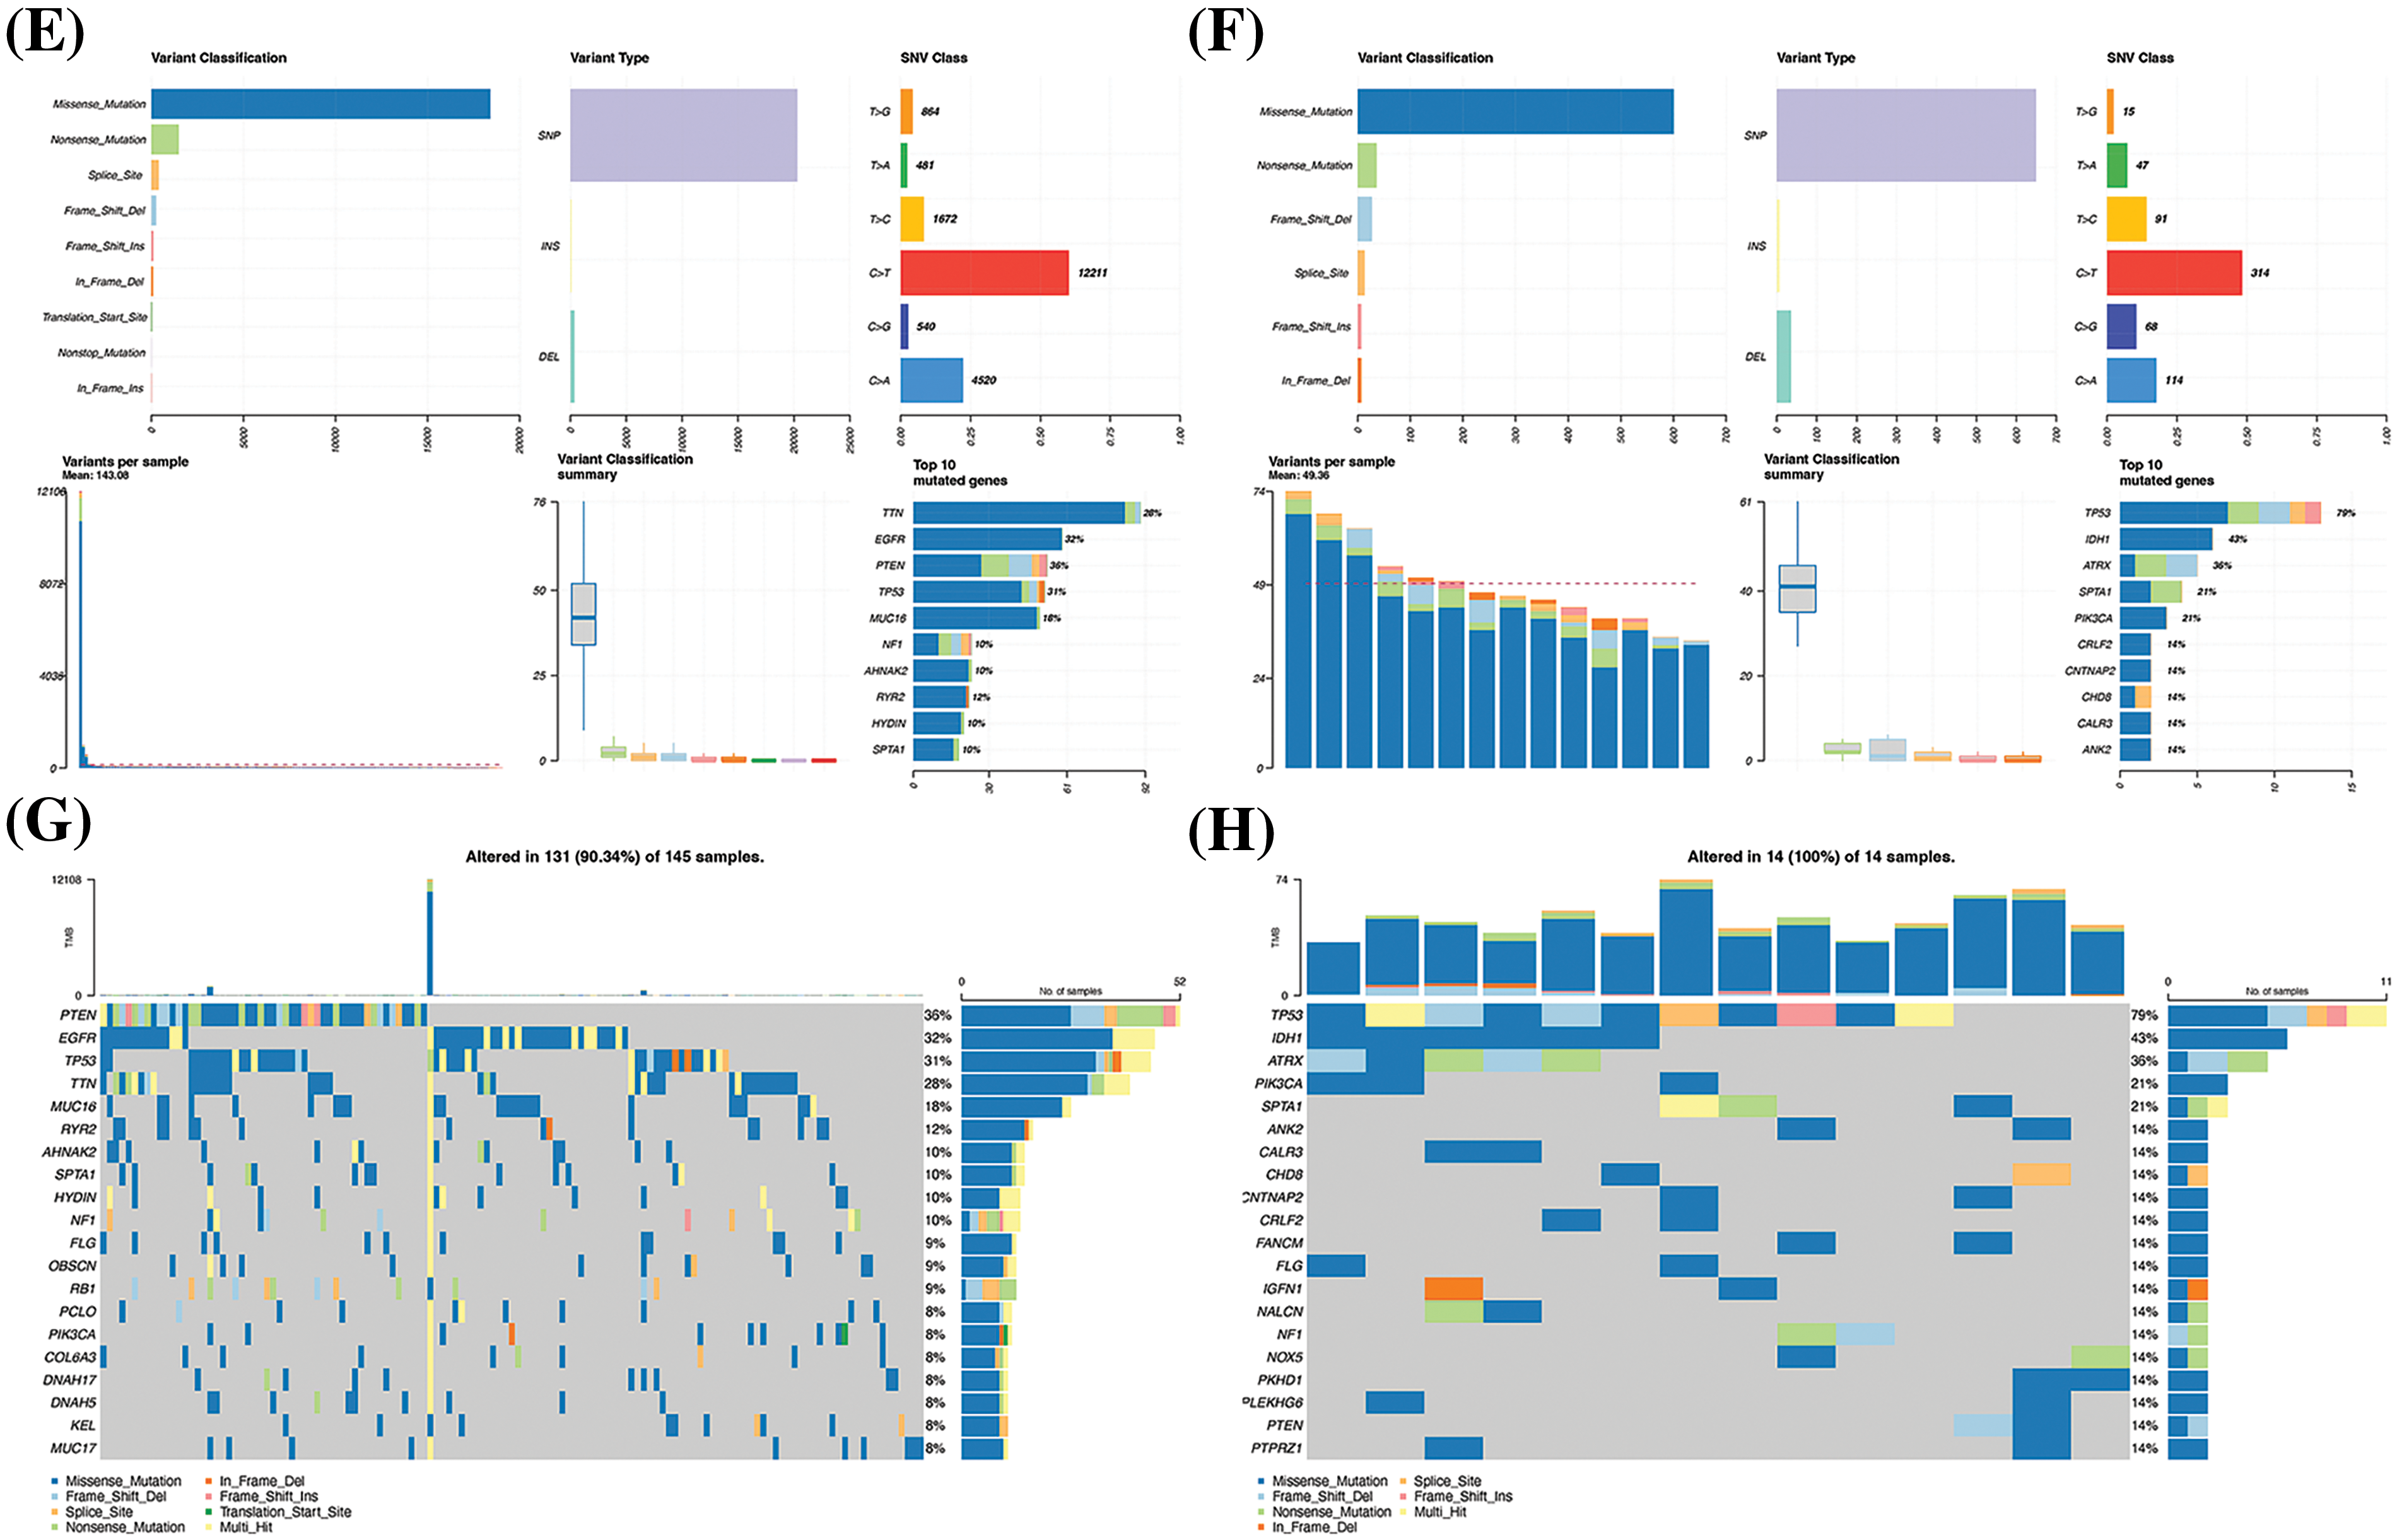
Figure 6: Analysis of the differential gene expression profiles of the high- and low-risk groups. (A) Volcano plot depicting the DEGs. (B) DEG heatmap. (C) Results of KEGG-based GSEA. The gene ranks in the list of DEGs are depicted in the X-axis, where > 0 indicates upregulated genes and < 0 denotes downregulated genes. The upper Y-axis represents the enrichment score and the lower Y-axis denotes the log2|FC| values. The ten most significantly enriched DEGs are depicted in the figure. (D) Results of GO-based GSEA. Summary of gene mutations in (E) and (F). Waterfall map depicting the gene mutations in (G) and (H).
Genomic analysis of genetic mutations in the high- and low-risk groups revealed an average of 143.08 mutations in the high-risk group, much more than the 49.36 in the low-risk group. The five genes with the highest mutation frequency in the high-risk group were titin (TTN), EGFR, phosphatase, and tensin homolog deleted on chromosome ten (PTEN), tumor protein 53 (TP53), and mucin-16 (MUC16) (Fig. 6E), while the top five in the low-risk group were TP53, isocitrate dehydrogenase 1 (IDH1), alpha-thalassemia mental retardation syndrome X (ATRX), spectrin alpha (SPTA1), and PIK3CA (P110α) (Fig. 6F). As depicted in the waterfall diagram (Fig. 6G), the five genes with the highest number of mutations in the high-risk group were PTEN, EGFR, TP53, TTN, and MUC16, while the five genes with the highest number of mutations in the low-risk group followed the same sequence as the mutation frequency (Fig. 6H).
Based on these results, we speculated that the differences in immune function might be responsible for the variations in patient prognosis between the groups, while the differences in immune function could be attributed to the differences in the mutation status of key genes.
Validation and analysis of the prognostic model at the single-cell level
The scRNA-seq method is used to quantify gene expression profiles of specific cell populations at the cellular level for analyzing the heterogeneity in the gene expression of individual cells. The present study aimed to certify the prognostic model and explore the reasons underlying its predictive role.
The GSE84465 GBM scRNA-seq dataset retrieved from the GEO database was selected for evaluating the prognostic model, and a total of 3542 cells were included after quality control. After screening the highly variable genes, a total of 2000 highly variable genes were screened from 23460 genes for downstream analysis using default parameters. Gene features extraction was subsequently performed, and the optimal number of principal components was evaluated using the JackStraw and Elbow methods. The p-values of the 37 principal components were determined to be less than 0.05 in the JackStraw analysis (Fig. 7A). As the thirteenth principal component was situated at the inflection point in the Elbow diagram (Fig. 7B), the first 13 principal components were chosen for downstream analysis. The batch effects were corrected using the Harmony method to improve the robustness of the identification of cell subpopulations. The results demonstrated that the principal components were tightly fused among individual patients, after adjusting for the batch effects (Fig. 7C). A total of 15 cell subpopulations were identified using the Louvain clustering method. Cell type annotations were assigned for all the cell subpopulations based on known cell type labels (Fig. 7D). The mapping of cell type labels into the dimensionality reduction space revealed that cells of the same type were closely related, indicating a good clustering effect (Fig. 7E). Analysis of differential gene expression in the cells based on cell subpopulation tags revealed that the significant DEGs were well conserved across the cell types (Fig. 7F). For instance, the gene encoding EGFR was significantly upregulated in tumor cells but its expression was extremely low in immune cells, which also reflected the accuracy and reliability of the method used for clustering the cell subsets and annotating the cell types.
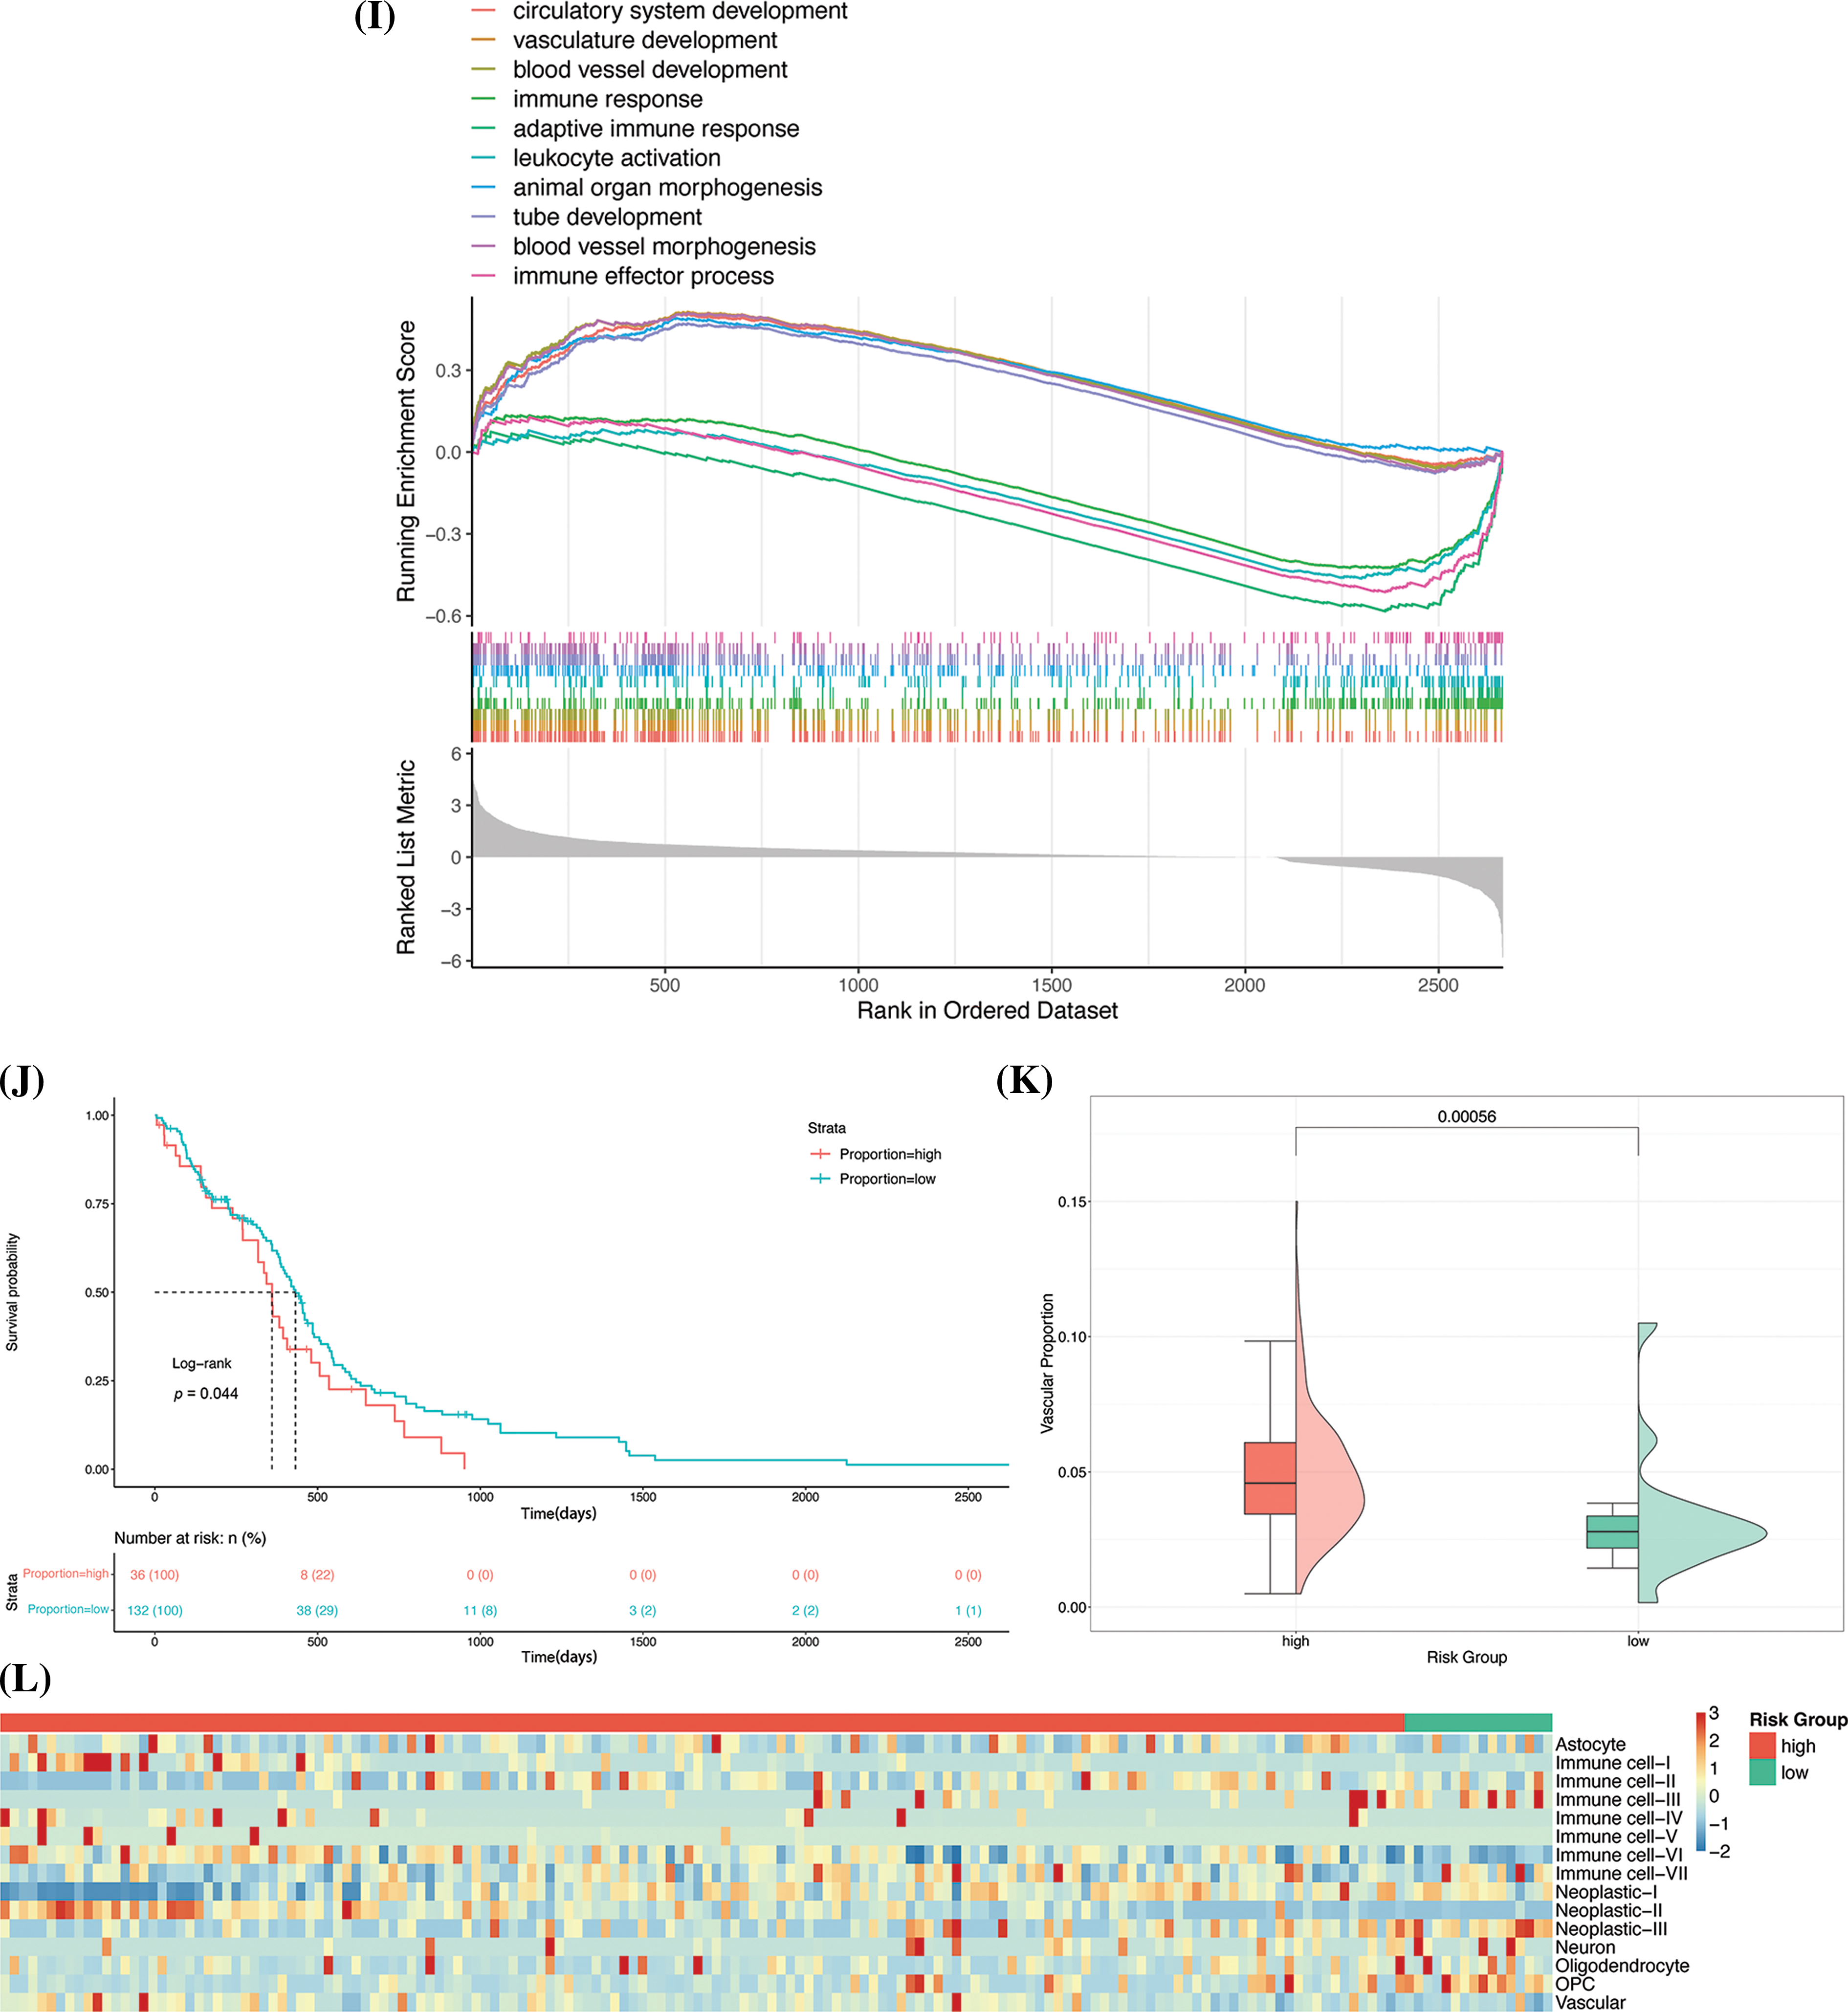
Figure 7: Identification of cellular subsets. (A) Results of analysis with the JackStraw method. The best principal component was selected based on the p-value. (B) Result of analysis with the Elbow method. The best principal components are generally situated at the inflection point. (C) PCA diagram after batch correction. (D) Results of annotation of cell subpopulations. (E) UMAP-based mapping using known cell labels. (F) Heatmap of DEGs in each subgroup. The five most significantly enriched terms are shown for each subgroup. (G) Visualization of risk scores using UMAP. (H) Box diagram of risk scoring. (I) Results of analysis with GSEA. The 10 most significantly enriched terms are depicted in the figure. (J) Survival curve of the two groups. (K) The proportion of vascular cell subsets in the original risk group. (L) Heatmap depicting the proportion of cell subpopulations.
The prognostic model thus constructed was used to assign risk scores to the cell subpopulations for identifying the high-risk cell subpopulations. The results of dimensionality reduction with UMAP revealed that there were considerable differences in the risk scores of the cell subpopulations (Fig. 7G). The high-risk features were primarily observed in immune cells, tumor cells, and vascular cells. Of all the cell subpopulations, the vascular cells had a significantly high-risk score (p < 2.2e-16, Kruskal-Wallis test; Fig. 7H).
In order to determine the differences in the biological functions of the cell subsets in blood vessels and the other cell subsets, the DEGs in the blood vessel cell subsets were subjected to GO-based GSEA. The results approved that the DEGs were significantly enriched in 439 terms, corresponding to 139 upregulated and 300 downregulated genes, respectively. Six of the 10 most significantly enriched terms corresponded to upregulated DEGs, and included circulatory system development, vasculature development, blood vessel development, animal organ morphogenesis, tube development, and blood vessel morphogenesis terms. Four of the 10 most enriched terms corresponded to downregulated DEGs and included the immune response, adaptive immune response, leukocyte activation, and immune effector process terms (Fig. 7I). The results demonstrated that the process of vascular development in the vascular cell subsets was significantly upregulated, while the processes of immune response and activation were significantly inhibited. Previous studies have shown that tumor cells secrete high levels of pro-angiogenic factors, resulting in abnormal vascular networks characterized by immaturity, high permeability, and poor oxygen supply. These characteristics are more conducive to the invasion and metastasis of tumor cells, can also hinder the antitumor effect of immune cells, and have been shown to even affect the distribution of chemotherapy drugs, resulting in drug resistance [14]. The results are consistent with the observations of previous studies and indicate that vascular ecology in GBM could be a risk factor for the poor prognosis of GBM.
From a theoretical standpoint, a higher proportion of high-risk cell subsets tends to lead to a poorer prognosis. The CIBERSORT deconvolution algorithm was first utilized to evaluate the composition of the cell subpopulations in GBM samples retrieved from TCGA. The samples were categorized into high- and low-proportion groups based on the proportion of subpopulations of vascular cells. Survival analysis and analysis of the KM survival curve revealed a notable difference in the prognosis of the two groups (Fig. 7J), and the group with a high proportion of high-risk cell subsets showed poor prognosis. The effect of the vascular cell subsets on patient prognosis was re-evaluated by examining the proportion of vascular cell subsets in the original risk groups. Analysis of the original risk groups revealed that the content of vascular cell subsets in the high-risk group was great higher (Fig. 7K), indicating that the proportion of vascular cell subsets can affect the prognosis of GBM. The effect of the proportion of other cell subsets on the prognosis of patients with GBM was analyzed using heatmaps, and the results demonstrated that the other cell subsets, including neoplastic-II and immune cell-I, had higher risk scores and were present in higher proportions in the high-risk group (Fig. 7L). The results of model verification revealed that the model thus constructed for predicting patient prognosis achieved good accuracy at the single-cell level.
TMEM159 is highly expressed in GBM and negatively correlates with prognosis
EGFR is a multifunctional glycoprotein that is widely distributed on the cell membrane of human tissues. It is important in cellular physiology, including cell proliferation and anti-apoptosis [15]. Previous works have demonstrated that EGFR is highly or abnormally expressed in numerous solid tumors, including GBM. The functions of EGFR are related to the proliferation, invasion, and metastasis of tumor cells and the inhibition of cellular apoptosis [16].
The results of bioinformatics analyses and analysis with the prognostic model constructed in this study demonstrated that EGFR was abnormally expressed in the high-risk group, and exhibited abnormal mutations and high expression levels (Figs. 6E,G, 7F). The findings indicated that the prognostic model effectively predicts the risk level for patients with GBM. It also suggests that the relevant genes identified by the prognostic model may be a key point in promoting the development of GBM.
As the EGFR gene is fundamental in the regulation of GBM, we employed immunoprecipitation-MS (IP/MS) to identify the proteins that can bind to EGFR in GBM tissues. The results showed that EGFR can bind to a series of proteins in GBM tissues (Fig. 8A), of which the TRIP13 protein identified using IP/MS in this study is a known EGFR-binding protein, and this finding indicated the reliability of the results obtained by MS [5]. It is worth noting that among the proteins identified herein, the TMEM159 encoded gene was also proved as a key gene by the prognostic model constructed in this study, suggesting that TMEM159 is likely involved in the development of GBM.
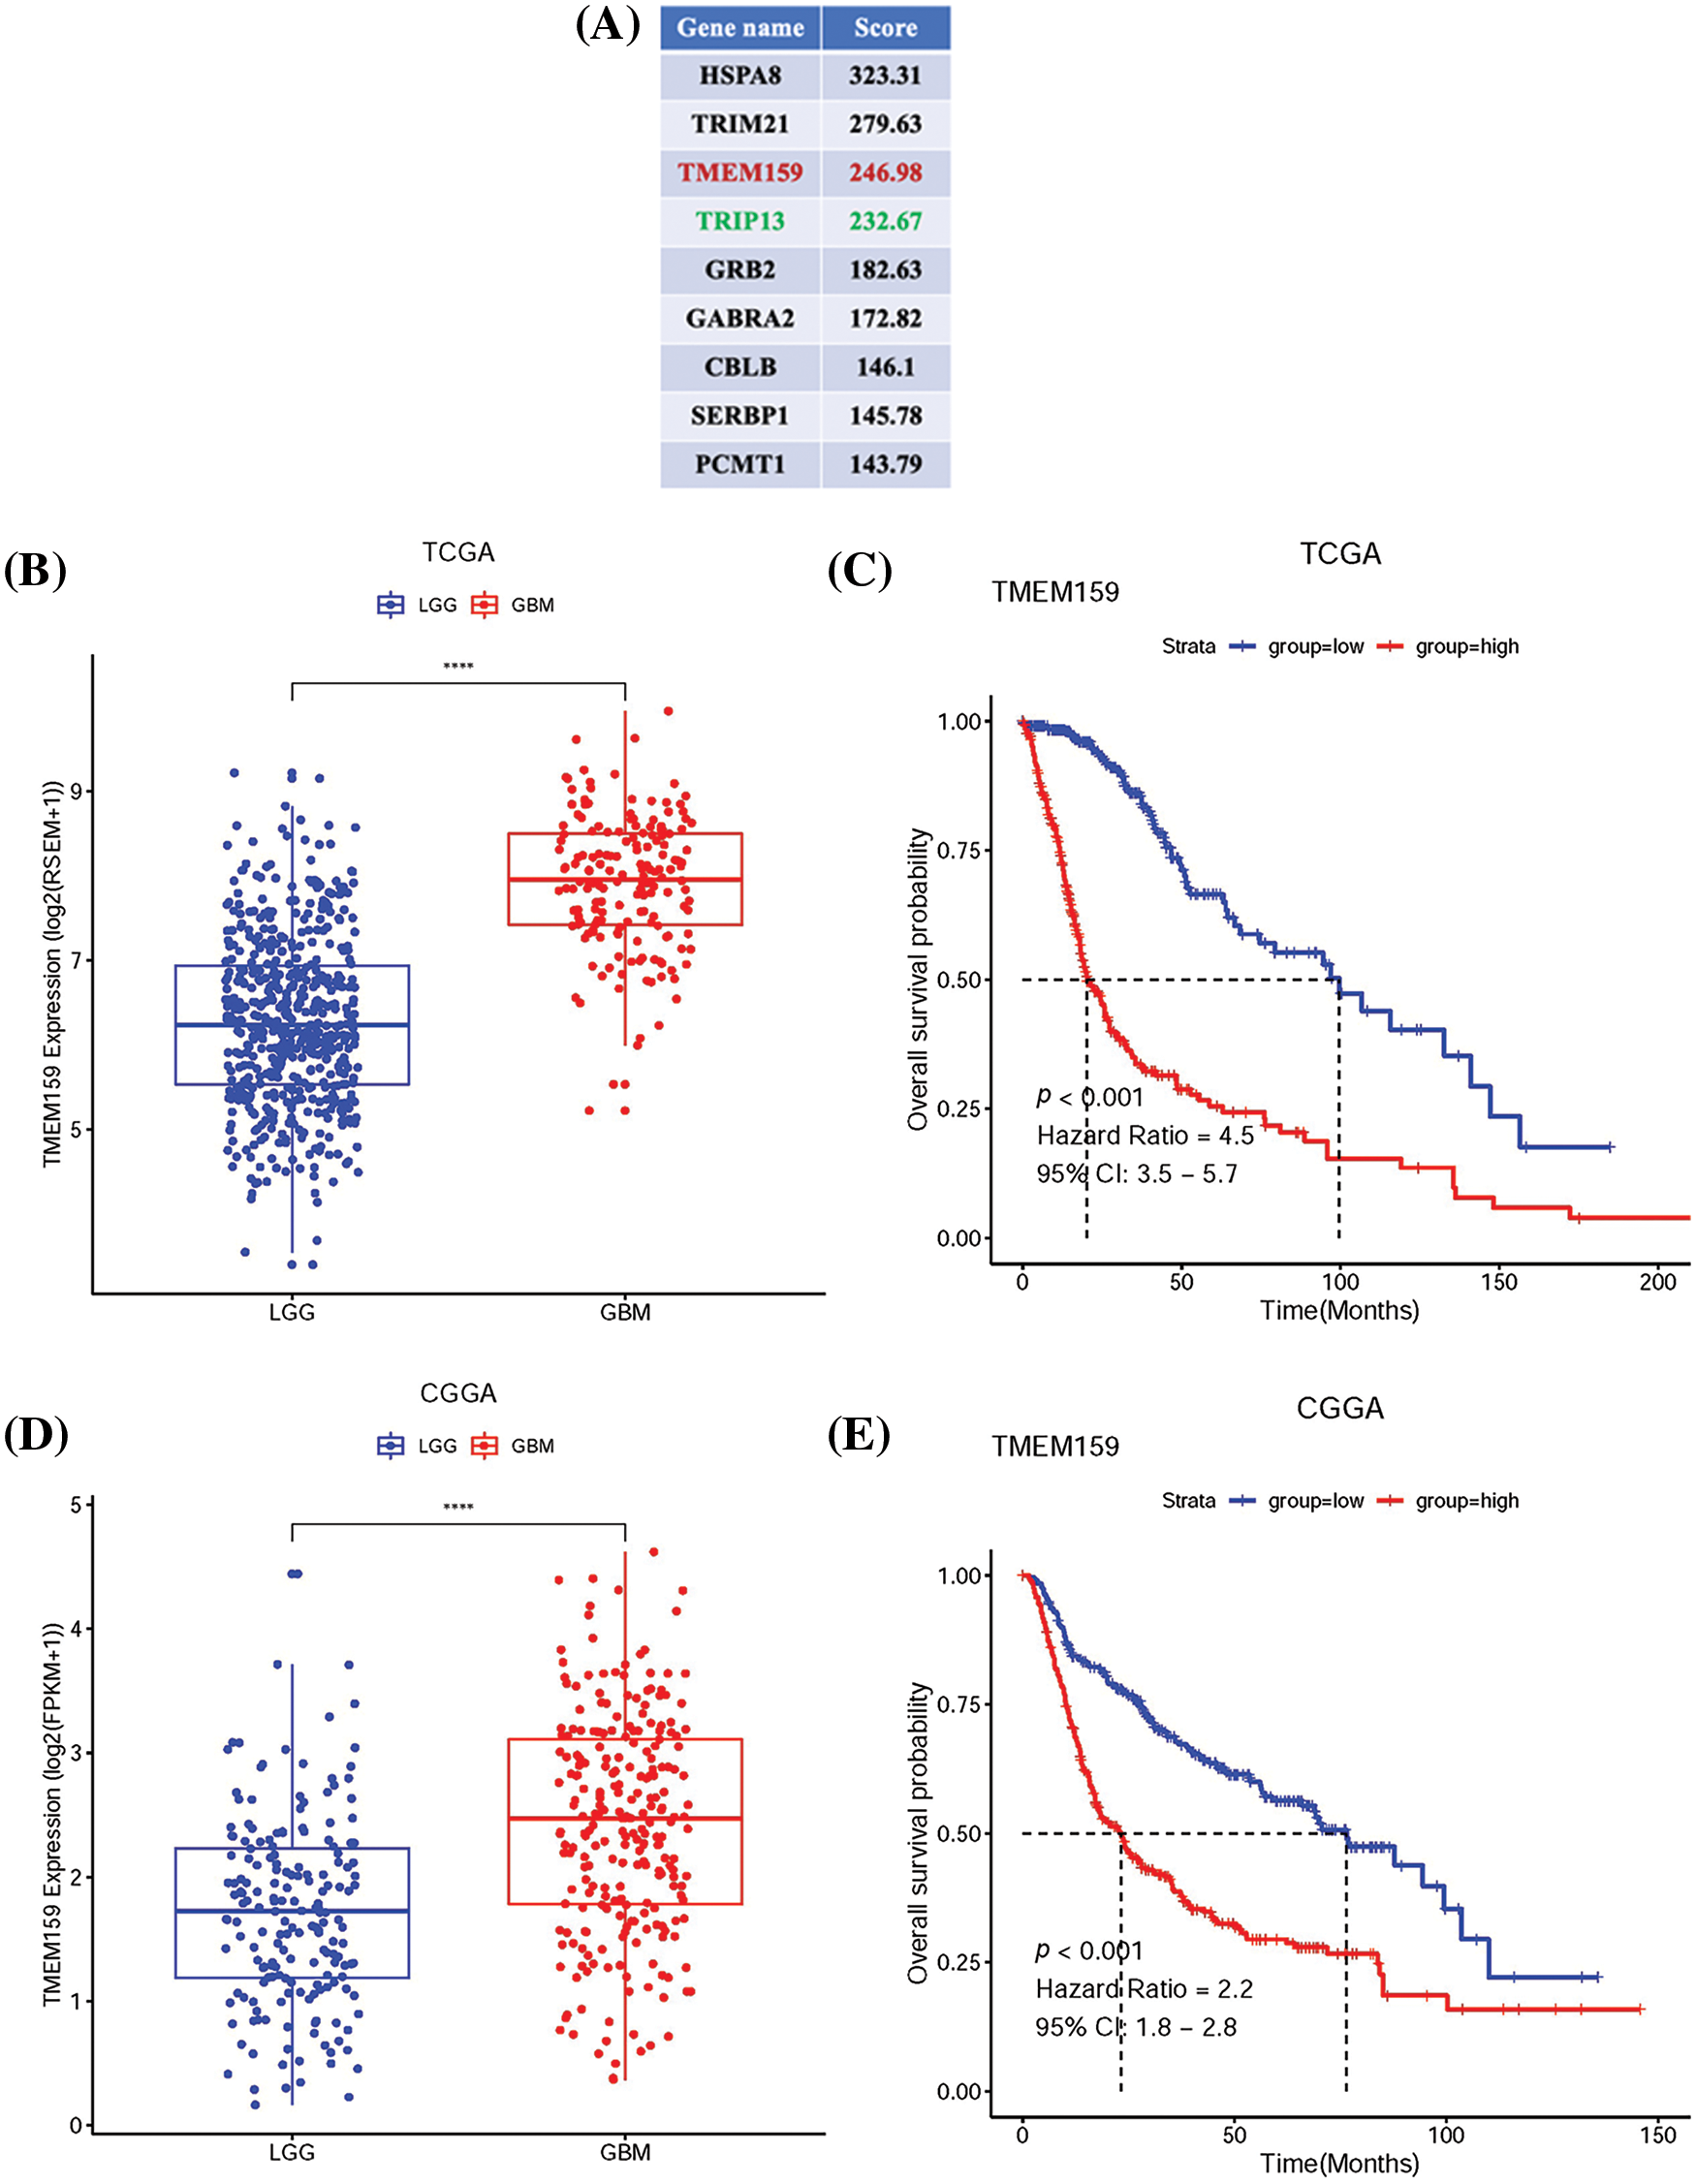
Figure 8: TMEM159 is highly expressed in GBM and its expression was negatively correlated with patient prognosis. (A) Partial list of proteins that bind to EGFR in GBM tissues as identified by IP-MS. (B) Data retrieved from the TCGA demonstrate that the expression of TMEM159 in GBM was significantly higher. (C) Survival curve of TMEM159 expression groups in TCGA. (D) Data retrieved from the CGGA demonstrate that the expression of TMEM159 in GBM was significantly higher. (E) Survival curve of TMEM159 expression groups in CGGA. (F) Results of western blotting demonstrated that the expression of TMEM159 in HGG tissues was higher than that of LGG. (G) Images of immunohistochemistry analyses retrieved from the HPA database reveal that the expression of TMEM159 in HGG tissues was higher; *p < 0.05, **p < 0.01, and ****p < 0.0001.
TMEM159, also known as LDAF1, is an ER protein that can form oligomers with seipin in the ER bilayer membrane. The LDAF1-seipin complex regulates the site of LD synthesis in the ER through phase separation. A previous study reported that the levels of lipids can affect the development of GBM, and observed that cholesterol esterification and the formation of LDs are biomarkers of GBM. Meanwhile, high levels of LDs in patients with GBM are associated with the progression of GBM and the low survival rates of patients with GBM [17,18]. Although there are no studies on the function of TMEM159 in the development of GBM, TMEM159 is involved in the formation of LDs, and it was predicted to interact with EGFR. The findings revealed that the TMEM159 protein may an instrumental role in the development of GBM.
In this study, RNAseq data for low-grade gliomas (LGGs) and GBM were obtained from the TCGA and Chinese Glioma Genome Atlas (CGGA) databases. The results demonstrated that TMEM159 in GBM tissues was increasingly expressed (Fig. 8B,D). The results of the survival curve analysis showed that the expression of TMEM159 was negatively connected with patient prognosis. The overall survival of GBM patients with high TMEM159 expression was significantly lower than that of those with low TMEM159 expression (Fig. 8C,E). To validate the bioinformatics analysis results, TMEM159 expression was examined in normal brain tissues, LGG tissues, and high-grade glioma (HGG) tissues using western blotting. Immunohistochemistry images were also retrieved from the Human Protein Atlas (HPA) database. The findings demonstrated that TMEM159 expression in HGG tissues was markedly higher than in LGG and normal brain tissues (Fig. 8F,G).
TMEM159 promotes the development of GBM
To determine the effect of TMEM159 on GBM, we constructed a cell line with low TMEM159 expression by plasmid transfection and examined the impact of TMEM159 on GBM proliferation and invasion using clone formation and transwell assays. Three GBM cell lines, namely, GBM1492, T98G, and LN229 were selected as transfection targets, and the results found that the expression of TMEM159 was reduced in GBM1492 cells following transfection (Fig. 9A–C). Therefore, the GBM1492 cells were selected for the subsequent research. The results demonstrated that the ability of clone formation and invasion of GBM cells reduced significantly following a reduction in the expression of TMEM159, suggesting that TMEM159 can affect the proliferation and invasion of GBM cells (Fig. 9D,E).
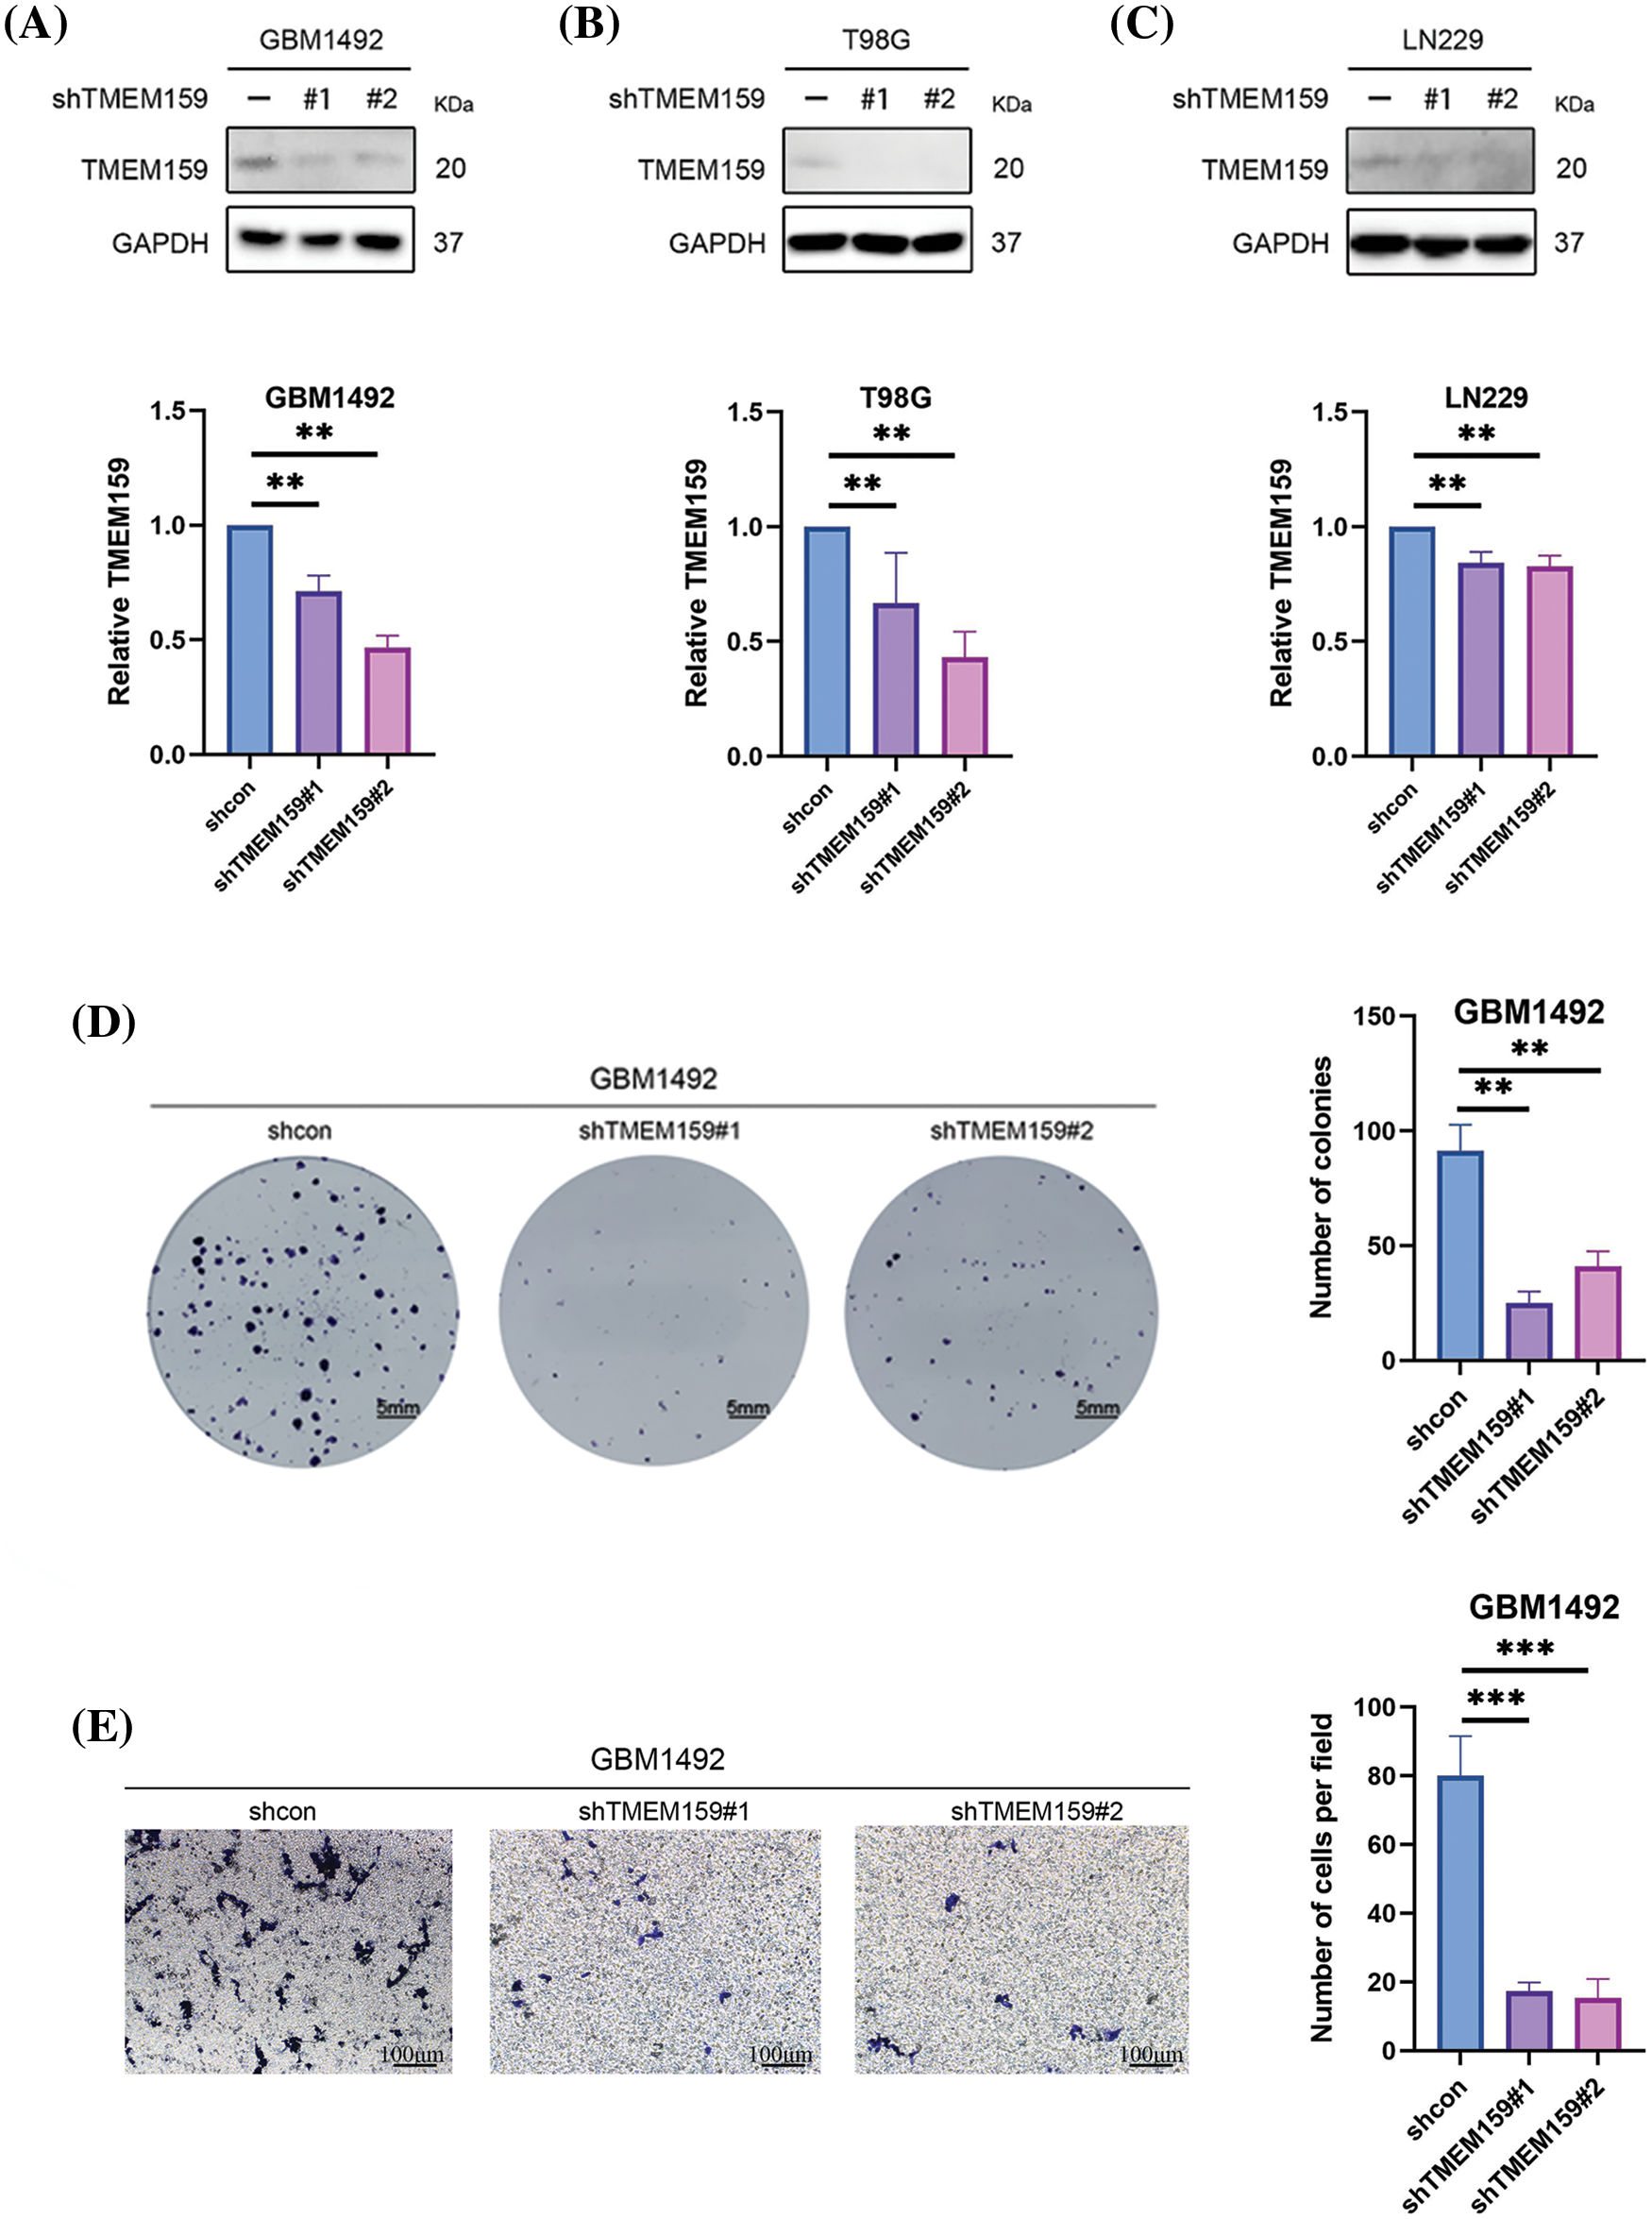
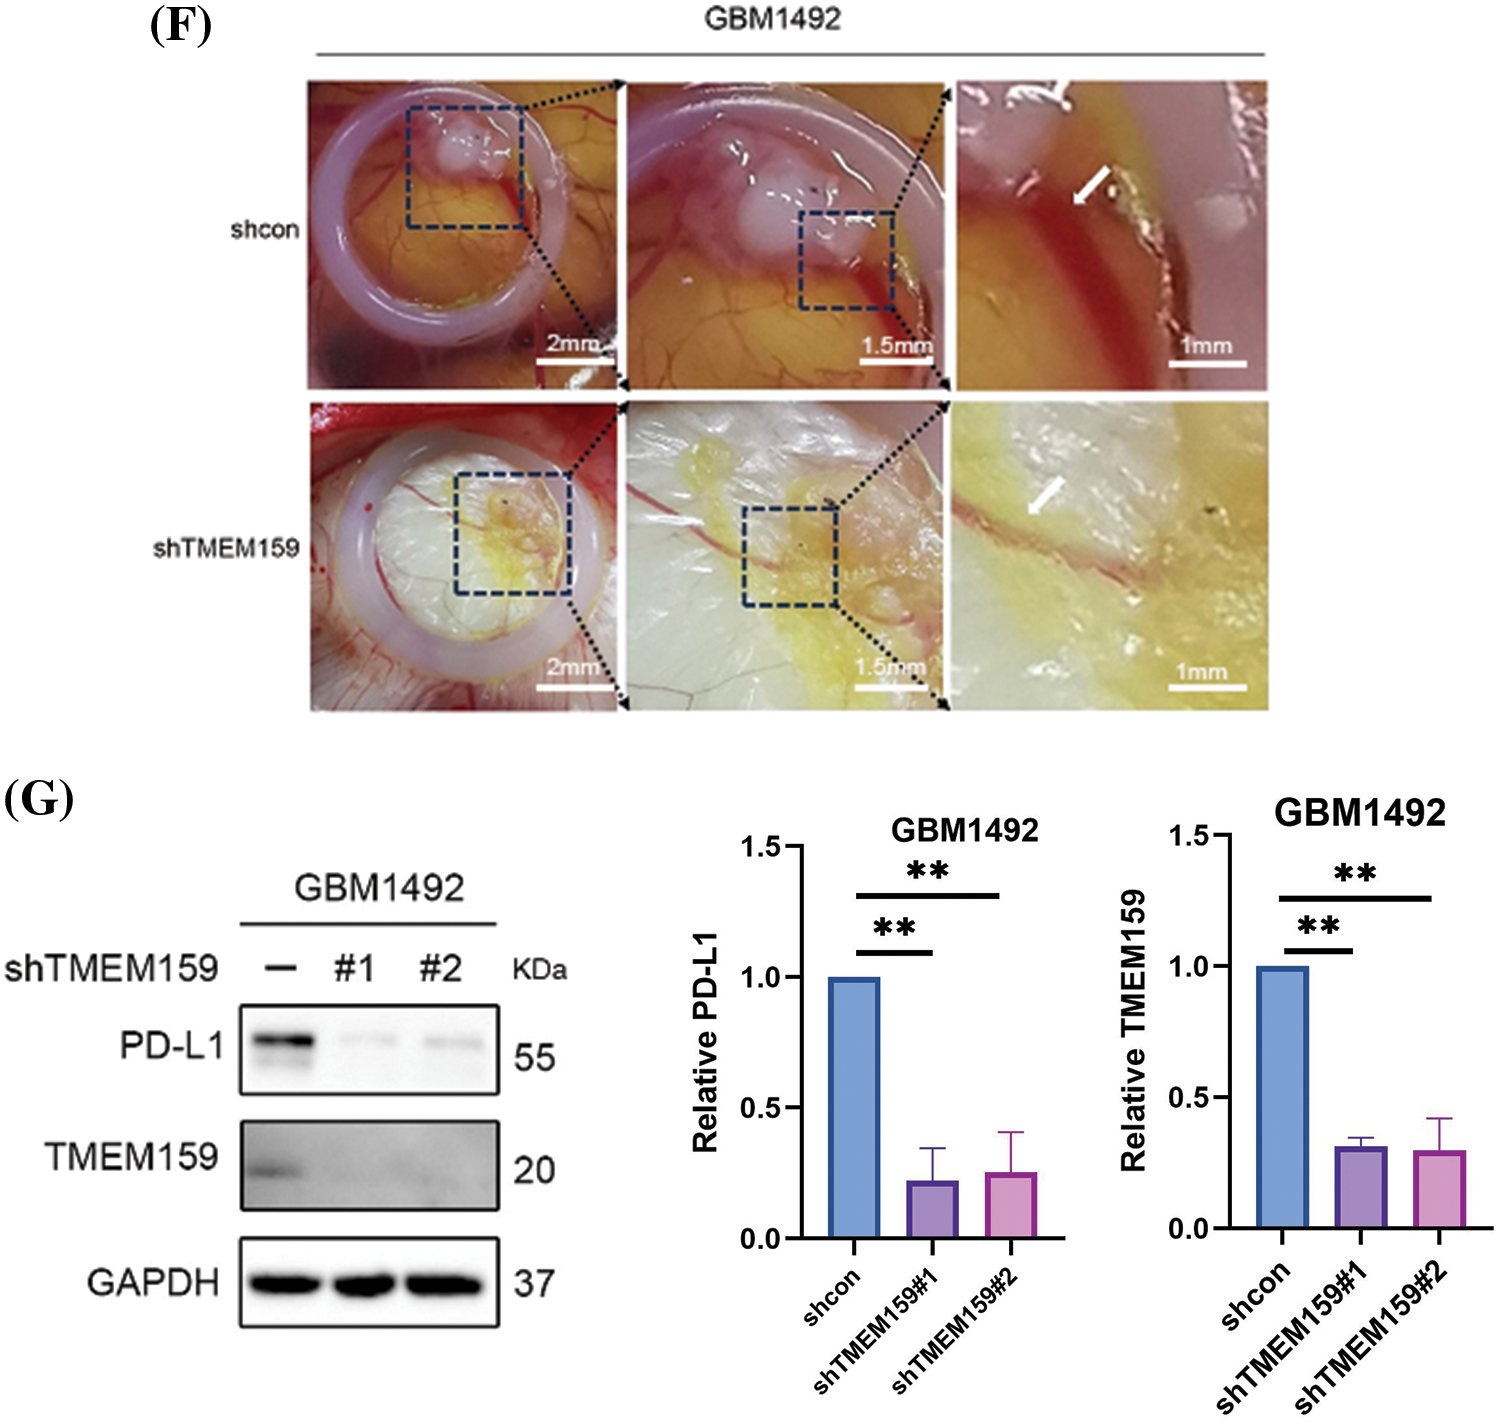
Figure 9: TMEM159 affected the proliferation, invasion, and angiogenesis of the GBM1492 cell line. (A–C) Effects of plasmid transfection on the downregulation of TMEM159. The results demonstrated that the effect of transfection was most significant in the GBM1492 cell line. (D) Clone formation assay showed that the ability of clone formation reduced significantly following a reduction in the expression of TMEM159 in GBM cells. (E) Transwell assay presented that the invasion ability of GBM cells reduced significantly after a decrease in the expression of TMEM159. (F) The effect of TMEM159 on angiogenesis was analyzed using a chick embryo CAM model (n = 4 eggs per group). The results demonstrated that the inhibition of TMEM159 expression reduced angiogenesis in the model of chicken embryo CAM. (G) Determination of the effect of TMEM159 on PD-L1 by western blotting. The expression of PD-L1 in GBM decreased after the expression of TMEM159 was inhibited; **p < 0.01 and ***p < 0.001.
The continuous division and proliferation of tumor cells require a large amount of oxygen and nutrients. When the size of the solid tumor is small, oxygen and nutrients can be obtained through diffusion. However, as the tumor grows, new blood vessels need to be formed to obtain nutrients and oxygen. Angiogenesis is, therefore, an important factor in tumor development, invasion, and metastasis. Prediction of the risk characteristics of cell subsets with the prognostic model developed herein revealed that high-risk scores were primarily assigned to the vascular cells (Fig. 7G,H). The TMEM159 gene was one of the key genes identified by the prognostic model, and this gene might affect the angiogenesis of GBM cells. We therefore used a chick embryo CAM model for analyzing the effect of TMEM159 on angiogenesis. The results demonstrated that the inhibition of TMEM159 expression also reduced angiogenesis in chicken embryo CAM, suggesting that TMEM159 can promote angiogenesis (Fig. 9F).
Immune-oncology therapy has emerged as one of the important therapeutic strategies in recent years for advanced malignant tumors [19]. The application of immunotherapy does not directly target cancer cells in tumors, but the activation of the body’s own immune system has good safety and tolerance for fighting tumors. PD-L1 is one of the most crucial immune checkpoint proteins that is greatly expressed by tumor cells in the tumor microenvironment [20]. Additionally, the lymphocytes that infiltrate tumors can express high levels of PD-1 following long-term stimulation with tumor antigens. Both PD-L1 and PD-1 can induce the apoptosis, disability, and depletion of T cells, and subsequently suppress the activation, proliferation, and anti-tumor function of tumor antigen-specific CD8+ T cells, which leads to immune escape in tumors [21]. The results of clustering analysis confirmed that cluster 2 had higher immune characteristics, including high immune infiltration and immune scores, and the expression of PD-L1 and PD-1 in cluster 2 was significantly higher than that of cluster 1 (Fig. 3E). As the TMEM159 gene was identified in the immune-related modules, it may influence the immune microenvironment of tumor cells. The effect of TMEM159 on PD-L1 was analyzed by western blotting. As expected, the expression of PD-L1 in GBM tissues decreased after the expression of TMEM159 was inhibited (Fig. 9G).
Inhibition of TMEM159 enhanced the anti-tumor effect of osimertinib
The results of screening with the prognostic model at both the genomic and single-cell levels revealed abnormalities in the expression of EGFR, including high expression levels and high mutation frequencies, in the high-risk group (Figs. 6E,G, 7F). The results of MS analysis also revealed that TMEM159 could interact with EGFR. We therefore speculated that TMEM159 can affect the expression of EGFR, which can further affect the downstream signaling pathways. We found that TMEM159 could affect the expression of EGFR using western blotting. The inhibition of TMEM159 decreased the expression of EGFR and P-EGFR in the GBM1492 cell line and caused a series of changes in the downstream signaling pathways (Fig. 10A).
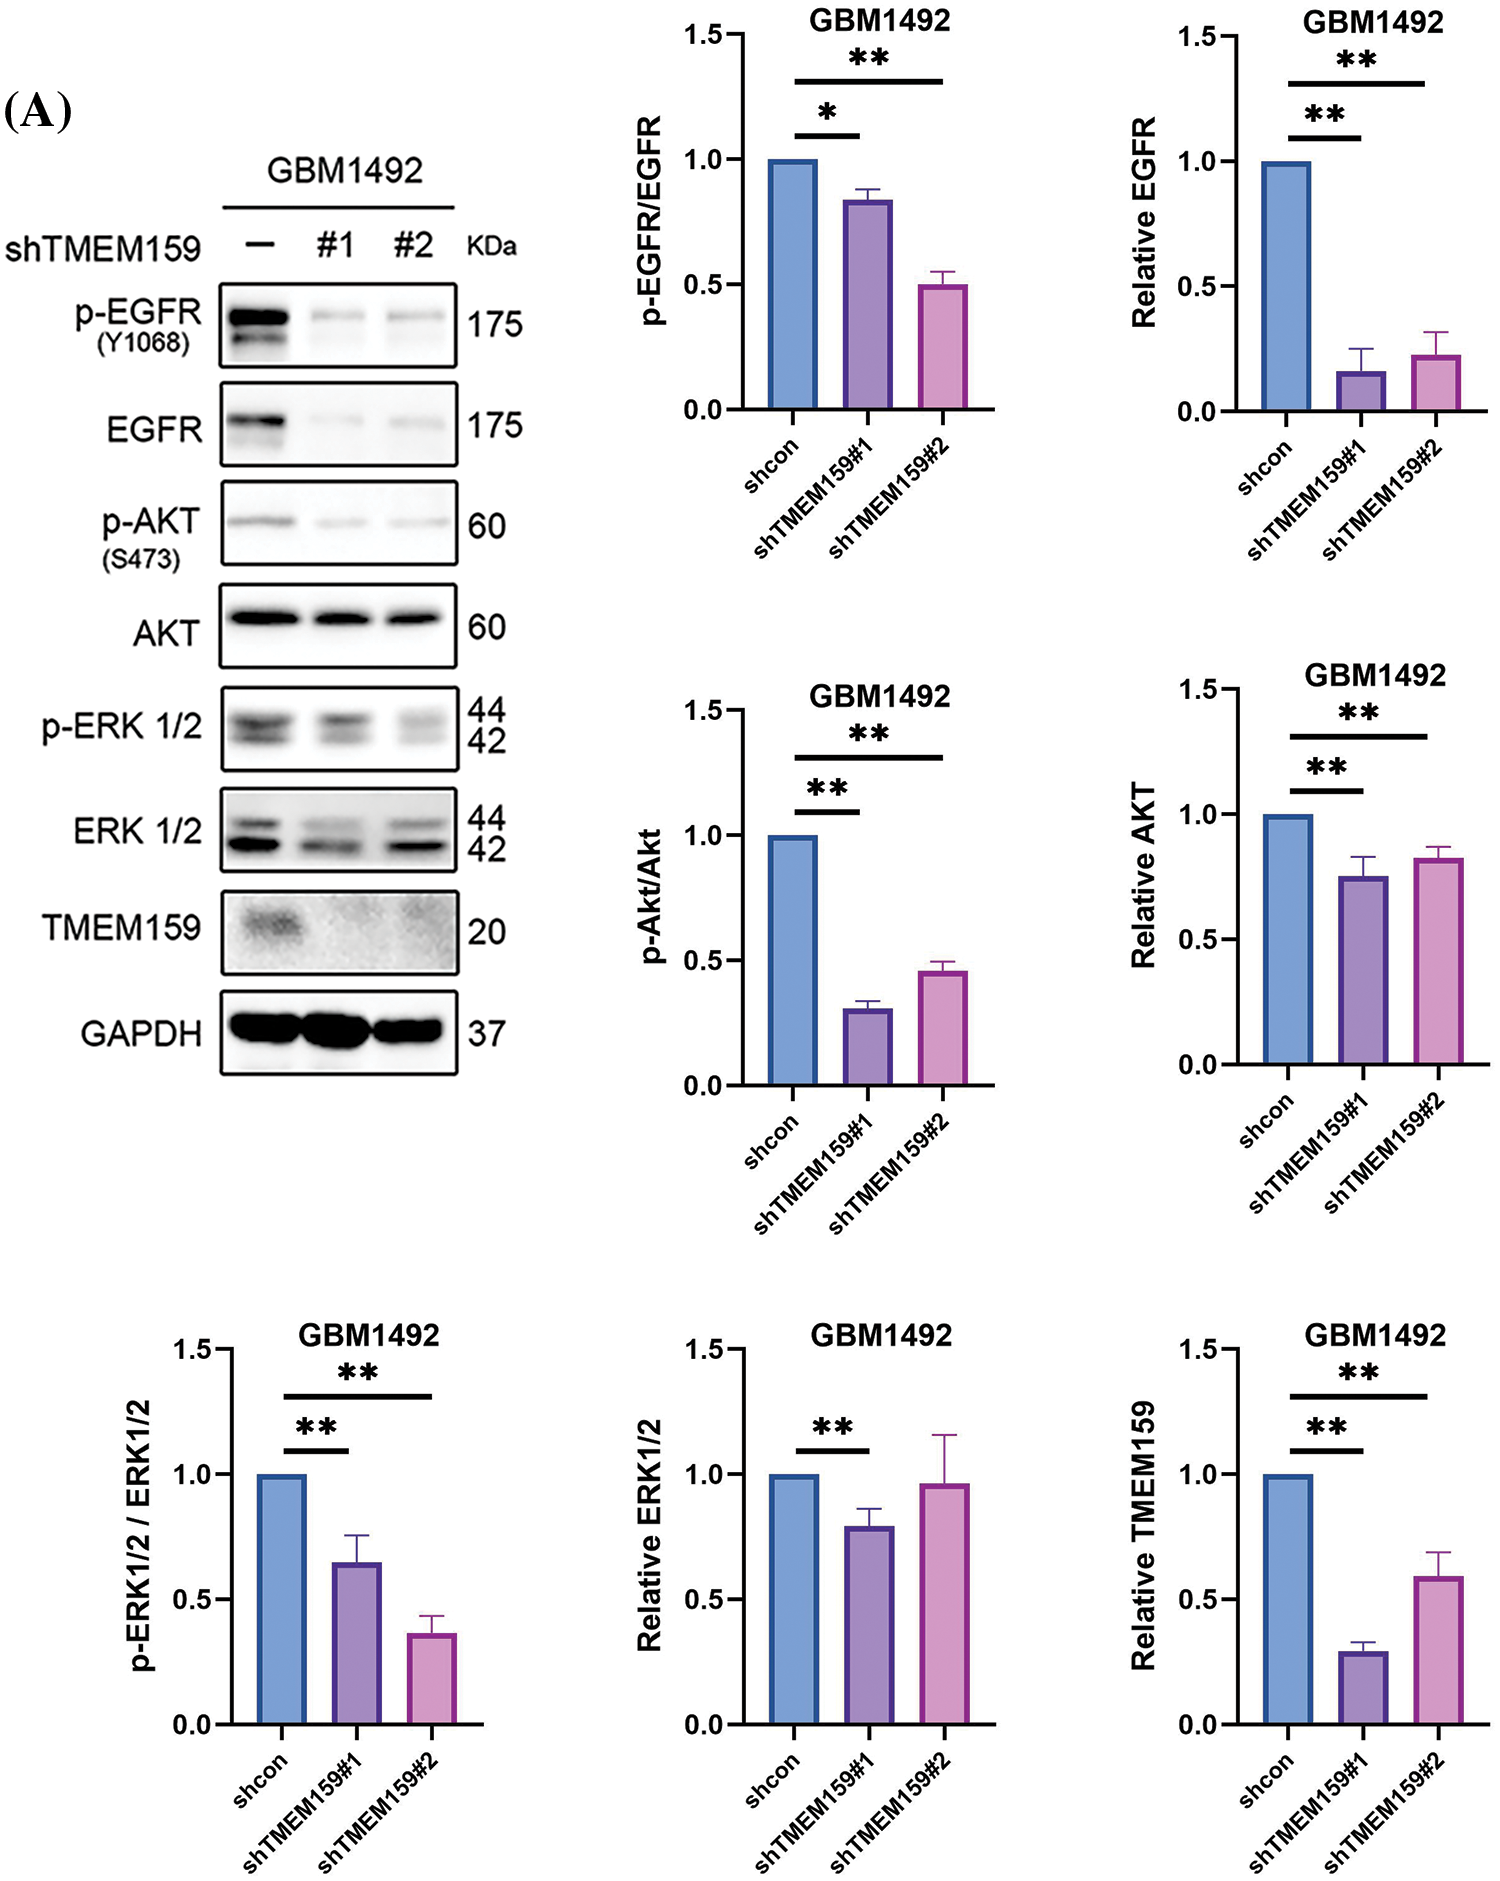
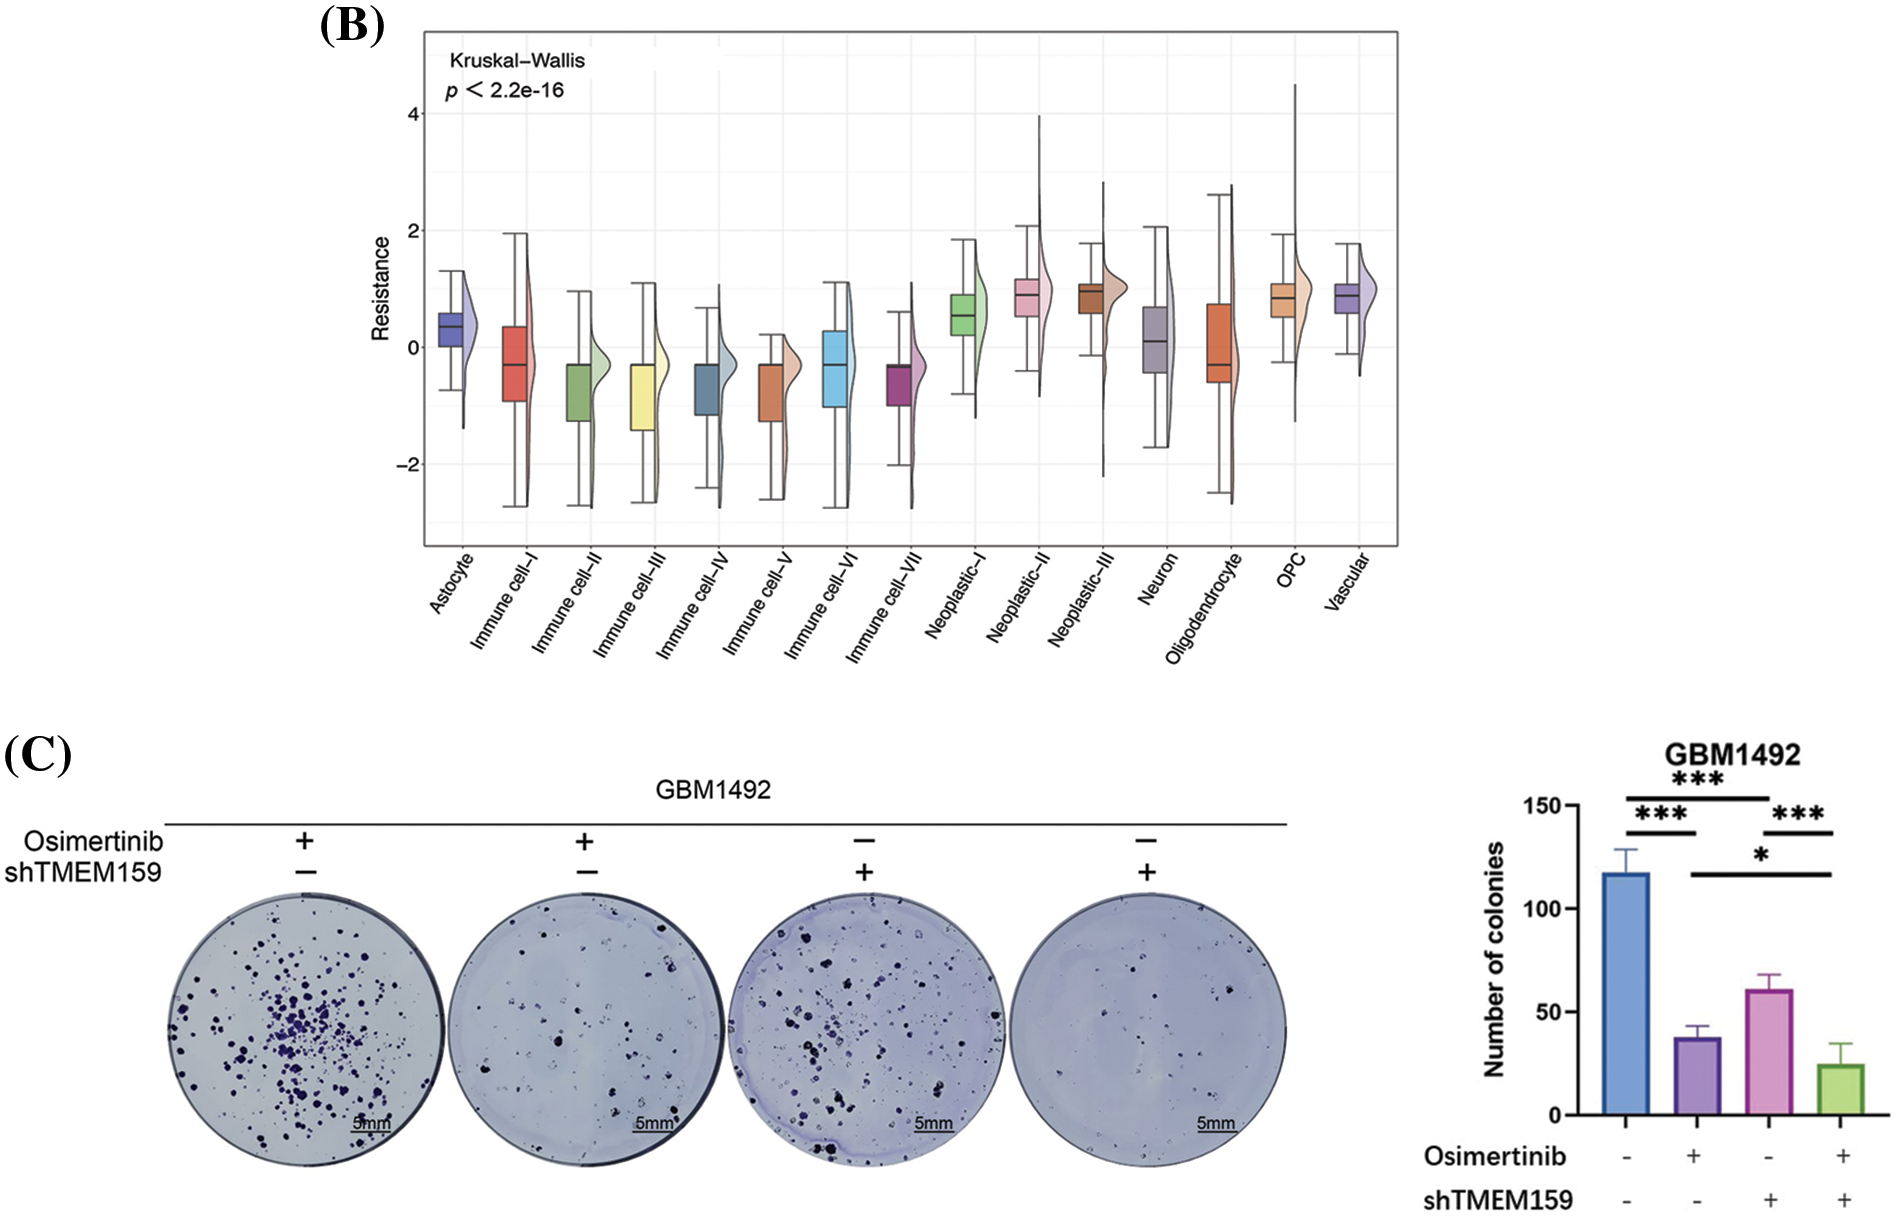
Figure 10: Inhibition of TMEM159 enhanced the anti-tumor effect of osimertinib. (A) Determination of the effect of TMEM159 inhibition on the expression of EGFR and downstream signal proteins by western blotting. (B) Analysis of osimertinib resistance. The X-axis represents the cell subsets and the Y-axis represents the degree of drug resistance. (C) The clone formation experiments demonstrated that the combination of osimertinib and a TMEM159 inhibitor significantly inhibited the proliferation of GBM compared to treatment with osimertinib or a TMEM159 inhibitor alone; *p < 0.05, **p < 0.01, and ***p < 0.001.
The drug resistance of tumors is a serious challenge in the clinical field. Previous studies have demonstrated that EGFR is abnormally expressed in several solid tumors, including GBM. EGFR is associated with the proliferation, angiogenesis, invasion, and metastasis of tumor cells and inhibition of cellular apoptosis. EGFR inhibitors have been used in clinical chemotherapy for a variety of tumors. Osimertinib can cross the blood-brain barrier and has been used in the treatment of GBM [22].
In order to evaluate the resistance of GBM to osimertinib, we first evaluated the resistance of 15 GBM cell subpopulations to osimertinib based on scRNA-seq data. The resistance of all the cell subsets to osimertinib was evaluated using the oncoPredict method according to the drug resistance data gained from the GDSC database and the expression profiles of the GBM cell line. The results demonstrated that among the 15 GBM cell subsets, the vascular cell subset had a higher resistance to osimertinib (Fig. 10B), suggesting that the lethality of osimertinib to the vascular cell subset may decrease in the treatment of GBM, thereby affecting its anti-tumor effect. Our results demonstrated that inhibition of the expression of TMEM159 can reduce angiogenesis, which led us to hypothesize that the inhibition of TMEM159 combined with treatment with osimertinib can enhance the anti-cancer effect, as the inhibition of TMEM159 can compensate for the reduced efficacy of osimertinib in vascular cell subsets to a certain extent. The hypothesis was examined with clone formation experiments. The results demonstrated that treatment with a combination of osimertinib and TMEM159 inhibitors could significantly inhibit the proliferation of GBM compared to treatment with osimertinib or TMEM159 inhibitors alone (Fig. 10C).
Based on these results, we believe that TMEM159 may influence GBM development by altering the expression of EGFR and its downstream signals. Additionally, the inhibition of TMEM159 combined with treatment with osimertinib is expected to have a stronger inhibitory effect on GBM, suggesting that TMEM159 is likely to act via other pathways that affect GBM. The mechanism of binding of TMEM159 with EGFR, and the other mechanisms by which TMEM159 promotes cancer need to be further explored in future studies.
Gliomas are the most common primary intracranial tumors, accounting for approximately 44.6% of all intracranial tumors and 80% of all malignant brain tumors [23–25]. The annual incidence of gliomas ranges from 5 to 8 per 100,000 people. Among systemic tumors, gliomas have the third-highest 5-year mortality rate, surpassed only by pancreatic and lung cancers [23–26]. GBM is the most common glioma and is characterized by high invasion and high recurrence, with an overall survival period of only 15 months [23–26]. The mainstream clinical treatment for GBM is surgery combined with radiotherapy and chemotherapy, but the therapeutic effect of these strategies is poor. The development of science and technology has enabled scientists to achieve several novel therapeutic breakthroughs, including immunotherapy and tumor-treating fields (TTFields) [27].
Immunotherapy has been a research hotspot in recent years and has achieved good therapeutic results in several tumors, including GBM, which has attracted increasing attention. The immune microenvironment and immune characteristics are essential for tumor development and are indispensable to research studies on tumor immunotherapy. As there are usually some key genes that are responsible for maintaining the immune characteristics of tumors, the identification of these key genes is critical for enhancing the effectiveness of immunotherapy.
A GBM dataset obtained from the TCGA database was first clustered based on the infiltration levels of 22 types of immune cells and their immune scores. The results of clustering led to the identification of two clusters with clear boundaries, suggesting that the two clusters had distinct differences in their immune characteristics. The clustering efficacy was evaluated by comparing the infiltration levels of the immune cells and the immune scores. The results demonstrated that there were notable disparities in the infiltration levels of the immune cells and the immune scores of the two clusters, suggesting that the clustering was very effective.
It is worth emphasizing that the immune scores of cluster 2 were higher than those of cluster 1 and that the infiltration levels of the major immune killer cells in cluster 2 were also higher. These findings suggested that the cells in cluster 2 had a higher degree of alignment with the immune characteristics of GBM. Therefore, the identification of the key genes in cluster 2 was of great significance for analyzing the immune characteristics of GBM. PD-1 and PD-L1 are regarded as important genes in the field of cancer immunotherapy. Inhibitors of PD-1 and PD-L1 have been used in recent years for a variety of tumors, including GBM [28]. Our results confirmed that the expression of PD-1 and PD-L1 in cluster 2 was significantly higher than that in cluster 1, which was consistent with the higher immune characteristics of cluster 2. Based on these results, we believe that the use of inhibitors of PD-1 and PD-L1 will have a better therapeutic effect for cluster 2.
The reasons underlying the discrepancies in the immune characteristics of the two clusters, and the causes responsible for the different therapeutic effects of immunotherapy on different patients with GBM need to be investigated. Cellular heterogeneity is an important factor underlying the differences in the prognosis of GBM patients and reflects the differences in the immune microenvironment. The results of correlation analysis among the immune cells in the two clusters showed that the correlation between certain cells exhibited opposite trends. For instance, the gamma delta T cells were positively related to plasma cells and CD4 naive T cells in Cluster 1 but exhibited a negative correlation in Cluster 2. To a certain extent, the results reflected the differences in the immune microenvironment.
Intertumoral molecular heterogeneity poses an immense challenge during the treatment of tumors. Therefore, the identification of key genes and the development of targeted therapy are necessary for the personalized treatment of patients with GBM. Through a series of analyses, we constructed a prognostic model dependent on several key genes and evaluated the predictive performance of the model by survival curve analysis. The findings revealed that the high-risk patients grouped by the model had a worse prognosis, and the three genes with the highest coefficients were insulin-like growth factor (IGF)-binding protein-6 (IGFBP6), SLFN12L, and TMEM159.
IGFBP6 belongs to the family of high-affinity IGF-binding proteins, the IGF system is involved in several cancers [29–32]. The activity of IGF is regulated by IGFBPs, of which the IGFBP6 protein is distinctive owing to its marked binding preference for IGF-II over IGF-I. Although the principal function of IGFBP6 involves the inhibition of the functions of IGF-II, studies have shown that IGFBP6 also has IGF-independent effects [33], such as the promotion of cancer cell migration and the inhibition of angiogenesis.
Although studies have expounded the relationship between IGFBP6 and the progression of gliomas, studies on the effects of IGFBP6 on gliomas have reported contrasting findings. For instance, the study by Zong et al. in 2022 reported that the expression of IGFBP6 was superiorly upregulated in patients with GBM, and it was suggested that the higher expression of IGFBP6 was markedly related to the worsening of prognosis in patients with glioma [34]. However, Bei et al. demonstrated that the overexpression of IGFBP6 induced apoptosis and inhibited the migration of glioma cells [35]. It is not possible to provide a reasonable explanation for the contrasting results. As aforementioned, IGFBP6 has two modes of action, namely, IGF-dependent and IGF-independent. Additionally, IGFBP6 can inhibit both IGF-I and IGF-II. However, further studies are necessary to explore whether the contrasting findings are attributed to the different modes of action of IGFBP6.
The Schlafen (SLFN) family of proteins in humans comprises 6 members. Previous studies have indicated that the SLFN family is fundamental in tumor development and drug resistance [36,37]. Xu et al. reported that SLFN12L was increasingly expressed in gastric cancer. It was highly associated with the infiltration levels of immune cells and the expression of immune checkpoint proteins [38]. The study also observed that the expression of the SLFN family members decreased following the activation of T cells, suggesting that the SLFN family may be involved in the immune evasion of tumors by regulating the activation of T cells. Additionally, SLFN12L also correlates with intestinal metaplasia and could be used as a biomarker for predicting the subset of individuals who are likely to progress to gastric cancer [38,39].
Although the correlation between SLFN12L and glioma has not been studied to date, studies have demonstrated that the SLFN5 and SLFN11 induce the malignant phenotype in GBM [40–42]. Based on the results of our analysis and the role of SLFN12L in gastric cancer, we speculate that SLFN12L is likely to promote the development of gliomas. We intend to further investigate the relationship between SLFN12L and gliomas in the future to identify novel therapeutic targets for gliomas.
TMEM159, also known as LDAF1, consists of four contiguous putative transmembrane sequences and is expressed in several human organs, including the brain, adrenal glands, and thyroid [43]. Sequence-based prediction of TMEM159 revealed that the protein contains two helical hairpins, and this helical domain is necessary for binding and other functions. TMEM159 is an ER protein that can form oligomers with seipin in the bilayer membrane of the ER [10]. Seipin is located in the ER and shows importance in the assembly of cytoplasmic LDs. The TMEM159-seipin complex can attract triacylglycerols and promote the phase separation of neutral triglyceride lipids. The complex also determines the site of LD formation in the ER through phase separation. The complex allows lipids to accumulate and partition into nascent droplets for determining the sites of LD formation.
Jawinski et al. demonstrated that TMEM159 is significantly associated with major depressive disorder [44]. By analyzing data from the MetaXcan database, they found that the expression of TMEM159 is markedly increased in Alzheimer’s disease and autism spectrum disorder. However, the specific mechanism underlying the regulation of psychiatric disorders by TMEM159 remains unclear.
A previous study reported that the levels of lipids can affect the development of GBM, and demonstrated that cholesterol esterification and the formation of LDs are biomarkers of GBM [17]. Meanwhile, high levels of LDs in GBM patients are associated with the progression and low survival rate of GBM. Although the effect of TMEM159 on the development of GBM and other tumors has not been studied to date, TMEM159 is involved in the formation of LDs and may be important in the development of GBM.
In the present study, we revealed that EGFR was one of the five genes with the highest mutation frequency and harbored the highest number of mutations in the high-risk group. As the grouping was based on the expression of the three aforementioned major genes, we believe that EGFR may be correlated with these three genes. Using IP-LS/MS analysis, our previous study additionally reported that TMEM159 is likely to interact with EGFR [11]. It has been reported that the amplification and mutation of EGFR are associated with the development of GBM [45].
The results of both bioinformatics analyses and in vitro experiments revealed that the expression of TMEM159 was much higher in GBM cells than in normal glial cells. We also proved that the knockdown of TMEM159 attenuated the proliferation and invasion of the GBM1492 cell line. The results of chick embryo CAM assays confirmed that the knockdown of TMEM159 could inhibit the angiogenesis of GBM1492 cells. This provides a novel direction for future research aimed at inhibiting the proliferation, invasion, and angiogenesis of glioma cells. We also demonstrated that the knockdown of TMEM159 could inhibit the activity of EGFR, the downstream signals, and PD-L1, suggesting that there is a possible association among TMEM159, EGFR, and PD-L1. However, it should be emphasized that the study has certain limitations. The mechanisms underlying the role of TMEM159 in the diagnosis and treatment of gliomas require further exploration, and the association between TMEM159 and immune functions needs to be investigated in particular. Further in vivo and in vitro experiments need to be conducted in the future to confirm whether TMEM159 interacts with EGFR in gliomas and whether TMEM159 affects the degradation of EGFR.
A prognostic model based on the immune characteristics of GBM was constructed in this study, which achieved good prognostic efficacy in predicting high-risk patients. The prognostic model was constructed using multiple genes associated with tumor progression. Our findings also suggest that TMEM159 may be an important prognostic factor for GBM. The knockdown of TMEM159 suppressed the proliferation, invasion, and angiogenesis of GBM1492 cells. The inhibition of TMEM159 inhibited the activation of EGFR and downstream pathways and decreased the expression of PDL-1. Altogether, these findings indicate that TMEM159 may be a promising target for suppressing the development of GBM.
Acknowledgement: We thank Prof. Songshu Meng (Dalian Medical University) for guiding and providing experimental sites and instruments.
Funding Statement: This work was supported by the National Natural Science Foundation of China (No. 82173032), Liaoning Provincial Science and Technology Plan Project (No. 2023JH2/101700156), the Medical and Industrial Crossover Project of Liaoning Cancer Hospital & Institute (No. LD202225) and the Science and Technology Planning Project of Shenyang (No. 20–205-4–003).
Author Contributions: The authors confirm their contribution to the paper as follows: study conception and design: Tangjun Guo, Haozhe Piao; data collection: Ji Shi; analysis and interpretation of results: Ji Shi, Yi Chen; draft manuscript preparation: Ji Shi, Ye Zhang. All authors reviewed the results and approved the final version of the manuscript.
Availability of Data and Materials: Data sharing is not applicable to this article as no datasets were generated or analyzed during the current study.
Ethics Approval: This study was approved by the Ethics Committee of Dalian Medical University and the Ethics Committee of Liaoning Cancer Hospital & Institute. Written informed consent was obtained from all the patients and the data were analyzed anonymously (Ethics Committee of Liaoning Cancer Hospital & Institute, approval numbers: 20220429, date: 20220412). All the animal experiments complied with the National Guidelines for the Care and Use of Laboratory Animals. The experiments using chick embryos were approved by the Experimental Animal Ethics Committee of Dalian Medical University (approval number: AEE23015, date: 20230515), and the experiments were performed at the Laboratory Animal Center of Dalian Medical University.
Conflicts of Interest: The authors declare that they have no conflicts of interest to report regarding the present study.
References
1. Zhang H, Wang R, Yu Y, Liu J, Luo T, Fan F. Glioblastoma treatment modalities besides surgery. J Cancer. 2019;10(20):4793–4806. doi:10.7150/jca.32475. [Google Scholar] [PubMed] [CrossRef]
2. Miller JJ. Targeting IDH-mutant glioma. Neurotherapeutics. 2022;19(6):1724–32. doi:10.1007/s13311-022-01238-3. [Google Scholar] [PubMed] [CrossRef]
3. von Deimling A, Korshunov A, Hartmann C. The next generation of glioma biomarkers: MGMT methylation, BRAF fusions and IDH1 mutations. Brain Pathol. 2011;21(1):74–87. doi:10.1111/j.1750-3639.2010.00454.x. [Google Scholar] [PubMed] [CrossRef]
4. Louis DN, Perry A, Wesseling P, Brat DJ, Cree IA, Figarella-Branger D, et al. The 2021 WHO classification of tumors of the central nervous system: a summary. Neuro Oncol. 2021;23(8):1231–51. doi:10.1093/neuonc/noab106. [Google Scholar] [PubMed] [CrossRef]
5. Hu L, Shen D, Liang D, Shi J, Song C, Jiang K, et al. Thyroid receptor-interacting protein 13 and EGFR form a feedforward loop promoting glioblastoma growth. Cancer Lett. 2020;28(493):156–66. [Google Scholar]
6. Huang LE. Impact of CDKN2A/B Homozygous deletion on the prognosis and biology of IDH-mutant glioma. Biomedicines. 2022;10(2):246. doi:10.3390/biomedicines10020246. [Google Scholar] [PubMed] [CrossRef]
7. Huang Y, Zhu C, Liu P, Ouyang F, Luo J, Lu C, et al. L1CAM promotes vasculogenic mimicry formation by miR-143-3p-induced expression of hexokinase 2 in glioma. Mol Oncol. 2023;17(4):664–85. doi:10.1002/1878-0261.13384. [Google Scholar] [PubMed] [CrossRef]
8. Xu X, Liang Y, Gareev I, Liang Y, Liu R, Wang N, et al. LncRNA as potential biomarker and therapeutic target in glioma. Mol Biol Rep. 2023;50(1):841–51. doi:10.1007/s11033-022-08056-y. [Google Scholar] [PubMed] [CrossRef]
9. Śledzińska P, Bebyn MG, Furtak J, Kowalewski J, Lewandowska MA. Prognostic and predictive biomarkers in gliomas. Int J Mol Sci. 2021;22(19):10373. doi:10.3390/ijms221910373. [Google Scholar] [PubMed] [CrossRef]
10. Chung J, Wu X, Lambert TJ, Lai ZW, Walther TC, Farese RVJr. LDAF1 and seipin form a lipid droplet assembly complex. Dev Cell. 2019;51(5):551–63. doi:10.1016/j.devcel.2019.10.006. [Google Scholar] [PubMed] [CrossRef]
11. Geng F, Cheng X, Wu X, Yoo JY, Cheng C, Guo JY, et al. Inhibition of SOAT1 suppresses glioblastoma growth via blocking SREBP-1-mediated lipogenesis. Clin Cancer Res. 2016;22(21):5337–48. doi:10.1158/1078-0432.CCR-15-2973. [Google Scholar] [PubMed] [CrossRef]
12. Langfelder P, Horvath S. WGCNA: an R package for weighted correlation network analysis. BMC Bioinformatics. 2008;29(9):559. [Google Scholar]
13. Tang Q, Chen Y, Li X, Long S, Shi Y, Yu Y, et al. The role of PD-1/PD-L1 and application of immune-checkpoint inhibitors in human cancers. Front Immunol. 2022;13(13):964442. [Google Scholar] [PubMed]
14. Viallard C, Larrivée B. Tumor angiogenesis and vascular normalization: alternative therapeutic targets. Angiogenesis. 2017;20(4):409–26. doi:10.1007/s10456-017-9562-9. [Google Scholar] [PubMed] [CrossRef]
15. Sabbah DA, Hajjo R, Sweidan K. Review on epidermal growth factor receptor (EGFR) structure, signaling pathways, interactions, and recent updates of EGFR inhibitors. Curr Top Med Chem. 2020;20(10):815–34. doi:10.2174/1568026620666200303123102. [Google Scholar] [PubMed] [CrossRef]
16. Sabnis RW. Combination of allosteric and orthosteric EGFR inhibitors for treating non-small-cell lung cancer. ACS Med Chem Lett. 2024;15(3):342–3. doi:10.1021/acsmedchemlett.4c00076. [Google Scholar] [PubMed] [CrossRef]
17. Geng F, Guo D. Lipid droplets, potential biomarker and metabolic target in glioblastoma. Intern Med Rev. 2017;3(5):10. [Google Scholar]
18. Taïb B, Aboussalah AM, Moniruzzaman M, Chen S, Haughey NJ, Kim SF, et al. Lipid accumulation and oxidation in glioblastoma multiforme. Sci Rep. 2019;9(1):19593. doi:10.1038/s41598-019-55985-z. [Google Scholar] [PubMed] [CrossRef]
19. Szeto GL, Finley SD. Integrative approaches to cancer immunotherapy. Trends Cancer. 2019;5(7):400–10. doi:10.1016/j.trecan.2019.05.010. [Google Scholar] [PubMed] [CrossRef]
20. Gou Q, Dong C, Xu H, Khan B, Jin J, Liu Q, et al. PD-L1 degradation pathway and immunotherapy for cancer. Cell Death Dis. 2020;11(11):955. doi:10.1038/s41419-020-03140-2. [Google Scholar] [PubMed] [CrossRef]
21. Yi M, Zheng X, Niu M, Zhu S, Ge H, Wu K. Combination strategies with PD-1/PD-L1 blockade: current advances and future directions. Mol Cancer. 2022;21(1):28. doi:10.1186/s12943-021-01489-2. [Google Scholar] [PubMed] [CrossRef]
22. Chagoya G, Kwatra SG, Nanni CW, Roberts CM, Phillips SM, Nullmeyergh S, et al. Efficacy of osimertinib against EGFRvIII+ glioblastoma. Oncotarget. 2020;11(22):2074–82. doi:10.18632/oncotarget.27599. [Google Scholar] [PubMed] [CrossRef]
23. Sun J, Xu LL, Zhang YY, Li HH, Feng JJ, Lu XX, et al. Long non-coding RNA DPP10-AS1 represses the proliferation and invasiveness of glioblastoma by regulating miR-24-3p/CHD5 signaling pathway. BIOCELL. 2023;47(12):2721–33. doi:10.32604/biocell.2023.043869. [Google Scholar] [CrossRef]
24. Lin K, Gao Z, Shang B, Sui S, Fu Q. Osthole suppresses the proliferation and accelerates the apoptosis of human glioma cells via the upregulation of microRNA-16 and downregulation of MMP-9. Mol Med Rep. 2015;12(3):4592–7. doi:10.3892/mmr.2015.3929. [Google Scholar] [PubMed] [CrossRef]
25. Shi J, Sun PX, Zhang Y, Yao B, Piao HZ. The antitumor effects of newcastle disease virus on glioma. BIOCELL. 2019;43(3):119–27. doi:10.32604/biocell.2019.07577. [Google Scholar] [CrossRef]
26. Friedman HS, Kerby T, Calvert H. Temozolomide and treatment of malignant glioma. Clin Cancer Res. 2000;6(7):2585–97. [Google Scholar] [PubMed]
27. Rominiyi O, Vanderlinden A, Clenton SJ, Bridgewater C, Al-Tamimi Y, Collis SJ. Tumour treating fields therapy for glioblastoma: current advances and future directions. Br J Cancer. 2021;124(4):697–709. doi:10.1038/s41416-020-01136-5. [Google Scholar] [PubMed] [CrossRef]
28. Yang T, Kong Z, Ma W. PD-1/PD-L1 immune checkpoint inhibitors in glioblastoma: clinical studies, challenges and potential. Hum Vaccin Immunother. 2021;17(2):546–53. doi:10.1080/21645515.2020.1782692. [Google Scholar] [PubMed] [CrossRef]
29. Efimova AS, Antipenko ID, Evtushenko EA, Balan PV, Tonevitskaya SA. Effect of IGFBP6 knockdown on proteins regulating exosome synthesis and secretion in MDA-MB-231 cell line. Bull Exp Biol Med. 2023;175(1):157–61. doi:10.1007/s10517-023-05828-9. [Google Scholar] [PubMed] [CrossRef]
30. Nikulin S, Razumovskaya A, Poloznikov A, Zakharova G, Alekseev B, Tonevitsky A. ELOVL5 and IGFBP6 genes modulate sensitivity of breast cancer cells to ferroptosis. Front Mol Biosci. 2023;13(10):1075704. [Google Scholar]
31. Zhao C, Zhu X, Wang G, Wang W, Ju S, Wang X. Decreased expression of IGFBP6 correlates with poor survival in colorectal cancer patients. Pathol Res Pract. 2020;216(5):152909. doi:10.1016/j.prp.2020.152909. [Google Scholar] [PubMed] [CrossRef]
32. Zhang S, Gong T, Nan Y, Feng R, Liu Z, Chen H. MAFB promotes the malignant phenotypes by IGFBP6 in esophageal squamous cell carcinomas. Exp Cell Res. 2022;416(1):113158. doi:10.1016/j.yexcr.2022.113158. [Google Scholar] [PubMed] [CrossRef]
33. Fu P, Thompson JA, Bach LA. Promotion of cancer cell migration: an insulin-like growth factor (IGF)-independent action of IGF-binding protein-6. J Biol Chem. 2007;282(31):22298–306. doi:10.1074/jbc.M703066200. [Google Scholar] [PubMed] [CrossRef]
34. Zong Z, Xin L, Tang X, Guo H. The clinical characteristics and prognostic value of IGFBP6 in glioma. Neurol Res. 2022;44(2):113–20. doi:10.1080/01616412.2021.1963620. [Google Scholar] [PubMed] [CrossRef]
35. Bei Y, Huang Q, Shen J, Shi J, Shen C, Xu P, et al. IGFBP6 regulates cell apoptosis and migration in glioma. Cell Mol Neurobiol. 2017;37(5):889–98. doi:10.1007/s10571-016-0426-4. [Google Scholar] [PubMed] [CrossRef]
36. Al-Marsoummi S, Vomhof-DeKrey EE, Basson MD. Schlafens: emerging proteins in cancer cell biology. Cells. 2021;10(9):2238. doi:10.3390/cells10092238. [Google Scholar] [PubMed] [CrossRef]
37. Kundu K, Cardnell RJ, Zhang B, Shen L, Stewart CA, Ramkumar K, et al. SLFN11 biomarker status predicts response to lurbinectedin as a single agent and in combination with ATR inhibition in small cell lung cancer. Transl Lung Cancer Res. 2021;10(11):4095–4105. doi:10.21037/tlcr-21-437. [Google Scholar] [PubMed] [CrossRef]
38. Xu J, Chen S, Liang J, Hao T, Wang H, Liu G, et al. Schlafen family is a prognostic biomarker and corresponds with immune infiltration in gastric cancer. Front Immunol. 2022;25(13):922138. [Google Scholar]
39. Ding L, Chakrabarti J, Sheriff S, Li Q, Thi Hong HN, Sontz RA, et al. Toll-like receptor 9 pathway mediates schlafen+-MDSC polarization during helicobacter-induced gastric metaplasias. Gsastroenterology. 2022;163(2):411–25. doi:10.1053/j.gastro.2022.04.031. [Google Scholar] [PubMed] [CrossRef]
40. Kubelt C, Hellmold D, Esser D, Ahmeti H, Synowitz M, Held-Feindt J. Insights into gene regulation under temozolomide-promoted cellular dormancy and its connection to stemness in human glioblastoma. Cells. 2023;12(11):1491. doi:10.3390/cells12111491. [Google Scholar] [PubMed] [CrossRef]
41. Arslan AD, Sassano A, Saleiro D, Lisowski P, Kosciuczuk EM, Fischietti M, et al. Human SLFN5 is a transcriptional co-repressor of STAT1-mediated interferon responses and promotes the malignant phenotype in glioblastoma. Oncogene. 2017;36(43):6006–19. doi:10.1038/onc.2017.205. [Google Scholar] [PubMed] [CrossRef]
42. Fischietti M, Eckerdt F, Perez RE, Guillen Magaña JN, Mazewski C, Ho S, et al. SLFN11 negatively regulates non-canonical NFκB signaling to promote glioblastoma progression. Cancer Res Commun. 2022;2(9):966–78. doi:10.1158/2767-9764.CRC-22-0192. [Google Scholar] [PubMed] [CrossRef]
43. Fagerberg L, Hallström BM, Oksvold P, Kampf C, Djureinovic D, Odeberg J, et al. Analysis of the human tissue-specific expression by genome-wide integration of transcriptomics and antibody-based proteomics. Mol Cell Proteomics. 2014;13(2):397–406. doi:10.1074/mcp.M113.035600. [Google Scholar] [PubMed] [CrossRef]
44. Jawinski P, Kirsten H, Sander C, Spada J, Ulke C, Huang J, et al. Human brain arousal in the resting state: a genome-wide association study. Mol Psychiatry. 2019;24(11):1599–609. doi:10.1038/s41380-018-0052-2. [Google Scholar] [PubMed] [CrossRef]
45. Lu H, Zhang B, Xie Y, Zhao W, Han W, Zhou L, et al. Sitravatinib is a potential EGFR inhibitor and induce a new death phenotype in Glioblastoma. Invest New Drugs. 2023;41(4):564–78. doi:10.1007/s10637-023-01373-4. [Google Scholar] [PubMed] [CrossRef]
Appendix A
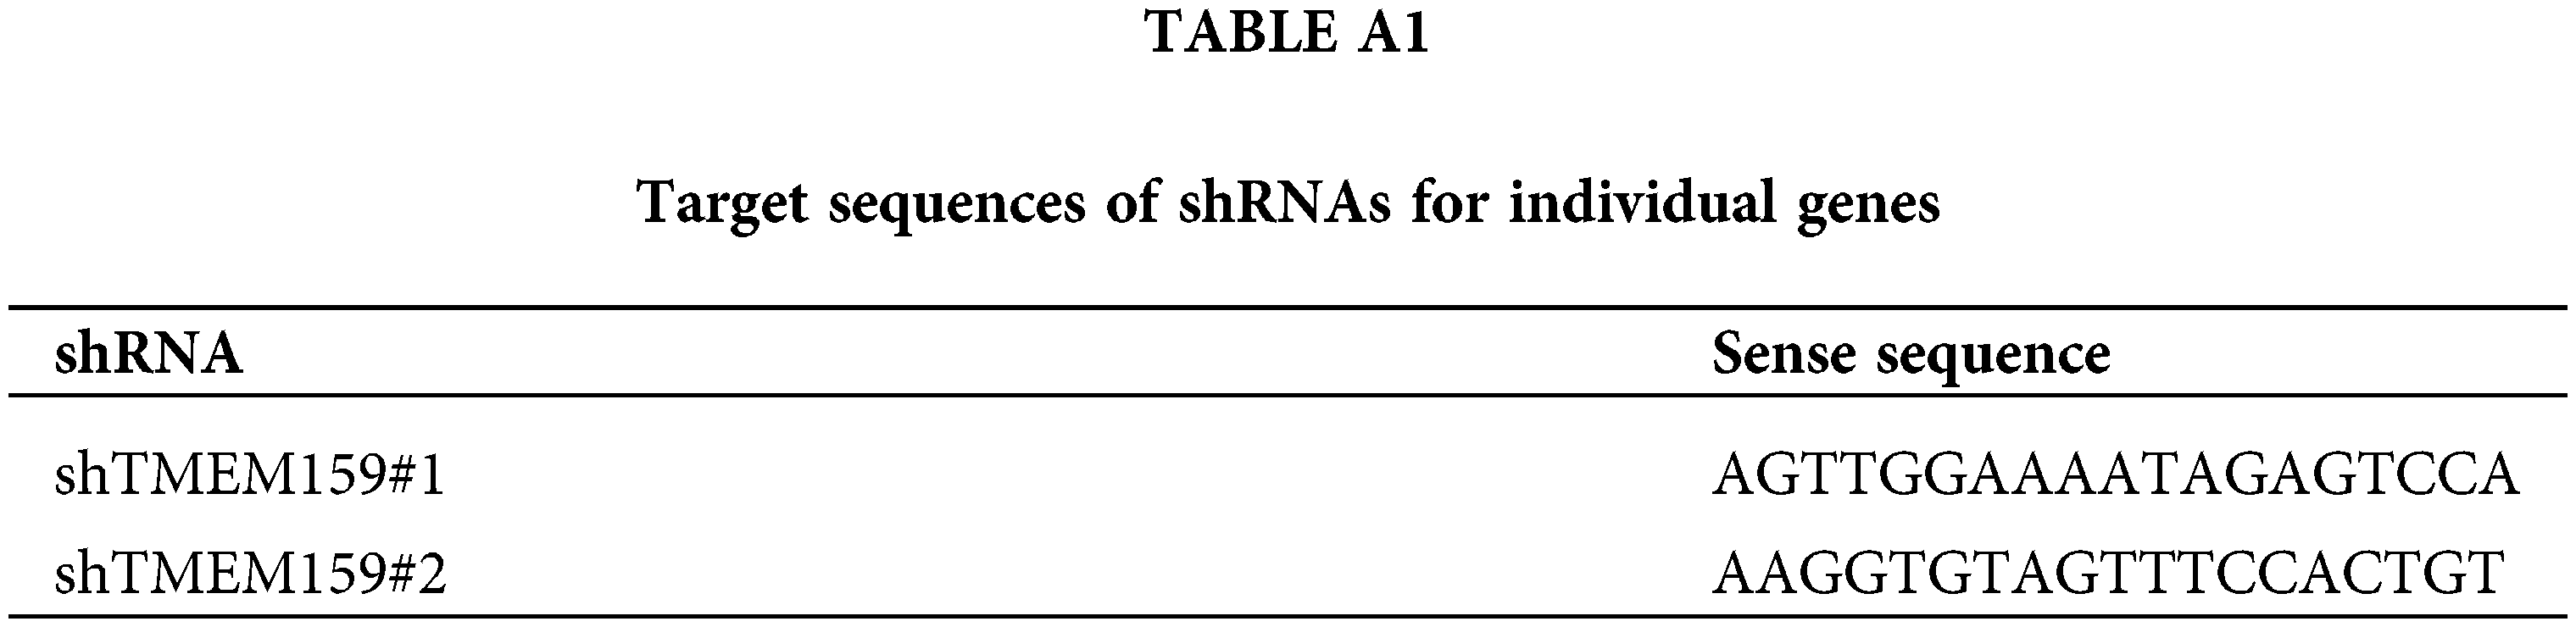
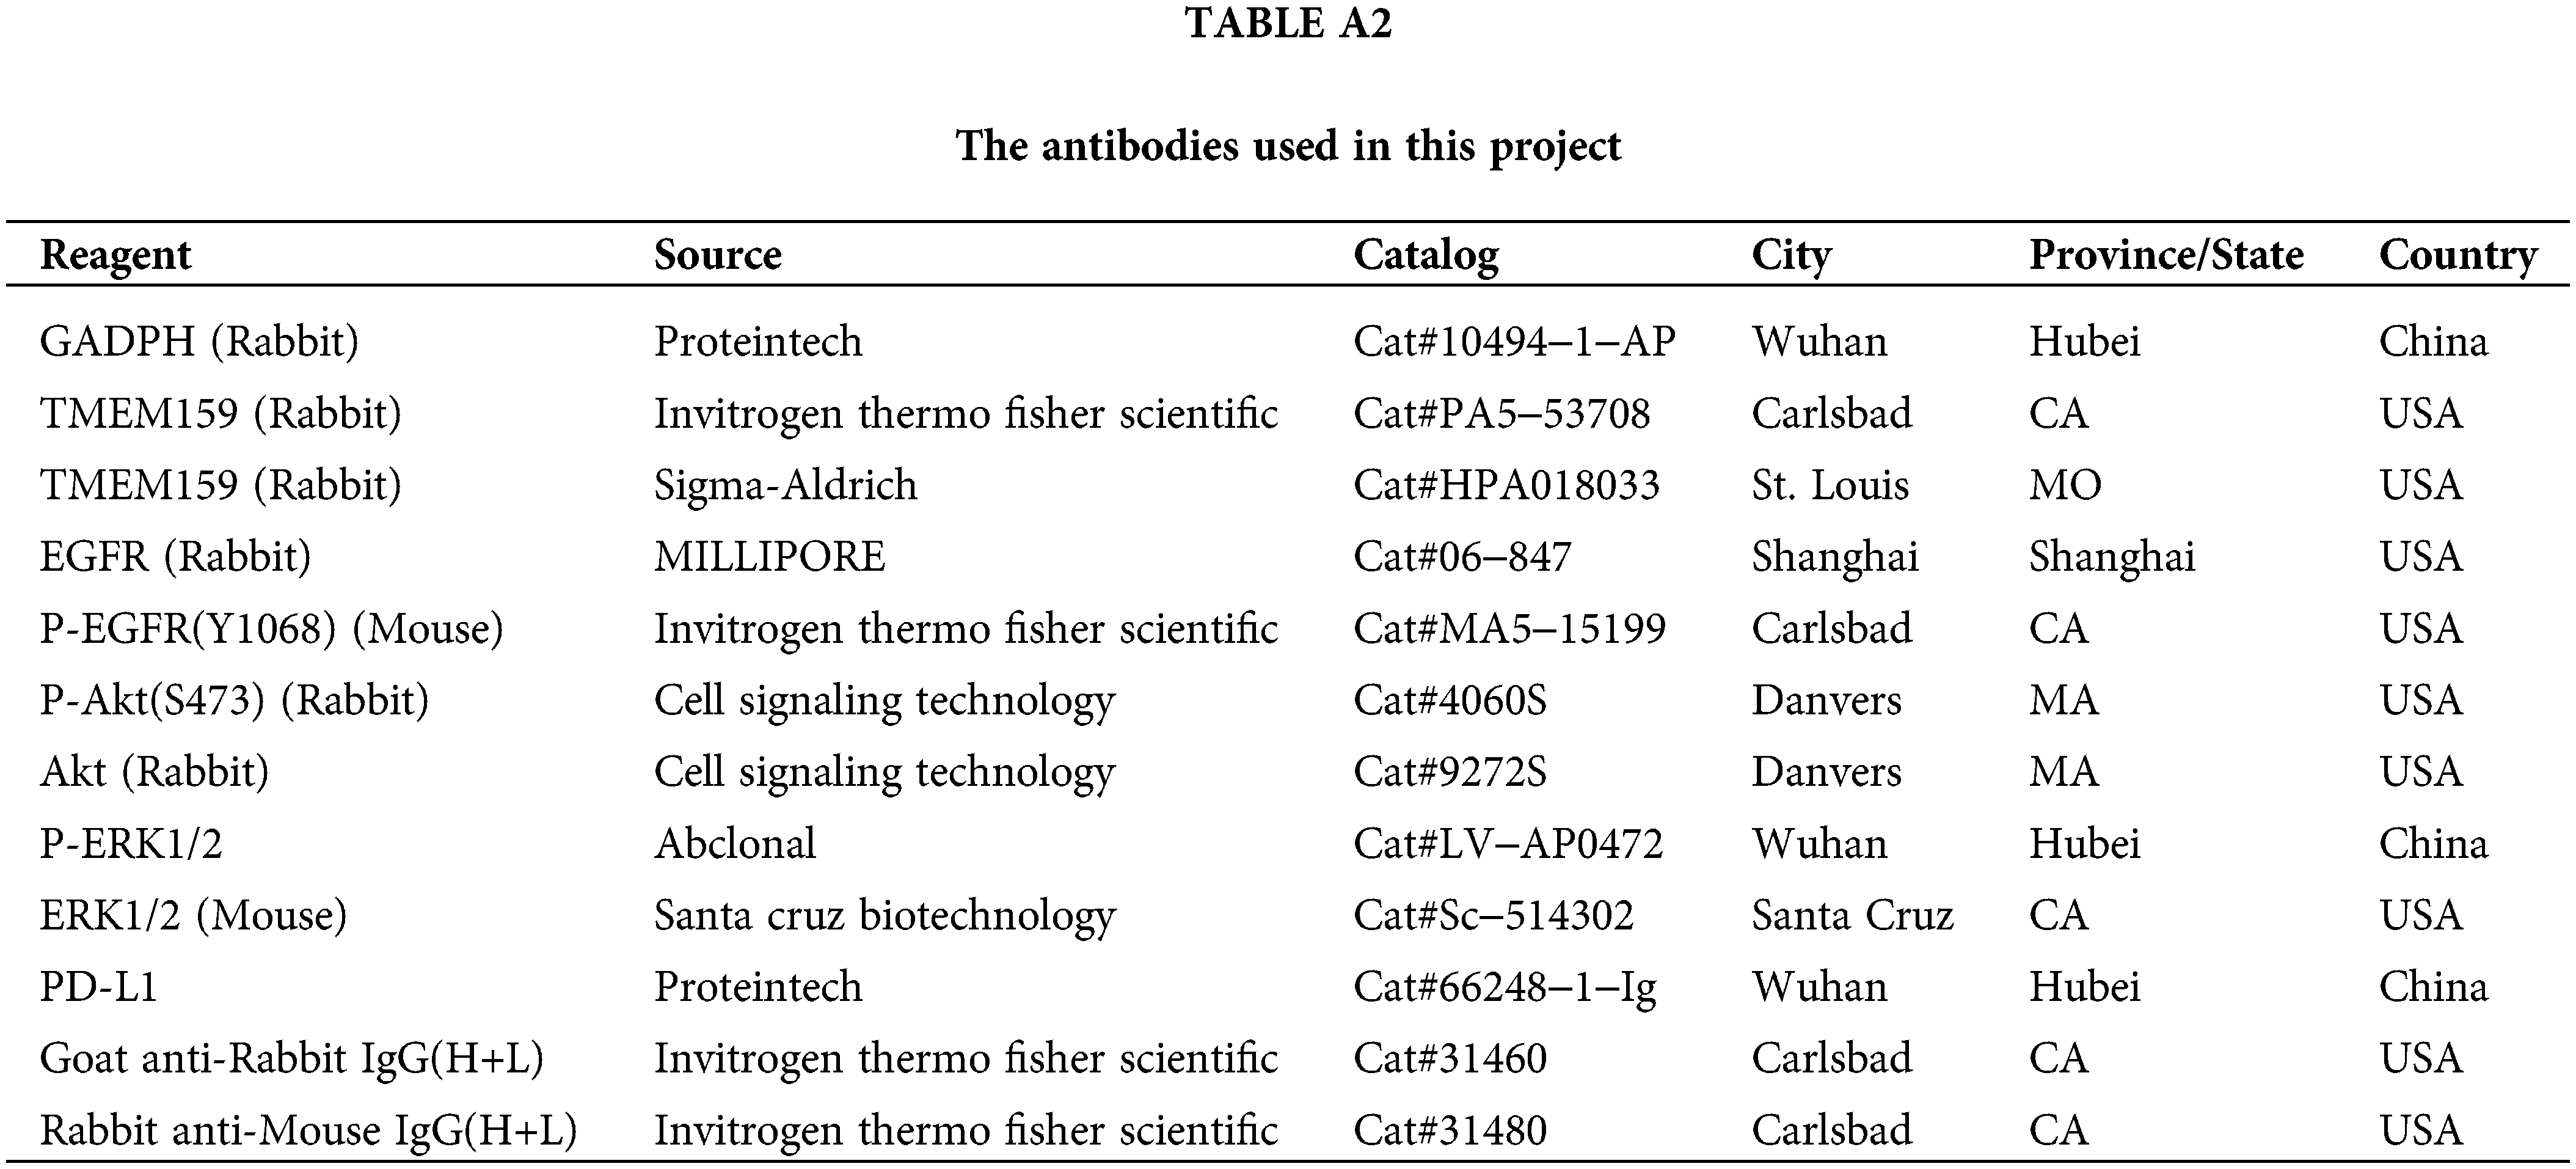
Cite This Article
 Copyright © 2024 The Author(s). Published by Tech Science Press.
This work is licensed under a Creative Commons Attribution 4.0 International License , which permits unrestricted use, distribution, and reproduction in any medium, provided the original work is properly cited.
 Downloads
 Citation Tools