
 Submit a Paper
 Propose a Special lssue
 Open Access
ARTICLE

The lactylation index predicts the immune microenvironment and prognosis of pan-cancer patients
1 Department of Oncology, Southwest Hospital, Third Military Medical University (Army Medical University), Chongqing, 400038, China
2 Department of Stem Cell and Regenerative Medicine, Institute of Pathology and Southwest Cancer Center, Southwest Hospital, Third Military Medical University (Army Medical University), Chongqing, 400038, China
3 Key Laboratory of Cancer Immunopathology, Ministry of Education, Chongqing, 400038, China
4 International Joint Research Center for Precision Biotherapy, Ministry of Science and Technology, Chongqing, 400038, China
5 Jin-feng Laboratory, Chongqing, 401329, China
* Corresponding Authors: JIANJUN LI. Email: ; SHICANG YU. Email:
BIOCELL 2024, 48(8), 1223-1239. https://doi.org/10.32604/biocell.2024.050803
Received 18 February 2024; Accepted 29 April 2024; Issue published 02 August 2024
 View Full Text
 Download PDF
Abstract
Background: Protein lactylation is a new way for the “metabolic waste” lactic acid to perform novel functions. Nevertheless, our understanding of the contribution of protein lactylation to both tumor progression and therapeutic interventions remains imited. The construction of a scoring system for lactylation to predict the prognosis of pan-cancer patients and to evaluate the tumor immune microenvironment (TIME) would improve our understanding of the clinical significance of lactylation. Methods: Consensus clustering analysis of lactylation-related genes was used to cluster 177 pancreatic adenocarcinoma (PAAD) patients. Subsequently, a scoring system was developed using the least absolute shrinkage and selection operator (LASSO) regression. Internal validation and external validation were both conducted to assess and confirm the predictive accuracy of the scoring system. Finally, leucine rich repeat containing 1 (LRRC1), a newly discovered lactylation-related gene, was analyzed in PAAD in vitro. Results: Utilizing the profiles of 332 lactylation-related genes, a total of 177 patients with PAAD were segregated into two distinct groups. LacClusterhigh patients had a poorer prognosis than LacClusterlow patients. Through the differential analysis between the LacClusterhigh and LacClusterlow groups, we identified additional genes associated with lactylation. These genes were then integrated to construct the LacCluster-enhanced system, which enabled more accurate prognosis prediction for patients with PAAD. Then, a lactylation index containing three genes (LacI-3) was constructed using LASSO regression. This was done to enhance the usability of the LacCluster-enhanced system in the clinic. Compared to those in the LacI-3high subgroup, patients in the LacI-3low subgroup exhibited increased expression of immune checkpoint-related genes, more immune cell infiltration, lower tumor mutation burdens, and better prognoses, indicating a “hot tumor” phenotype. Moreover, knocking down the expression of LRRC1, the hub gene in the LacI-3 scoring system, inhibited PAAD cell invasion, migration, and proliferation in vitro. Ultimately, the significance of LacI-3 across cancers was confirmed. Conclusion: Our findings strongly imply that protein lactylation may represent a new approach to diagnosing and treating malignant tumors.Keywords
Supplementary Material
Supplementary Material FileAbbreviations
| ARNT2 | Aryl hydrocarbon receptor nuclear translocator 2 |
| AUC | Area under the ROC curve |
| BRCA | Breast invasive carcinoma |
| CAR-T | Chimeric antigen receptor T |
| CCK8 | Cell counting kit 8 |
| CCR | Cytokine and cytokine receptor |
| CDKN2A | Cyclin dependent kinase inhibitor 2A |
| CNV | Copy number variation |
| COAD | Colon adenocarcinoma |
| CTLA-4 | Cytotoxic T-lymphocyte-associated protein 4 |
| DC | Dendritic cell |
| DSS | Disease-specific survival |
| EP300 | E1A binding protein P300 |
| GSEA | Gene set enrichment analysis |
| HDAC1-3 | Histone deacetylase 1-3 |
| HLA | Human leukocyte antigen |
| HPA | Human Protein Atlas |
| IC50 | Half maximal inhibitory concentration |
| IFN | Interferon |
| IHC | Immunohistochemistry |
| KIRC | Kidney clear cell carcinoma |
| KRAS | Kirsten rat sarcoma viral oncogene homolog |
| LacI-3 | Lactylation index containing three genes |
| LASSO | Least absolute shrinkage and selection operator |
| LIHC | Liver hepatocellular carcinoma |
| LRRC1 | Leucine rich repeat containing 1 |
| LUAD | Lung adenocarcinoma |
| LUSC | Lung squamous cell carcinoma |
| MAF | Mutation annotation format |
| MESO | Mesothelioma |
| OD | Optical density |
| OS | Overall survival |
| PAAD | Pancreatic adenocarcinoma |
| PAGE | Polyacrylamide gel electrophoresis |
| PCA | Principal component analysis |
| PD-1 | Programmed cell death protein 1 |
| PD-L1 | Programmed cell death ligand 1 |
| PFS | Progression-free survival |
| PPIA | Peptidylprolyl isomerase A |
| PVDF | Polyvinylidene difluoride |
| READ | Rectum adenocarcinoma |
| ROC | Receiver operating characteristic |
| SARC | Sarcoma |
| SDS | Sodium dodecyl sulfate |
| SIRT1-3 | Sirtuin1-3 |
| SMAD4 | SMAD family member 4 |
| THYM | Thymoma |
| TIME | Tumor immune microenvironment |
| TMB | Tumor mutation burden |
| TTN | Titin |
| UCEC | Uterine corpus endometrial carcinoma |
| UVM | Uveal melanoma |
The development of cancer immunotherapy was a milestone in the history of cancer treatment. With the extensive use of programmed cell death protein 1 (PD-1)/PD-L1 inhibitors, cytotoxic T-lymphocyte-associated protein 4 (CTLA-4) inhibitors, chimeric antigen receptor T (CAR-T) cells, and other immunotherapies in the clinic, challenges associated with immunotherapy have emerged. One important obstacle is the immunosuppression of the tumor microenvironment [1]. The diverse cell populations and insufficient blood supply in the tumor microenvironment result in inefficient nutrient supply, oxygen transport, and metabolic waste clearance [2].
To adapt to such a microenvironment, cells undergo metabolic reprogramming [3]. A plethora of research has indicated that tissue metabolism undergoes significant alterations during the immune response and immune cell differentiation [4,5]. These modifications include the utilization of nutrients, consumption of oxygen, production of reactive nitrogen and oxygen compounds, and accumulation of various metabolites [6,7].
Even in the presence of sufficient oxygen, cancer cells still prioritize the use of glycolysis (known as aerobic glycolysis or the Warburg effect) to maintain a high level of glycolytic intermediates to meet biosynthetic needs [8], leading to an environment characterized by hypoxia, acidity, and deficiency in glucose and amino acids [9]. Previously, the metabolic product of glycolysis, lactic acid, was thought to be only a waste product of the metabolic process. However, recent research findings indicate that lactic acid can serve as a fuel for mitochondrial metabolism, regulate the metabolism of immune cells, suppress the activation and proliferation of immune cells, and affect immune surveillance and escape [10]. With the increase in research on lactic acid, in 2019, protein lactylation was proposed as another epigenetic modification method following acetylation, methylation, phosphorylation, ubiquitination, and SUMOylation. The study of protein lactylation provides new directions for studying epigenetic modifications of proteins using omics and for studying lactic acid in fields such as cancer and immunity. However, our knowledge about the impact of protein lactylation in cancer progression and treatment remains limited.
In our research, consensus clustering analysis and scoring systems were constructed using lactylation-related genes to predict the prognosis and tumor immune microenvironment (TIME) landscape of pancreatic adenocarcinoma (PAAD) patients. The enrichment of glycolytic pathway components and model gene mutations in the samples were evaluated, and drug sensitivity was assessed. The results provided valuable clinical guidance for the treatment of PAAD patients. Finally, we conducted studies on leucine rich repeat containing 1 (LRRC1), which is the key gene in the scoring system; these studies included evaluating differences in survival, apoptosis, invasion, migration, proliferation, and colony formation. In addition, we evaluated the significance of this scoring system in predicting patient prognosis and immune infiltration across cancers, thus expanding its application scope. To date, there have been no reported models of lactylation-related genes in PAAD. This study has made significant contributions to the field by filling this gap.
The data obtained from The Cancer Genome Atlas (TCGA) (https://cancergenome.nih.gov/, accessed on 01/04/2024) and Gene Expression Omnibus (GEO) (https://www.ncbi.nlm.nih.gov/geo/, accessed on 01/04/2024) repositories for this study included RNA-seq data and detailed clinical information. The training cohort included 177 PAAD patients from TCGA, and the validation cohort included 65 PAAD patients from the GSE62452 dataset. Pan-cancer datasets were downloaded from TCGA.
According to previously published studies [11–13], we conducted our research using a comprehensive set of 332 genes involved in lactylation (Table S1).
Construction of the LacCluster and LacCluster-enhanced systems
We applied consensus clustering analysis to categorize PAAD into distinct LacClusters, and LacClusters-enhanced subgroups according to prognosis-associated lactylation-related genes and prognosis-related differentially expressed genes (DEGs) between the two LacClusters, respectively.
Construction and verification of the scoring system
Prognosis-related DEGs were analyzed using least absolute shrinkage and selection operator (LASSO) regression analysis and multiple Cox regression analysis. Finally, three genetic factors crucial to the development of the prognostic model were identified, namely, peptidylprolyl isomerase A (PPIA), LRRC1, and aryl hydrocarbon receptor nuclear translocator 2 (ARNT2). The lactylation index of three genes (LacI-3) was calculated using the following formula: LacI-3 = PPIA expression × (0.007376) + LRRC1 expression × (0.033445) + ARNT2 expression × (−0.033908). According to the median of LacI-3 score, patients from the training and validation sets were categorized into LacI-3high and LacI-3low groups.
Gene set enrichment analysis (GSEA)
The R package “GSEA” (version 4.0.1) was used for enrichment analysis to explore the heterogeneity of glycolysis-related pathways. The gene sets “HALLMARK_GLYCOLYSIS. gmt” and “REACTOME_GLYCOLYSIS. gmt” were the reference gene sets downloaded from GSEA (https://www.gsea-msigdb.org/gsea/msigdb/human/search.jsp, accessed on 01/04/2024). Lactylation scores were calculated based on the 332 previously identified lactylation-related genes using single-sample GSEA (ssGSEA).
The R package “pRRophetic” was utilized for conducting the drug sensitivity analysis. Differential analysis and correlation analysis of drug sensitivity were performed in the LacI-3high and LacI-3low groups.
The mutation annotation format (MAF) was created utilizing the “maftools” package, and somatic mutations in PAAD were plotted. The TMB was assessed for every patient with PAAD in the TCGA dataset.
xCell was used to calculate the immune cell scores of PAAD patients [14]. The infiltration levels of 29 immune cells were estimated using ssGSEA [15,16]. The immune scores, ESTIMATE scores, and stromal scores were calculated using the ESTIMATE algorithm [17]. The scores of 22 immune cell types in PAAD were calculated using CIBERSORT [18].
Cell lines and culture conditions
The HPDE6-C7 cell line derived from normal human pancreatic ductal epithelial cells was obtained from Jennio Biotech Co., Ltd. (Guangzhou, China). AsPC-1 and PANC-1 cell lines derived from human PAAD were acquired from the Chinese Academy of Sciences Cell Bank (Shanghai, China). The cells were cultured in Dulbecco’s modified Eagle’s medium (DMEM) (Gibco, C11995500BT, Carlsbad, CA, USA) supplemented with 10% fetal bovine serum (FBS) (Gibco, A3160902, Carlsbad, CA, USA) and 1% penicillin-streptomycin solution (Beyotime Biotechnology, C0222, Shanghai, China). The cells were incubated at 37°C and 5% CO2 with saturating humidity in a cell culture incubator (Thermo Scientific, 411, Wilmington, DE, USA). We used L-(+)-lactic acid (MACKLIN, L812422, Shanghai, China) or the lactate dehydrogenase inhibitor galloflavin (MCE, HY-W040118, New Jersey, USA) to regulate lactylation levels in cells. The validity of each cell line was verified using short tandem repeat (STR) profiling.
PANC-1 and AsPC-1 cells were plated in a 6-well plate at 60%–70% confluence and transfected with LRRC1-specific short interfering RNAs (siRNAs) or control siRNA purchased from Tsingke Biotechnology (Beijing, China) accompanied by Lipofectamine™ RNAiMAX (Thermo Fisher Scientific, 13778150, Waltham, MA, USA). The sequences of the hLRRC1 siRNAs used were as follows: si1 sense, 5′-GCUUGGACUUAGUGAUAAUTT-3′; si1, antisense 5′-AUUAUCACUAAGUCCAAGCTT-3′; si2 sense, 5′-GGAACUGAGAGAGAAUCUUTT-3′; and si2, antisense 5′-AAGAUUCUCUCAGUUCCTT-3′.
Real-time quantitative polymerase chain reaction (RT‒qPCR)
Total RNA was isolated from HPDE6-C7, AsPC-1, and PANC-1 cells using RNAiso Plus (TaKaRa, 9108, Otsu, Shiga, Japan) and then quantified and reverse transcribed (TaKaRa, RR047A, Otsu, Shiga, Japan). Next, LRRC1 and GAPDH were analyzed using a SYBR PrimeScript PCR Kit II (TaKaRa, RR820A, Otsu, Shiga, Japan) and quantified using a Bio-Rad CFX96 detection system (Bio-Rad, 1855195, Hercules, CA, USA). The following primers were utilized: hLRRC1 forward, 5′-CAGACTAACTCGGATACCTGCAG-3′; hLRRC1 reverse, 5′-CTGGTTGTCAGATAGCCACAGAG-3′; hGAPDH forward, 5′-CAATGACCCCTTCATTGACC-3′; and hGAPDH reverse, 5′-GACAAGCTTCCCGTTCTCAG-3′. Using GAPDH as an internal control, the quantification of gene expression was determined using the comparative threshold (Ct) cycle approach.
The cells were disrupted using RIPA buffer (Beyotime Biotechnology, P0013B, Shanghai, China), and the total protein concentration was measured using a BCA kit (Thermo Fisher Scientific, Richmond, 23225, NY, USA). Equivalent quantities of protein were separated using 10% SDS‒PAGE, transferred onto polyvinylidene fluoride (PVDF) membranes (Bio-Rad, 1620177, Hercules, CA, USA) and incubated with anti-KLA (1:1000; PTM BIO, PTM1401RM, Hangzhou, China) and anti-β-actin (1:10000; ABclonal, AC026, Wuhan, China) antibodies at 4°C overnight. Subsequently, the membranes were exposed to secondary antibodies were conjugated to HRP (1:3000; Cell Signaling Technology, 7074S, Danvers, MA, USA), and the bands were visualized with SuperSignalTM West Femto (Thermo Fisher Scientific, 34096, Waltham, MA, USA) and a FUSION FX VILBER LOURMAT6 (VILBER, FX6-XT, Paris, France). β-Actin was used as an internal reference in this study.
The cells (1 × 10⁶) were stained, washed, and resuspended using an apoptosis kit (Beyotime Biotechnology, C1062L, Shanghai, China) following the instructions outlined by the manufacturer. Finally, the cells were detected on a flow cytometer (BD, FACSAria II, Franklin Lakes, NJ, USA). The data were analyzed utilizing Flow Jo (version 7.6.1, Stamford, USA).
AsPC-1 and PANC-1 cells treated with lactic acid or galloflavin were sorted into the high-lactylation group and the low-lactylation group, respectively. Different concentrations of tamoxifen (Selleck, S1238, Houston, Texas, USA) or doxorubicin (Selleck, E2516, Houston, Texas, USA) was added to a 96-well plate containing three groups of cells, with 104 cells per well. After 24 h, cell counting kit 8 (CCK8) reagent (Beyotime Biotechnology, C0037, Shanghai, China) was added to the plate (10 μL CCK8 + 90 μL DMEM). The plate was subsequently incubated in the dark for 2 h, after which the optical density (OD) was measured at 450 nm (Thermo Fisher Scientific, VLB000D0, Waltham, MA, USA). Cytotoxicity (%) was calculated by comparing the OD of the sample and control. Each sample was tested in three replicates.
After LRRC1 knockdown, AsPC-1 and PANC-1 cells were sorted into the siLRRC1-1 group and the siLRRC1-2 group, respectively. Three groups of cells were seeded into 96-well plates, with each well containing 2000 cells. CCK8 assays were performed daily for 7 consecutive days. Three replicates were used for each sample. Proliferation (%) was calculated by comparing the OD of the sample and control.
The cell culture insert (pore size 8 μm, Corning, 353097, NY, USA) was placed into a 24-well plate. In the upper chamber of the cell culture insert, a total of 8 × 10⁴ cells were seeded with 200 µL of FBS-free DMEM. Next, 600 µL of DMEM supplemented with 20% FBS was added to the 24-well plate. After an incubation period of 24 or 36 h, the cells were fixed and subjected to crystal violet staining (Beyotime Biotechnology, C0121, Shanghai, China). Images of the cells that had invaded/migrated were taken, and the number of cells was quantified using ImageJ (version 1.52, National Institutes of Health, Bethesda, MD, USA). The bottom of the cell culture insert was covered with Matrigel (Biocoat, 354277, Commonwealth of Pennsylvania, USA) in the invasion experiment.
Individual cell suspensions were created in DMEM containing 10% FBS. Four thousand cells/well were inoculated in each group of 6-well plates and gently shaken. The cells were incubated for approximately 7–14 days (culture termination when visible clones appeared). Next, the cells were treated with fixative and subjected to crystal violet staining (Beyotime Biotechnology, C0121, Shanghai, China). Images of the cells were captured, and the quantity of cells was assessed utilizing ImageJ (version 1.52, National Institutes of Health, Bethesda, MD, USA).
Six-well plates were used to culture the cells. Within 24 h, the cell density reached 90%. Scratches on the cells were generated using a pipette tip, and images of the cells at the scratch were taken at 0, 24, and 36 h. The migration area was quantified using ImageJ (version 1.52, National Institutes of Health, Bethesda, MD, USA). The cell migration rate (wound healing rate) was calculated as follows: (initial scratch area – scratch area at a certain moment)/initial scratch area × 100%.
Quantitative data analysis and differential expression analysis were conducted using ImageJ (version 1.52, National Institutes of Health, Bethesda, MD, USA) and GraphPad Prism (version 8.0, La Jolla, CA, USA). The data obtained from flow cytometry analysis were processed using Flow Jo software (version 7.6.1, Stamford, USA). For normally distributed data with uniform variance, the comparison between two groups was conducted using a two-tailed independent-sample t test, while comparison among multiple groups was carried out using one-way ANOVA. All experiments were independently replicated three times. A significance threshold of p < 0.05 was considered to indicate statistical significance. Survival curves were estimated using the Kaplan‒Meier method, and the divergence between curves was evaluated using the log-rank test. The median LacI-3 concentration was determined as the cutoff. For differential expression analysis, the “limma” (version 3.20.9) package was utilized. Cox regression analysis was utilized for both single-variable and multiple-variable analysis, with factors exhibiting a p value less than 0.05 in the single-variable analysis being incorporated into the multiple-variable analysis. “*” indicates the p value in the article. *p < 0.05; **p < 0.01; ***p < 0.001; and ****p < 0.0001.
The landscape of genetic variation in lactylation-related genes in PAAD
Previous research revealed 332 lactylation-related genes [11–13] (Table S1). Using univariate Cox regression analysis, 103 genes related to lactylation with prognostic significance were identified. The forest plot shows the top 20 genes with the lowest p values (Fig. S1A and Table S2). To visualize the somatic mutations in genes associated with lactylation, a waterfall plot was generated, and Kirsten rat sarcoma viral oncogene homolog (KRAS), which is among the most frequently occurring oncogenes in humans, was shown to have the highest somatic mutation rate (Fig. S1B). The degree of amplification and deletion of the chromosome copy number variation (CNV) is shown in Fig. S1C, which exhibited the most significant variation in terms of gene expression among the top 20 genes. The position of the CNV is shown in Fig. S1D.
The LacCluster was related to PAAD patient prognosis
The relationships among lactylation, patient prognosis, and the TIME landscape were explored. Using consensus clustering analysis, PAAD patients (TCGA, n = 177) were divided into 2 LacClusters according to the expression of 103 prognostic lactylation-related genes (Fig. 1A). The results of principal component analysis (PCA) demonstrated effective stratification (Fig. 1B). The survival analysis results indicated that PAAD patients in LacCluster A exhibited a favorable prognosis, whereas patients in LacCluster B had a poor prognosis (p = 0.038; Fig. 1C). Most lactylation-related genes were significantly upregulated in LacCluster B, indicating that lactylation was relatively active. In contrast, LacCluster A exhibited decreased lactylation. A heatmap was constructed to visualize the expression levels of the top 20 lactylation-related genes, which indicated significant differential expression in the different LacClusters and clinicopathological features (Fig. 1D). In conclusion, lactylation was correlated with the prognosis and various clinicopathological characteristics of PAAD patients.
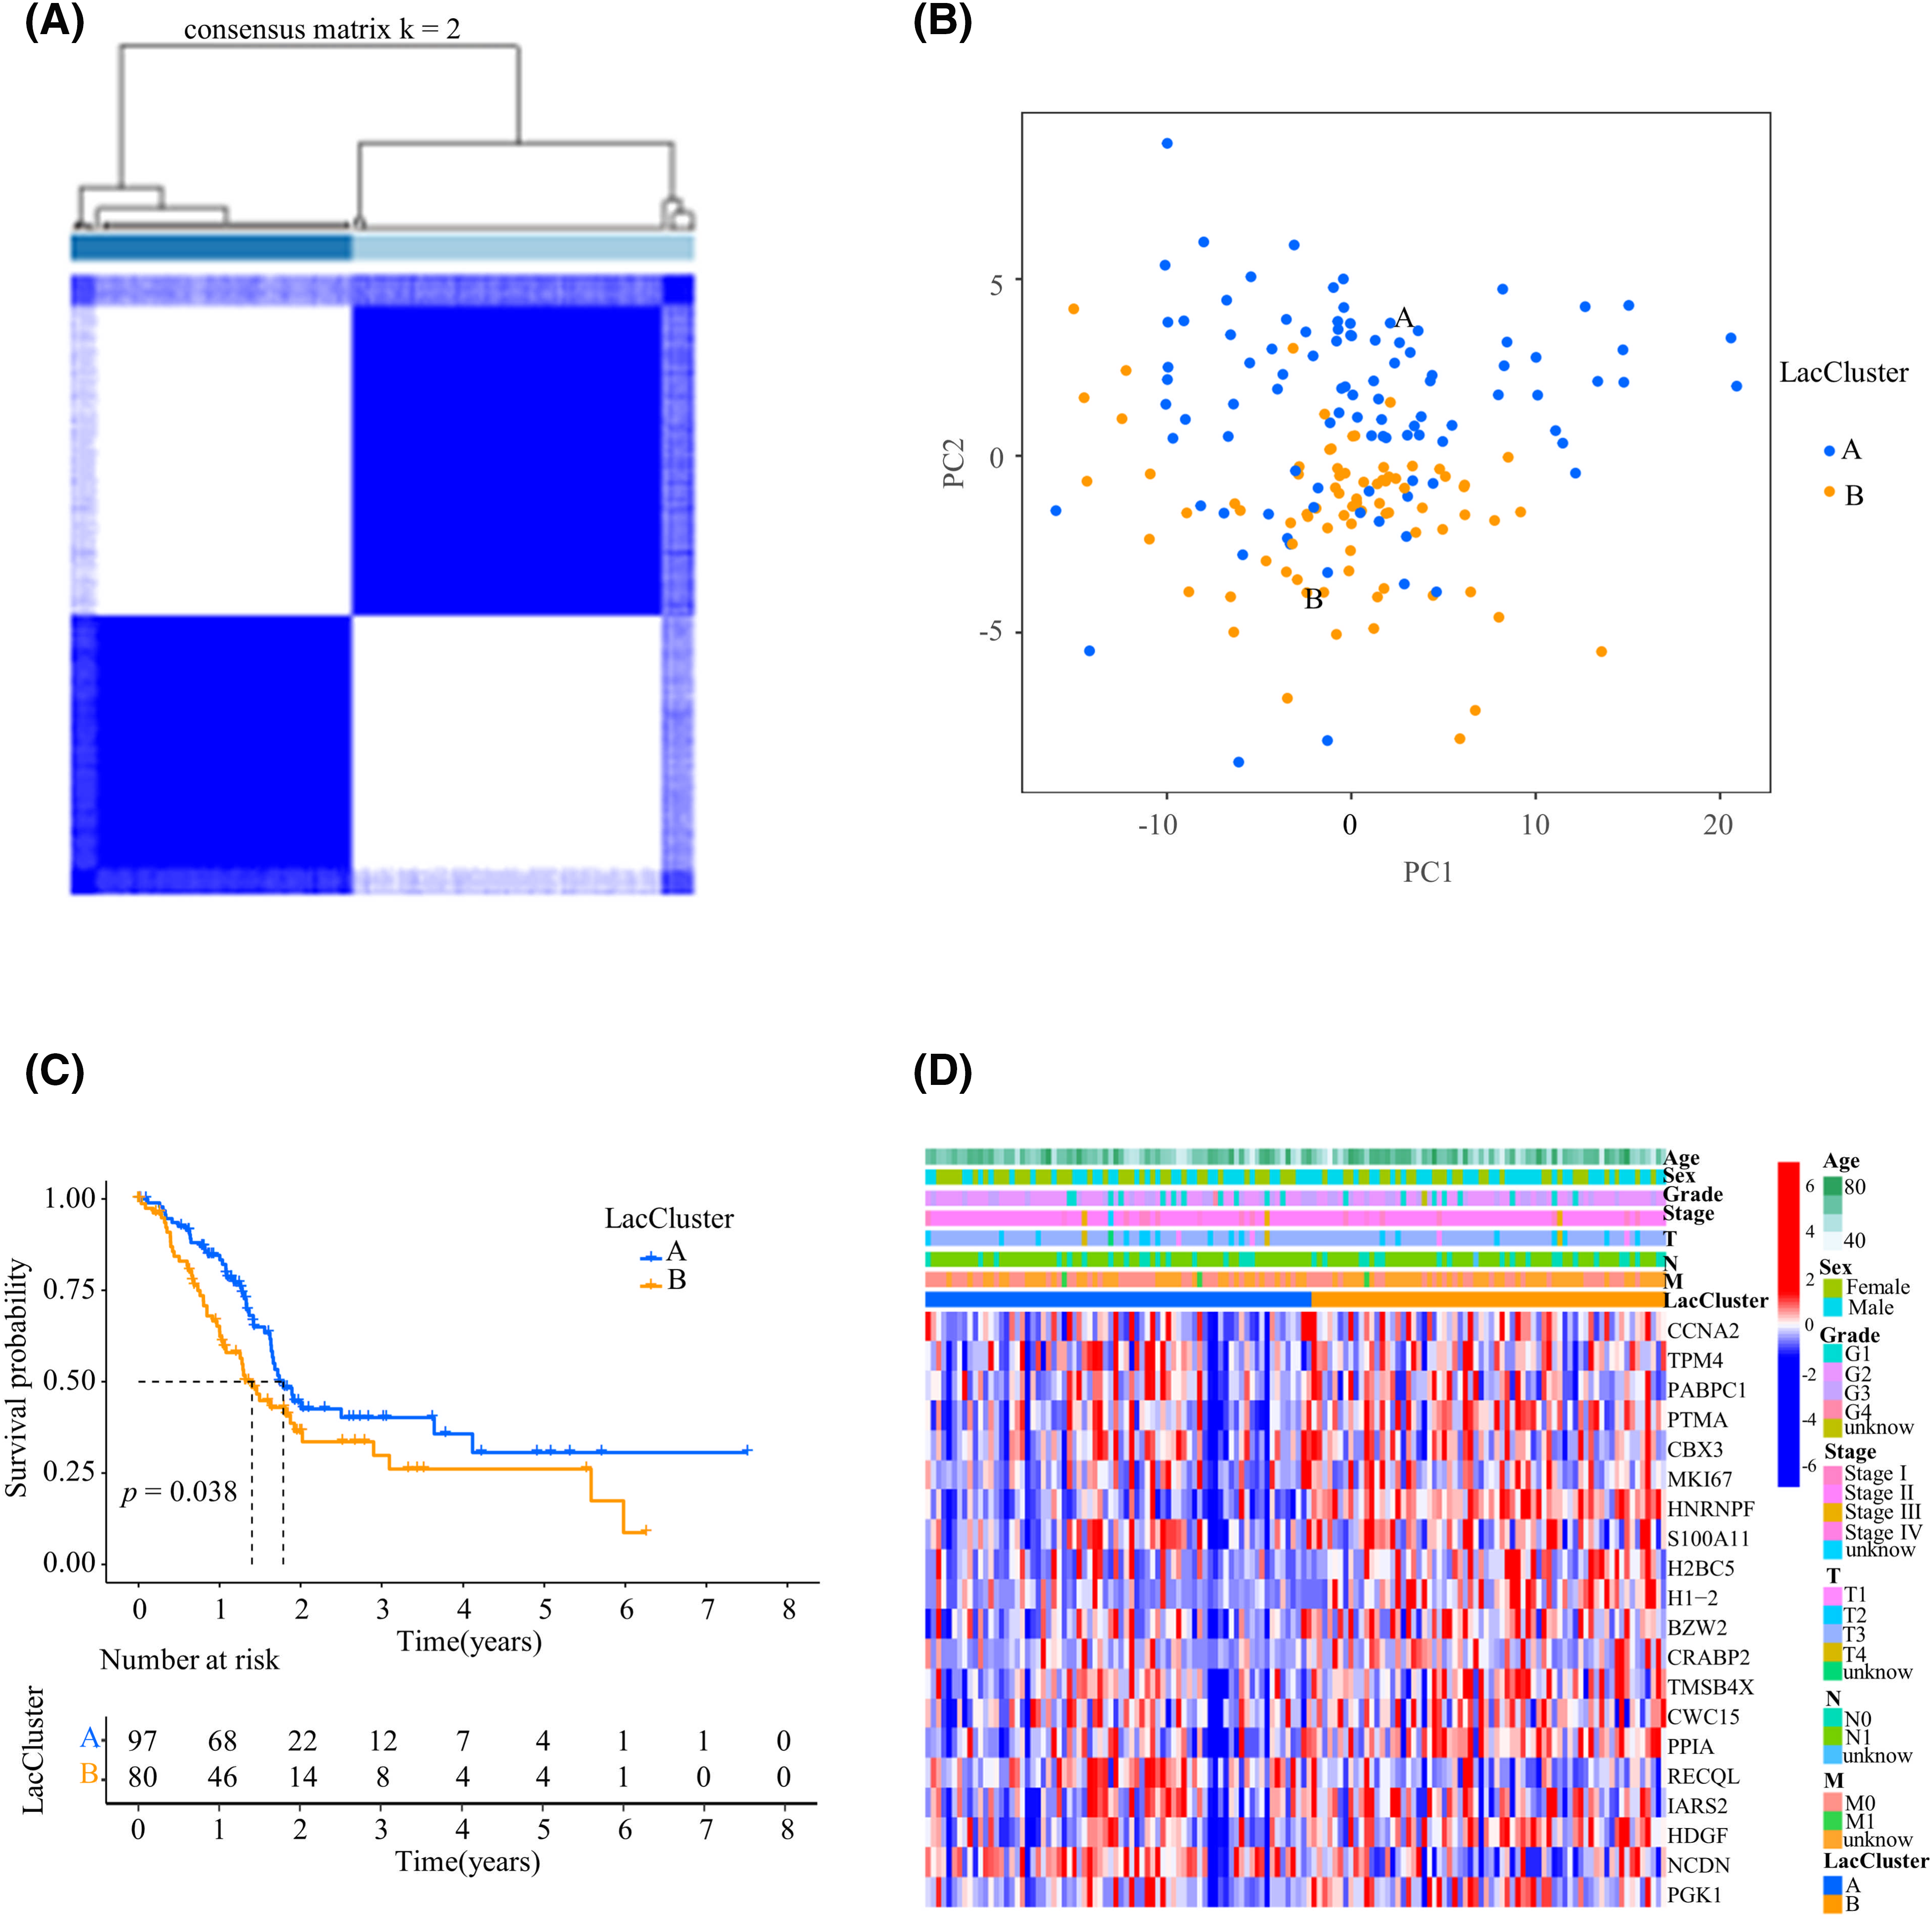
Figure 1: Construction of LacClusters based on lactylation-related genes. (A) Clustering matrix for consensus clustering with a cluster number of 2. (B) Principal component analysis (PCA) of the two LacClusters. (C) Survival analysis of 177 pancreatic adenocarcinoma (PAAD) patients from The Cancer Genome Atlas (TCGA) cohort in the two different LacClusters. (D) Heatmap of the top 20 prognosis-related lactylation-related genes in the two LacClusters. T: primary tumor, N: regional lymph nodes, M: distant metastasis.
The LacCluster-enhanced signature better predicts PAAD patient prognosis
Although 332 genes are associated with lactylation [11–13], there are likely many genes related to lactylation that have not been discovered because research on lactylation is still in its infancy. Therefore, we conducted differential expression analysis between the 2 LacClusters to identify additional potential genes related to lactylation. A total of 2167 DEGs (p < 0.001, |log2FC| > 1.5) were identified between the 2 LacClusters. And then a total of 632 DEGs related to prognosis were detected (Table S3). Then, 177 patients were divided into 2 LacCluster-enhanced cohorts according to the 632 prognosis-related DEGs (Fig. 2A). PCA showed good stratification results (Fig. 2B). Compared with LacCluster-enhanced B patients, LacCluster-enhanced A patients exhibited a significant increase in survival (p = 0.037; Fig. 2C). A comparison of the ROCs of the LacCluster and LacCluster-enhanced cohorts revealed that the LacCluster-enhanced cohort had an advantage in predicting the 3- and 5-year overall survival (OS) of PAAD (LacCluster: LacCluster-enhanced; 1-year: 0.627 vs. 0.620; 3-year: 0.550 vs. 0.573; 5-year: 0.488 vs. 0.532) (Fig. S2A,B). A heatmap was constructed to visually represent the expression of the top 20 prognostic DEGs with significant differences in the different LacCluster-enhanced cohorts and clinicopathological features (Fig. 2D).
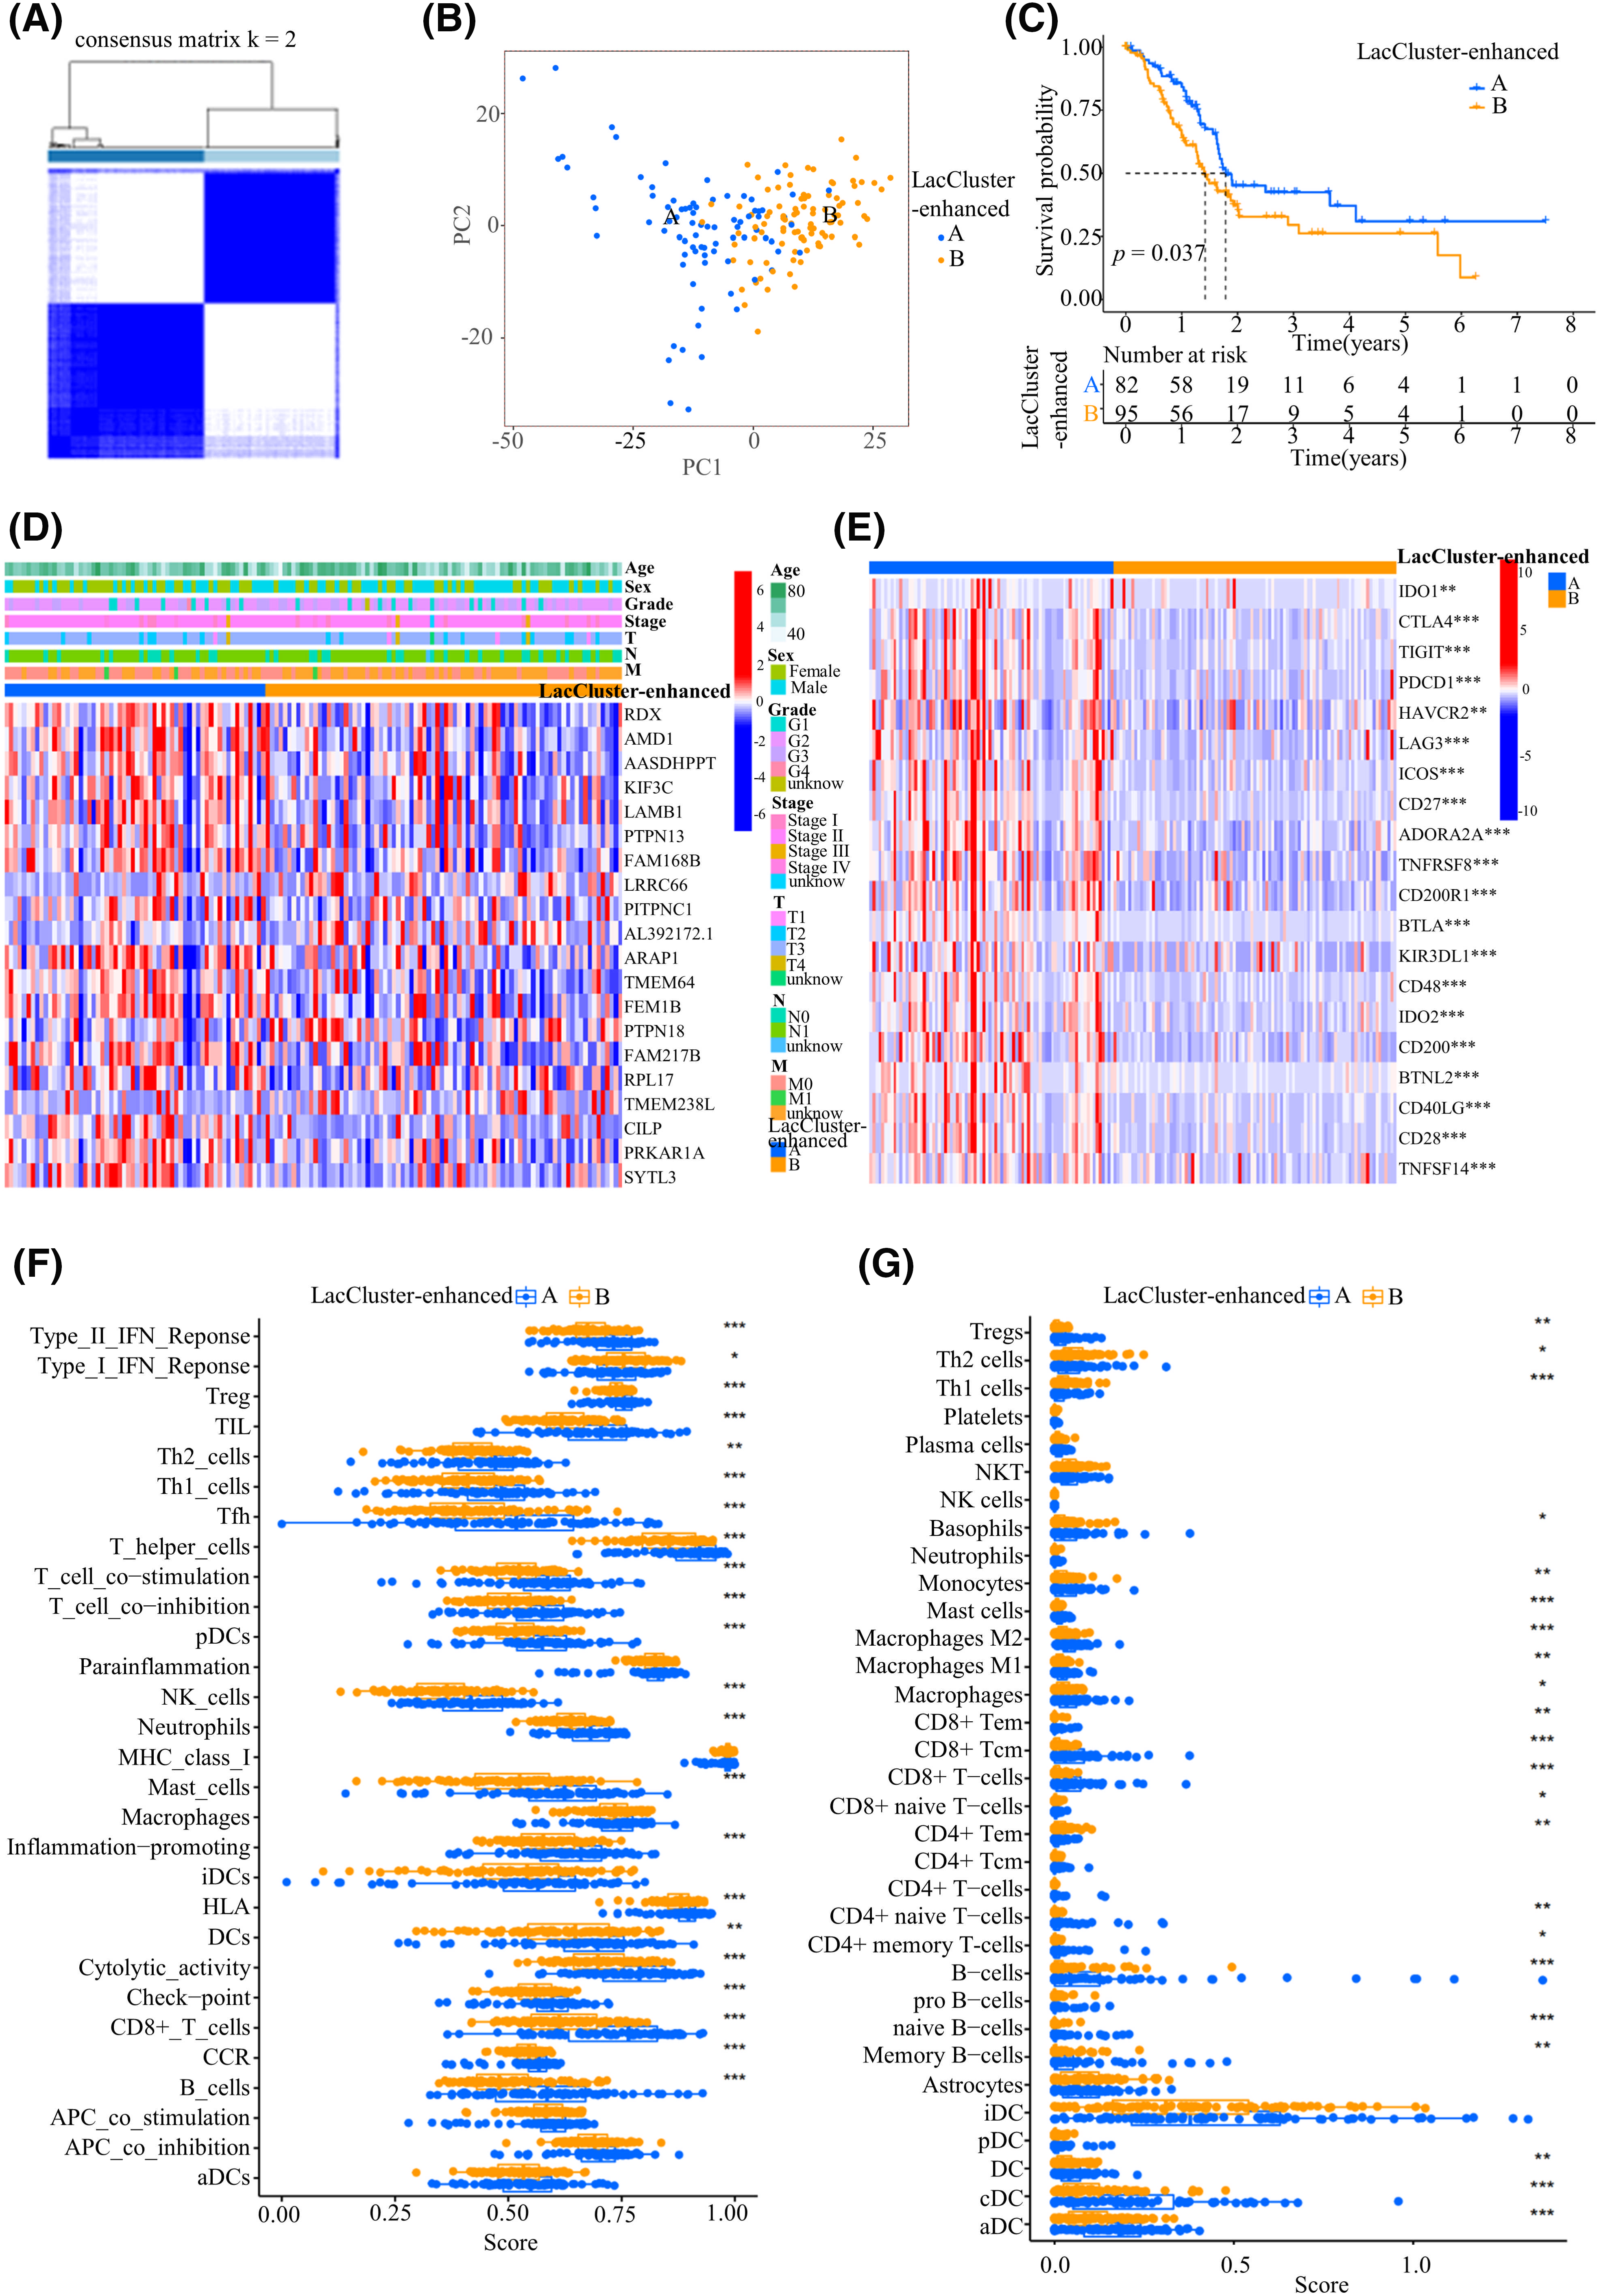
Figure 2: Construction of the LacCluster-enhanced cohorts based on differentially expressed genes (DEGs). (A) Clustering matrix for consensus clustering with a cluster number of 2. (B) PCA for the two LacCluster-enhanced subgroups. (C) Survival analysis of 177 PAAD patients from TCGA cohort in the two different LacCluster-enhanced subgroups. (D) Heatmap of the top 20 prognosis-related DEGs in the two LacCluster-enhanced subgroups. T: primary tumor, N: regional lymph nodes, M: distant metastasis. (E) Differential Analysis of immune checkpoint-related genes was conducted between the two LacCluster-enhanced subgroups. (F) Comparison of immune-related functions between the two LacCluster-enhanced subgroups. (G) xCell was used to analyze the differences in infiltrating immune cells between the two LacCluster-enhanced subgroups. *p < 0.05; **p < 0.01; and ***p < 0.001.
We additionally examined the levels of immune checkpoint molecules and the presence of infiltrating immune cells within different enhanced LacClusters. Interestingly, most immune checkpoint genes, such as IDO1, CTLA4, TIGIT, PDCD1, HAVCR2, LAG3, ICOS, CD27, ADORA2A, TNFRSF8, CD200R1, BTLA, KIR3DL1, CD48, IDO2, CD200, BTNL2, CD40LG, CD28, and TNFSF14, were highly expressed in LacCluster-enhanced A samples, indicating that these patients may benefit from the corresponding monoclonal antibody immunotherapy (Fig. 2E,F). Moreover, many pathways related to immune-related functions, including T-cell coinhibition, T-cell costimulation, checkpoint, inflation promotion, cytotoxic activity, type II interferon (IFN) response, cytokine and cytokine receptor (CCR), and human leukocyte antigen (HLA), were highly activated in the LacCluster-enhanced A samples, which exhibited high levels of antigen presentation and antitumor immunity (Fig. 2F). Furthermore, there was an increase in the majority of infiltrating immune cells in the LacCluster-enhanced A group, which was opposite to the trend observed for lactylation; these cells included various dendritic cells (DCs) (aDCs, cDCs, and DCs), various B cells (B cells, naïve B cells, and memory B cells), various T cells (naïve CD8 T cells, CD8 T cells, memory CD4 T cells, naïve CD4 T cells, and effector memory CD4 T cells), macrophages (M1 and M2), mast cells, and monocytes (Fig. 2F,G). These findings suggested that lactylation was greater in “immune cold tumors” and indicated an unfavorable prognosis.
The lactylation index (LacI-3) derived from the LacCluster-enhanced cohort predicts PAAD patient prognosis
To improve the clinical application of our model, we performed LASSO regression analysis on 632 prognosis-related DEGs, which were lactylation-related genes, in 177 PAAD patients whose prognosis was the output signal. A prognostic prediction model containing three lactylation-related genes, named LacI-3, was established as follows: LacI-3 = PPIA expression × (0.007376) + LRRC1 expression × (0.033445) + ARNT2 expression × (−0.033908) (Fig. S3A,B). Cox regression analysis indicated that PPIA independently contributed to prognosis (Fig. S3C). Next, we conducted internal and external validation of this model. For internal validation, the TCGA dataset was split into test 1 and test 2 sets at a ratio of 4:6. The findings indicated that the model had prognostic significance in both sets (Fig. S4A,B) and could predict OS (Fig. S4C–F).
For external validation, we obtained GSE62452 from the GEO database. Survival analysis indicated that, compared with those in the LacI-3high subgroup in TCGA (training) cohort (Fig. 3A) and GEO (validation) cohort (Fig. 3B), the survival advantage in the LacI-3low subgroup was significant (p = 0.001 and p = 0.046, respectively). TCGA cohort demonstrated areas under the ROC curves (AUCs) of 0.716 for 1 year, 0.673 for 3 years, and 0.749 for 5 years (Fig. 3C). The AUCs for the GSE62452 cohort at 1 year, 3 years, and 5 years were 0.559, 0.700, and 0.730, respectively (Fig. 3D). ROC curve analysis revealed the outstanding performance of LacI-3 in predicting the OS of PAAD patients. PCA revealed identifiable differences between the LacI-3high and LacI-3low groups in the cohorts used for training and validation, respectively (Fig. S5A,B). In addition, the LacI-3high group had a shorter progression-free survival (PFS) compared with the LacI-3low group, indicating that the LacI-3high group was more prone to tumor progression (Fig. 3E). To assess the predictive reliability of the LacI-3 score and clinicopathological characteristics, we plotted the 1-year ROC curve and calculated the AUC. LacI-3 had the highest AUC, which was 0.716 (Fig. 3F). To explore the potential of the LacI-3 level as an independent prognostic indicator, we initially performed univariate Cox regression analysis, which revealed that the LacI-3 level, age, and N stage were significant prognostic factors (Fig. S6A). Furthermore, multivariate Cox analysis indicated that age, N stage, and LacI-3 were independent prognostic factors (Fig. S6B). These findings suggest that the LacI-3 could serve as a predictive indicator for the survival prognosis of patients with PAAD.
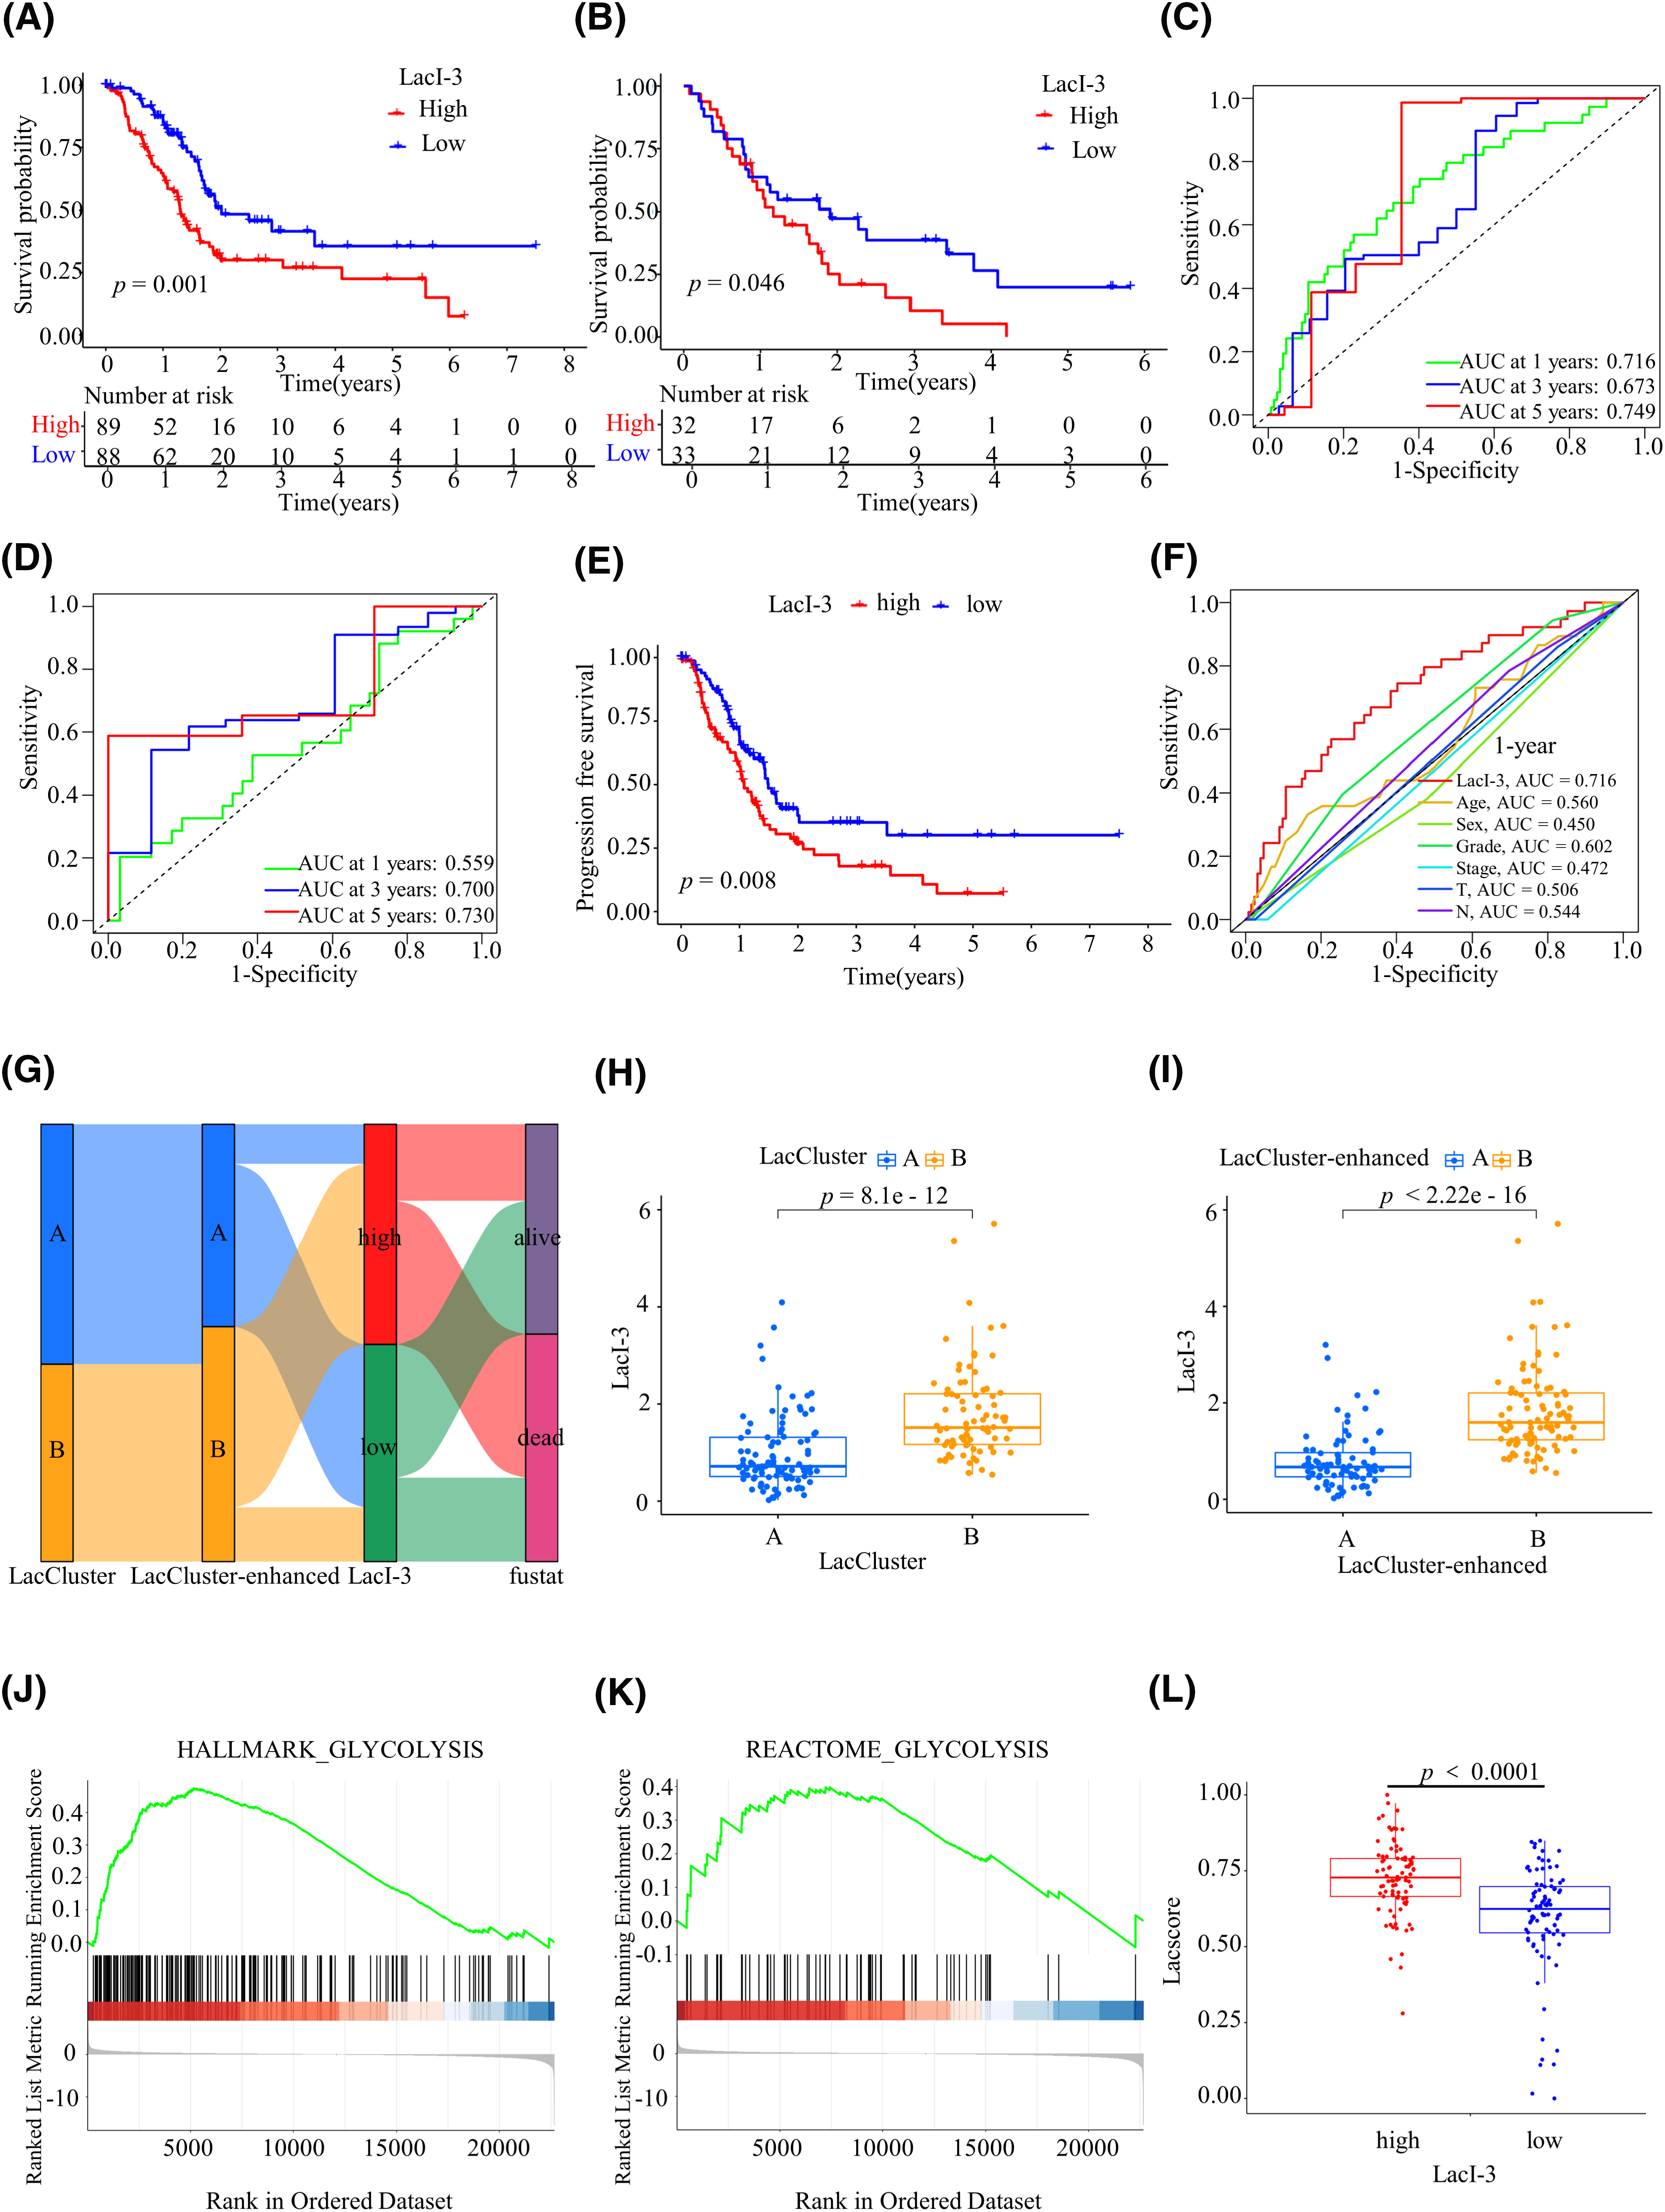
Figure 3: The lactylation index of three genes (LacI-3) were determined. (A) Survival analysis of 177 PAAD patients from TCGA in the LacI-3high and LacI-3low groups. (B) One-year, 3-year, and 5-year receiver operating characteristic (ROC) curves of TCGA cohort. (C) Survival analysis of 65 PAAD patients from GSE62452 in the LacI-3high and LacI-3low groups. (D) One-year, 3-year, and 5-year ROCs of GSE62452. (E) PFS analysis for the LacI-3high and LacI-3low groups based on 177 PAAD patients from TCGA. (F) 1-year ROC of patients stratified according to the LacI-3 score and clinicopathological parameters. (G) Alluvial diagram showing the connection among survival status, LacClusters, LacClusters-enhanced, and LacI-3. The relationship between LacI-3 and LacClusters (H) or enhanced LacClusters (I). (J, K) Gene set enrichment analysis (GSEA). (L) Differential analysis of the lactylation scores between the LacI-3high and LacI-3low groups.
The prognostic efficacy of the three prediction models was compared (Fig. 3G). The LacCluster, LacCluster-enhanced, and LacI-3 clusters showed strong consistency. Compared with those of the LacCluster B (Fig. 3H) and LacCluster-enhanced B (Fig. 3I) cohorts, the LacI-3 levels of the LacCluster A and LacCluster-enhanced A patients were significantly lower (p < 0.001). To further explore the functional attributes of LacI-3, we conducted GSEA of the LacI-3high and LacI-3low groups. The results indicated that the LacI-3high subgroup exhibited enrichment in pathways related to glycolysis, such as the HALLMARK_GLYCOLYSIS (Fig. 3J) and REACTOME_GLYCOLYSIS (Fig. 3K) pathways, which confirmed the positive correlation between LacI-3 and lactylation. Finally, we calculated the lactylation score (lacscore) using ssGSEA of TCGA-PAAD samples, and the analysis results indicated that the LacI-3high subgroup exhibited a greater lacscore, confirming the positive correlation between LacI-3 and lactylation (p < 0.001; Fig. 3L).
In conclusion, the above results suggested that the LacI-3 could serve as a prognostic factor independent of other variables for PAAD.
PAAD patients with higher LacI-3 values displayed greater TMBs
The greater the number of mutations, the greater the number of neoantigen types with immunogenicity and the greater the chance of triggering T-cell responses [19]. A positive correlation was identified between the LacI-3 level and the TMB using spearman correlation analysis (R = 0.49, p < 0.001; Fig. 4A). The TMB in the LacI-3high subgroup was greater than that in the LacI-3low subgroup (p < 0.001; Fig. 4B). Patients exhibiting high TMB experienced worse outcomes than those with low TMB (p = 0.008; Fig. 4C). After the LacI-3 level was integrated with the TMB, analysis of survival outcomes demonstrated that patients in the TMBhighLacI-3high subgroup had the worst prognosis. Patients in the TMBlowLacI-3low, TMBhighLacI-3low subgroups had better prognoses. Unexpectedly, patients in the TMBlowLacI-3high subgroup had the best prognosis, possibly due to the small sample size (only four patients in the TMBlowLacI-3high subgroup) (p < 0.001; Fig. 4D). Moreover, compared with patients in the LacI-3low subgroup, patients in the LacI-3high subgroup had a significantly greater frequency of somatic mutations, especially in KRAS (81% vs. 40%), TP53 (68% vs. 43%), SMAD family member 4 (SMAD4) (24% vs. 19%), cyclin-dependent kinase inhibitor 2A (CDKN2A) (26% vs. 9%), and titin (TTN) (14% vs. 9%; Fig. 4E,F). In summary, high TMBs, high LacI-3 values, and high frequencies of somatic mutations indicated poor prognoses in PAAD patients.
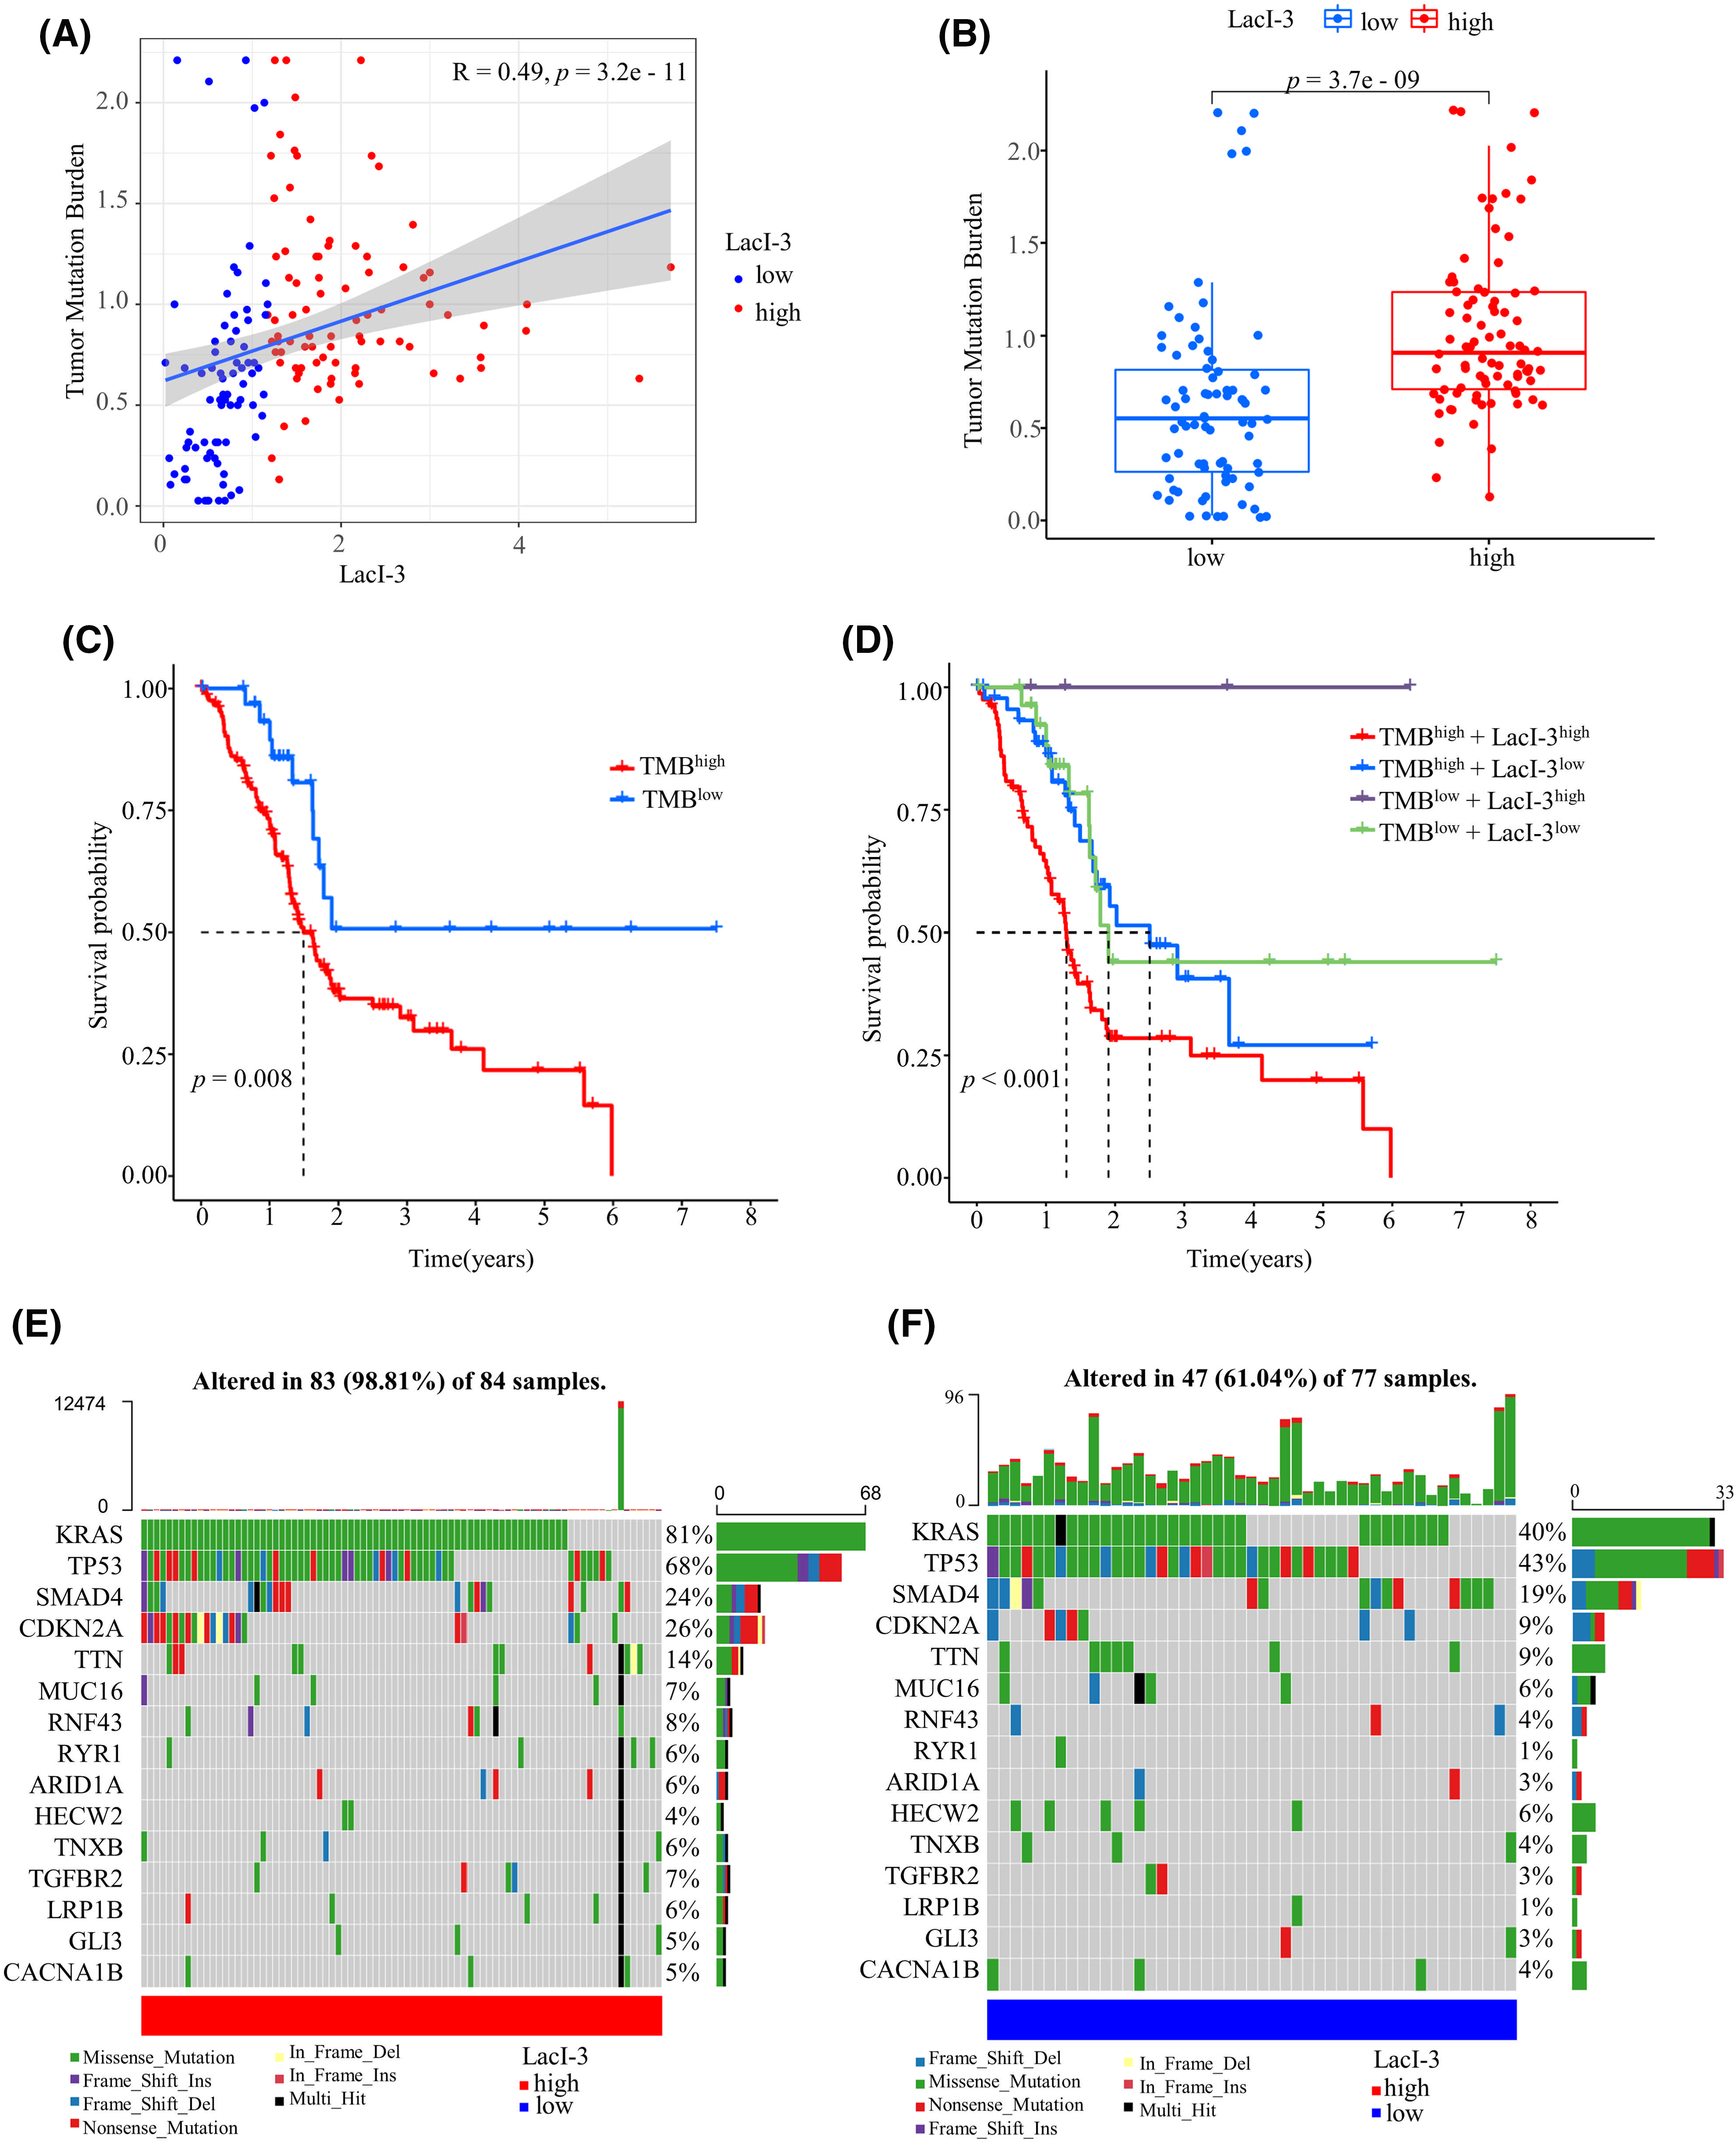
Figure 4: Analysis of tumor mutation burden (TMB) between the LacI-3high and LacI-3low groups. (A) Correlation analysis of the TMB and LacI-3 score. (B) Differential analysis of TMB between the LacI-3high and LacI-3low groups. (C) Survival analysis of the high- and low-TMB groups. (D) Survival analysis integrating the TMB and LacI-3 score. Waterfall diagram of gene mutations in the LacI-3high (E) and LacI-3low groups (F).
PAAD patients with high LacI-3 values displayed “cold” TIME landscapes
ESTIMATE immune infiltration analysis revealed significant correlations between low LacI-3 expression and high immune, stromal, and ESTIMATE scores, indicating an increase in the abundance of infiltrating immune cells (Fig. 5A). To delve deeper into the association between LacI-3 and the TIME, an examination was conducted to scrutinize variances in immune checkpoints and immune cells. The LacI-3low subgroup exhibited increased expression of immune checkpoint genes, including TIGIT, PDCD1, HAVCR2, ICOS, BTLA, CTLA4, and IDO2; the above results revealed the potential benefits of immune checkpoint inhibitor treatment (Fig. 5B). Moreover, the LacI-3low group exhibited active signal transduction and antitumor effects, including TIL, HLA and T-cell coinhibitory effects, T-cell costimulation, cytolytic activity, and a type II IFN response (Fig. 5C). In addition, the results of the xCell algorithm showed that various immune cells related to immune-mediated killing, such as various DCs, B cells, T cells, macrophages, mast cells, and monocytes, were highly abundant in the LacI-3low group (Figs. 5C,D). CIBERSORT immune infiltration analysis revealed that plasma cells, resting DCs, monocytes, activated memory CD4 T cells, and CD8 T cells were negatively correlated with LacI-3 (Fig. 5E). In summary, the LacI-3low subgroup is characterized by a “hot” immune phenotype associated with high levels of antitumor immune cell infiltration, indicating a good response to various treatment options, especially immunotherapy.
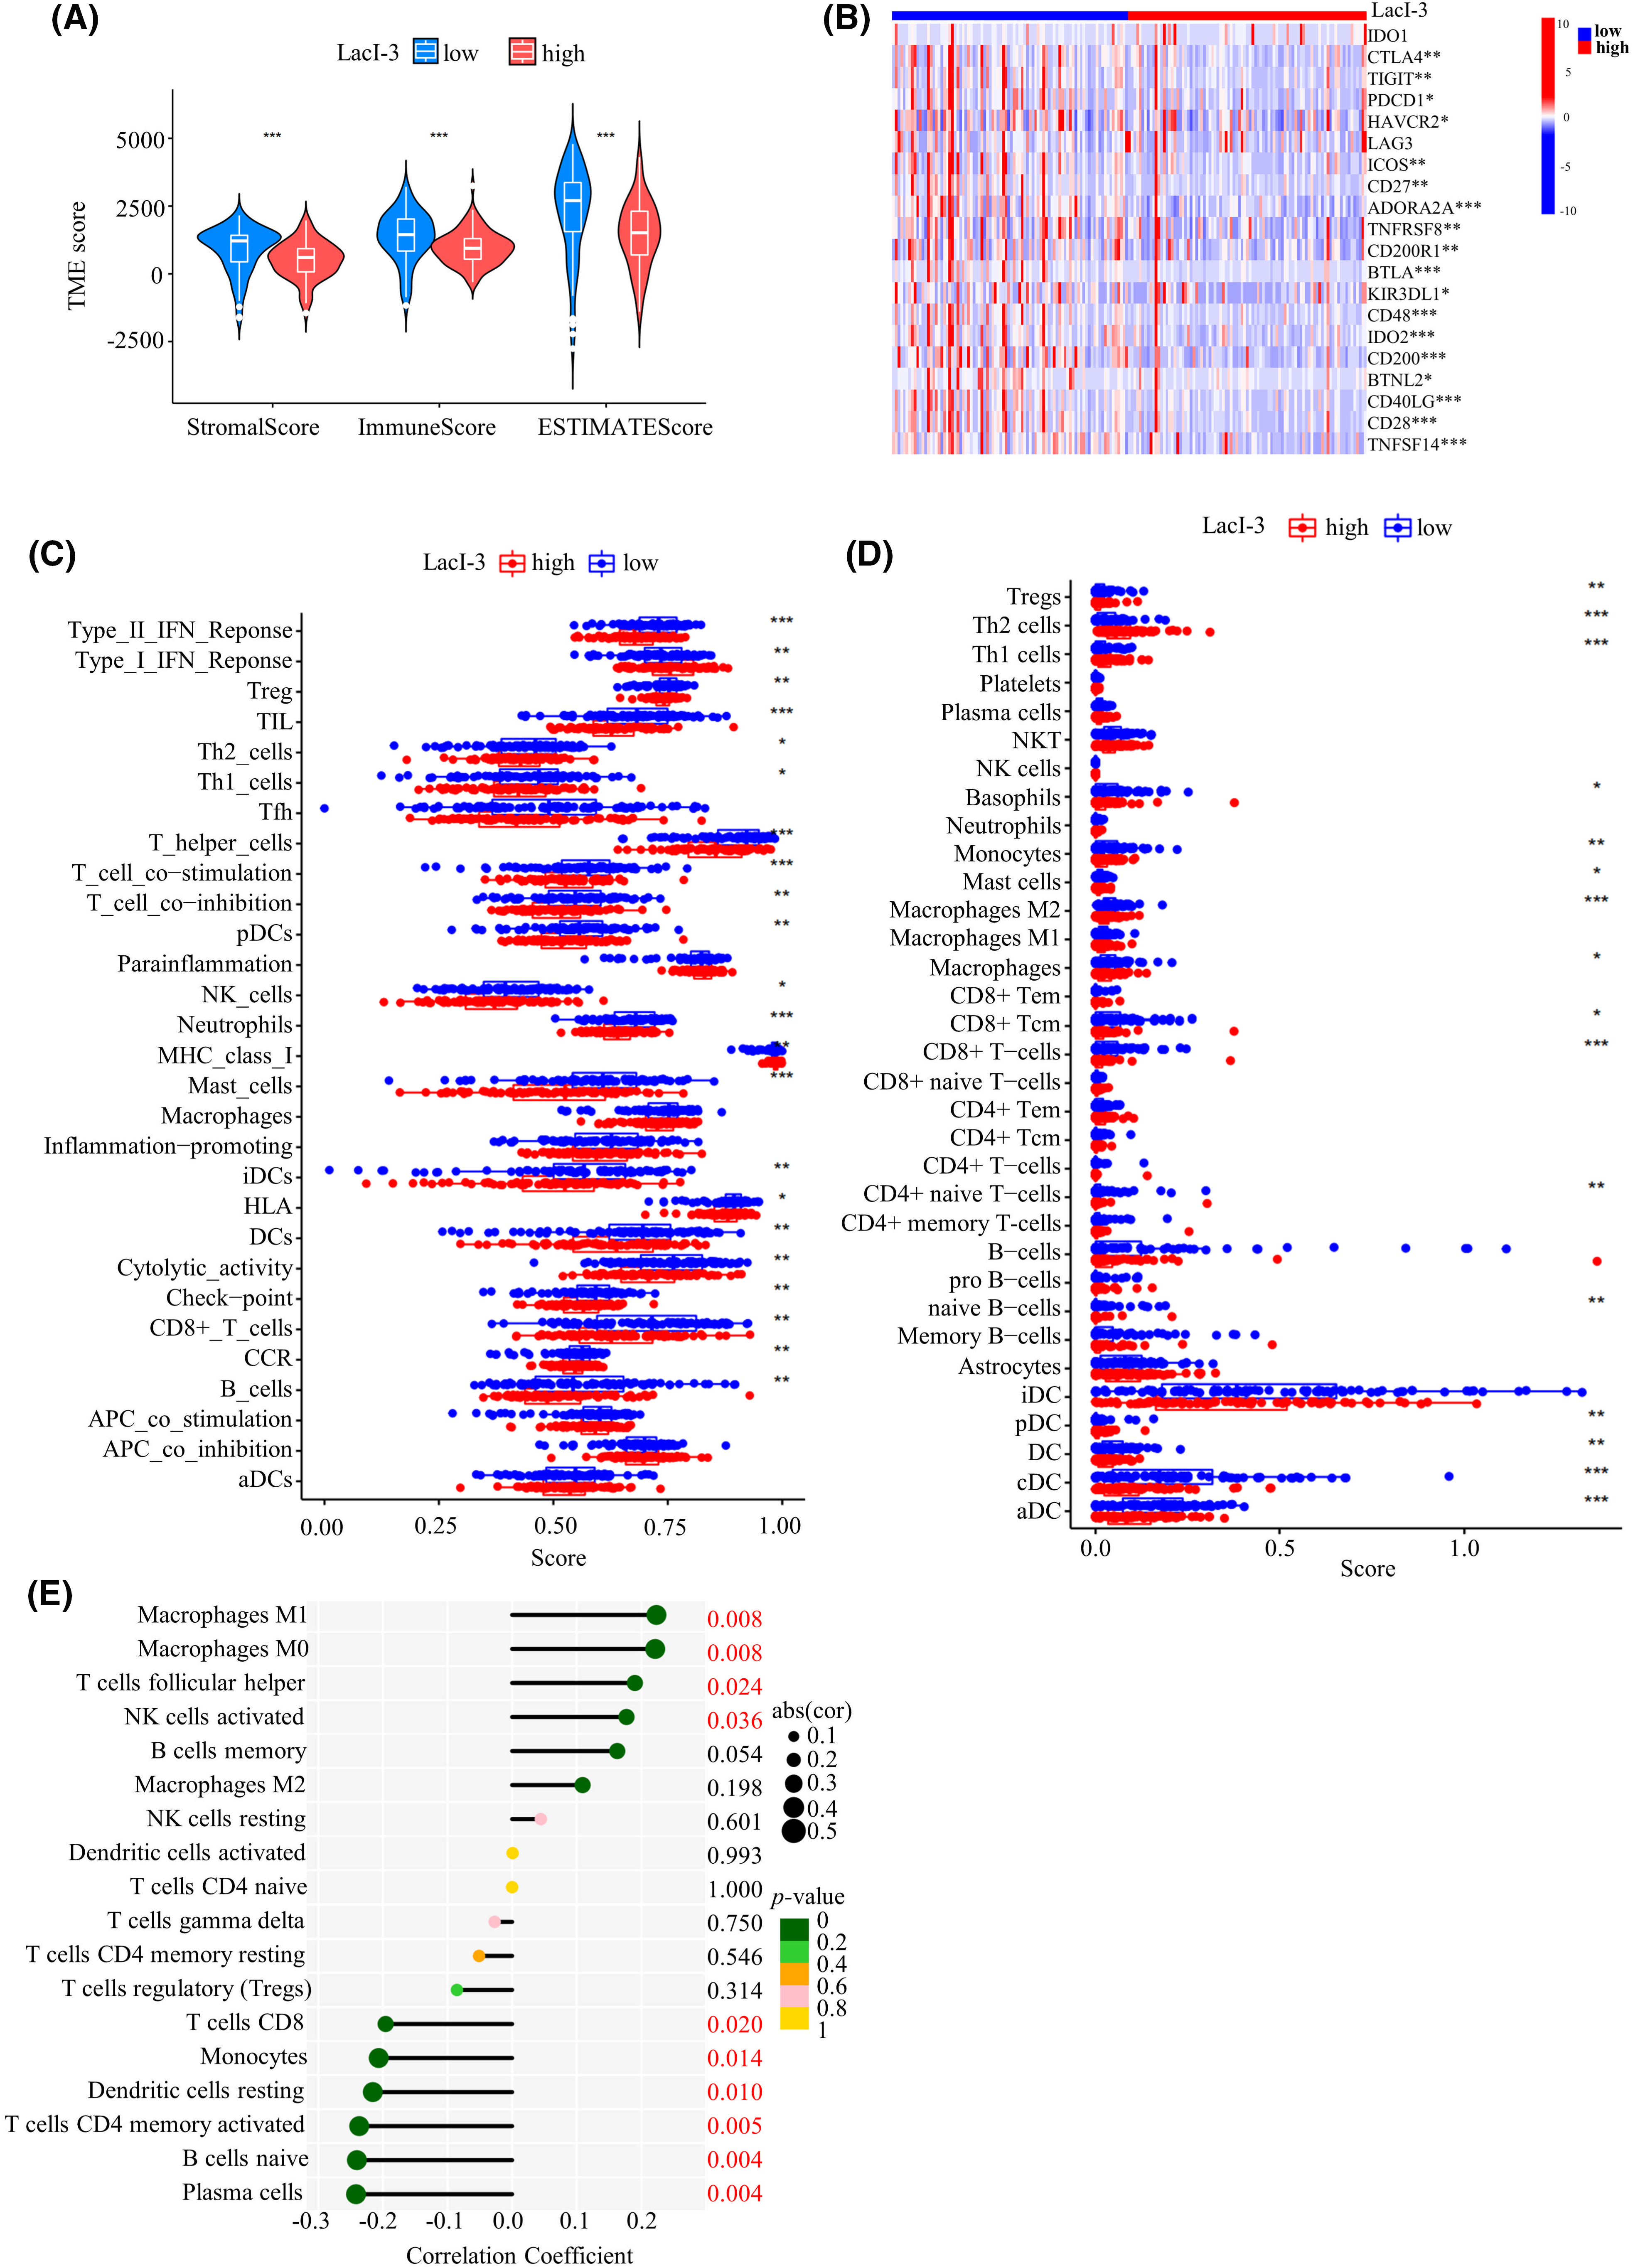
Figure 5: Analysis of the tumor immune microenvironment (TIME) in the LacI-3high and LacI-3low groups. (A) ESTIMATE analysis. (B) Differential expression of immune checkpoint genes. (C) Comparison of immune-related functions using ssGSEA. (D) Analysis of infiltrating immune cells using xCell. (E) Analysis of infiltrating immune cells using CIBERSORT. *p < 0.05; **p < 0.01; ***p < 0.001.
The LacI-3 value predicts the drug sensitivity of PAAD patients
To explore the significance of this scoring system in guiding the clinical treatment of PAAD patients, we performed a drug sensitivity assessment to determine the half-maximal inhibitory concentration (IC50) of 251 chemotherapy drugs in the LacI-3high and LacI-3low groups. There were 121 drugs with differences in IC50 between the LacI-3high and LacI-3low groups. Patients in the LacI-3high subgroup exhibited sensitivity to 40 drugs, while patients in the LacI-3low subgroup exhibited sensitivity to 81 drugs (Table S4). Various drugs commonly used in clinical tumor treatment, such as tamoxifen (Fig. 6A) and doxorubicin (Fig. 6B), were included. Tamoxifen showed greater efficacy in patients with low LacI-3, whereas doxorubicin demonstrated greater effectiveness in patients with high LacI-3. We treated AsPC-1 and PANC-1 cells with lactic acid to increase lactylation and treated them with the lactate dehydrogenase inhibitor galloflavin to reduce lactylation. WB analysis revealed that the control group exhibited moderate levels of lactylation, the lactic acid-treated group displayed high levels of lactylation, and the galloflavin-treated group demonstrated low levels of lactylation, confirming that we successfully constructed three groups of cells (Fig. 6C). The IC50 values of tamoxifen and doxorubicin were compared among the three groups. The IC50 of tamoxifen in the low-lactylation group was the lowest (AsPC-1: 12.42 μM, PANC-1: 7.33 μM), and that in the high-lactylation group was the highest (AsPC-1: 34.42 μM, PANC-1: 18.98 μM). However, the IC50 of doxorubicin in the low-lactylation group was the highest (AsPC-1: 27.17 μM, PANC-1: 19.52 μM), and that in the high-lactylation group was the lowest (AsPC-1: 10.48 μM, PANC-1: 5.29 μM) (Fig. 6D). The results of the apoptosis experiments indicated that the low-lactylation group increased the percentage of apoptotic cells after tamoxifen treatment, whereas the high-lactylation group increased the percentage of apoptotic cells after doxorubicin treatment (Fig. 6E,F). In conclusion, these findings offer a basis for categorizing PAAD patients based on treatment stratification.
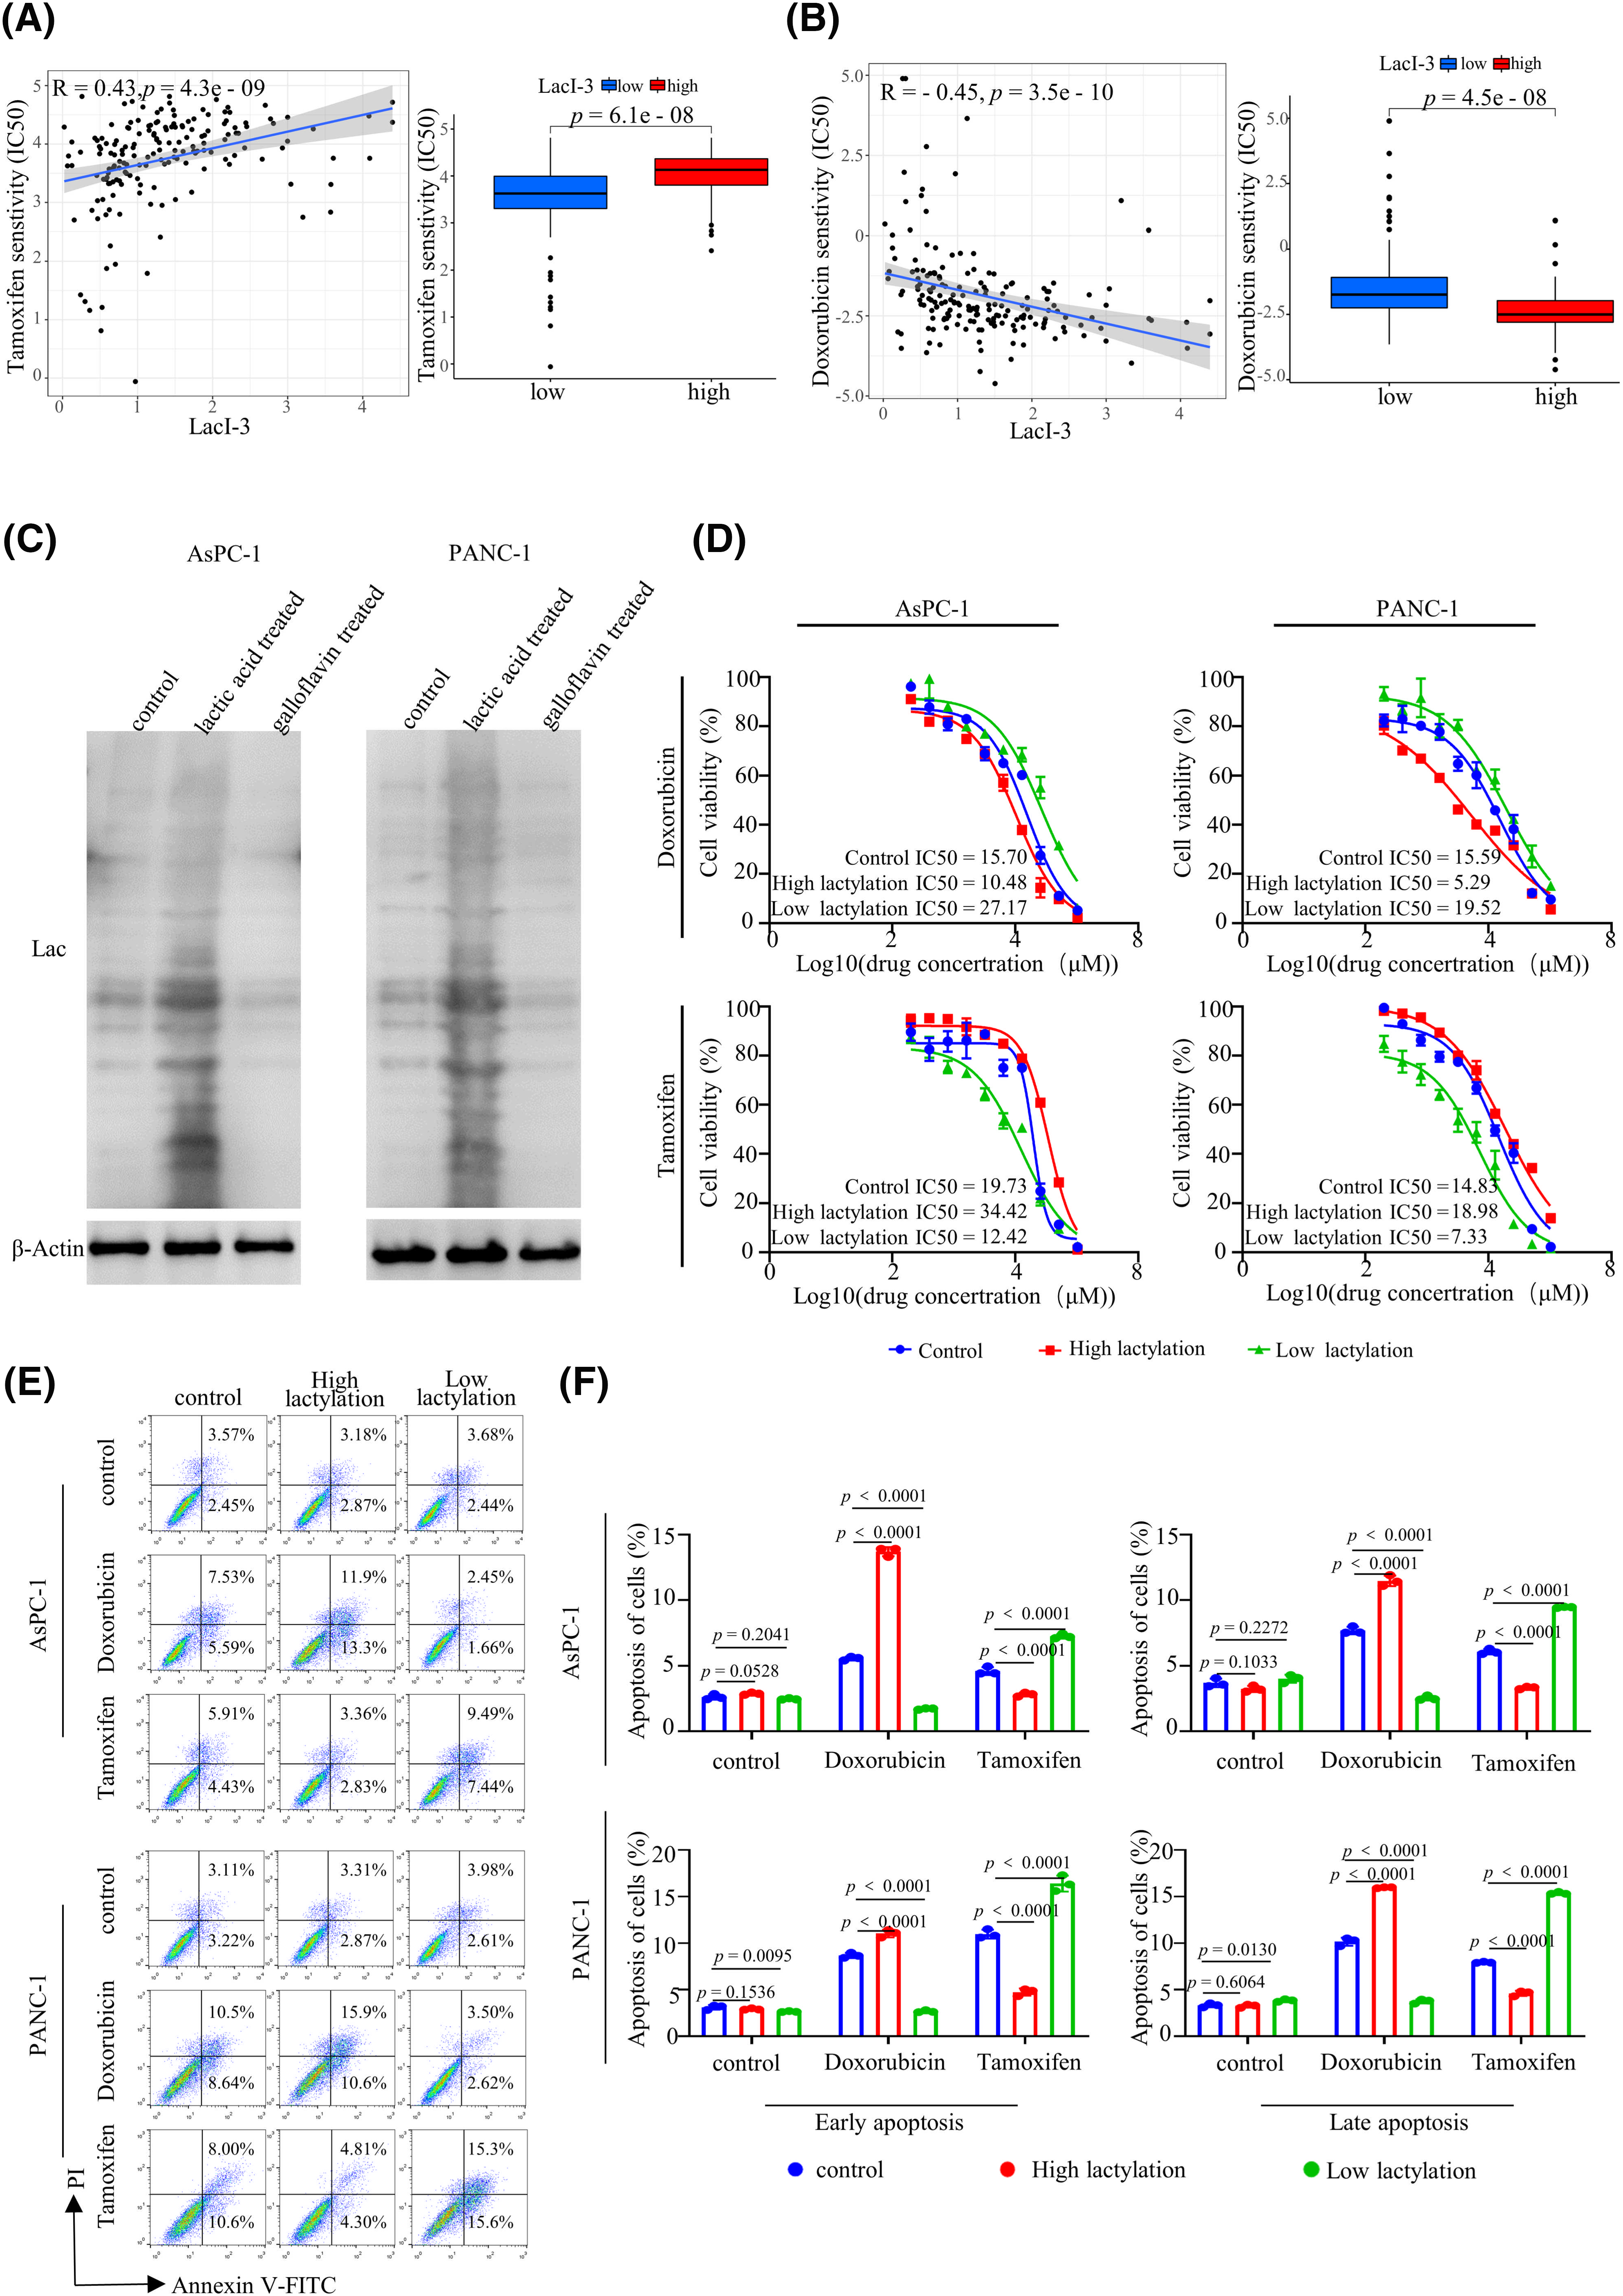
Figure 6: Drug sensitivity analysis of the LacI-3high and LacI-3low groups. Correlation analysis and differential analysis of sensitivity to tamoxifen (A) and doxorubicin (B). (C) Western blotting of lactylation in different groups (cells were treated with lactic acid to increase lactylation and the lactate dehydrogenase inhibitor galloflavin to reduce lactylation). (D) Cell viability in different groups treated with doxorubicin and tamoxifen. (E, F) Early and late apoptosis of AsPC-1 and PANC-1 cells in different groups treated with doxorubicin and tamoxifen. Quantitative data analysis was conducted using ImageJ and GraphPad Prism 8. All experiments were independently repeated (n = 3).
LRRC1 was the hub gene in LacI-3
In the scoring system, we analyzed the expression of hub genes and observed that LRRC1 was significantly overexpressed in PAAD tumor tissues compared with adjacent tissues. This finding was validated at the protein level using immunohistochemistry (IHC) data downloaded from the Human Protein Atlas (HPA) website (https://www.proteinatlas.org/, accessed on 01/04/2024) (Figs. S7B–D). PPIA and LRRC1 expression predicted poor patient prognosis (Fig. S8A,B). ARNT2 expression predicted a good prognosis (Fig. S8C). The ROC curve indicated that LRRC1 had AUC values above 0.6 at 1 year, 3 years, and 5 years; thus, LRRC1 plays a crucial role in predicting the outcome of patients with PAAD (Fig. S8D–F). In addition, increased expression of PPIA and LRRC1 was related to increased mortality (Fig. S8G) and decreased disease-specific survival (DSS) (Fig. S8H) and PFS (Fig. S8I). Nevertheless, no notable differences in the mRNA or protein levels of the prognostic genes PPIA and ARNT2 were detected between cancer tissues and adjacent tissues; thus, these genes had low predictive value for prognosis (Figs. S7A,C,D, S8D–F).
In addition, PPIA is a known lactylation-related gene, whereas the LRRC1 and ARNT2 genes identified in this study have not previously been shown to be related to lactylation. The 177 patients with PAAD were grouped into two categories based on the median of LRRC1. According to the results of the differential expression analysis, 226 genes associated with lactylation exhibited a high level of expression in the high-LRRC1 subgroup (Fig. S9A).
Previous research has shown that the E1A binding protein P300 (EP300) is a lactylase (writer) and that histone deacetylase 1-3 (HDAC1-3) and sirtuin1-3 (SIRT1-3) are delacetyltransferases (erasers) [11,12]. Correlation analysis revealed positive correlations between LRRC1 and EP300, HDAC1-3, and SIRT1 (Fig. S9B). After analyzing the data provided, it can be inferred that the LRRC1 gene may be associated with lactylation, indicating the importance of conducting additional research on the role of LRRC1.
Due to limited research on LRRC1, we conducted functional phenotype experiments on LRRC1 in vitro. First, LRRC1 mRNA expression was assessed in both normal pancreatic cells and PAAD cells using RT‒qPCR. The findings showed that LRRC1 expression in AsPC-1 cells was 11-fold greater than that in HPDE6-C7 cells and that in PANC-1 cells was 2-fold greater than that in HPDE6-C7 cells (Fig. 7A). Next, LRRC1 was knocked down by more than 50% in AsPC-1 (Fig. 7B) and PANC-1 (Fig. S10A) cells using siRNA, and the knockdown efficiency was determined with RT‒qPCR. To investigate the role of LRRC1 in PAAD, we conducted experiments on cell proliferation, invasion, migration, and apoptosis. Proliferation experiments showed that knocking down LRRC1 significantly inhibited AsPC-1 (Fig. 7C) and PANC-1 cell proliferation (Fig. S10B). The colony formation experiment showed that knocking down LRRC1 significantly inhibited the colony formation of AsPC-1 (Fig. 7D) and PANC-1 cells (Fig. S10C). Wound healing and transwell experiments showed that knocking down LRRC1 reduced AsPC-1 (Figs. 7E and 7F) and PANC-1 cell migration and invasion (Fig. S10D,E). The flow cytometry results using PI/Annexin V-FITC indicated that knocking down LRRC1 led to an increase in both early and late apoptosis in AsPC-1 (Fig. 7G) and PANC-1 cells (Fig. S10F). In summary, our findings confirmed that LRRC1 enhances PAAD cell invasion, migration, proliferation, and colony formation while suppressing apoptosis in vitro.
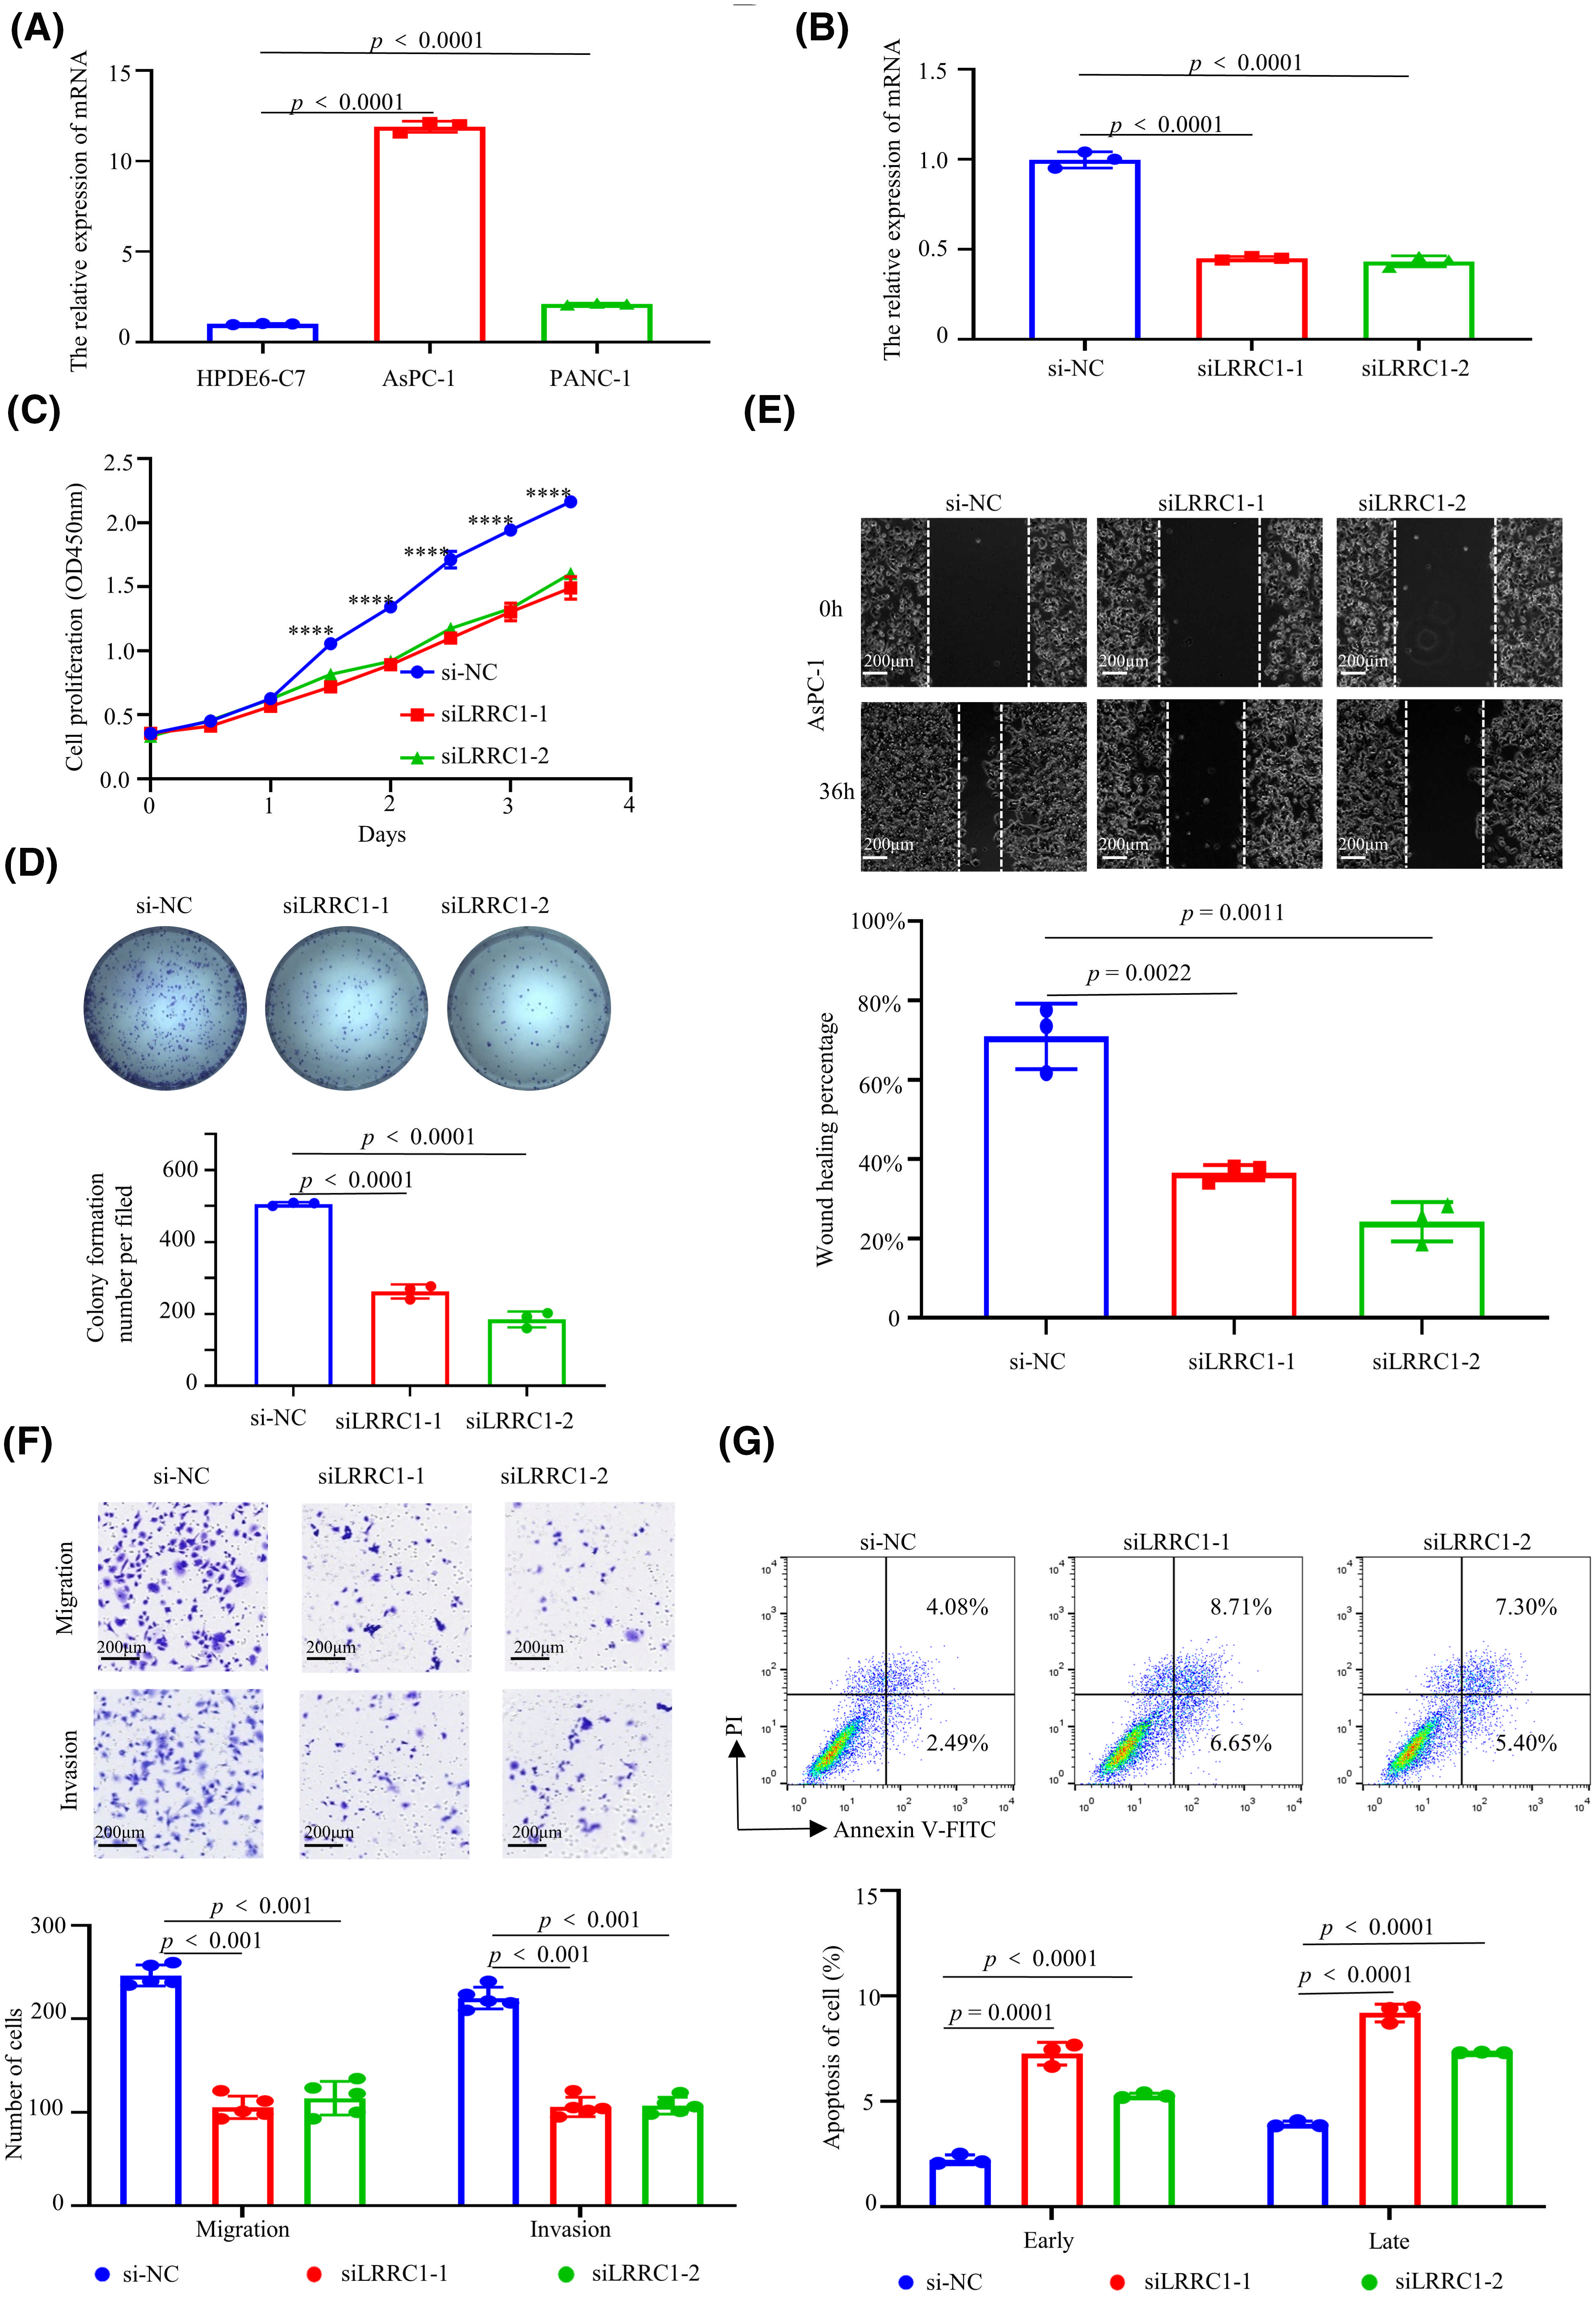
Figure 7: The function of leucine rich repeat containing 1 (LRRC1) in AsPC-1 cells. (A) LRRC1 mRNA expression in normal (HPDE6-C7) and PAAD (AsPC-1 and PANC-1) cells. (B) LRRC1 mRNA expression in AsPC-1 cells after LRRC1 knockdown. (C) Proliferation of AsPC-1 cells after LRRC1 knockdown was determined using a cell counting kit 8 (CCK8) assay. (D) Colony formation of AsPC-1 cells after LRRC1 knockdown was assessed using a plate cloning assay. (E) AsPC-1 cell migration after LRRC1 knockdown was assessed using a wound healing assay. (F) The migration and invasion of AsPC-1 cells after LRRC1 knockdown were determined using a transwell assay. (G) PI/annexin V flow cytometry analysis of early and late apoptosis in AsPC-1 cells after LRRC1 knockdown. Quantitative data analysis was conducted using ImageJ and GraphPad Prism 8. Scale bars: 200 μm. ****p < 0.0001. All experiments were independently repeated (n = 3).
The LacI-3 value predicts the TIME landscape and the prognosis of pan-cancer patients
To demonstrate the clinical value of LacI-3, we conducted a pan-cancer analysis. Prognostic analysis was also conducted for 32 types of tumors, excluding PAAD, utilizing data downloaded from TCGA (Fig. 8, Fig. S11). The results showed that LacI-3 was predictive of OS in 12 types of cancers (p < 0.05), such as breast invasive carcinoma (BRCA), lung adenocarcinoma (LUAD), rectum adenocarcinoma (READ), sarcoma (SARC), mesothelioma (MESO), thymoma (THYM), kidney clear cell carcinoma (KIRC), colon adenocarcinoma (COAD), uterine corpus endometrial carcinoma (UCEC), liver hepatocellular carcinoma (LIHC), uveal melanoma (UVM), and lung squamous cell carcinoma (LUSC) (Fig. 8). A high level of LacI-3 indicated a poor prognosis in BRCA, SARC, UCEC, LIHC, and LUAD patients but indicated a good prognosis in COAD, READ, MESO, THYM, KIRC, UVM, and LUSC patients. These findings indicated the potential for lactylation to exert varying effects on distinct types of tumors. The xCell algorithm was used for the 12 types of cancers mentioned above, and the results showed that for COAD, READ, LIHC, LUAD, and LUSC patients, LacI-3 was negatively associated with immune cell infiltration, whereas LacI-3 was positively associated with immune cell infiltration in UCEC patients (Fig. S12). In summary, LacI-3 can predict prognosis and immune infiltration in cancer patients.
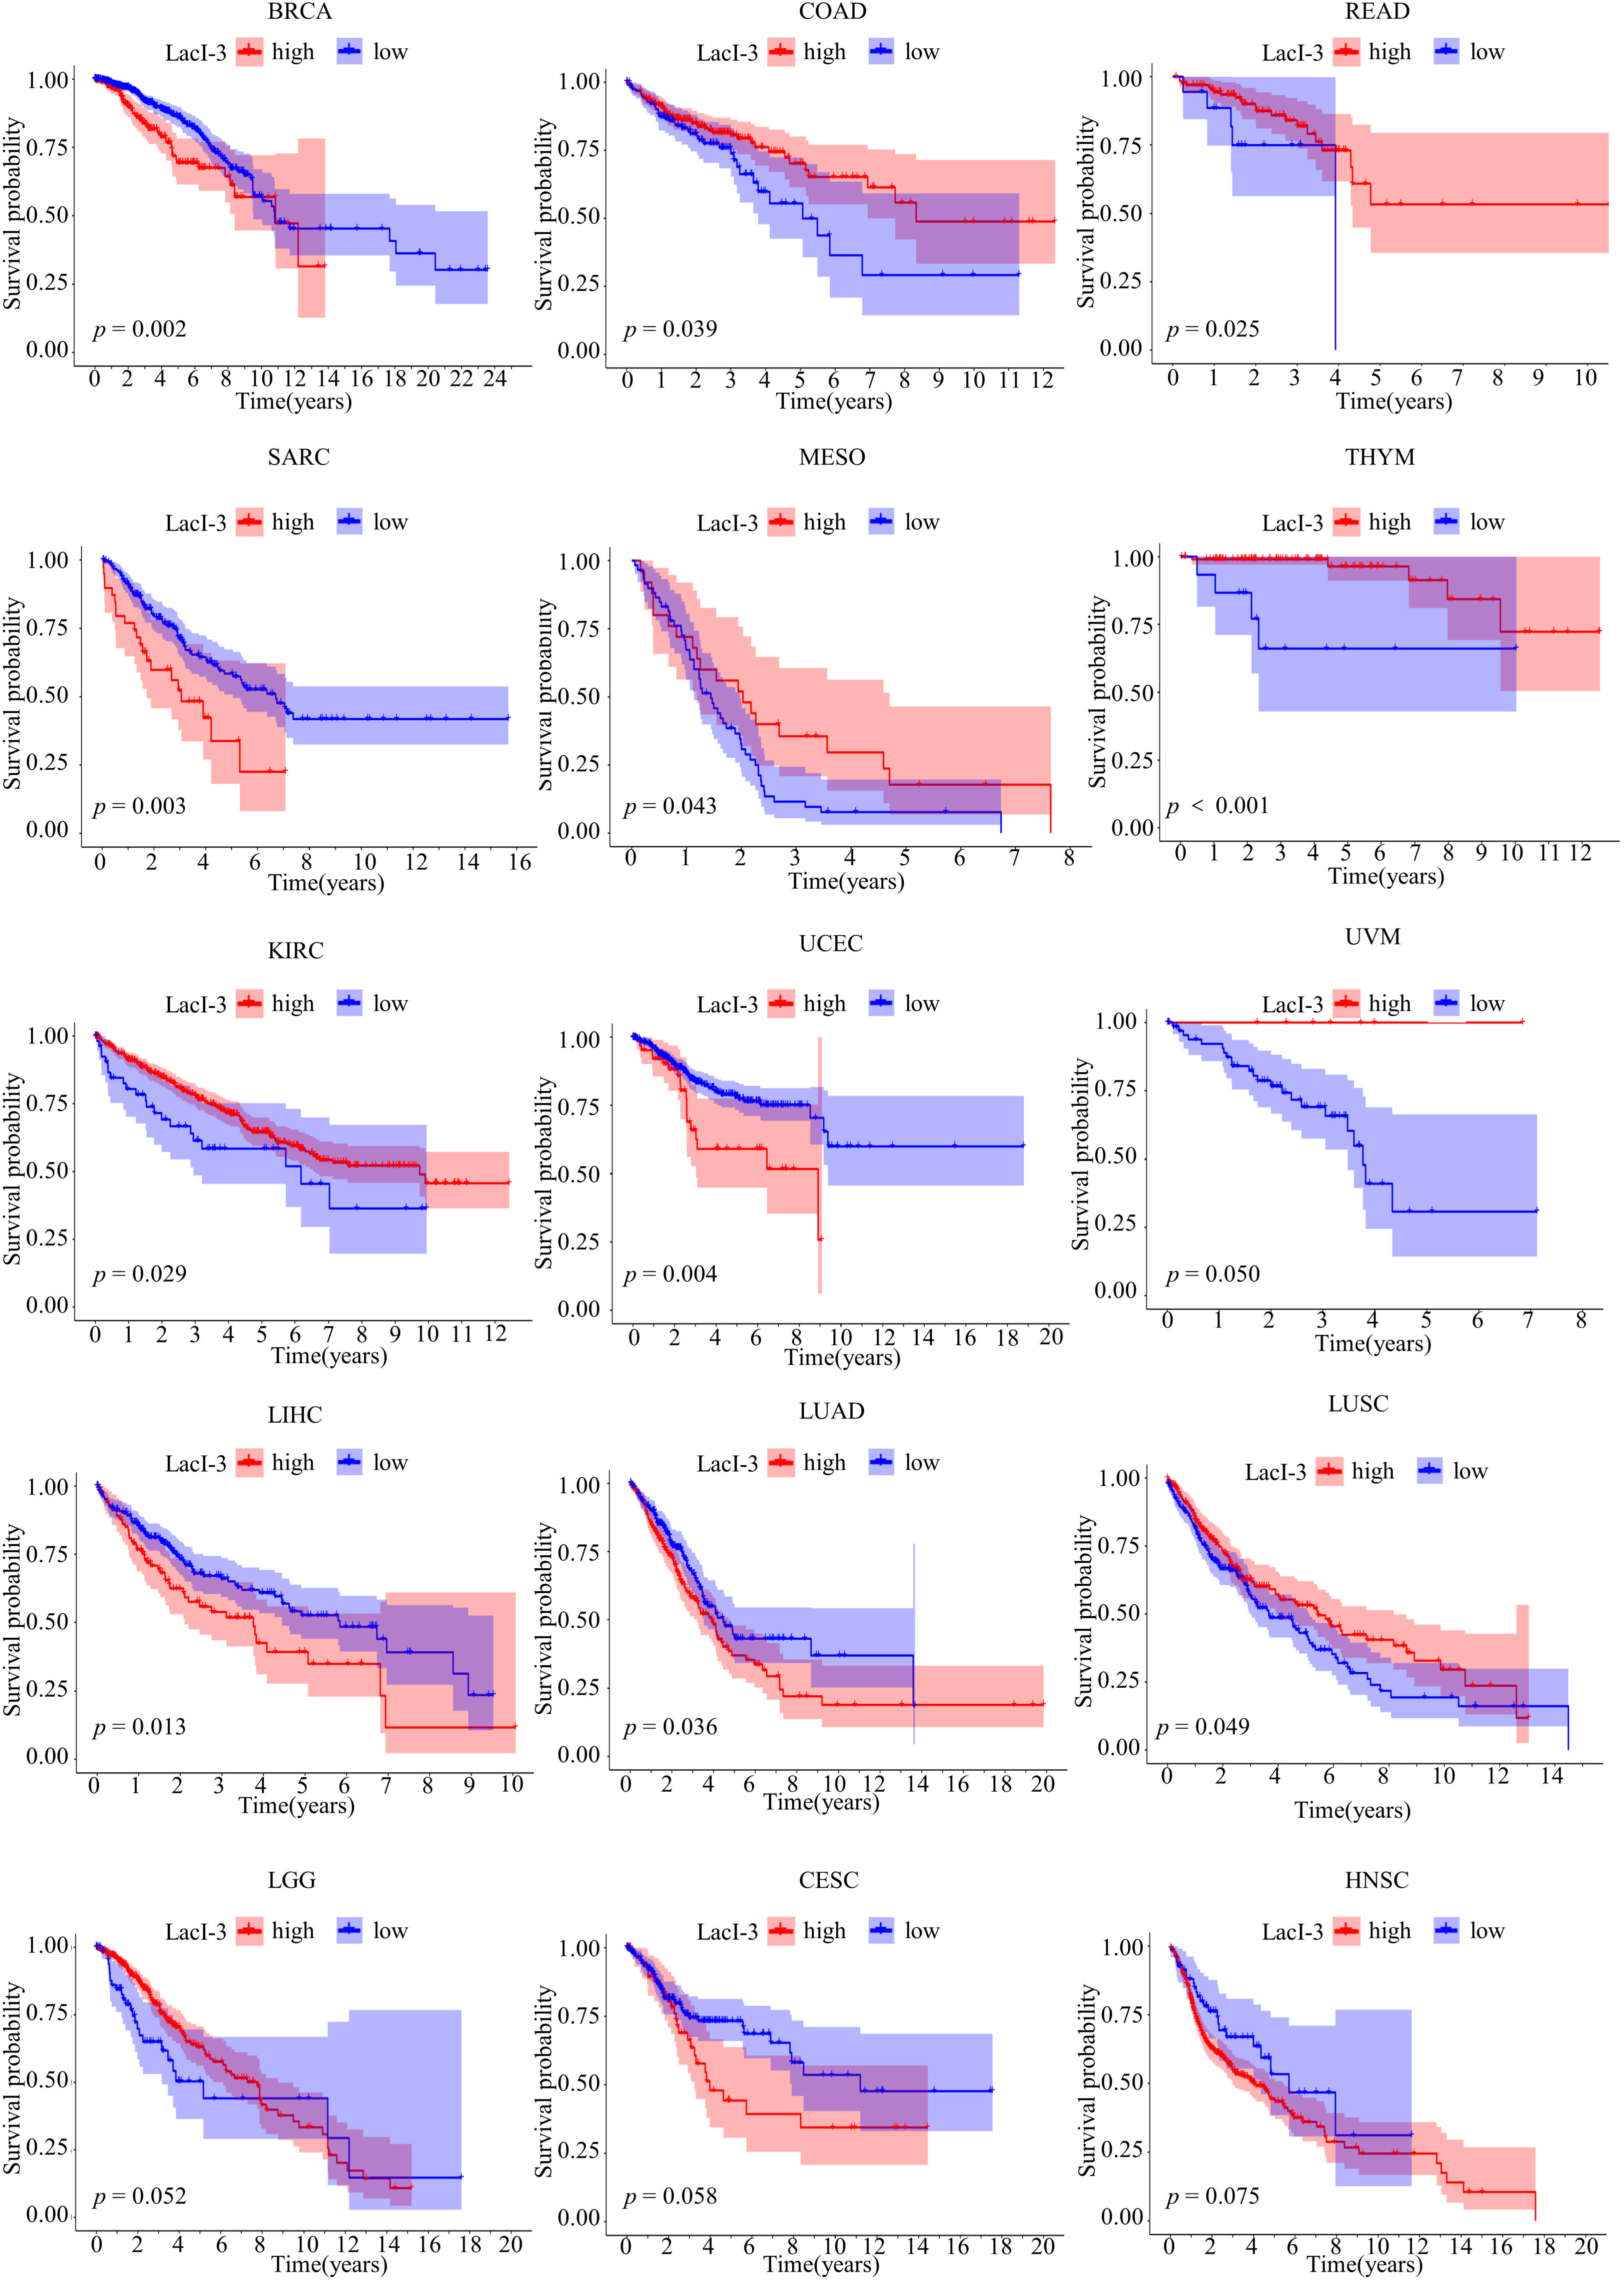
Figure 8: The prognosis of pan-cancer patients was evaluated based on LacI-3.
Metabolic reprogramming is crucial for tumor growth. Most tumors exhibit increased glucose uptake [20]. Lactic acid can even be used as an alternative fuel to promote proliferation [21]. An increase in glycolysis in PAAD leads to an increase in lactic acid production. Studies have shown that inhibiting glycolysis through RNA interference can reduce the growth of PAAD cells [22].
Lactylation is a new function of lactic acid [23]. Studies have indicated an increase in histone lactylation in tumors, which is correlated with a negative prognosis in patients with ocular melanoma [24]. In addition, lactylation can create a favorable microenvironment for tumor occurrence and development [25]. Therefore, exploring the impact of lactylation on patient prognosis and treatment response is of great clinical significance.
In the present research, we conducted consensus clustering analysis and developed a scoring system to predict patient prognosis. The relationships among lactylation, cancers, and the TIME were analyzed, and drug sensitivity analysis was performed; these results not only provided a basis for clinical PAAD treatment but also provided a reference for targeted lactylation and immunotherapy combinations.
First, we categorized patients with PAAD using lactylation-associated genes and subsequently verified that lactylation was indicative of a negative clinical outcome. Next, to identify new genes related to lactylation, we conducted consensus clustering analysis using DEGs from two LacClusters and generated two enhanced LacClusters. Differences in prognostic features, immune cell infiltration, and immune checkpoint expression levels were observed between the two LacCluster-enhanced subgroups. Previous studies have shown that the characteristics of “hot tumors” include the infiltration of tumor-infiltrating lymphocytes, the manifestation of PD-L1 on immune cells associated with the tumor, potential genomic instability, and the elicitation of an immune response against the tumor [26]. Based on these findings, we defined LacCluster-enhanced A tumors as “hot tumors”, and these tumors had a greater presence of infiltrating immune cells, activation of antitumor immune pathways, improved patient prognosis, and decreased lactylation.
Previous studies have shown that lactic acid accumulation can directly inhibit CD8+ T-cell- and CD4+ T-cell-mediated antitumor immunity, leading to immune escape [27]; the results align with the conclusions of this research. In this study, there were low levels of lactylation, high enrichment of T and B cells, costimulation of T cells, and upregulation of HLA expression in the LacCluster-enhanced A group. Activation of the antigen presentation pathway may play a role in T-cell costimulation and T-cell enrichment [28]. For convenience, we developed a model and divided PAAD patients into LacI-3high and LacI-3low groups based on the prognostic DEGs of the two LacClusters. The LacI-3low group exhibited a “hot” immune phenotype corresponding to a survival advantage and decreased lactylation, whereas the LacI-3high group exhibited the opposite effects. In the LacI-3low subgroup, low levels of lactylation may indicate reduced lactic acid accumulation, glycolysis, acidity of the tumor microenvironment, and inhibition of T-cell function [29], thus inducing antitumor effects. The reduced lactic acid accumulation may also explain the increase in antitumor immune cells or functions, including the abundance of T cells and B cells, T-cell costimulation, the upregulation of HLA expression, and the activation of type II IFN responses in the LacI-3low subgroup. The “hot” immune phenotype in the LacI-3low subgroup suggested that these patients would likely benefit from immunotherapy. In addition, TMB is an important feature of PAAD. Previous studies have indicated that the TMB potentially functions as a prognostic indicator for the effectiveness of immunotherapy in cancer patients [30]. The findings of this research demonstrated a notable positive correlation between the TMB and the LacI-3 score, indicating that lactylation, the TMB, and immunotherapy are linked and thus highlighting the clinical significance of LacI-3.
To further understand the relationship between lactylation and PAAD treatment in the clinic, we examined the responsiveness of patients in the LacI-3high and LacI-3low groups to chemotherapy. The sensitivity of PAAD cells with different levels of lactylation to tamoxifen and doxorubicin was verified in vitro. The experimental results were consistent with the results predicted using the pRRophetic package. Increased lactylation in PAAD cells increases the IC50 of tamoxifen and reduces the IC50 of doxorubicin. Previous research has shown that doxorubicin not only has direct cytotoxic effects on cancer cells but also induces the upregulation of immune-related genes involved in T-cell toxicity pathways, triggers the CD8+ T-cell response, and increases PD-1/PD-L1 expression [31,32]. That is, doxorubicin can induce immunogenic cell death. Our research revealed that patients in the LacI-3high subgroup exhibited increased lactylation levels, reduced immune cell infiltration, and decreased expression of immune checkpoint genes, rendering them more responsive to doxorubicin treatment. These findings suggested that using doxorubicin in LacI-3high patients not only resulted in favorable therapeutic outcomes but also led to the conversion of “cold tumors” into “hot tumors” through heightened infiltration of immune cells, consequently enhancing the effectiveness of PD-1/PD-L1 inhibitors. In addition, a study showed that PD-1/PD-L1 inhibitors could overcome doxorubicin resistance [33]. This discovery serves as a foundation for selecting pharmaceutical medications to treat PAAD. In addition, LacI-3 could also affect patient prognosis and immune infiltration in other types of cancers. This finding highlights the clinical value of LacI-3.
Finally, we analyzed the key gene LRRC1. Bioinformatics analysis suggested that LRRC1 might be a novel lactylation-related gene. Moreover, we demonstrated that LRRC1 enhanced the invasive, migratory, proliferative, and colony-forming abilities of PAAD cells but suppressed apoptosis in vitro. Notably, this study is the first to propose a role for LRRC1 in PAAD.
This study has certain limitations. First, we can collect samples from our hospital for RNA sequencing to validate LacI-3. Second, the mechanism by which LRRC1 affects tumor proliferation, migration, and invasion has not been thoroughly explored. Finally, we can construct small molecule drugs targeting LRRC1 to further promote preclinical research. These limitations are also the direction of our future research.
This research involved clustering PAAD datasets and constructing LacI-3 to investigate the associations among lactylation, immune cell infiltration, immune checkpoint molecule expression, the TMB, survival outcome, and chemotherapeutic drug sensitivity. Further analysis of lactylation about immunotherapy outcome indicated that lactylation has the potential to serve as a predictive marker for the effectiveness of immunotherapy and highlights the promise of interventions that target lactylation combined with immunotherapy. The predictive significance of LacI-3 for prognosis and immune infiltration was validated across cancers. In addition, as the first article to study the role of LRRC1 in PAAD and lactylation, this research offers insights for future investigations into the mechanism of action of LRRC1 and the design of specific pharmaceuticals targeting LRRC1.
Acknowledgement: None.
Funding Statement: This work was supported by the National Key Research and Development Program of China (Grant Number 2022YFA1205003); Major Research Projects of the National Natural Science Foundation of China (Grant Number 92059204); General Research Projects of the National Natural Science Foundation of China (Grant Number 82273419); and Major Projects of Technological Innovation and Application Development Foundation in Chongqing (Grant Number CSTB2022TIAD-STX0012).
Author Contributions: Study conception and design: Shicang Yu, Jianjun Li, and Xuejia Zhai; data collection: Xuejia Zhai, Jie Liu, Jinwei Xiao, Tao Zhang, and Jun Wang; analysis and interpretation of results: Xuejia Zhai and Jie Liu; draft manuscript preparation: Xuejia Zhai and Shicang Yu. All authors reviewed the results and approved the final version of the manuscript.
Availability of Data and Materials: The datasets generated and/or analyzed during the current study are available from TCGA (https://portal.gdc.cancer.gov/, accessed on 01/04/2024) and GEO (https://www.ncbi.nlm.nih.gov/geo/, accessed on 01/04/2024).
Ethics Approval: Not applicable.
Conflicts of Interest: The authors declare that they have no conflicts of interest to report regarding the present study.
Supplementary Materials: The supplementary material is available online at https://doi.org/10.32604/biocell.2024.050803.
References
1. Jiang X, He J, Wang Y, Liu J, Li X, He X, et al. A pan-cancer analysis of the biological function and clinical value of BTLA in tumors. BIOCELL. 2023;47(2):351–66. doi:10.32604/biocell.2023.025157. [Google Scholar] [CrossRef]
2. Lv B, Wang Y, Ma D, Cheng W, Liu J, Yong T, et al. Immunotherapy: reshape the tumor immune microenvironment. Front Immunol. 2022;13:844142. doi:10.3389/fimmu.2022.844142. [Google Scholar] [PubMed] [CrossRef]
3. Xia L, Oyang L, Lin J, Tan S, Han Y, Wu N, et al. The cancer metabolic reprogramming and immune response. Mol Cancer. 2021;20(1):28. doi:10.1186/s12943-021-01316-8. [Google Scholar] [PubMed] [CrossRef]
4. Terry S, Engelsen AST, Buart S, Elsayed WS, Venkatesh GH, Chouaib S. Hypoxia-driven intratumor heterogeneity and immune evasion. Cancer Lett. 2020;492:1–10. doi:10.1016/j.canlet.2020.07.004. [Google Scholar] [PubMed] [CrossRef]
5. Karayama M, Masuda J, Mori K, Yasui H, Hozumi H, Suzuki Y, et al. Comprehensive assessment of multiple tryptophan metabolites as potential biomarkers for immune checkpoint inhibitors in patients with non-small cell lung cancer. Clin Transl Oncol. 2021;23(2):418–23. doi:10.1007/s12094-020-02421-8. [Google Scholar] [PubMed] [CrossRef]
6. Huang B, Song BL, Xu C. Cholesterol metabolism in cancer: mechanisms and therapeutic opportunities. Nat Metab. 2020;2(2):132–41. doi:10.1038/s42255-020-0174-0. [Google Scholar] [PubMed] [CrossRef]
7. Chen B, Gao A, Tu B, Wang Y, Yu X, Wang Y, et al. Metabolic modulation via mTOR pathway and anti-angiogenesis remodels tumor microenvironment using PD-L1-targeting codelivery. Biomaterials. 2020;255:120187. doi:10.1016/j.biomaterials.2020.120187. [Google Scholar] [PubMed] [CrossRef]
8. Wang Z, Jiang Q, Dong C. Metabolic reprogramming in triple-negative breast cancer. Cancer Biol Med. 2020;17(1):44–59. doi:10.20892/j.issn.2095-3941.2019.0210. [Google Scholar] [PubMed] [CrossRef]
9. Hanahan D, Weinberg RA. Hallmarks of cancer: the next generation. Cell. 2011;144(5):646–74. doi:10.1016/j.cell.2011.02.013. [Google Scholar] [PubMed] [CrossRef]
10. Böttcher M, Baur R, Stoll A, Mackensen A, Mougiakakos D. Linking immunoevasion and metabolic reprogramming in B-cell-derived lymphomas. Front Oncol. 2020;10:594782. doi:10.3389/fonc.2020.594782. [Google Scholar] [PubMed] [CrossRef]
11. Moreno-Yruela C, Zhang D, Wei W, Bæk M, Liu W, Gao J, et al. Class I histone deacetylases (HDAC1-3) are histone lysine delactylases. Sci Adv. 2022;8(3):eabi6696. doi:10.1126/sciadv.abi6696. [Google Scholar] [PubMed] [CrossRef]
12. Wan N, Wang N, Yu S, Zhang H, Tang S, Wang D, et al. Cyclic immonium ion of lactyllysine reveals widespread lactylation in the human proteome. Nat Methods. 2022;19(7):854–64. doi:10.1038/s41592-022-01523-1. [Google Scholar] [PubMed] [CrossRef]
13. Cheng Z, Huang H, Li M, Liang X, Tan Y, Chen Y. Lactylation-related gene signature effectively predicts prognosis and treatment responsiveness in hepatocellular carcinoma. Pharmaceuticals. 2023;16(5):644. doi:10.3390/ph16050644. [Google Scholar] [PubMed] [CrossRef]
14. Aran D. Cell-type enrichment analysis of bulk transcriptomes using xCell. Methods Mol Biol. 2020;2120:263–76. doi:10.1007/978-1-0716-0327-7. [Google Scholar] [CrossRef]
15. Charoentong P, Finotello F, Angelova M, Mayer C, Efremova M, Rieder D, et al. Pan-cancer immunogenomic analyses reveal genotype-immunophenotype relationships and predictors of response to checkpoint blockade. Cell Rep. 2017;18(1):248–62. doi:10.1016/j.celrep.2016.12.019. [Google Scholar] [PubMed] [CrossRef]
16. He Y, Jiang Z, Chen C, Wang X. Classification of triple-negative breast cancers based on Immunogenomic profiling. J Exp Clin Cancer Res. 2018;37(1):327. doi:10.1186/s13046-018-1002-1. [Google Scholar] [PubMed] [CrossRef]
17. Yoshihara K, Shahmoradgoli M, Martínez E, Vegesna R, Kim H, Torres-Garcia W, et al. Inferring tumour purity and stromal and immune cell admixture from expression data. Nat Commun. 2013;4:2612. doi:10.1038/ncomms3612. [Google Scholar] [PubMed] [CrossRef]
18. Newman AM, Liu CL, Green MR, Gentles AJ, Feng W, Xu Y, et al. Robust enumeration of cell subsets from tissue expression profiles. Nat Methods. 2015;12(5):453–7. doi:10.1038/nmeth.3337. [Google Scholar] [PubMed] [CrossRef]
19. Jardim DL, Goodman A, de Melo Gagliato D, Kurzrock R. The challenges of tumor mutational burden as an immunotherapy biomarker. Cancer Cell. 2021;39(2):154–73. doi:10.1016/j.ccell.2020.10.001. [Google Scholar] [PubMed] [CrossRef]
20. Ying H, Kimmelman AC, Lyssiotis CA, Hua S, Chu GC, Fletcher-Sananikone E, et al. Oncogenic Kras maintains pancreatic tumors through regulation of anabolic glucose metabolism. Cell. 2012;149(3):656–70. doi:10.1016/j.cell.2012.01.058. [Google Scholar] [PubMed] [CrossRef]
21. Guillaumond F, Leca J, Olivares O, Lavaut MN, Vidal N, Berthezène P, et al. Strengthened glycolysis under hypoxia supports tumor symbiosis and hexosamine biosynthesis in pancreatic adenocarcinoma. Proc Natl Acad Sci U S A. 2013;110(10):3919–24. doi:10.1073/pnas.1219555110. [Google Scholar] [PubMed] [CrossRef]
22. Zhao D, Zou SW, Liu Y, Zhou X, Mo Y, Wang P, et al. Lysine-5 acetylation negatively regulates lactate dehydrogenase A and is decreased in pancreatic cancer. Cancer Cell. 2013;23(4):464–76. doi:10.1016/j.ccr.2013.02.005. [Google Scholar] [PubMed] [CrossRef]
23. Lv X, Lv Y, Dai X. Lactate, histone lactylation and cancer hallmarks. Expert Rev Mol Med. 2023;25:e7. doi:10.1017/erm.2022.42. [Google Scholar] [PubMed] [CrossRef]
24. Yu J, Chai P, Xie M, Ge S, Ruan J, Fan X, et al. Histone lactylation drives oncogenesis by facilitating m6A reader protein YTHDF2 expression in ocular melanoma. Genome Biol. 2021;22(1):85. doi:10.1186/s13059-021-02308-z. [Google Scholar] [PubMed] [CrossRef]
25. Jin M, Cao W, Chen B, Xiong M, Cao G. Tumor-derived lactate creates a favorable niche for tumor via supplying energy source for tumor and modulating the tumor microenvironment. Front Cell Dev Biol. 2022;10:808859. doi:10.3389/fcell.2022.808859. [Google Scholar] [PubMed] [CrossRef]
26. Galon J, Bruni D. Approaches to treat immune hot, altered and cold tumours with combination immunotherapies. Nat Rev Drug Discov. 2019;18(3):197–218. doi:10.1038/s41573-018-0007-y. [Google Scholar] [PubMed] [CrossRef]
27. Navarro F, Casares N, Martín-Otal C, Lasarte-Cía A, Gorraiz M, Sarrión P, et al. Overcoming T cell dysfunction in acidic pH to enhance adoptive T cell transfer immunotherapy. Oncoimmunology. 2022;11(1):2070337. doi:10.1080/2162402X.2022.2070337. [Google Scholar] [PubMed] [CrossRef]
28. Lee MY, Jeon JW, Sievers C, Allen CT. Antigen processing and presentation in cancer immunotherapy. J Immunother Cancer. 2020;8(2):e001111 doi:10.1136/jitc-2020-001111. [Google Scholar] [PubMed] [CrossRef]
29. Wu S, Zhang H, Gao C, Chen J, Li H, Meng Z, et al. Hyperglycemia enhances immunosuppression and aerobic glycolysis of pancreatic cancer through upregulating Bmi1-UPF1-HK2 pathway. Cell Mol Gastroenterol Hepatol. 2022;14(5):1146–65. doi:10.1016/j.jcmgh.2022.07.008. [Google Scholar] [PubMed] [CrossRef]
30. Lawlor RT, Mattiolo P, Mafficini A, Hong SM, Piredda ML, Taormina SV, et al. Tumor mutational burden as a potential biomarker for immunotherapy in pancreatic cancer: systematic review and still-open questions. Cancers. 2021;13(13):3119. doi:10.3390/cancers13133119. [Google Scholar] [PubMed] [CrossRef]
31. Kciuk M, Gielecińska A, Mujwar S, Kołat D, Kałuzińska-Kołat Ż, Celik I, et al. Doxorubicin-an agent with multiple mechanisms of anticancer activity. Cells. 2023;12(4):659. doi:10.3390/cells12040659. [Google Scholar] [PubMed] [CrossRef]
32. Voorwerk L, Slagter M, Horlings HM, Sikorska K, van de Vijver KK, de Maaker M, et al. Immune induction strategies in metastatic triple-negative breast cancer to enhance the sensitivity to PD-1 blockade: the TONIC trial. Nat Med. 2019;25(6):920–8. doi:10.1038/s41591-019-0432-4. [Google Scholar] [PubMed] [CrossRef]
33. Emami F, Banstola A, Vatanara A, Lee S, Kim JO, Jeong JH, et al. Doxorubicin and Anti-PD-L1 antibody conjugated gold nanoparticles for colorectal cancer photochemotherapy. Mol Pharm. 2019;16(3):1184–99. doi:10.1021/acs.molpharmaceut.8b01157. [Google Scholar] [PubMed] [CrossRef]
Cite This Article
 Copyright © 2024 The Author(s). Published by Tech Science Press.
This work is licensed under a Creative Commons Attribution 4.0 International License , which permits unrestricted use, distribution, and reproduction in any medium, provided the original work is properly cited.
 Downloads
 Citation Tools