
 Submit a Paper
 Propose a Special lssue
 Open Access
ARTICLE
MAPK9 as a therapeutic target: unveiling ferroptosis in localized prostate cancer progression
1 Department of Urology, Guizhou Provincial People’s Hospital, Guiyang, China
2 Department of Urology, First Affiliated Hospital of Sun Yat-sen University, Guangzhou, China
* Corresponding Authors: YE TIAN. Email: ; BIN XU. Email:
# These authors contributed equally to this work
(This article belongs to the Special Issue: Advances in Biomarker Research: Unveiling the Pathways to Precision Medicine)
BIOCELL 2024, 48(5), 771-792. https://doi.org/10.32604/biocell.2024.048878
Received 21 December 2023; Accepted 23 February 2024; Issue published 06 May 2024
 View Full Text
 Download PDF
Abstract
Background: Ferroptosis, a lipid peroxidation-mediated programmed cell death, is closely linked to tumor development, including prostate cancer (PCa). Despite established connections between ferroptosis and PCa, a comprehensive investigation is essential for understanding its impact on patient prognosis. Methods: A risk model incorporating four ferroptosis-related genes was developed and validated. Elevated risk scores correlated with an increased likelihood of biochemical recurrence (BCR), diminished immune infiltration, and adverse clinicopathological characteristics. To corroborate these results, we performed validation analyses utilizing datasets from both the Cancer Genome Atlas Cohort (TCGA) and the Gene Expression Synthesis Cohort (GEO). Moreover, we conducted further investigations into the pivotal gene identified in our model to explore its impact on tumor characteristics through cell proliferation and invasion assays, as well as animal studies conducted in vivo. Additionally, we conducted further experiments involving ferroptosis-related analysis to validate its association with ferroptosis. Results: The risk model demonstrated exceptional predictive capabilities for prognosis and therapeutic outcomes in PCa patients. Mitogen-activated protein kinase 9 (MAPK9) emerged as a crucial gene within the model. In vivo and in vitro experiments explored MAPK9’s role in ferroptosis and its influence on tumor migration and proliferation. Conclusion: The findings provide a novel perspective for advancing ferroptosis exploration in PCa, bridging basic research and clinical applications.Keywords
Supplementary Material
Supplementary Material FileAbbreviations
| PCa | Prostate cancer |
| BCR | Biochemical recurrence |
| TCGA | The Cancer Genome Atlas |
| GEO | Gene expression omnibus |
| MAPK9 | Mitogen-activated protein kinase 9 |
| GPX4 | Glutathione peroxidase 4 |
| FPKM | Fragments Per Kilobase Million |
| GO | Gene Ontology |
| KEGG | Kyoto Encyclopedia of Genes and Genomes |
| RP | Radical prostatectomy |
| PSA | Prostate-specific antigen |
| CRPC | Castration-resistant PCa |
| AR | Androgen receptors |
| JNK2 | c-Jun N-terminal kinase 2 |
| FTH1 | Ferritin heavy chain 1 |
| DEG | Differentially expressed gene |
| FDR | False discovery rate |
| bRFS | Biochemical recurrence free survival |
| ROC | Receiver operating characteristic |
| AUC | Area under the ROC curve |
| PCA | Principal component analysis |
| qRT-PCR | Quantitative RT-PCR |
| HR | Hazard ratio |
| OD | Optical density |
| AAV | Adeno-associated virus |
| DFS | Disease free survival |
| MDA | Malondialdehyde |
| ROS | Reactive oxygen species |
| GSH | Glutathione |
Prostate cancer (PCa) refers to a common tumor in adult men [1]. In the year 2020, nearly 50% of the prevalent cancers affecting men are lung, colorectal, and prostate cancers. Notably, PCa constitutes over 20% of newly diagnosed cancers [2]. Radical prostatectomy (RP) stands out as one of the most prevalent treatments for localized PCa, demonstrating excellent efficacy in tumor control. Nonetheless, in cases of biochemical recurrence (BCR), the estimated incidence is around 35% within ten years post-RP [3–6]. Without secondary treatment, BCR patients typically progress to clinical progression within 5–8 years post-RP, with a substantial risk of death affecting nearly 32%–45% of patients within 15 years [7]. At present, essential factors such as prostate-specific antigen (PSA) levels, Gleason score (GS), clinical stage, and the selected treatment modality are commonly recognized as crucial predictors of biochemical recurrence (BCR) in individuals with prostate cancer (PCa) [8]. Nevertheless, current studies have not been able to precisely predict BCR probability for patients under different conditions. Hence, it is imperative to develop a reliable and effective predictive model to identify novel biomarkers and accurately predict the risk of BCR in PCa patients’ post-surgery.
Ferroptosis denotes programmed death resulting from lipid peroxidation and is mediated by iron-dependent forms of cells [9]. It differs from other forms of cell-mediated death in several aspects, including biochemistry, morphology, and genetics [10,11]. Due to the high iron content in cancer cells and their reinforced sensitivity to ferroptosis induction, ferroptosis is considered a promising cancer therapy [12]. Similarly, the expression of multiple tumor suppressors in cancer cells inhibits tumorigenesis by triggering ferroptosis [13,14]. However, certain expressions may also prohibit ferroptosis in certain cancer cells [15,16], indicating the complicated function of ferroptosis in cancer and the imperative need for further investigations. Recent studies have precisely designed some nanomedicines to exploit the dual nature of ferroptosis by controlling its reprogramming. The affirmative roles of ferroptosis are accompanied by its inherent reversal effects, leveraging the negative aspects to achieve optimal therapeutic outcomes in ferroptotic tumors. Furthermore, this introduces a conceptually innovative approach to integrate research on the nature of ferroptosis for maximizing therapeutic efficacy in treating tumors [17]. Recently, the effect of ferroptosis on cancer pathogenesis has intrigued a growing number of basic and clinical researchers [18]. Presently, the induction or inhibition of iron intoxication has emerged as a novel concept and methodology, representing an active research area with considerable anticipation as a potential avenue for cancer treatment [12,19].
Compared with other cancers, current research reveals the significant impact of ferroptosis on the treatment and development of PCa. For instance, Ghoochani et al. [20] suggested that triggering ferroptosis could serve as a novel therapeutic approach for PCa in advanced stages. This strategy can be employed independently or in conjunction with the second generation of anti-androgen therapy. Tousignant et al. [21] supported the role of Glutathione peroxidase 4 (GPX4) dependence induction in the standardized treatment of PCa and highlight the significance of iron hypersensitivity, providing mechanistic insights into lipid metabolism. Through targeting p53, flubendazole facilitates ferroptosis against castration-resistant PCa (CRPC) and induces antitumor effects. Erastin, a typical ferroptosis inducer, not only inhibits androgen receptors (AR) in CRPC but also influences the transcriptional activity of splicing variants [22]. Multiple studies have emphasized the significance of ferroptosis in both the progression and therapeutic approaches for castration-resistant prostate cancer (CRPC) [21–23]. While limited treatment options exist for advanced PCa and further improvement is still needed, the induction of ferroptosis is increasingly considered by many researchers as a potential novel treatment for advanced PCa [20]. In conclusion, despite the extensive documentation of ferroptosis’s effect on the progression and treatment of prostate cancer (PCa), its impact on biochemical recurrence (BCR) and prognosis remains inadequately reported.
This study used relational databases in the PCa to identify ferroptosis-related genes (FRGs) involved in long-term BCR. Subsequently, a model was developed based on four prognostic features derived from FRGs, with the aim of enhancing the ability to assess the risk of BCR after RP. Moreover, the important component of the signature was selected for further experimental verification, providing insights into the treatment and progression of PCa in patients. The outcomes indicate the crucial role of ferroptosis and FRGs in postoperative PCa management, providing insights into predicting future trends.
This study acquired the complete transcriptome data (FPKM (Fragments Per Kilobase Million) standardized data) of prostate cancer (PRAD) from TCGA along with relevant clinical information, encompassing a dataset of 496 patients. For validation, the study utilized the PRAD dataset (GSE54460) sourced from the GEO, comprising comprehensive normalized Log2 mRNA expression profiles and clinicopathological details for 107 patients. 257 FRGs were collected from prior research [24] and GeneCards (https://www.genecards.org/), as shown in Suppl. Table S1.
To confirm and clarify the relationship between differentially expressed genes (DEGs) and ferroptosis, Gene Ontology (GO) and Kyoto Encyclopedia of Genes and Genomes (KEGG) enrichment analyses were performed. Initially, genetic symbols were converted into entrezIDs using the hs.eg.db package. Following this, GO enrichment analysis was conducted to evaluate the level of enrichment of GO terms among the DEGs. To explore the functions of gene sets, KEGG enrichment analysis was performed, utilizing the clusterProfiler software packages. Statistical significance was established at a threshold of p < 0.05. Subsequently, the GO bar plot and KEGG bubble plot were generated utilizing the ‘enrichplot’ package.
Construction for the ferroptosis-related predictive signature
Following the TCGA cohort, a risk prognostic model was established. Differential expression analysis for FRGs in PCa and adjacent healthy tissues was conducted using the R ‘LIMMA’. The cut-off values were established at log2 |fold change| > 1 and a false discovery rate (FDR) <0.05. Subsequently, the association between FRGs and BCR in PCa was examined utilizing univariate Cox regression analysis. The intersection of the two analyses formed the basis for constructing a protein interaction network utilizing STRING. Additionally, an expression correlation network was constructed per the gene expression in the intersection. In order to avoid overfitting in the ultimate prediction model, Lasso regression was utilized. The model was formulated as follows:
Risk score = αgene(a) × gene expression(a) + αgene(b) × gene expression(b) + ··· + αgene(n) × gene expression(n)
To categorize patients with PCa into two risk groups (high and low), the median risk score was established as the cut-off point.
Assessment and validation for the prognostic signature
The predictive signature was evaluated and verified using both GEO and TCGA cohorts. The same statistical methodology was applied to compute the results in both cohorts. Subsequently, the difference in biochemical recurrence-free survival (bRFS) between the two risk groups was evaluated using log-rank and Kaplan-Meier (K-M) tests. Receiver operating characteristic (ROC) analysis was then conducted to assess the sensitivity and specificity of survival predictions, with the area under the ROC curve (AUC) serving as a measure of prediction accuracy. Additionally, principal component analysis (PCA) was utilized to examine the distribution within each group. Independent predictive factors for biochemical recurrence (BCR) in prostate cancer (PCa) were investigated through both univariate and multivariate Cox regression analyses. In the multivariate regression analysis, multiple predictors were integrated, and scaled line segments were utilized to plot on the same plane based on a specific scale. This visualization expressed the interrelationship between individual component genes and variables in the signature.
Heatmaps were generated to depict the correlations between risk scores and different clinicopathological characteristics.
Immune infiltration and expression of immune checkpoint molecules
Single-sample gene set enrichment analysis (GSEA) was performed to assess the immune infiltration level within the model [25]. Annotated gene set files were acquired from the study by Liang et al. [24]. Subsequently, the enrichment levels in 16 immune cells and 13 immune-related pathways in prostate cancer (PCa) samples were quantified, and the findings were depicted using box plots. To further analyze the immune landscape, the expression of key immune checkpoint molecules between low- and high-risk groups was compared using log-rank and K-M tests.
Cell lines, cell culture, and treatments
The cells utilized in the study were sourced from the American Type Culture Collection (ATCC), comprising RWPE-1 (a human healthy prostate epithelial cell line), PC3, and 22RV1 (prostate cancer cell lines), as well as 293T cells. Cultivation conditions were maintained as follows: RWPE-1 cells were cultured in Gibco keratinocyte serum-free medium supplemented with 50 µg/mL bovine pituitary extract (# abs9119, Absin, Shanghai, China) and 5 ng/mL epidermal growth factor (# P6384, Beyotime, Guangzhou, China). 22RV1 cells were incubated with Invitrogen-Gibco RPMI-1640 medium (# 11875093, ThermoFisher, New York, NY, USA) comprising 10% Thermo Fisher Scientific fetal bovine serum (FBS) (# 10099158, ThermoFisher, Sydney, Australia) plus 1% Gibco penicillin/streptomycin (# 15140122, ThermoFisher, New York, NY, USA). PC3 and 293T cells were incubated with Gibco Dulbecco’s Modified Eagle Medium (DMEM) (# 11965118, ThermoFisher, New York, NY, USA), 1% Gibco penicillin/streptomycin, and 10% Thermo Fisher Scientific FBS. These cells were then preserved in an incubator under 5% CO2 in a humid environment at 37°C.
qRT-PCR assays were performed utilizing 2X SYBR Green Pro Taq HS Premix II (# 11733, AGbio, Beijing, China) on QuantStudio 5 real-time PCR instruments (# 12353573, ThermoFisher, New York, NY, USA). The primer sequences used are as mentioned below:
MAPK9 (Homo sapiens) forward-1: GCCAATACCACGTTCTTGA, reverse-1: GCCTCTGAAAACAGACCAA; forward-2: AACCCTGGCTGTGCATAC, reverse-2: GGGCTTCCTCCTCTCAGT; GAPDH (Homo sapiens) forward: GGAGCGAGATCCCTCCAAAAT, reverse: GGCTGTTGTCATACTTCTCATGG.
After normalization, mRNA levels were adjusted relative to GAPDH levels. The 2−ΔΔCt method was employed to measure the relative expression levels of genes.
Protein quantification was conducted using a BCA kit (# 23225, ThermoFisher, New York, NY, USA), following protein extraction with 1% protease inhibitor RIPA lysis buffer (# 89901, ThermoFisher, New York, NY, USA). Afterward, 30 μg of protein was isolated using 10% SDS-PAGE and transferred to PVDF membranes (Millipore, Dallas, Texas, USA). Then, 5% skimmed milk powder(Weigh the required amount of skimmed milk powder and add it to an appropriate quantity of clean water. Stir until well dissolved to obtain a 5% skimmed milk solution. If not used immediately, store the prepared solution in a suitable container and place it in the refrigerator) was employed to block these membranes for a duration of one hour at room temperature. Subsequently, they were exposed to primary antibodies against (c-Jun N-terminal kinase 2) JNK2/MAPK9 (# 4672), GPX4 (# 52455), ferritin heavy chain 1 (FTH1 (# 3998)), or GAPDH(# 5174) (all 1:1000, Cell Signaling Technology, New York, NY, USA) overnight at 4°C. Afterward, the rinsed membranes were cultured with horseradish peroxidase (HRP)-bound goat anti-mouse secondary antibody (# SA00001-1, 1:50, Proteintech, Shanghai, China) or HRP-bound goat anti-rabbit antibody (# SA00001-2, 1:5000, Proteintech, Shanghai, China) at room temperature for 1–2 h. Lastly, Western chemiluminescence HRP substrate (# 42029053, Millipore, Dallas, Texas, USA) was utilized for observation.
In siRNA assays, two siRNAs targeting specific genes and one negative control siRNA were acquired from RiboBio (Guangdong, China) (Suppl. Table S2). Transfection of siRNAs into cells was performed utilizing Lipofectamine 3000 (# L3000008, ThermoFisher, New York, NY, USA) following the provided guidelines. Functional assays were executed 48 h following transfection, and both proteins and RNA were collected at this time point.
Development of stable strains carrying luciferase
PCa cells were subjected to infection with luciferase-carrying viruses designed to knock down MAPK9 (sequence: CCGGCTAACTTATGTCAGGTTATTCCTCGAGGAATAACCTGACATAAGTTAGTTTTTT), along with control viruses (GENE, Shanghai, China), using 8 mg/mL polybrene in the presence of ViraPower Packaging Mix (# C0351, Beyotime, Shanghai, China). Stable cell lines were subsequently established by exposing the cells to 2 μg/mL puromycin (# ST551, Biosharp, Guangdong, China) for two days.
Cell migration and invasion assay
Transwell assays, encompassing migration and invasion assays, were performed to explore cell migratory and invasive capacities in vitro. For cell invasion assays, Corning’s Chambers with 8-μm pore size (Wisconsin, USA) were utilized, and 2% Matrigel (# C0372, Beyotime, Shanghai, China) was added to the chambers. Cell migration assays were performed using chambers without Matrigel. Approximately 5 × 10⁴ cells in 200 μl serum-free medium were introduced to the upper chambers. Additionally, the lower chambers were added with 800 μl medium comprising 10% FBS as a nutritional attractant. After incubating for 18 h (for PC3) and 24 h (for 22RV1), the chambers were collected, subjected to fixation with 4% polyformaldehyde (# P0099, Beyotime, Shanghai, China), and underwent staining with 0.4% crystal violet (# C0121, Beyotime, Shanghai, China) for 20 min. Subsequently, the cells in the upper chambers were gently wiped off with cotton swabs, and the ratio of invaded or migrated cells was determined by capturing images of five random fields using an Olympus IX83 inverted microscope (Tokyo, Japan).
Cell counting kit-8 (CCK-8) and colony formation assays
In this research, the proliferative capacity of the cells was assessed utilizing CCK-8 and colony formation assays. Initially, CCK-8 assays were executed in accordance with the provided guidelines by APExBio (# K1018, Houston, USA). Transfected 22RV1 and PC3 cells were incubated on 96-well plates with a concentration of 2000 cells/well for 1, 2, 3, and 4 days, respectively, with each group consisting of 5 replicates. The optical density (OD) at 450 nm was measured using the Spark 10M (Tecan), and these values at specific time points were utilized to generate cell growth curves, providing direct indications of cell viability and proliferation levels.
For the colony formation assays, transfected 22RV1 and PC3 cells were enzymatically dissociated, counted, and suspended to prepare cell suspensions. Subsequently, these cells were seeded into six-well plates at a density of 1000 cells per well. After incubation for 7–14 days, the colonies were rinsed with 1× PBS. Then, they were subjected to fixation with 4% polyformaldehyde (# P0099, Beyotime, Shanghai, China) and underwent staining with 0.4% crystal violet (# C0121, Beyotime, Shanghai, China) for 20 minutes. The clones were then photographed and quantified.
Prior to the experiment, a marker was employed to draw a horizontal line on the back of a 6-well plate. The 22RV1 and PC3 cells were inoculated on 6-well plates and added to a 2–3 mL culture medium for 24 h. Transfection was carried out when the cell confluency reached 70%. Upon reaching confluence, wounds were created using the tips of 200 μL pipettes, ensuring at least three lines across each well. Following this, cells in the 6-well plates were rinsed in 1% PBS thrice to eliminate floating cells and then cultured in a serum-free medium. Finally, an IX83 microscope (Olympus, Tokyo, Japan) was used to obtain images at 0 and 24 h after healing.
Distinct assays were utilized to assess ferroptosis-related parameters, encompassing the quantification of Fe2+ release, malondialdehyde (MDA), reactive oxygen species (ROS), and glutathione (GSH) levels. The Iron Assay Kit (E-BC-K881-M, Elabscience, Guangdong, China) was employed for determining Fe2+ release, the lipid peroxidation (MDA) assay kit (S0131S, Beyotime, Guangdong, China) for MDA levels, the ROS Assay kit (D3861, ThermoFisher, New York, NY, USA) for ROS levels, and the GSH/Glutathione Disulfide (GSSG) Ratio Detection Assay Kit II (S0053, Beyotime, Guangdong, China) for GSH levels.
Observation of autophagy in cells
Recent research has revealed that ferroptosis is not an independent process but rather an autophagy-related form of cell death, particularly involving ferritin degradation [11,26,27]. To initiate this investigation, adeno-associated virus (AAV) was packaged. Lentiviruses were generated by co-transfecting mRFP-GFP-LC3 vectors with pMDLg/pRRE, CMV-VSVG, and RSV-Rev vectors into 293 T cells. Subsequently, 6–8 h after transfection, fresh DMEM medium (containing 10% FBS) was replaced and cultured for 48–72 h. After the medium turned yellow, the supernatant was centrifuged, collected, and kept in the refrigerator at −80°C. When the fusion rate of transfected PC3 cells in a 6-well plate reached 50%–80%, fresh culture medium was added along with 2 μL of Polybrene. After 20 min, the thawed viral solution was added, and cells were kept in an incubator under 5% CO2 in a humid environment at 37°C. Following an 8–12 h incubation with the viral solution, fresh medium was replaced, and the culture continued. After confirming stable expression of mRFP-GFP-LC3, cells were subcultured for 24 h and then seeded into a confocal petri dish (NEST). Subsequently, we observed the intracellular LC3 autophagy puncta of transfected PC3 cells infected with venom using confocal microscopy (FV3000, Olympus, Shanghai, China).
Transmission electron microscopy examination
Electron microscopy was utilized to investigate the morphology and subcellular distribution of mitochondria. PC3 cells, exhibiting optimal condition and stability post-transfection, were chosen (cell density: 5 × 10⁶/mL or a 10-cm dish with a glass cover). The culture medium was removed, and cells were gently scraped in the presence of 1% PBS, with a subsequent transfer into a 1.5 mL Eppendor tube, being cautious not to induce repeated scraping to avoid cell damage. Following a 5-min centrifugation at 9000 × g, the supernatant was removed. Subsequently, 2% glutaraldehyde was gently introduced to the cell pellet, taking care to prevent aerosolization and cell dispersion. The collection was fixed at room temperature for 30 min, kept at 4°C, and then examined using a transmission electron microscope.
Co-immunoprecipitation (co-IP)
Co-IP was carried out using designated antibodies and IgG (# 26146, Invitrogen, New York, NY, USA) in accordance with the provided guidelines. Briefly, cell lysates were subjected to incubation with antibody-bound beads at 4°C for 2 h. Afterward, the beads underwent extensive washing before being boiled in the SDS loading buffer. The study of immunoprecipitated proteins was conducted using Western blotting analysis.
Tumorigenicity assay in nude mice
In this research, animal experiments were granted ethical approval from both the Ethics Committee of the First Affiliated Hospital of Sun Yat-sen University and the Institutional Animal Care and Use Committee of Sun Yat-sen University, all methods were executed in accordance with the relevant guidelines and regulations (Approval number: 2021-039). The xenotransplantation model was established by subcutaneously injecting 1 × 10⁶ stably transfected PC3 cells, maintained in optimal condition, into both sides of male nude mice (Age: 5–6 weeks, purchased from Guangdong Medical Experimental Animal Center, Guangdong, China. The mice were housed in a specific pathogen-free (SPF) breeding facility). Tumor volume was measured at regular seven-day intervals utilizing calipers, calculated with the formula (length × width2)/2. 28 days from the implantation of transfected PC3 cells, the mice were humanely euthanized through cervical dislocation under deep anesthesia. Subsequently, xenografts were extracted, subjected to fixation, weighed, photographed, and then preserved.
Matrigel mixtures (1:1) containing 1 × 10⁶ PC3 cells, both with and without stable lentiviral knockdown of MAPK9, were administered orthotopically into the left and right anterior lobes of the prostate. Following a four-week implantation period, tumor formation and sizes were noninvasively determined utilizing an in vivo imaging system (IVIS). Following sacrificing the mice, tumor tissues were extracted, subjected to fixation, and embedded in paraffin for further analysis.
Statistical analyses for this research were performed utilizing GraphPad Prism 7.0 and R 3.6.1 software. Continuous variables were analyzed using either the independent sample t-test, for those with a normal distribution and homogeneous variance, or the Wilcoxon rank-sum test, for variables with non-normal distribution and heterogeneous variance. Pearson’s correlation coefficient test was employed for correlation analysis. Moreover, based on the results of multivariate Cox proportional hazards analysis, a nomogram was developed to predict the rate of biochemical recurrence-free survival (bRFS) at 1-, 3-, and 5-years. The predictive performance of the nomogram was assessed using metrics such as the receiver operating characteristic (ROC) curve, consistency index (C index), and calibration curve. The experiments were conducted thrice for all quantitative experimental data, and the findings were presented as mean ± standard deviation. p < 0.05 was deemed as a statistically significant value (*p < 0.05; **p < 0.001; ***p < 0.0001).
Identification for differential expression of FRGs
Fig. 1 shows the flowchart of this study. Cluster analysis was performed on the 257 ferroptosis-related genes (FRGs) to uncover the underlying grouping structure within the dataset. The objective of this analysis was to enhance the similarity among objects within the same group while maximizing dissimilarity among objects belonging to different groups (Figs. 2A–2C). Moreover, 176 DEGs were identified in tumor tissues, including 48 downregulated genes and 128 upregulated genes, in contrast to healthy tissues from the TCGA cohort (p < 0.05). Gene expression of tumor issues and healthy tissues adjacent to the tumor is shown in Fig. 2D and Suppl. Table S3. As per the GO and KEGG analytical results, differential genes were associated with ferroptosis (Figs. 2E, 2F). For example, former research has revealed a close correlation between ferroptosis and muscular and circulatory processes. To recognize prognostic genes associated with bRFS, 52 FRGs assessed with univariate Cox regression were identified as candidate genes of the subsequently constructed prognostic model (Suppl. Table S4). Fifteen genes functioned as protective factors, whereas the remaining 37 genes acted as risk factors (Fig. 3A). STRING was utilized to upload these 52 bRFS-related genes for the development of protein–protein interaction (PPI) network (Fig. 3B). Additionally, to explore the correlation at the transcriptional level, correlation analysis was performed, revealing strong correlations among the top 30 genes (Fig. 3C). To detect collinearity among these 52 genes, LASSO Cox regression analysis was employed to identify the genuine genes affecting biochemical recurrence-free survival (bRFS). Ultimately, a prognostic panel comprising 4 ferroptosis-related genes (FRGs) was identified (Fig. 3D), which was calculated by the following formula:
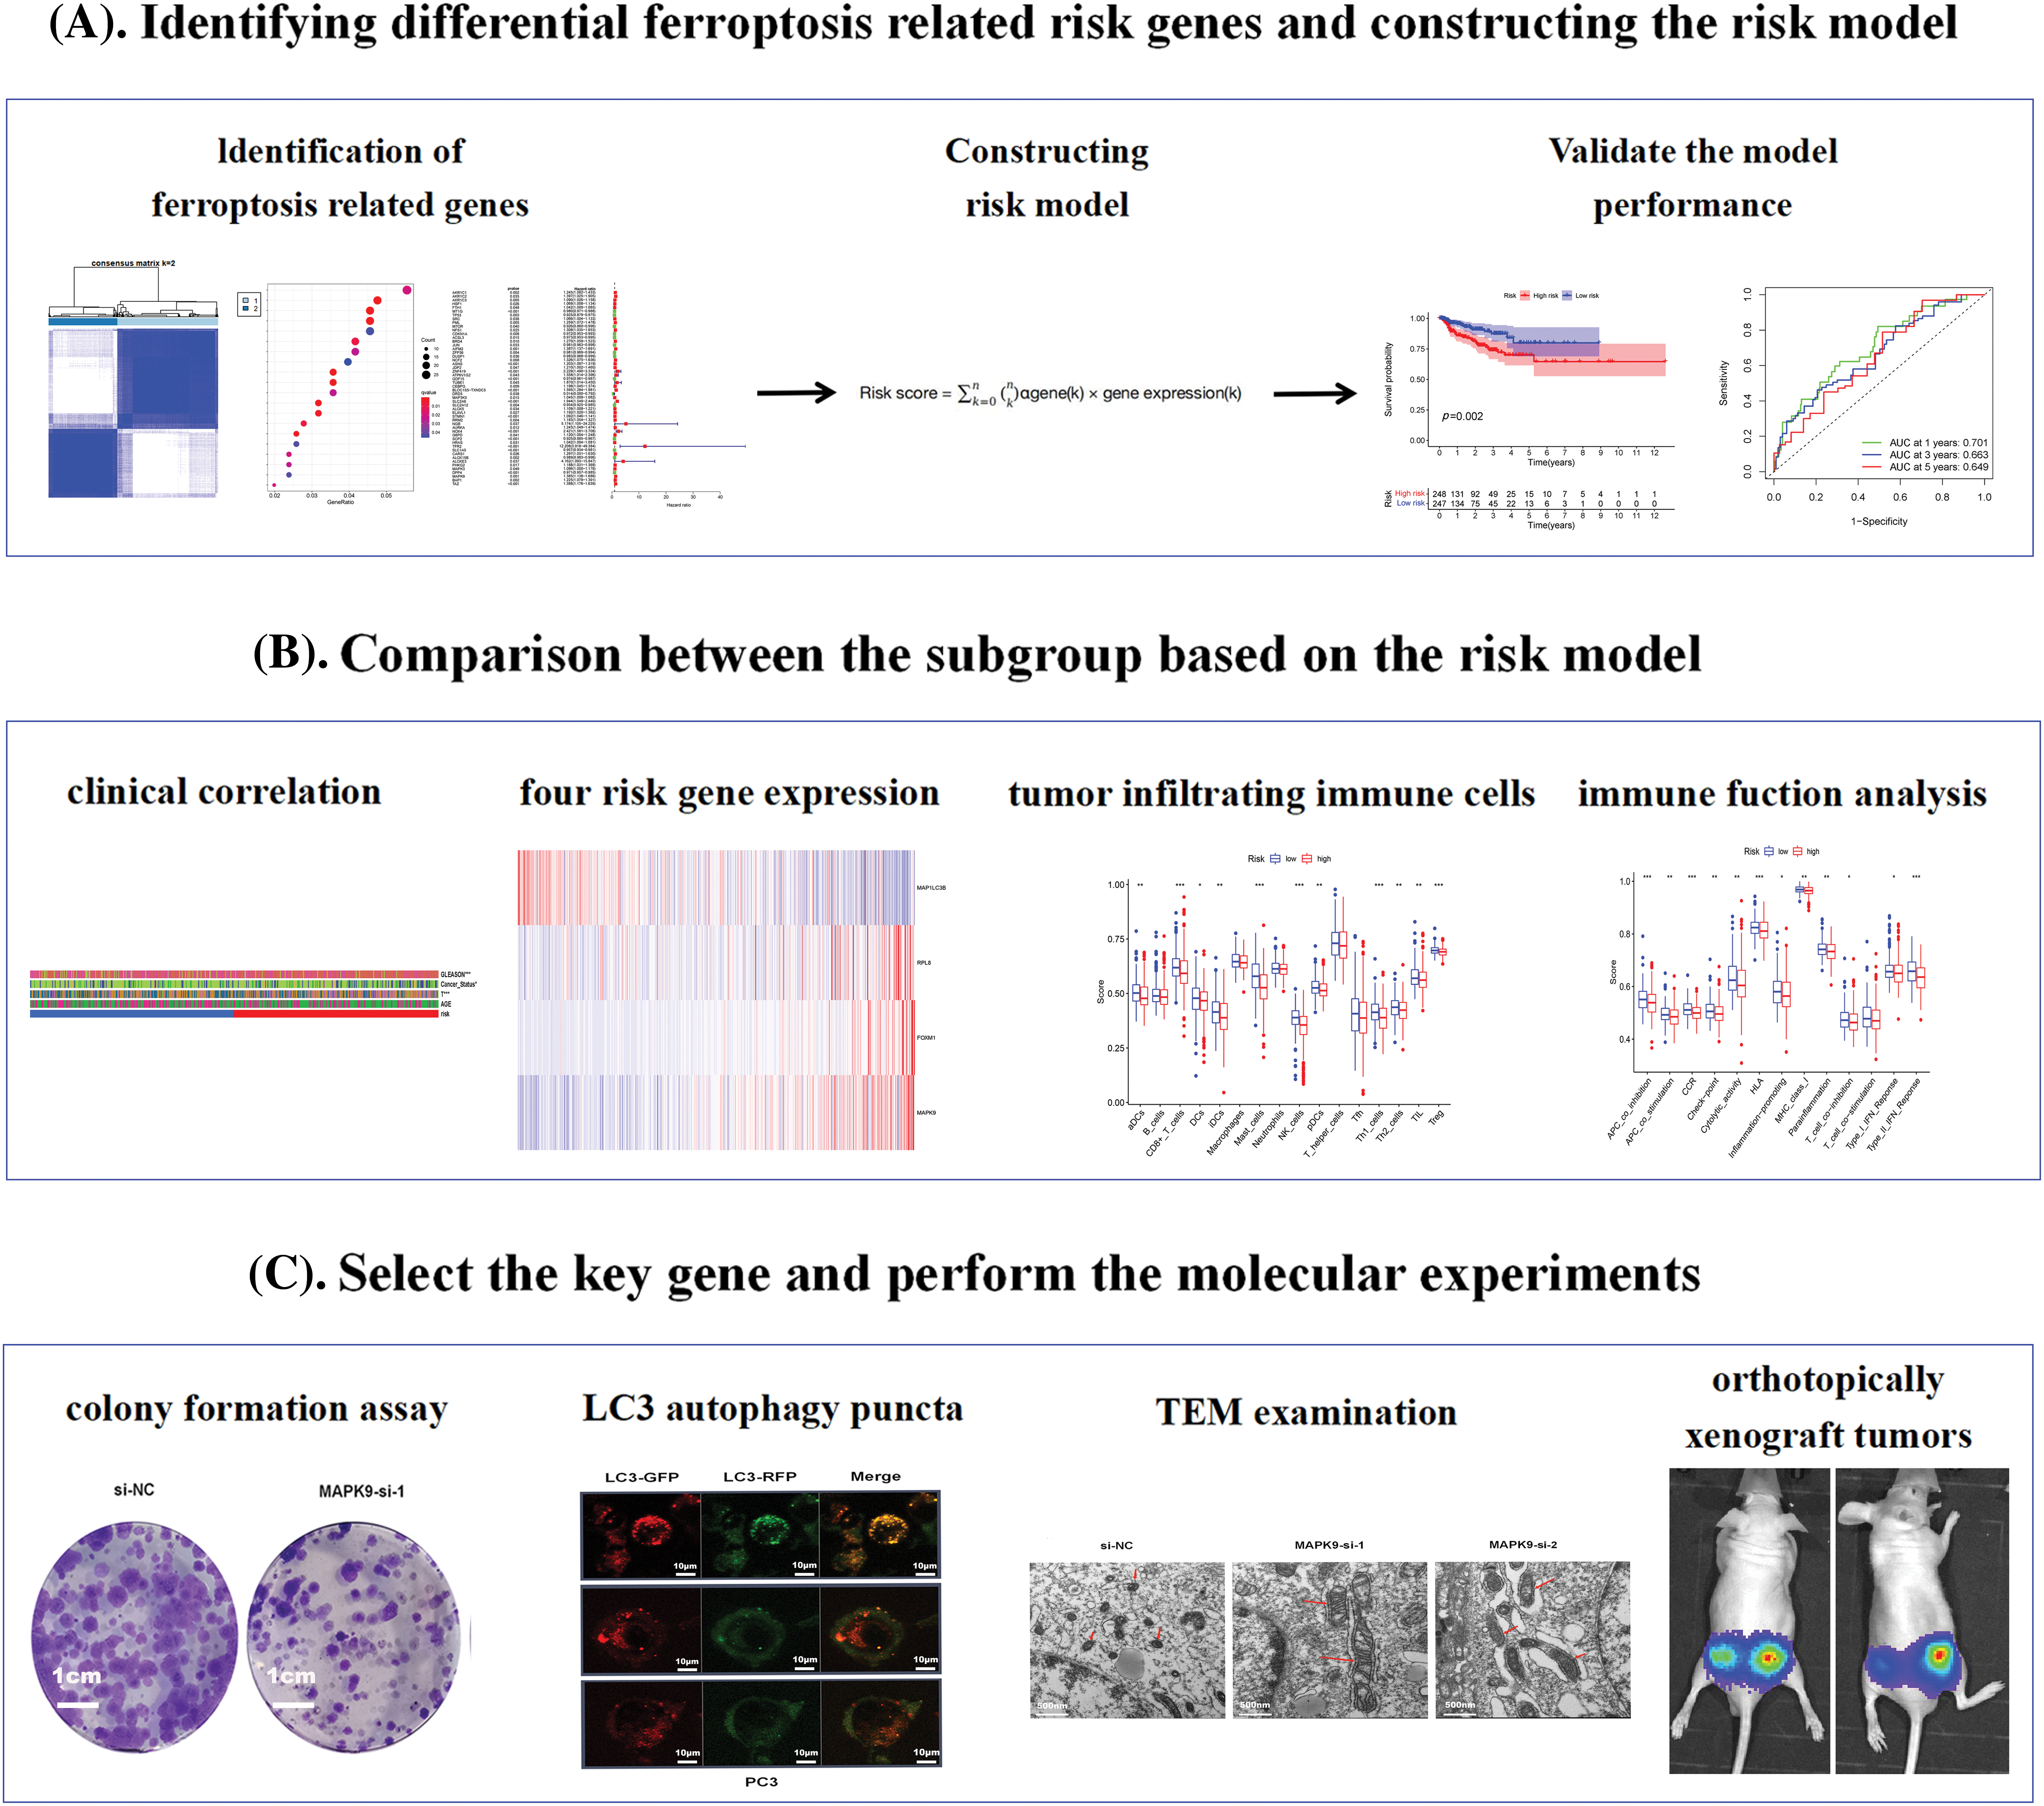
Figure 1: The study flowchart comprised three main stages. (A) Identification of differential pyroptosis-related risk genes and construction of the risk model. (B) Comparison between subgroups based on the risk model. (C) Selection of key genes and execution of molecular experiments (*p value < 0.05; **p value < 0.01; ***p value < 0.001).
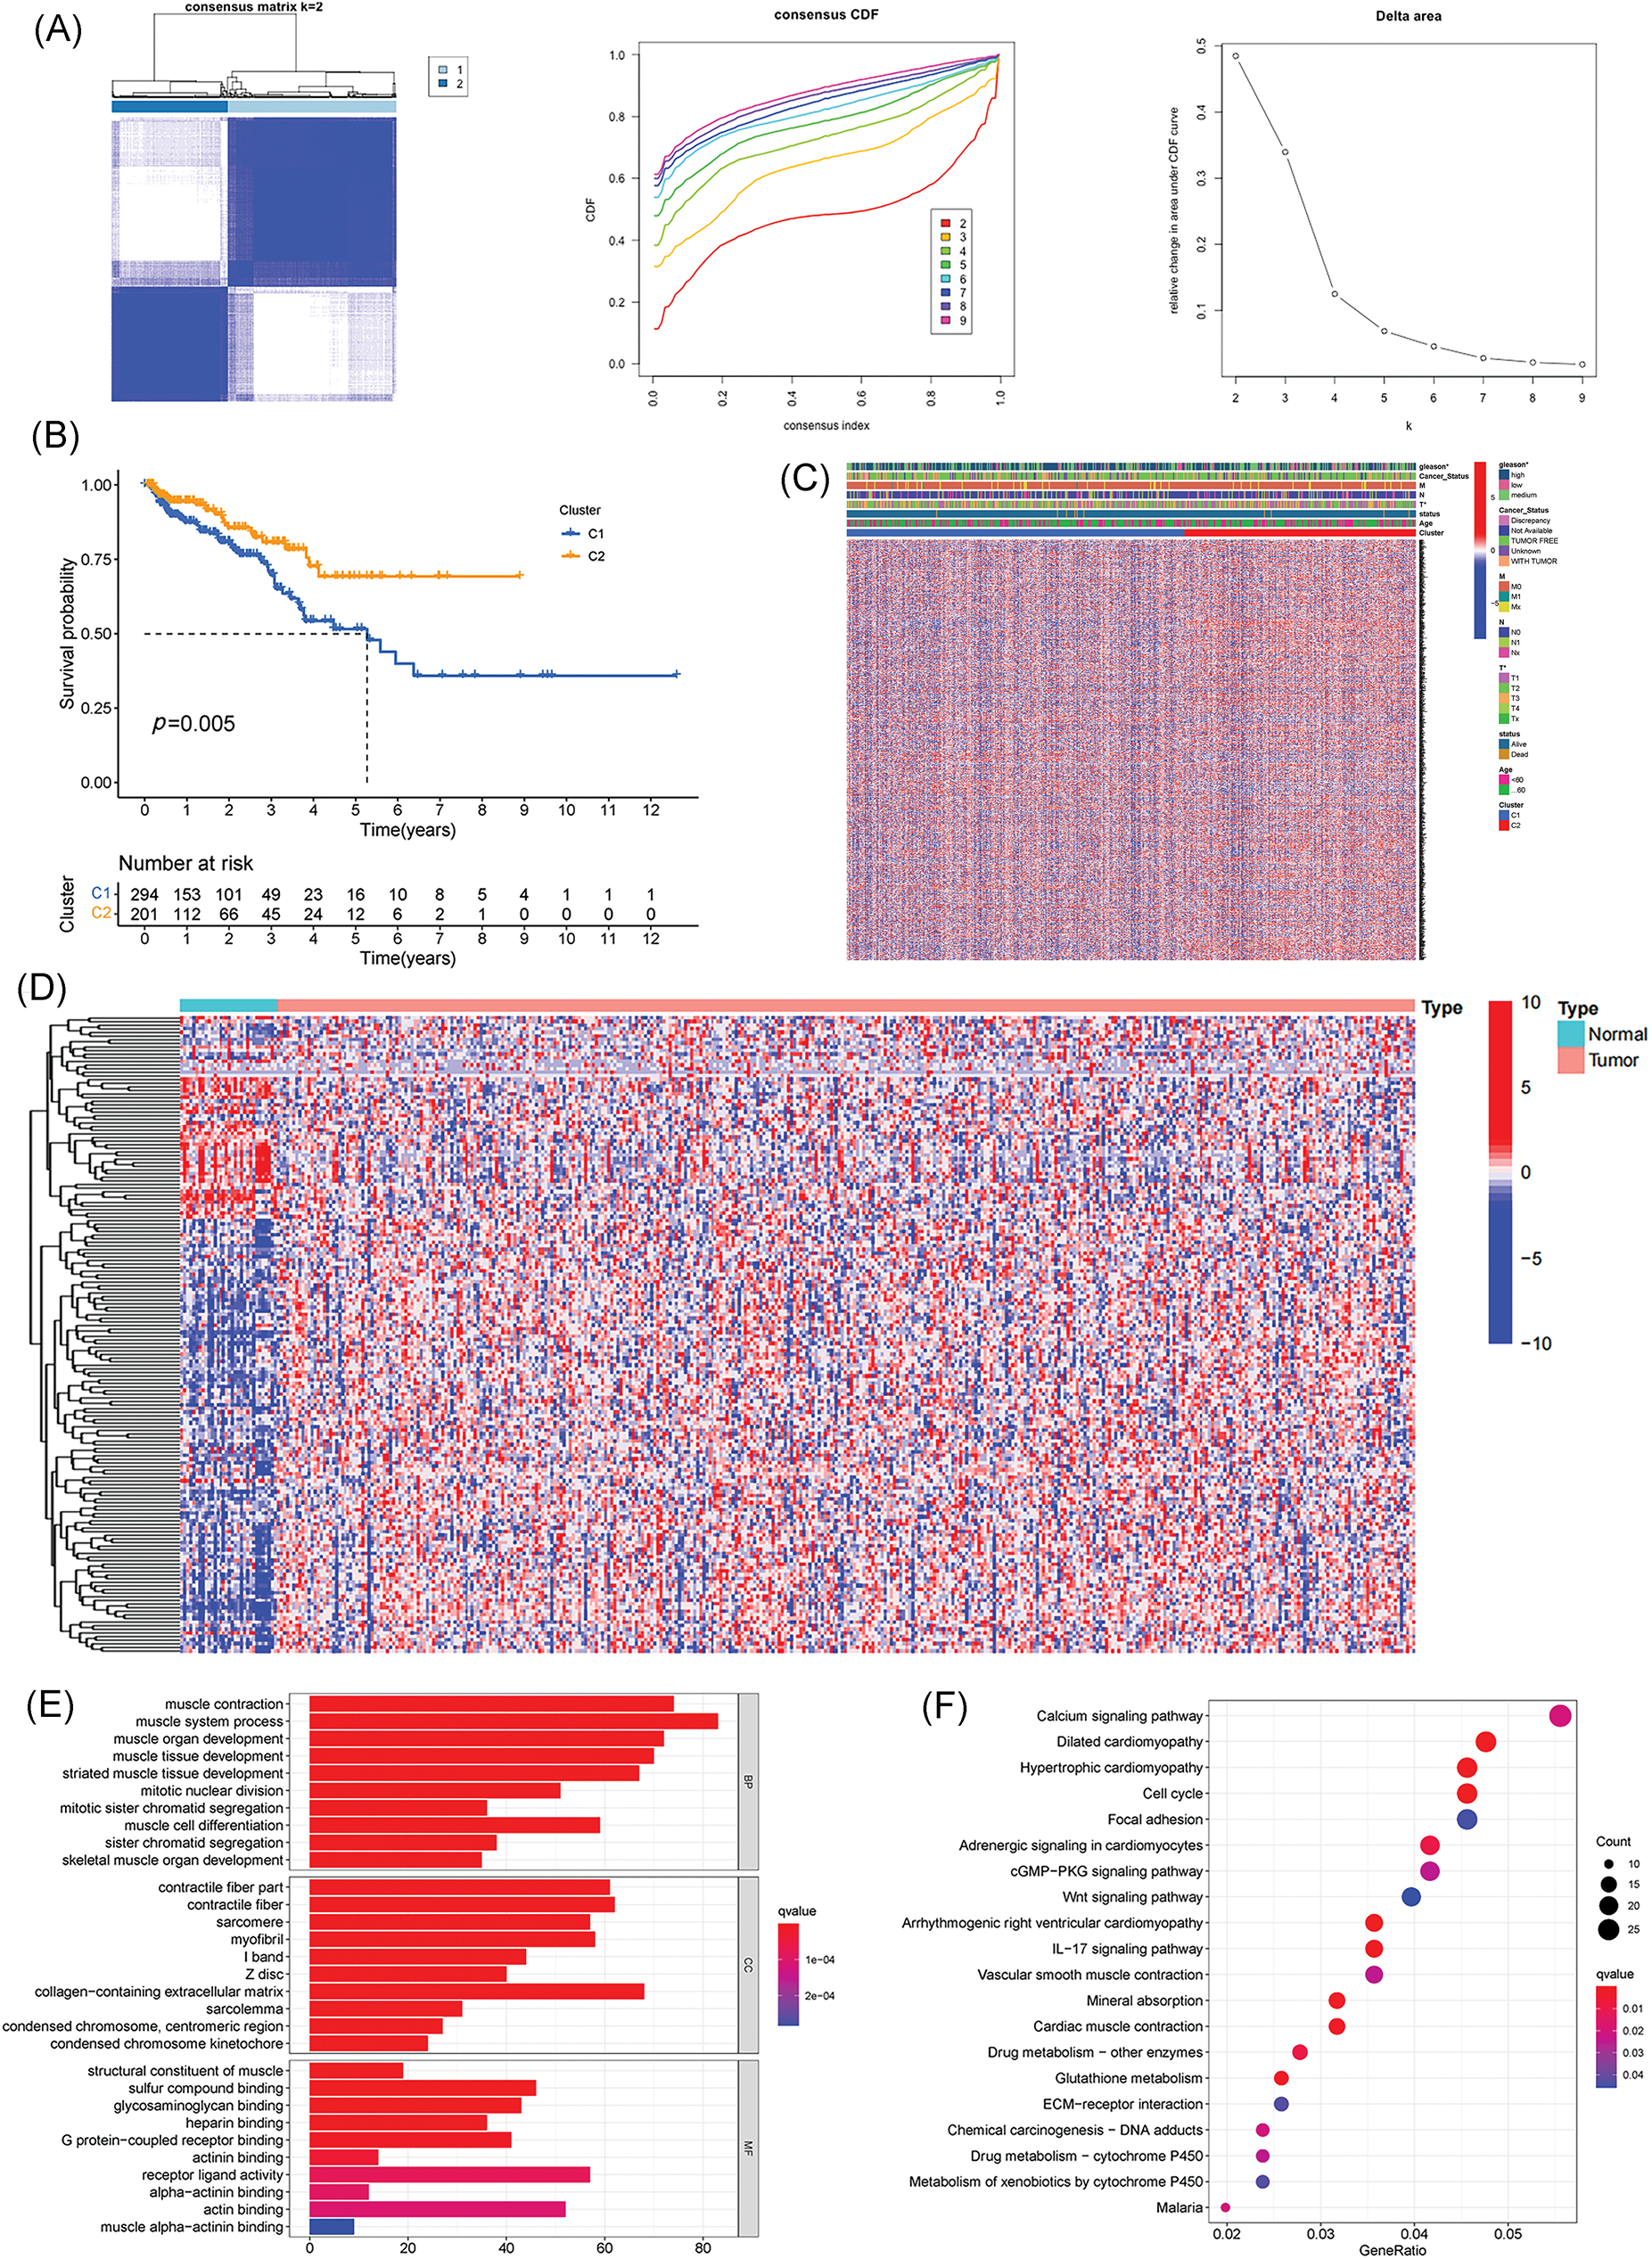
Figure 2: Identification of potential prognostic ferroptosis-related genes (FRGs) in TCGA cohort within cluster 1/2 subgroups; Exploration of the landscape of FRGs in prostate cancer along with potential functional enrichment analysis. (A) Consensus Clustering matrix for k = 2. (B) Kaplan-Meier curves illustrating disease-free survival (DFS). (C) Heatmap depicting cluster 1/2 subgroups. (D) Heatmap displaying differentially expressed FRGs. (E) Gene Ontology (GO) analysis. (F) Kyoto Encyclopedia of Genes and Genomes (KEGG) analysis (*p value < 0.05).
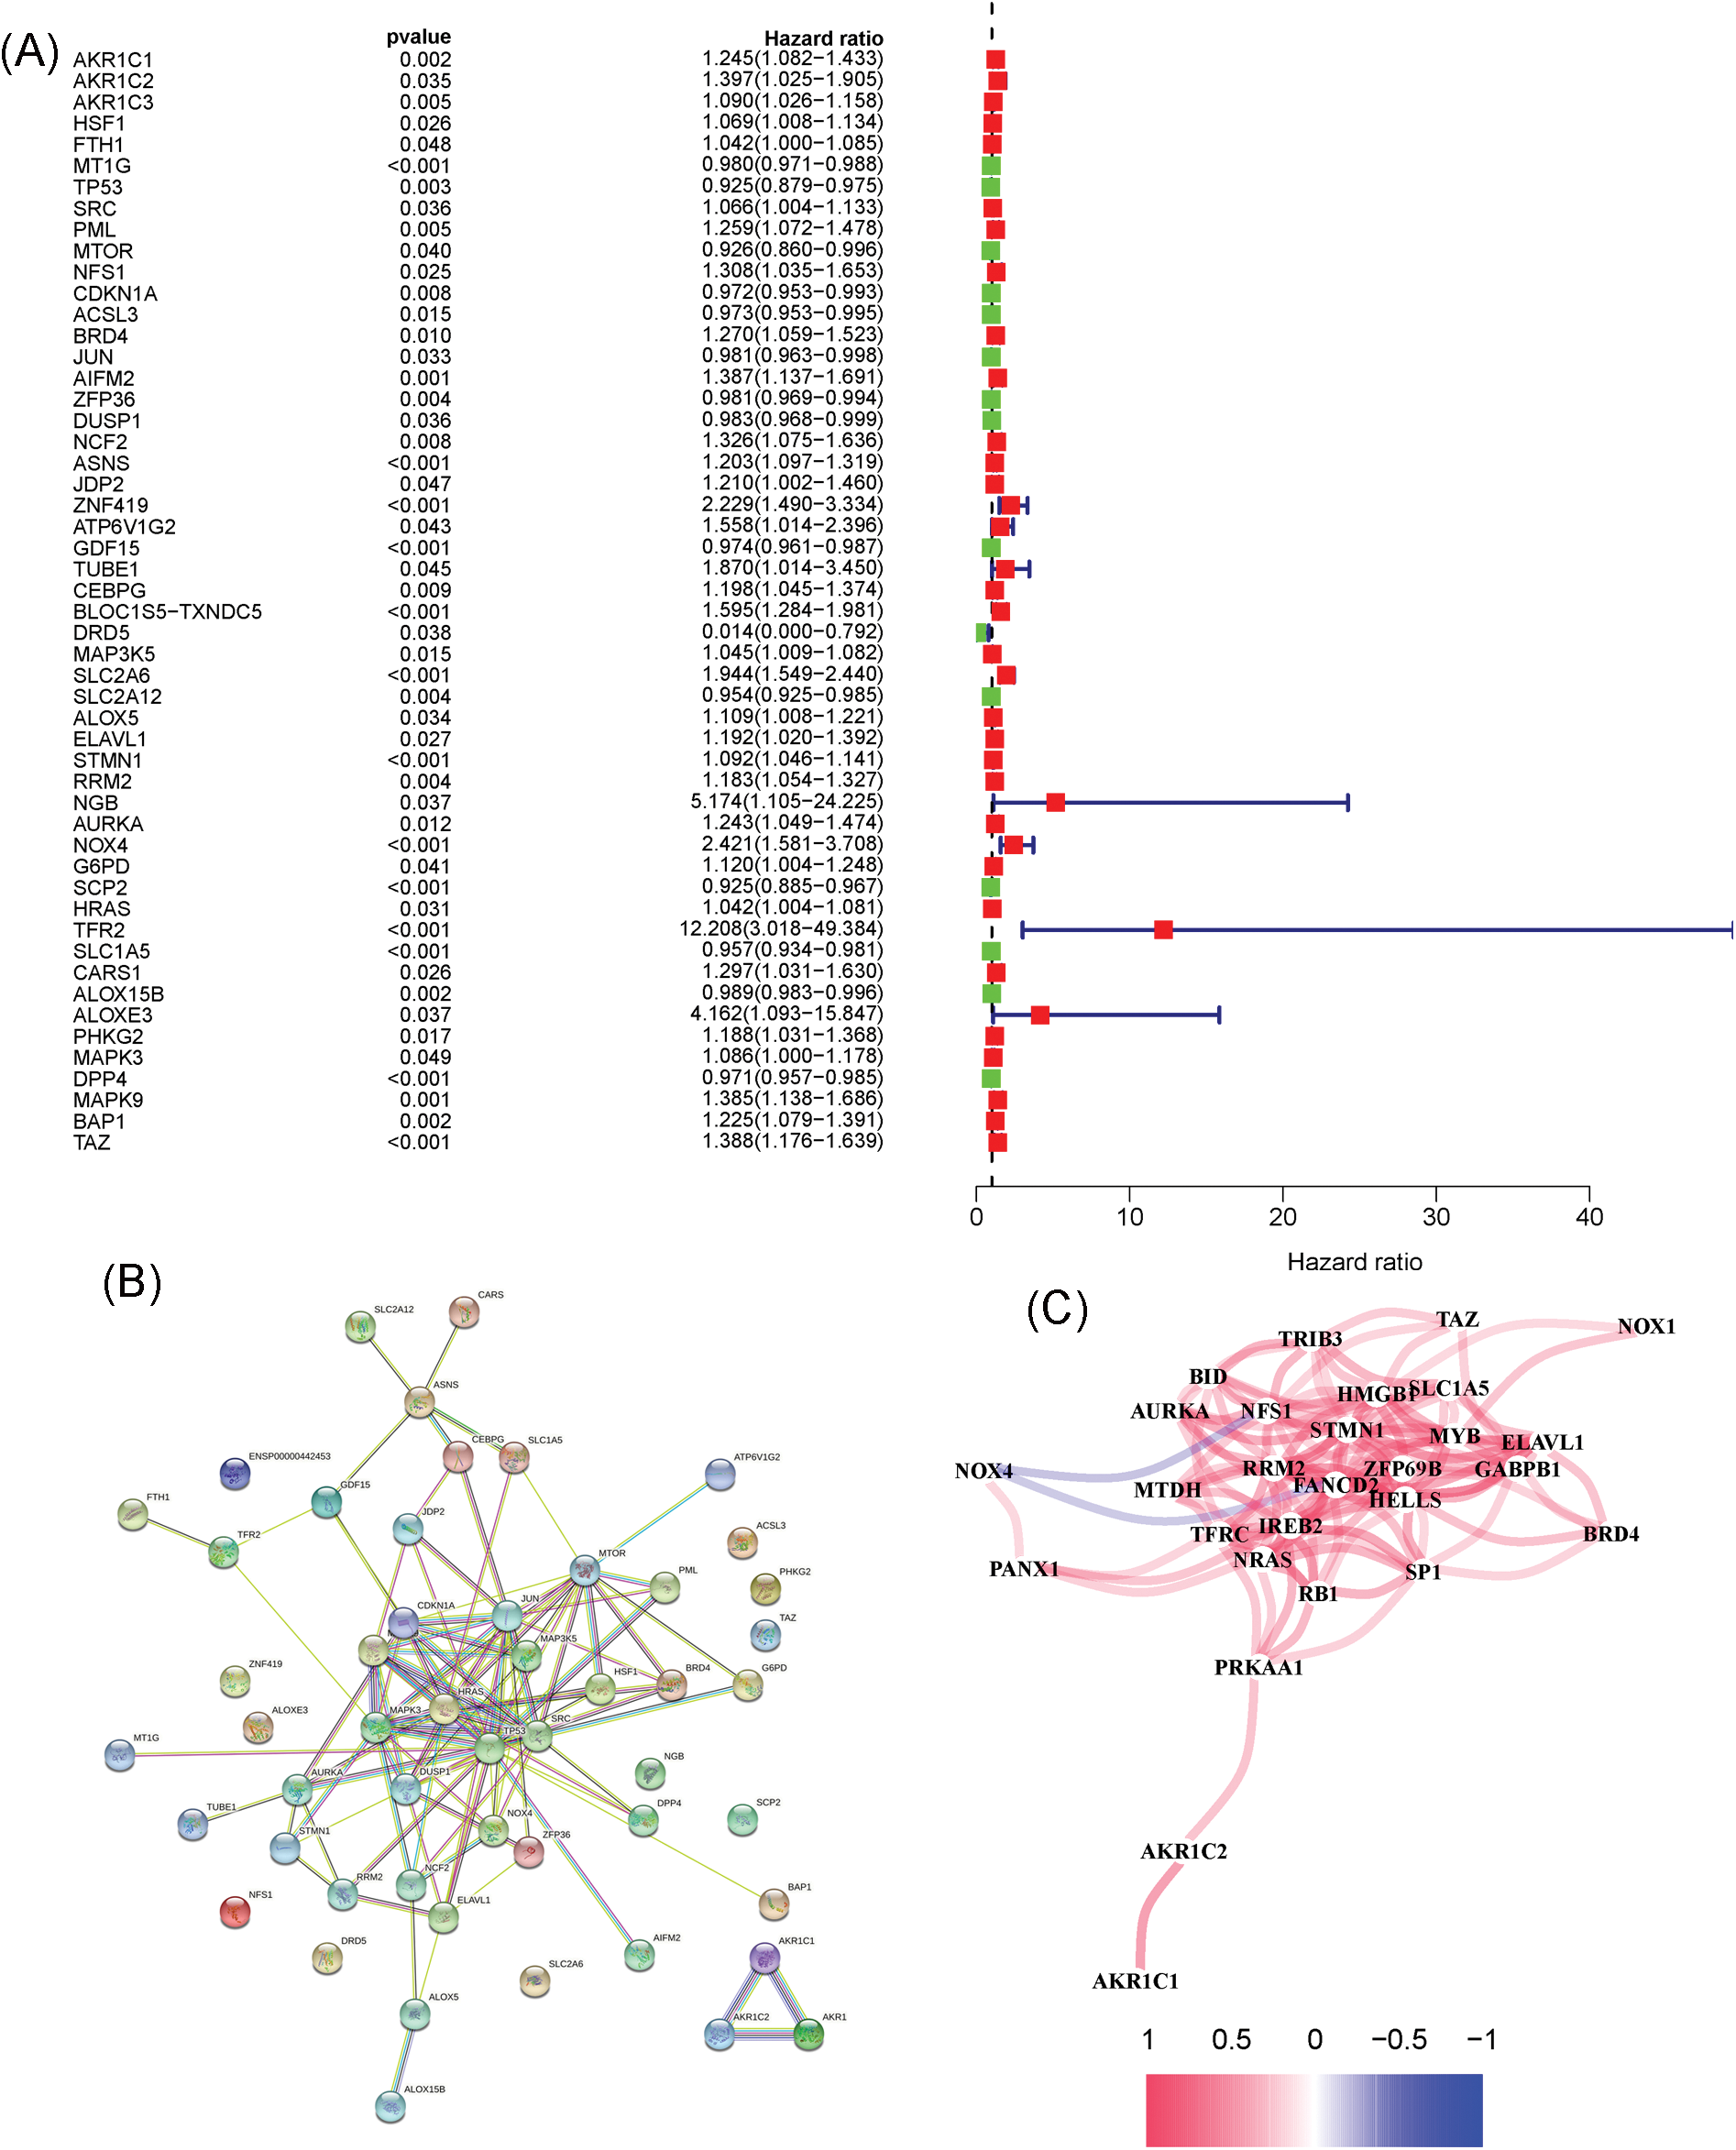
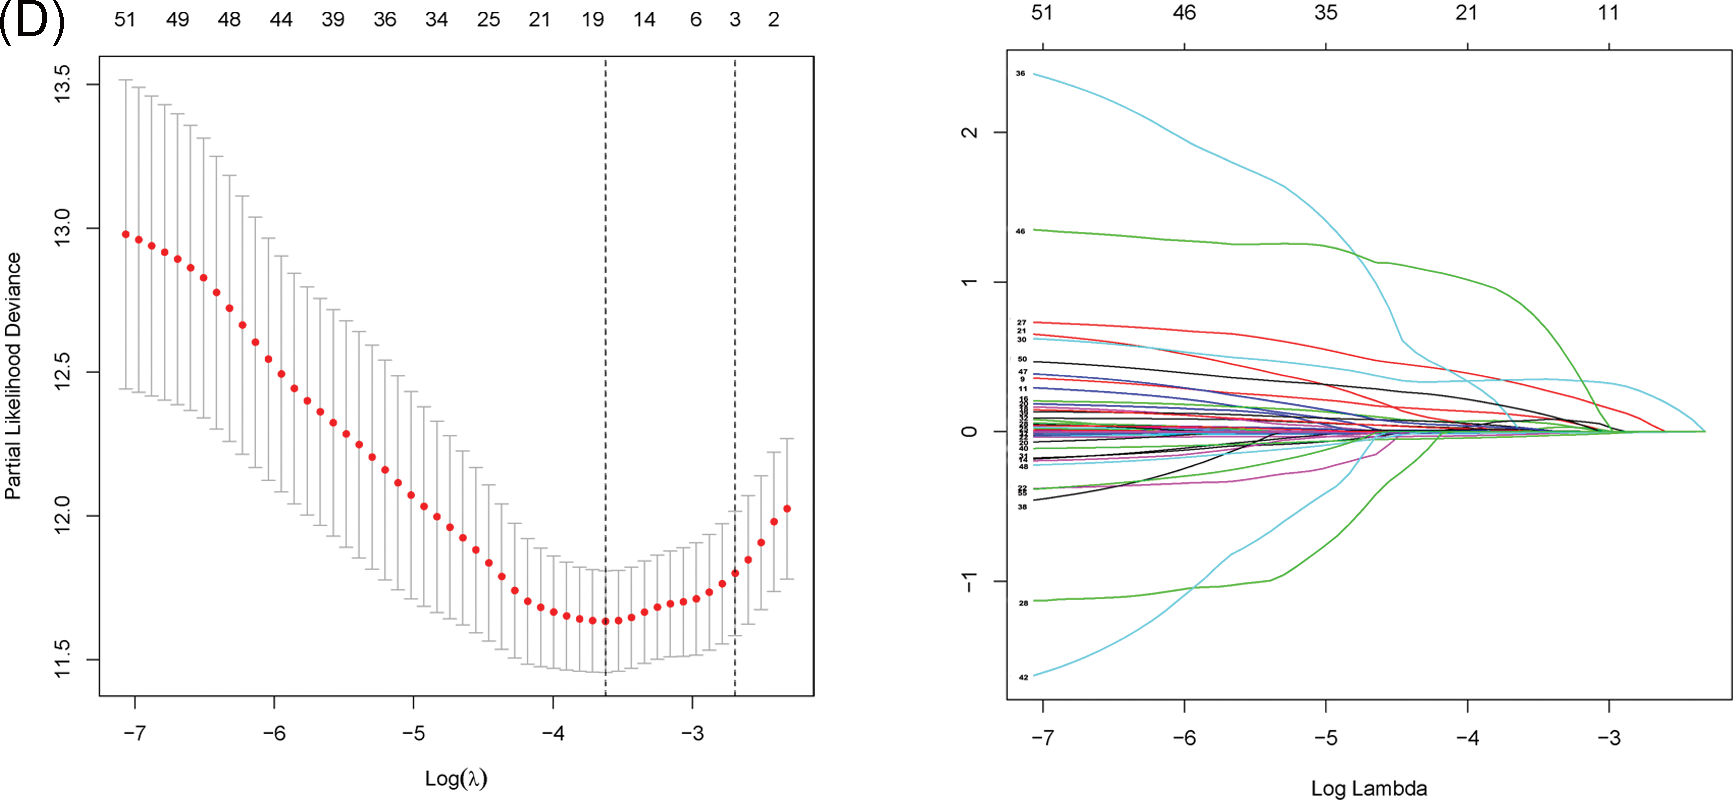
Figure 3: Unveiling the Candidate Gene Network and Crafting a Signature in the TCGA Cohort. (A) Identification of 52 ferroptosis-related genes associated with the biochemical recurrence (BCR) of patients with PCa using univariate Cox regression analysis. (B) Construction of a protein–protein interaction (PPI) network through STRING. (C) Gene expression correlation network. (D) Formation of a four-mRNA signature through LASSO Cox regression.
Risk score = MAP1LC3B × (−0.09620986) + RPL8 × (0.0006965595) + FOXM1 × (0.2140912) + MAPK9 × (0.3583126)
Assessment and validation for prognostic signature
Utilizing the signature calculation formula, patients from the TCGA cohort were stratified into high-risk and low-risk groups based on the median risk score. The analysis revealed a significantly higher proportion of patients experiencing biochemical recurrence (BCR) in the high-risk group compared to the low-risk group (Figs. 4A, 4B). Kaplan-Meier analysis demonstrated that patients in the high-risk group had a higher likelihood of BCR (p < 0.01) and poorer biochemical recurrence-free survival (bRFS) (Fig. 4C). The area under the curve (AUC) values for the developed gene signature were used to assess bRFS prediction, with values of 0.701, 0.663, and 0.649 for 1-, 3-, and 5-year periods, respectively (Fig. 4D). PCA revealed the difference in the two-dimensional spatial distribution of patients from different risk groups (p < 0.001) (Fig. 4E). The evaluation included an examination of the model as an independent predictor for additional clinical factors, encompassing age, GS, and stage, using univariate and multivariate Cox regression analyses. In the presence of all clinical features, risk scores were independently linked to bRFS in both univariate and multivariate analyses (p < 0.05) (Figs. 4F, 4G, and Suppl Table S5). As shown in Fig. 4H, each individual component gene of signature showed no significant association with BCR state, GS, age, and T staging.
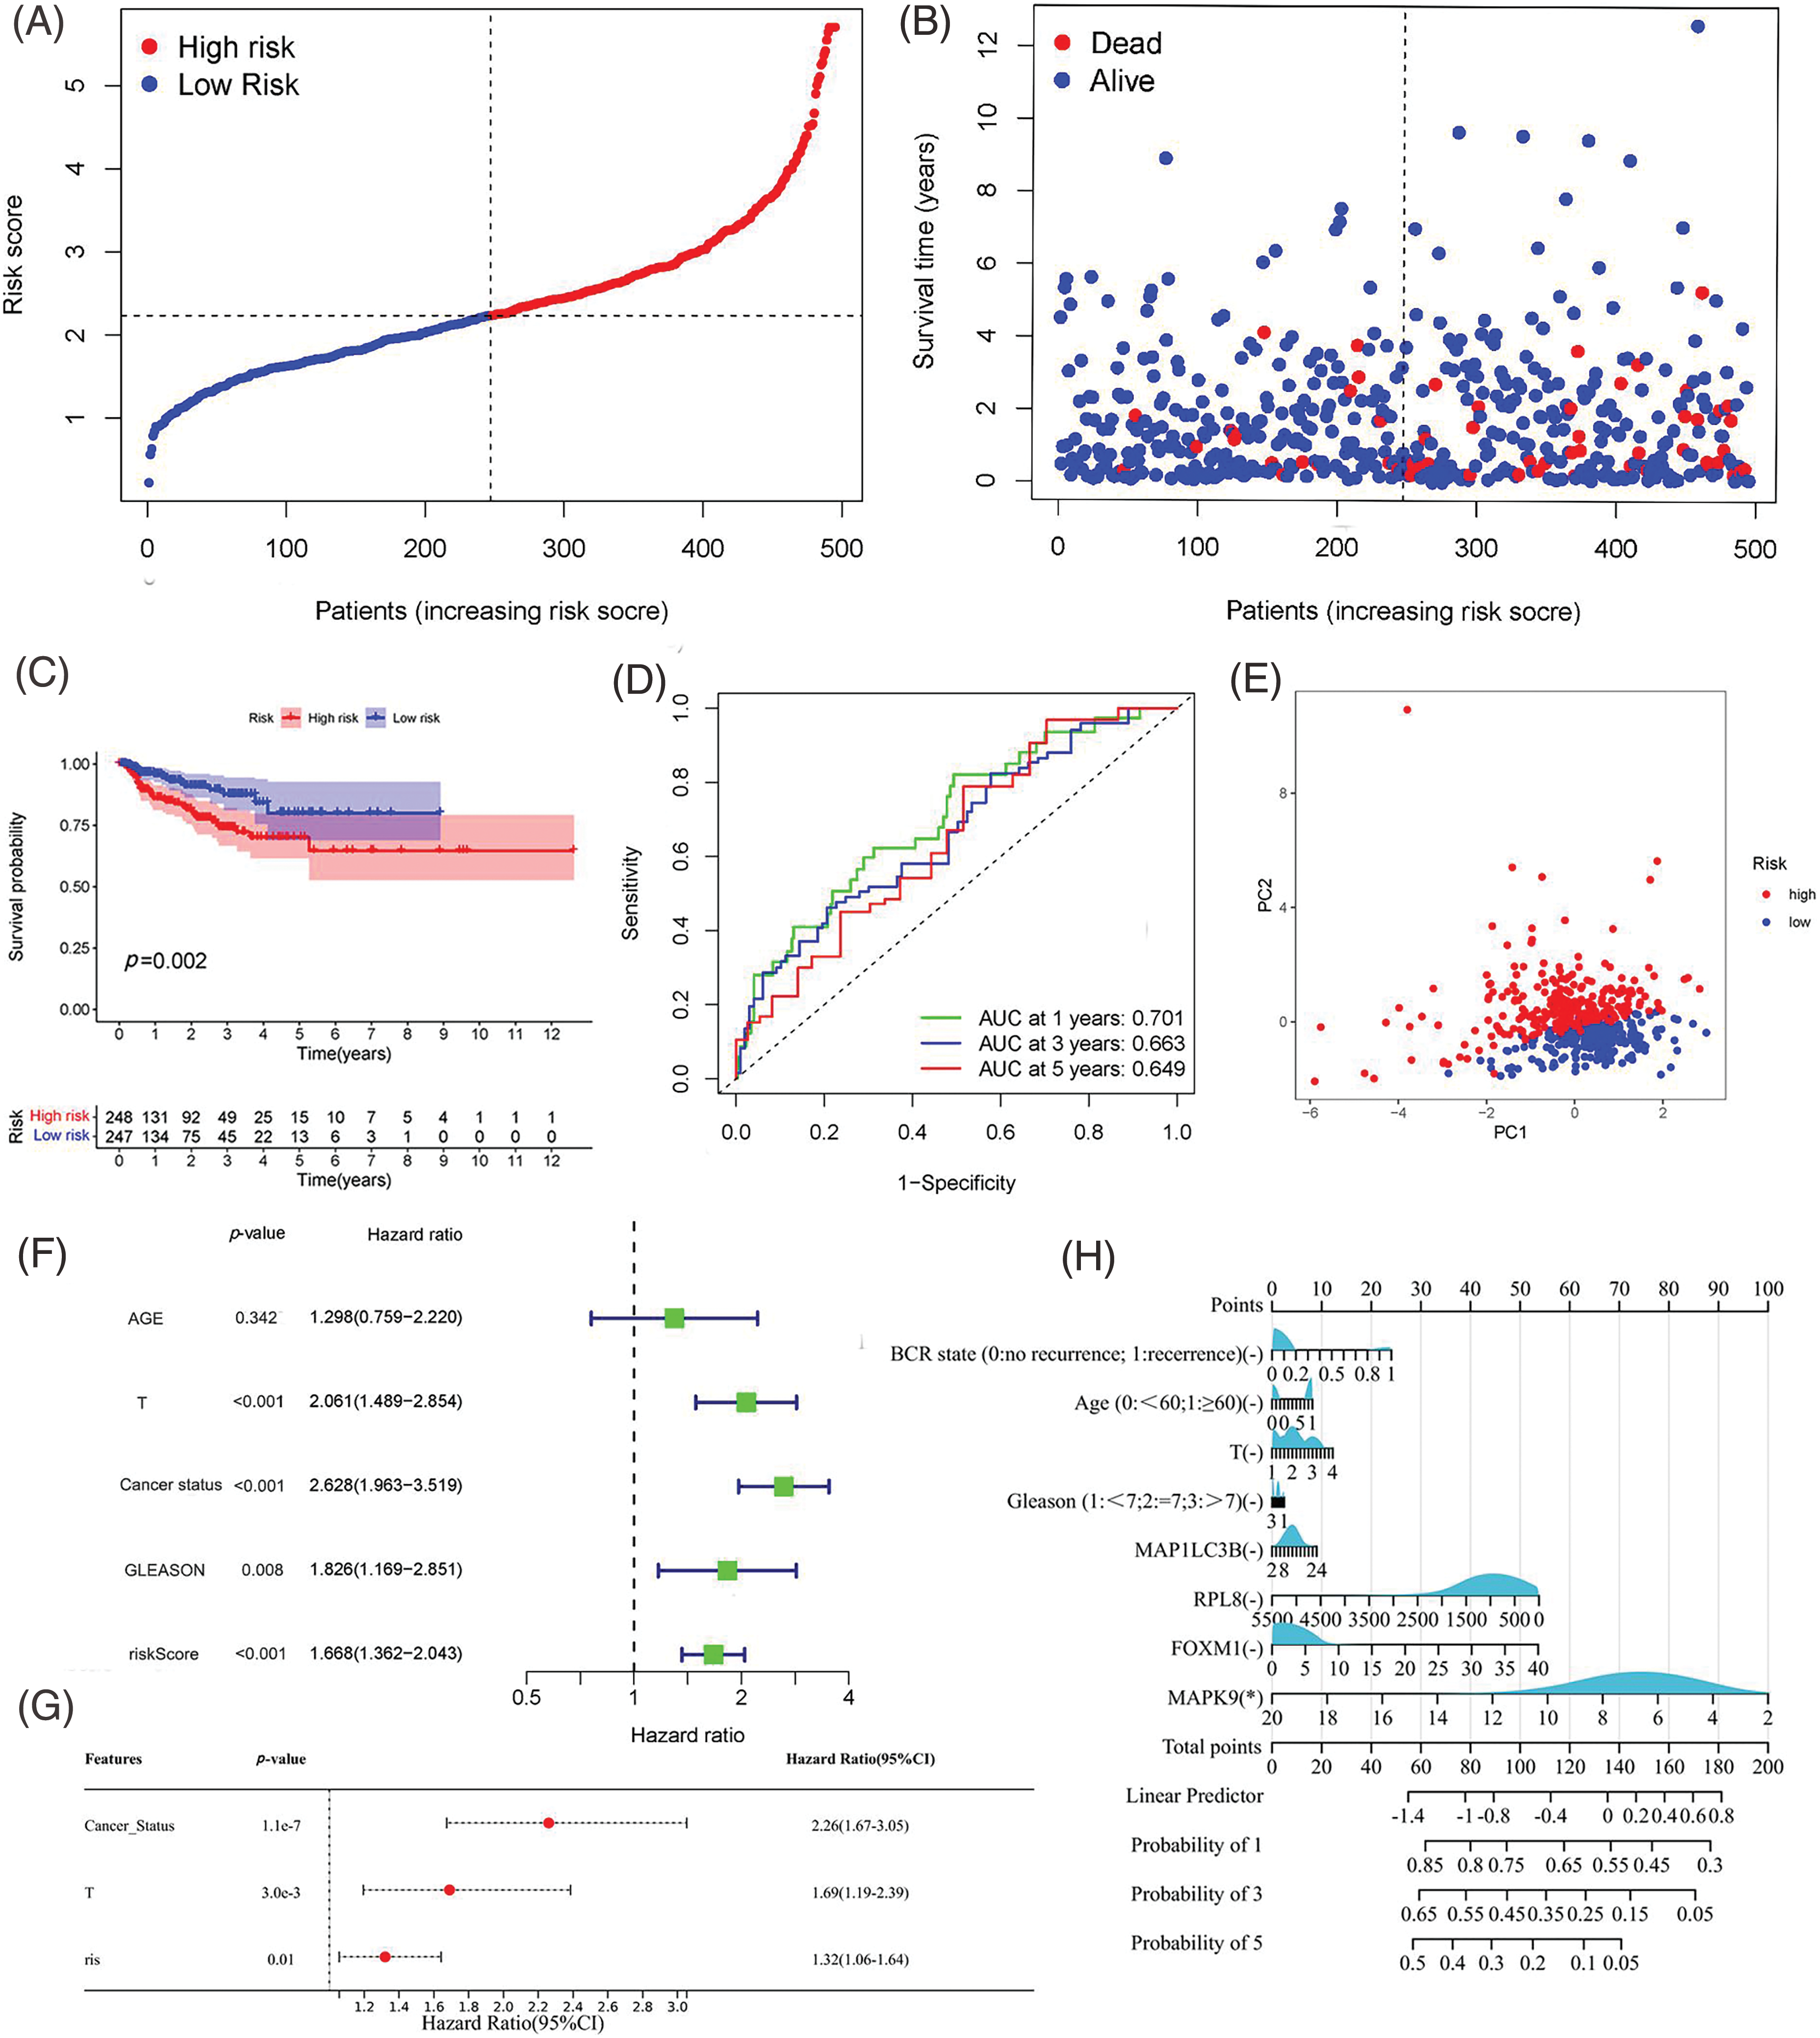
Figure 4: Assessment of Predictive Signature in the TCGA Cohort. (A, B) Presentation of the risk score curve and Biochemical Recurrence (BCR) status of the patients. (C) Examination of Biochemical Relapse-Free Survival (bRFS) in subgroups categorized based on the median risk scores computed by the risk model. (D) Receiver Operating Characteristic (ROC) curve of the model and clinical attributes predicting 1-, 3-, and 5-year bRFS. (E) Discrimination of both risk groups through Principal Component Analysis (PCA). (F, G) Univariate and multivariate Cox regression analyses highlighting the significant prognostic values of the risk score. (H) Correlation of individual component genes of the signature with clinical factors (*p value < 0.05).
Validation of the predictive robustness of the model was conducted using the GEO cohort, employing identical statistical approaches to mitigate information bias-induced errors. Importantly, the results from the validation set closely mirrored those observed in the TCGA cohort, with the high-risk group consistently demonstrating a higher incidence of biochemical recurrence (BCR) in comparison to the low-risk group (Figs. 5A, 5B). Survival analysis indicated a link between high-risk scores and poor bRFS in PCa patients (Fig. 5C). The AUC values in 1-, 3-, and 5-year under the prognostic model of bRFS were 0.589, 0.691 and 0.727, respectively (Fig. 5D). PCA findings revealed distinct trends among various risk subgroups on the two-dimensional plane (Fig. 5E). Notably, the risk score remained an independent prognostic factor for the GEO cohort (Figs. 5F, 5G) and once again, individual genes showed no significant correlation with clinical factors (Fig. 5H).
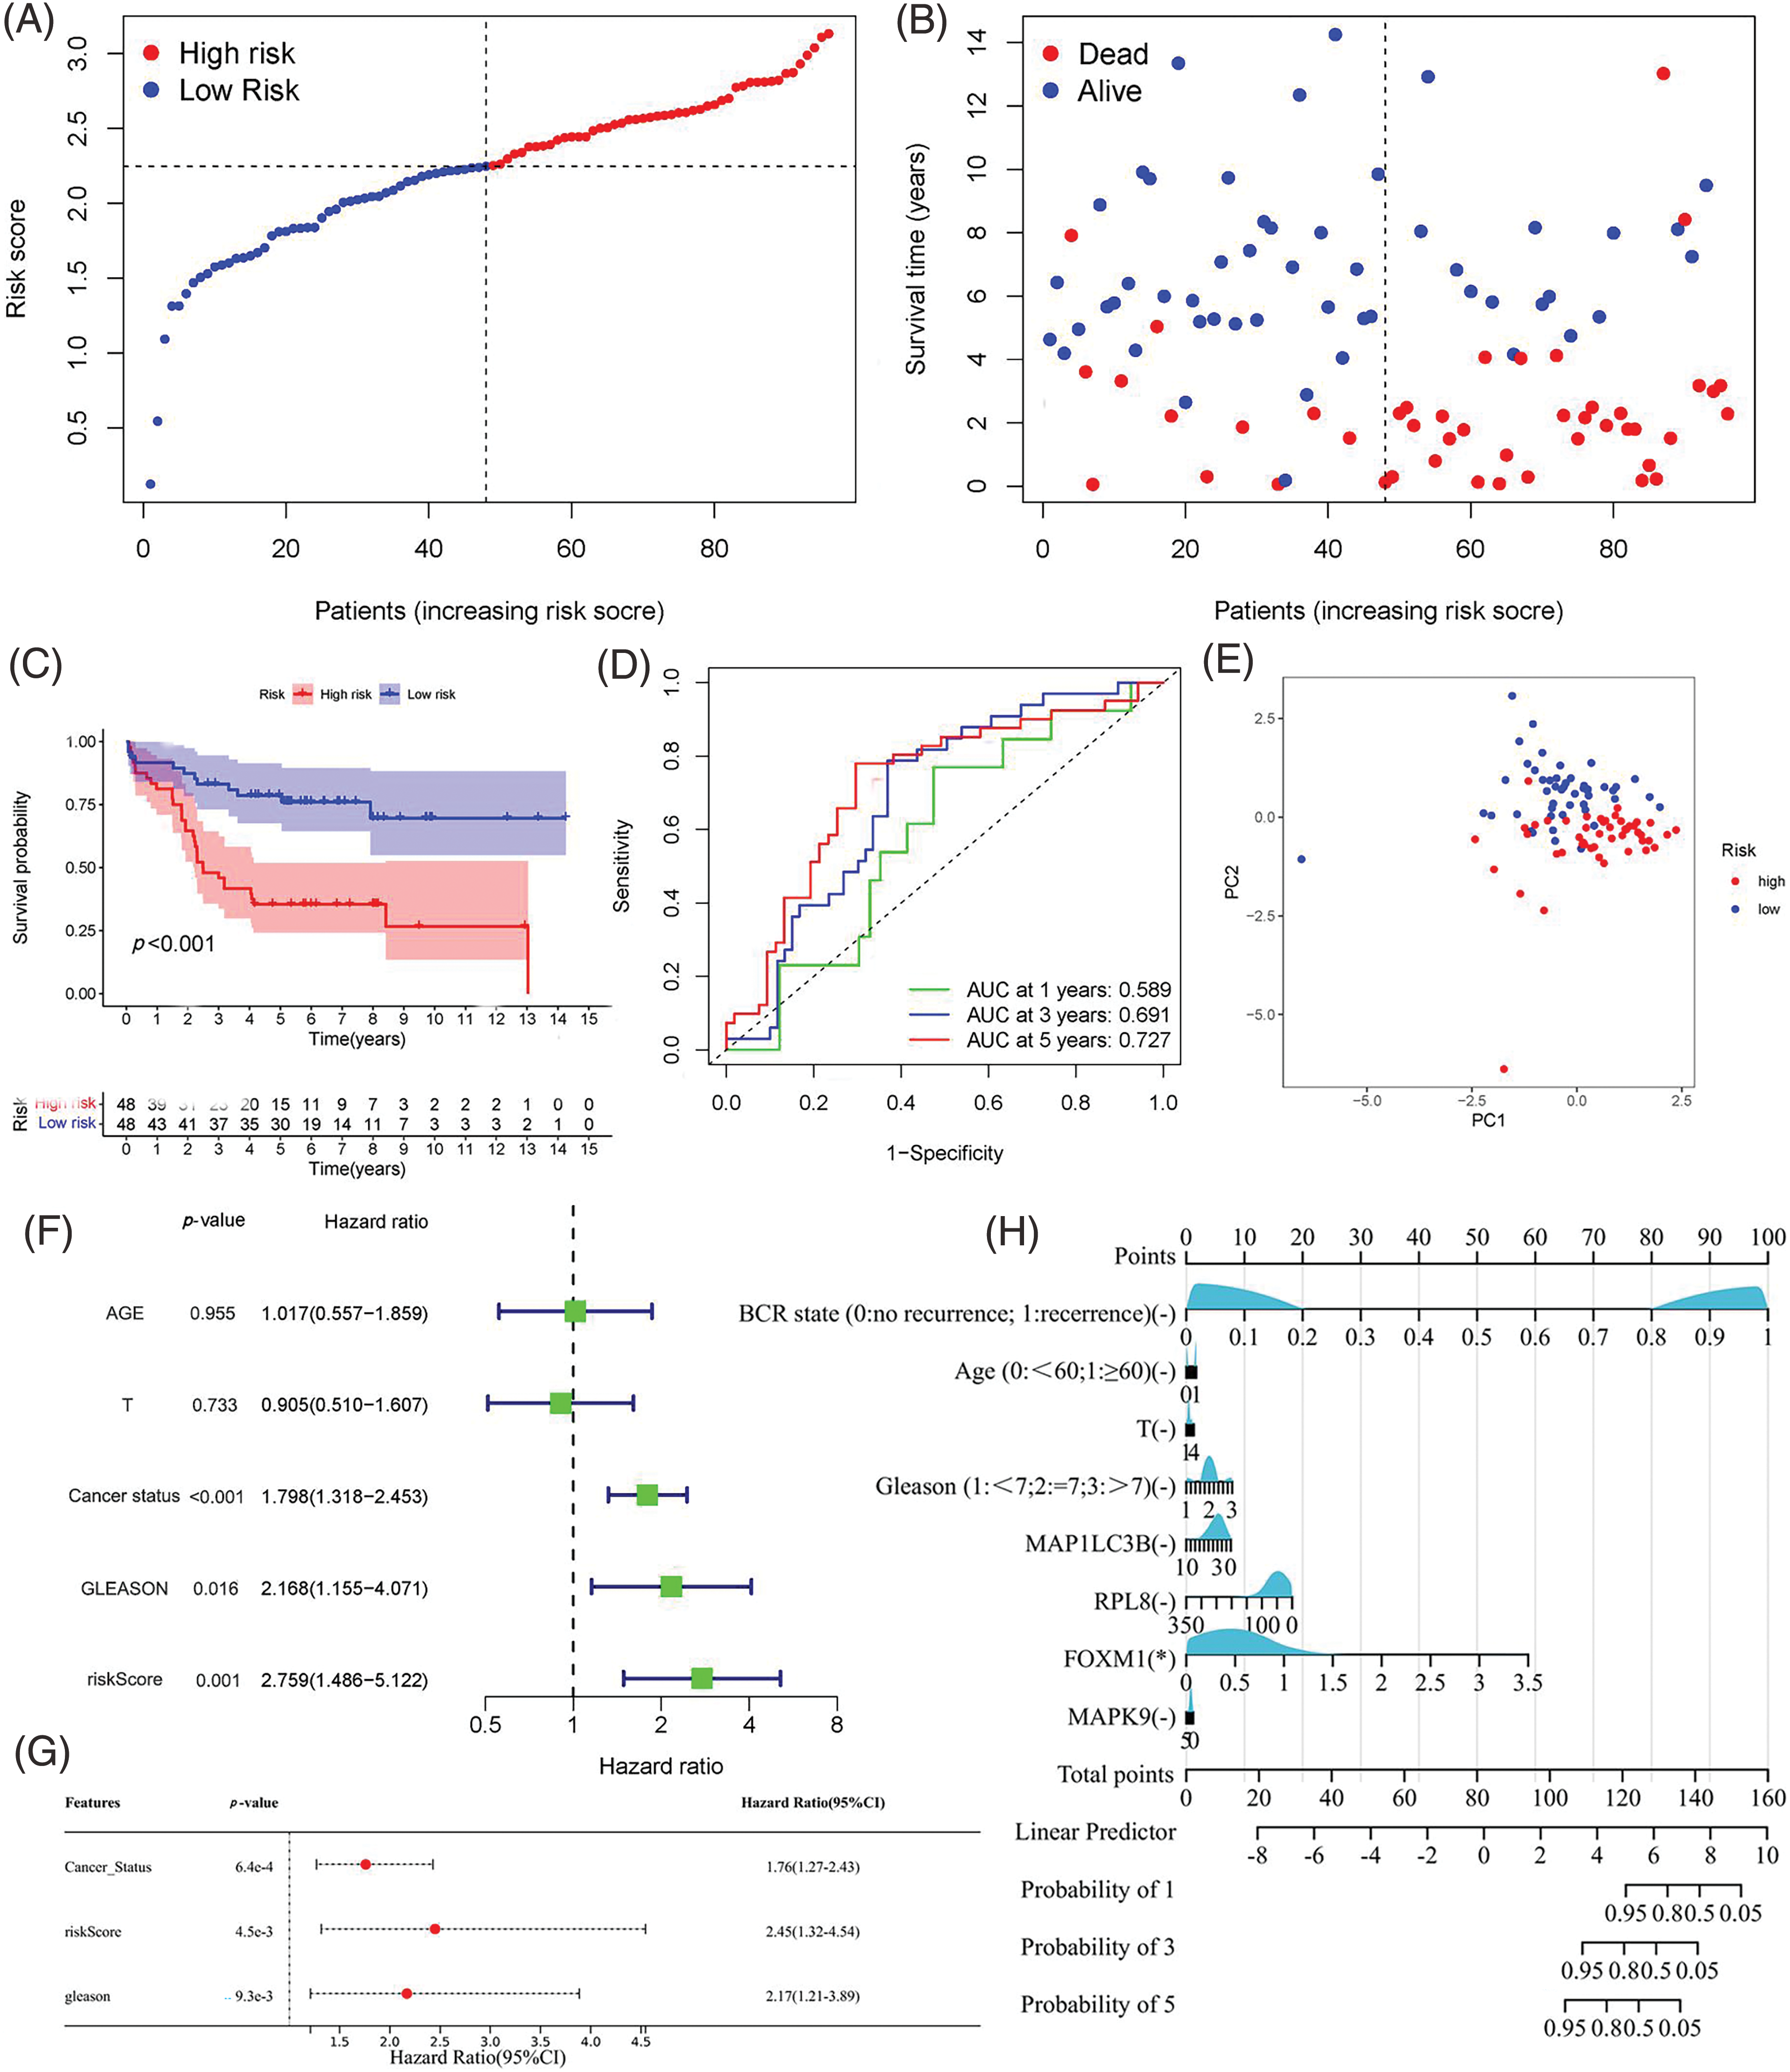
Figure 5: Validation of the Predictive Signature in the GEO Cohort. (A, B) Presentation of the risk score curve and Biochemical Recurrence (BCR) status of the patients. (C) Analysis of Biochemical Relapse-Free Survival (bRFS) in the two subgroups classified based on the median risk scores computed by the risk model. (D) Receiver Operating Characteristic (ROC) curve comparing the predictive ability of the model and clinical features for 1-, 3-, and 5-year bRFS. (E) Principal Component Analysis (PCA) distinguishing the two risk groups. (F, G) Univariate and multivariate Cox regression analyses highlighting the significant prognostic values of the risk score. (H) Correlation of individual component genes of the signature with clinical factors (*p value < 0.05).
Correlation of prognostic risk signature with clinical characteristics
To assess the predictive ability of the prognostic risk model for clinical characteristics, a correlation was established between risk score and clinical features, including age, BCR state, GS, and T-staging. In the TCGA cohort, the risk grouping system was notably associated with BCR state, GS, and T-staging, while no significant correlation was observed with age. The high-risk group displayed a higher incidence of biochemical recurrence (BCR), along with elevated Gleason score (GS) and more advanced T-staging compared to the low-risk group. Analysis of gene expression heatmap revealed heightened expression levels of risk factors like ribosomal protein L8 (RPL8), forkhead box M1 (FOXM1), and MAPK9 in the high-risk group, while the protective factor microtubule-associated protein 1 light chain 3 beta (MAP1LC3B) showed increased expression in the low-risk group across both cohorts (Fig. 6 and Suppl. Table S6).
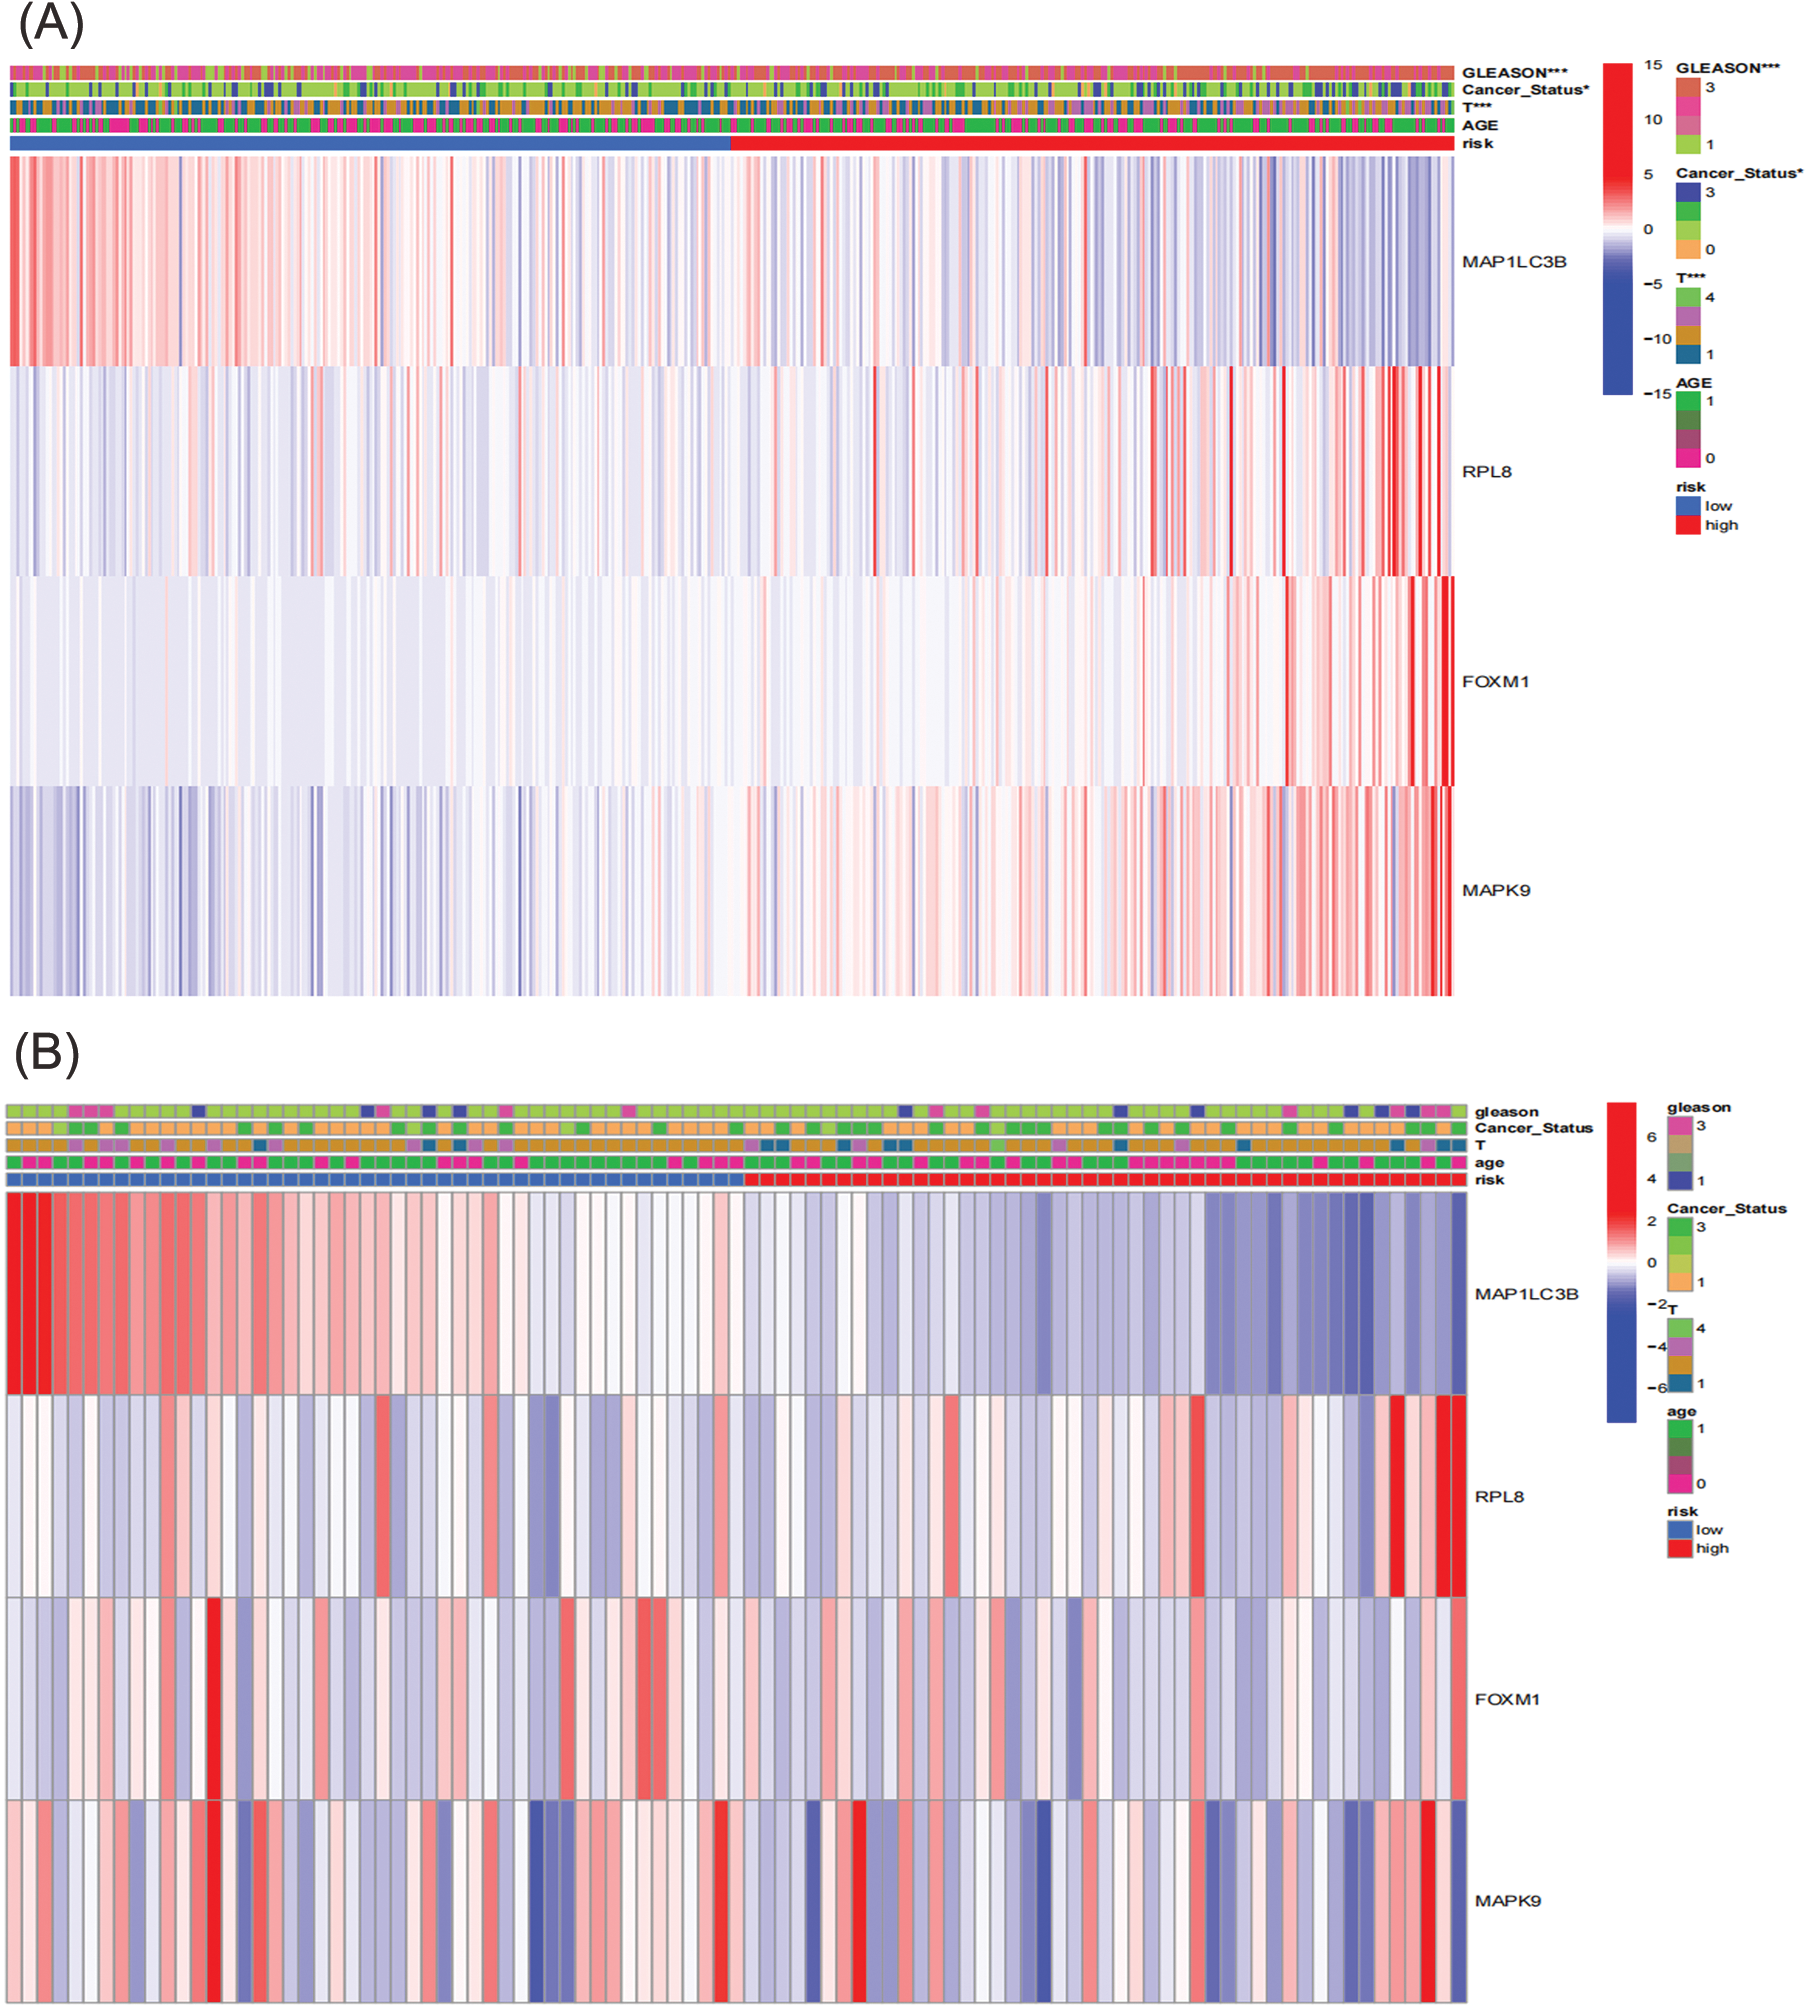
Figure 6: Correlation between prognosis and clinicopathological factors in two cohorts. (A) TCGA; (B) GEO (*p < 0.05; **p < 0.01; ***p < 0.001).
Immune infiltration and expression of immune checkpoint molecules
Previous studies have suggested that ferroptosis may be linked to immune function, immune cells, or immune microenvironment. For example, Kim et al. have reported that parallel studies confirm iron death can induce potent immune suppression in the tumor microenvironment (TME) by affecting both innate and adaptive immune responses [28]. Liao et al. discovered that T cell-derived interferon (IFN)γ, in conjunction with arachidonic acid (AA), collectively induces immunogenic tumor ferroptosis, serving as a mechanism for CD8 T cell (CTL)-mediated tumor killing [29]. Wang et al. found that the activation of CD8 T cells by immunotherapy enhances specific lipid peroxidation associated with ferroptosis in tumor cells. The increased occurrence of ferroptosis contributes to the anti-tumor efficacy of immunotherapy. In mechanistic terms, the secretion of interferon-gamma (IFN γ) by CD8 T cells triggers the suppression of solute carrier family 3 member 2 (SLC3A2) and solute carrier family 7 member 11 (SLC7A11) expression. SLC3A2 and SLC7A11 are two subunits of the glutamate-cystine antiporter system, impairing the uptake of cystine by tumor cells, thereby promoting lipid peroxidation and ferroptosis in tumor cells [30]. Thus, to investigate its correlation with immune infiltration, we analyzed the differences in the infiltration of 16 immune cell types and the activity of 13 immune-related pathways between the two risk groups. Our findings indicated that the low-risk group showed higher scores for most immune cells and functions, particularly aDCs, Th2 cells, Treg, T cell co-inhibition, and Type II IFN Response, compared to the high-risk group (Figs. 7A–7D and Suppl. Table S7). Additionally, the low-risk group exhibited elevated expression levels of key immune checkpoint molecules relative to the high-risk group (Figs. 8A, 8B and Suppl. Tables S8, S9).
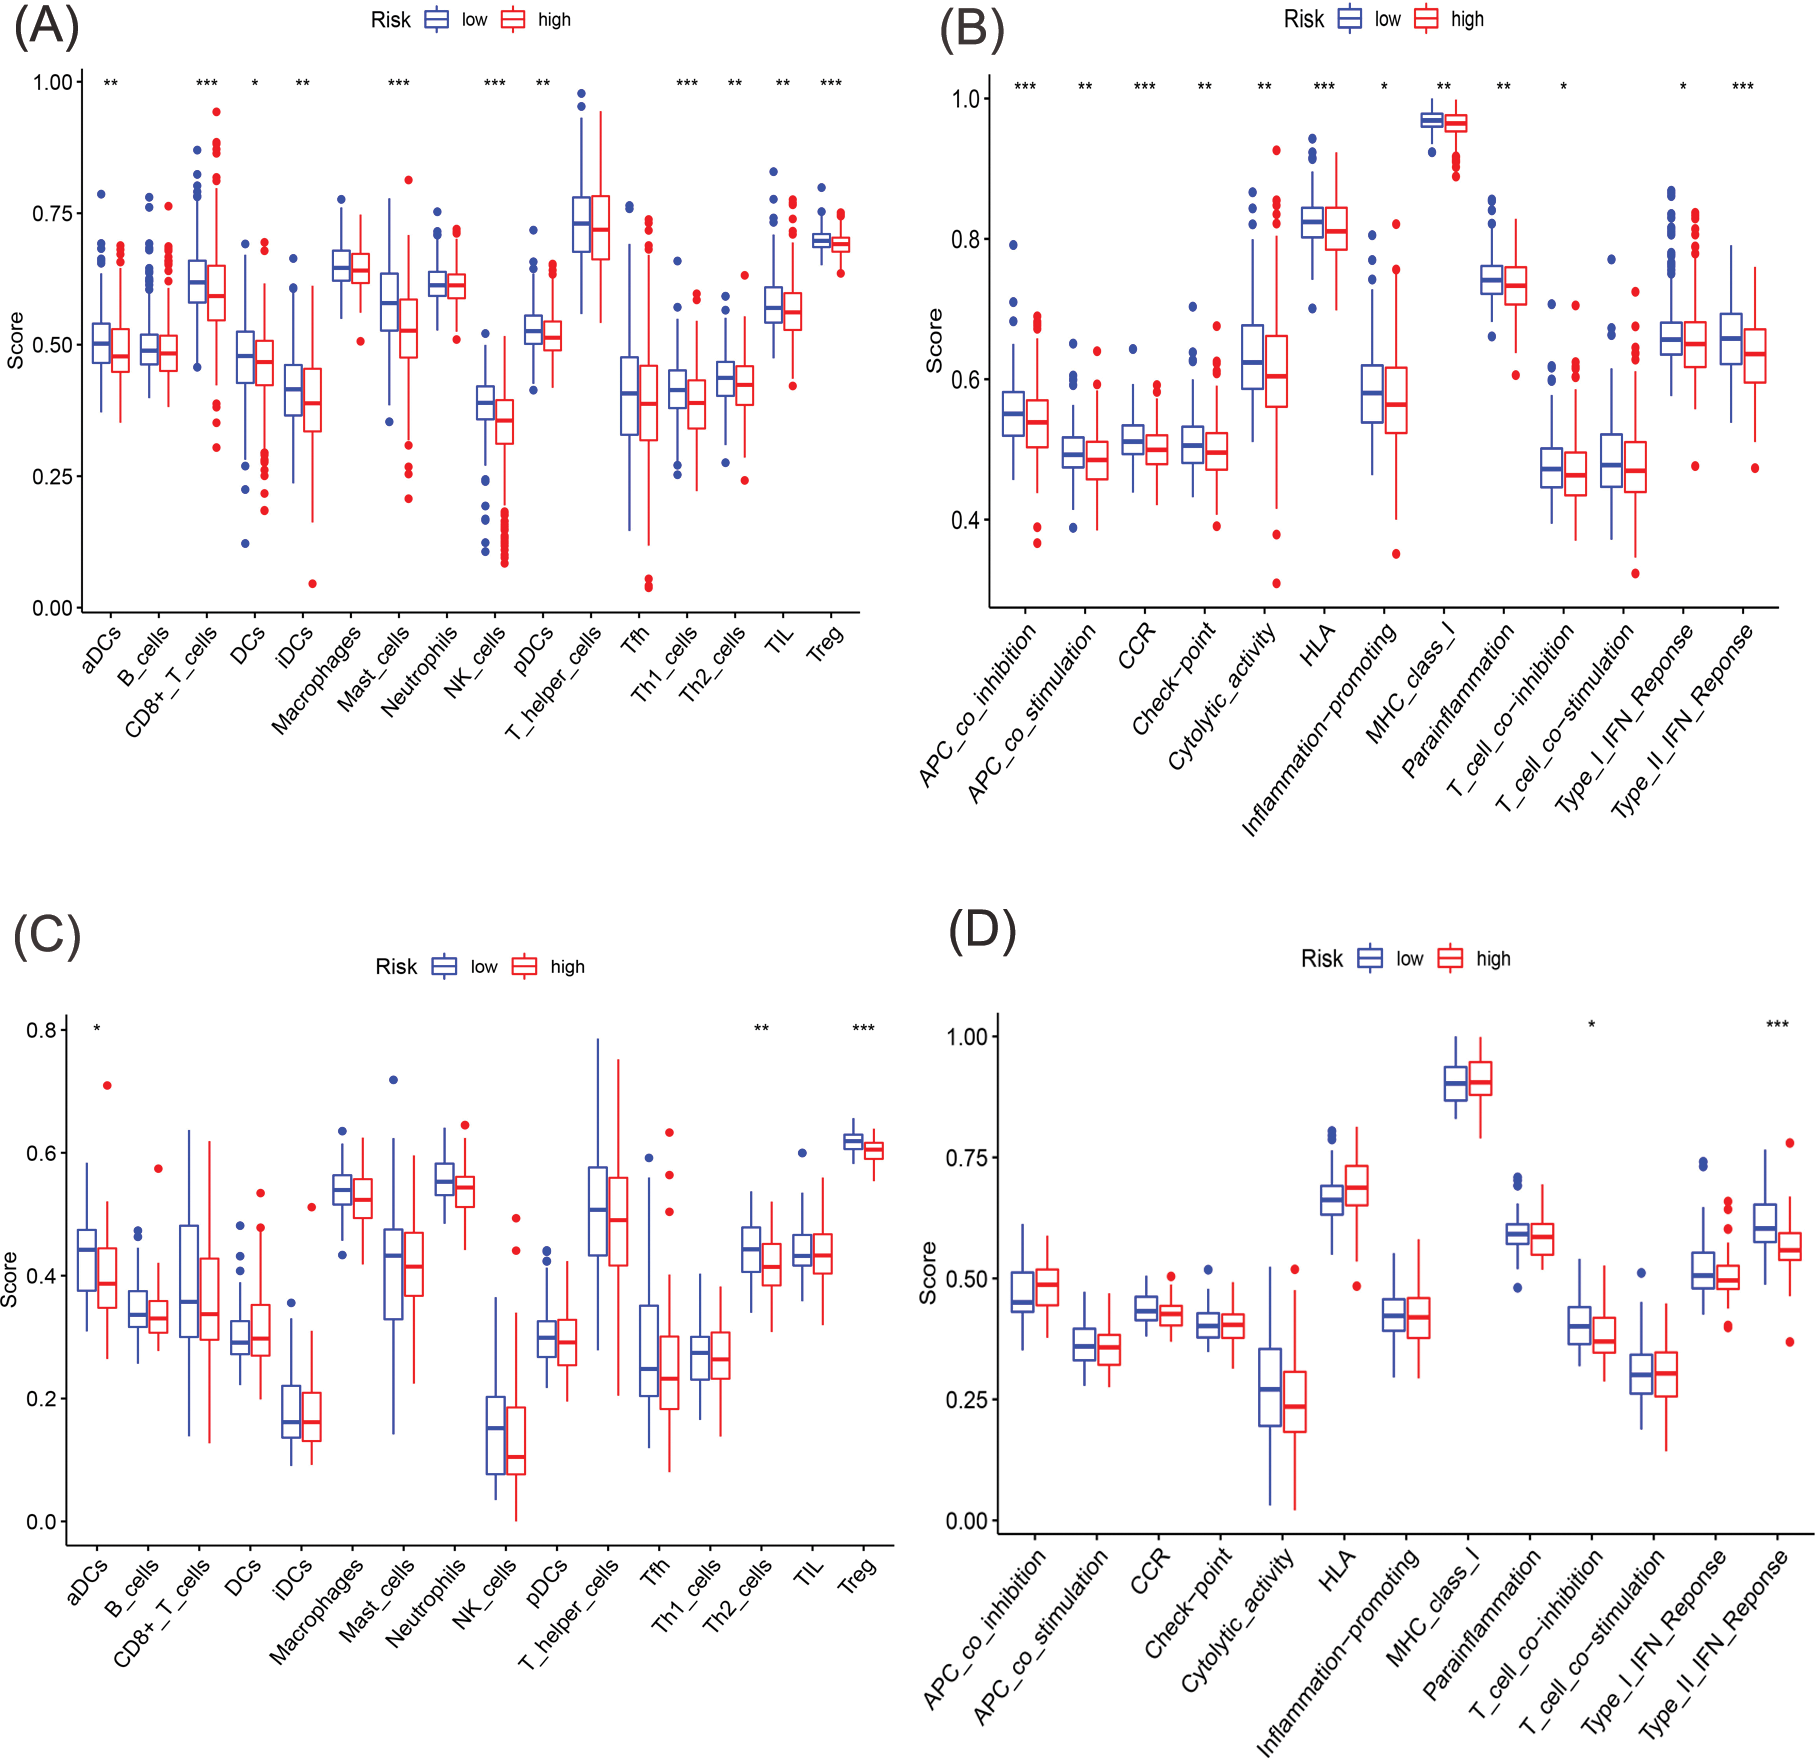
Figure 7: Comparative analysis of immune cells and immune function using single-sample GSEA (ssGSEA) in the two cohorts. (A, B) Enrichment outcomes depicting immune cell and immune function scores in TCGA cohort. (C, D) Enrichment outcomes depicting immune cell and immune function scores in GEO cohort (*p < 0.05; **p < 0.01; ***p < 0.001).
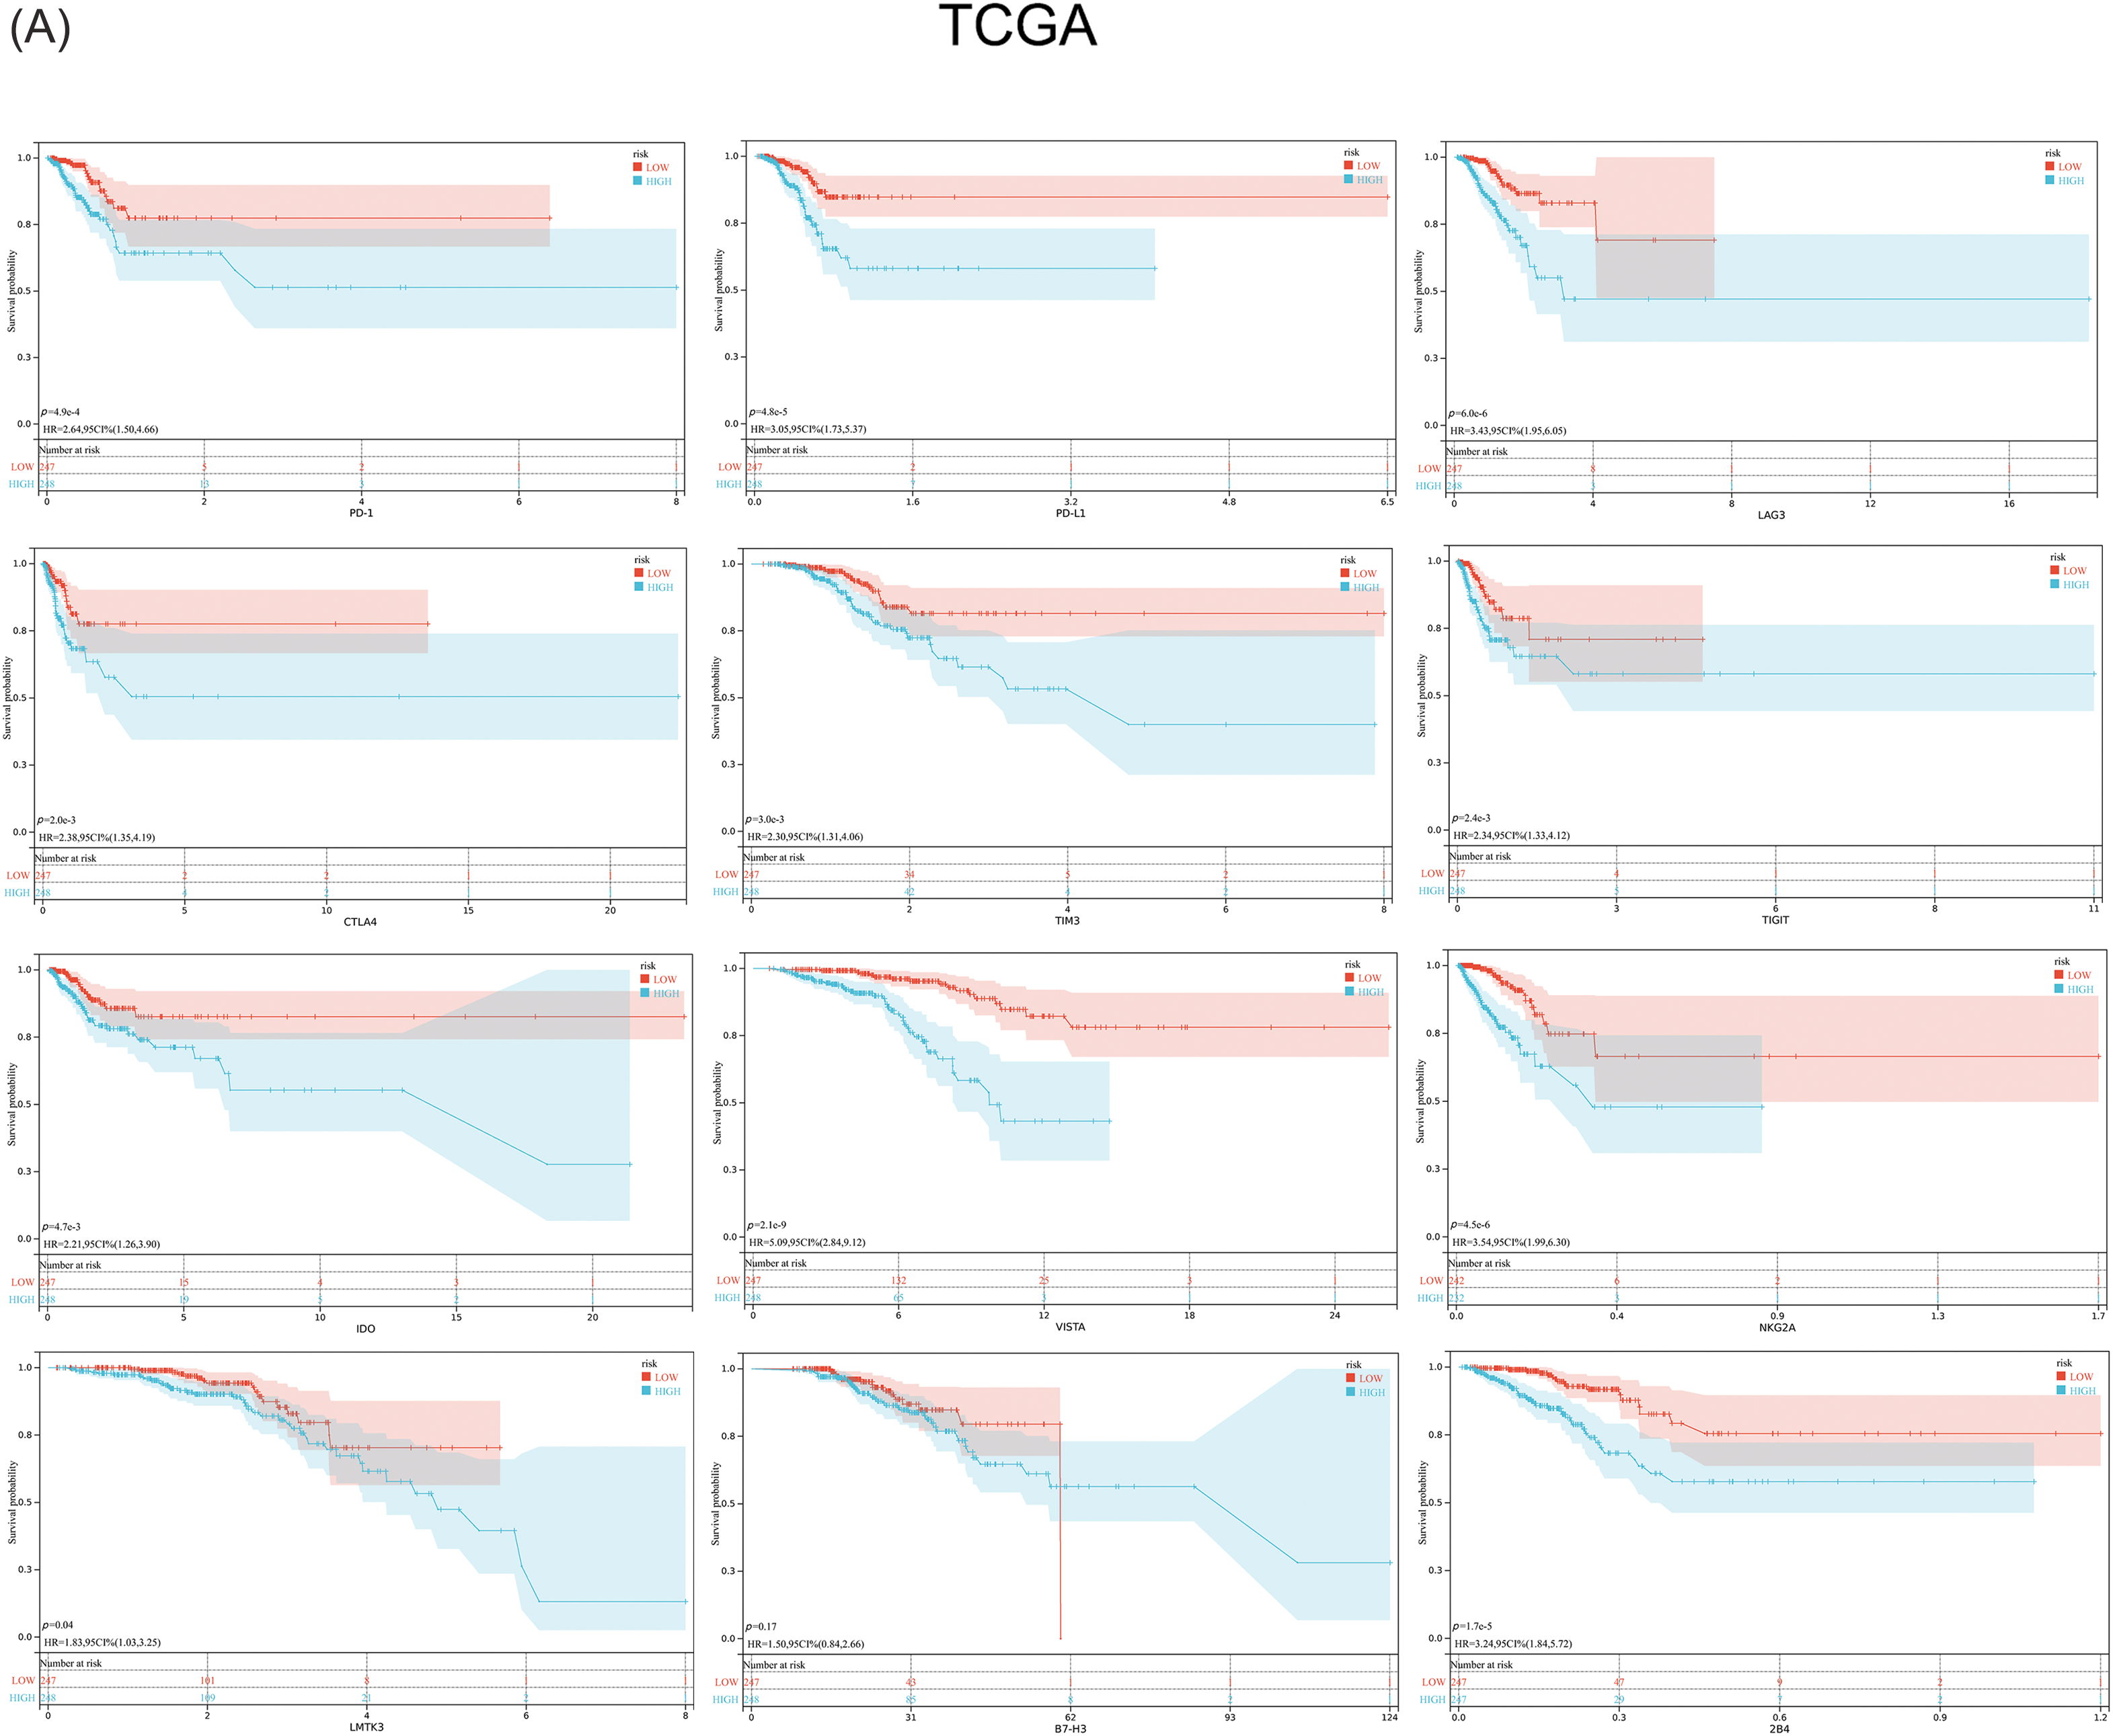
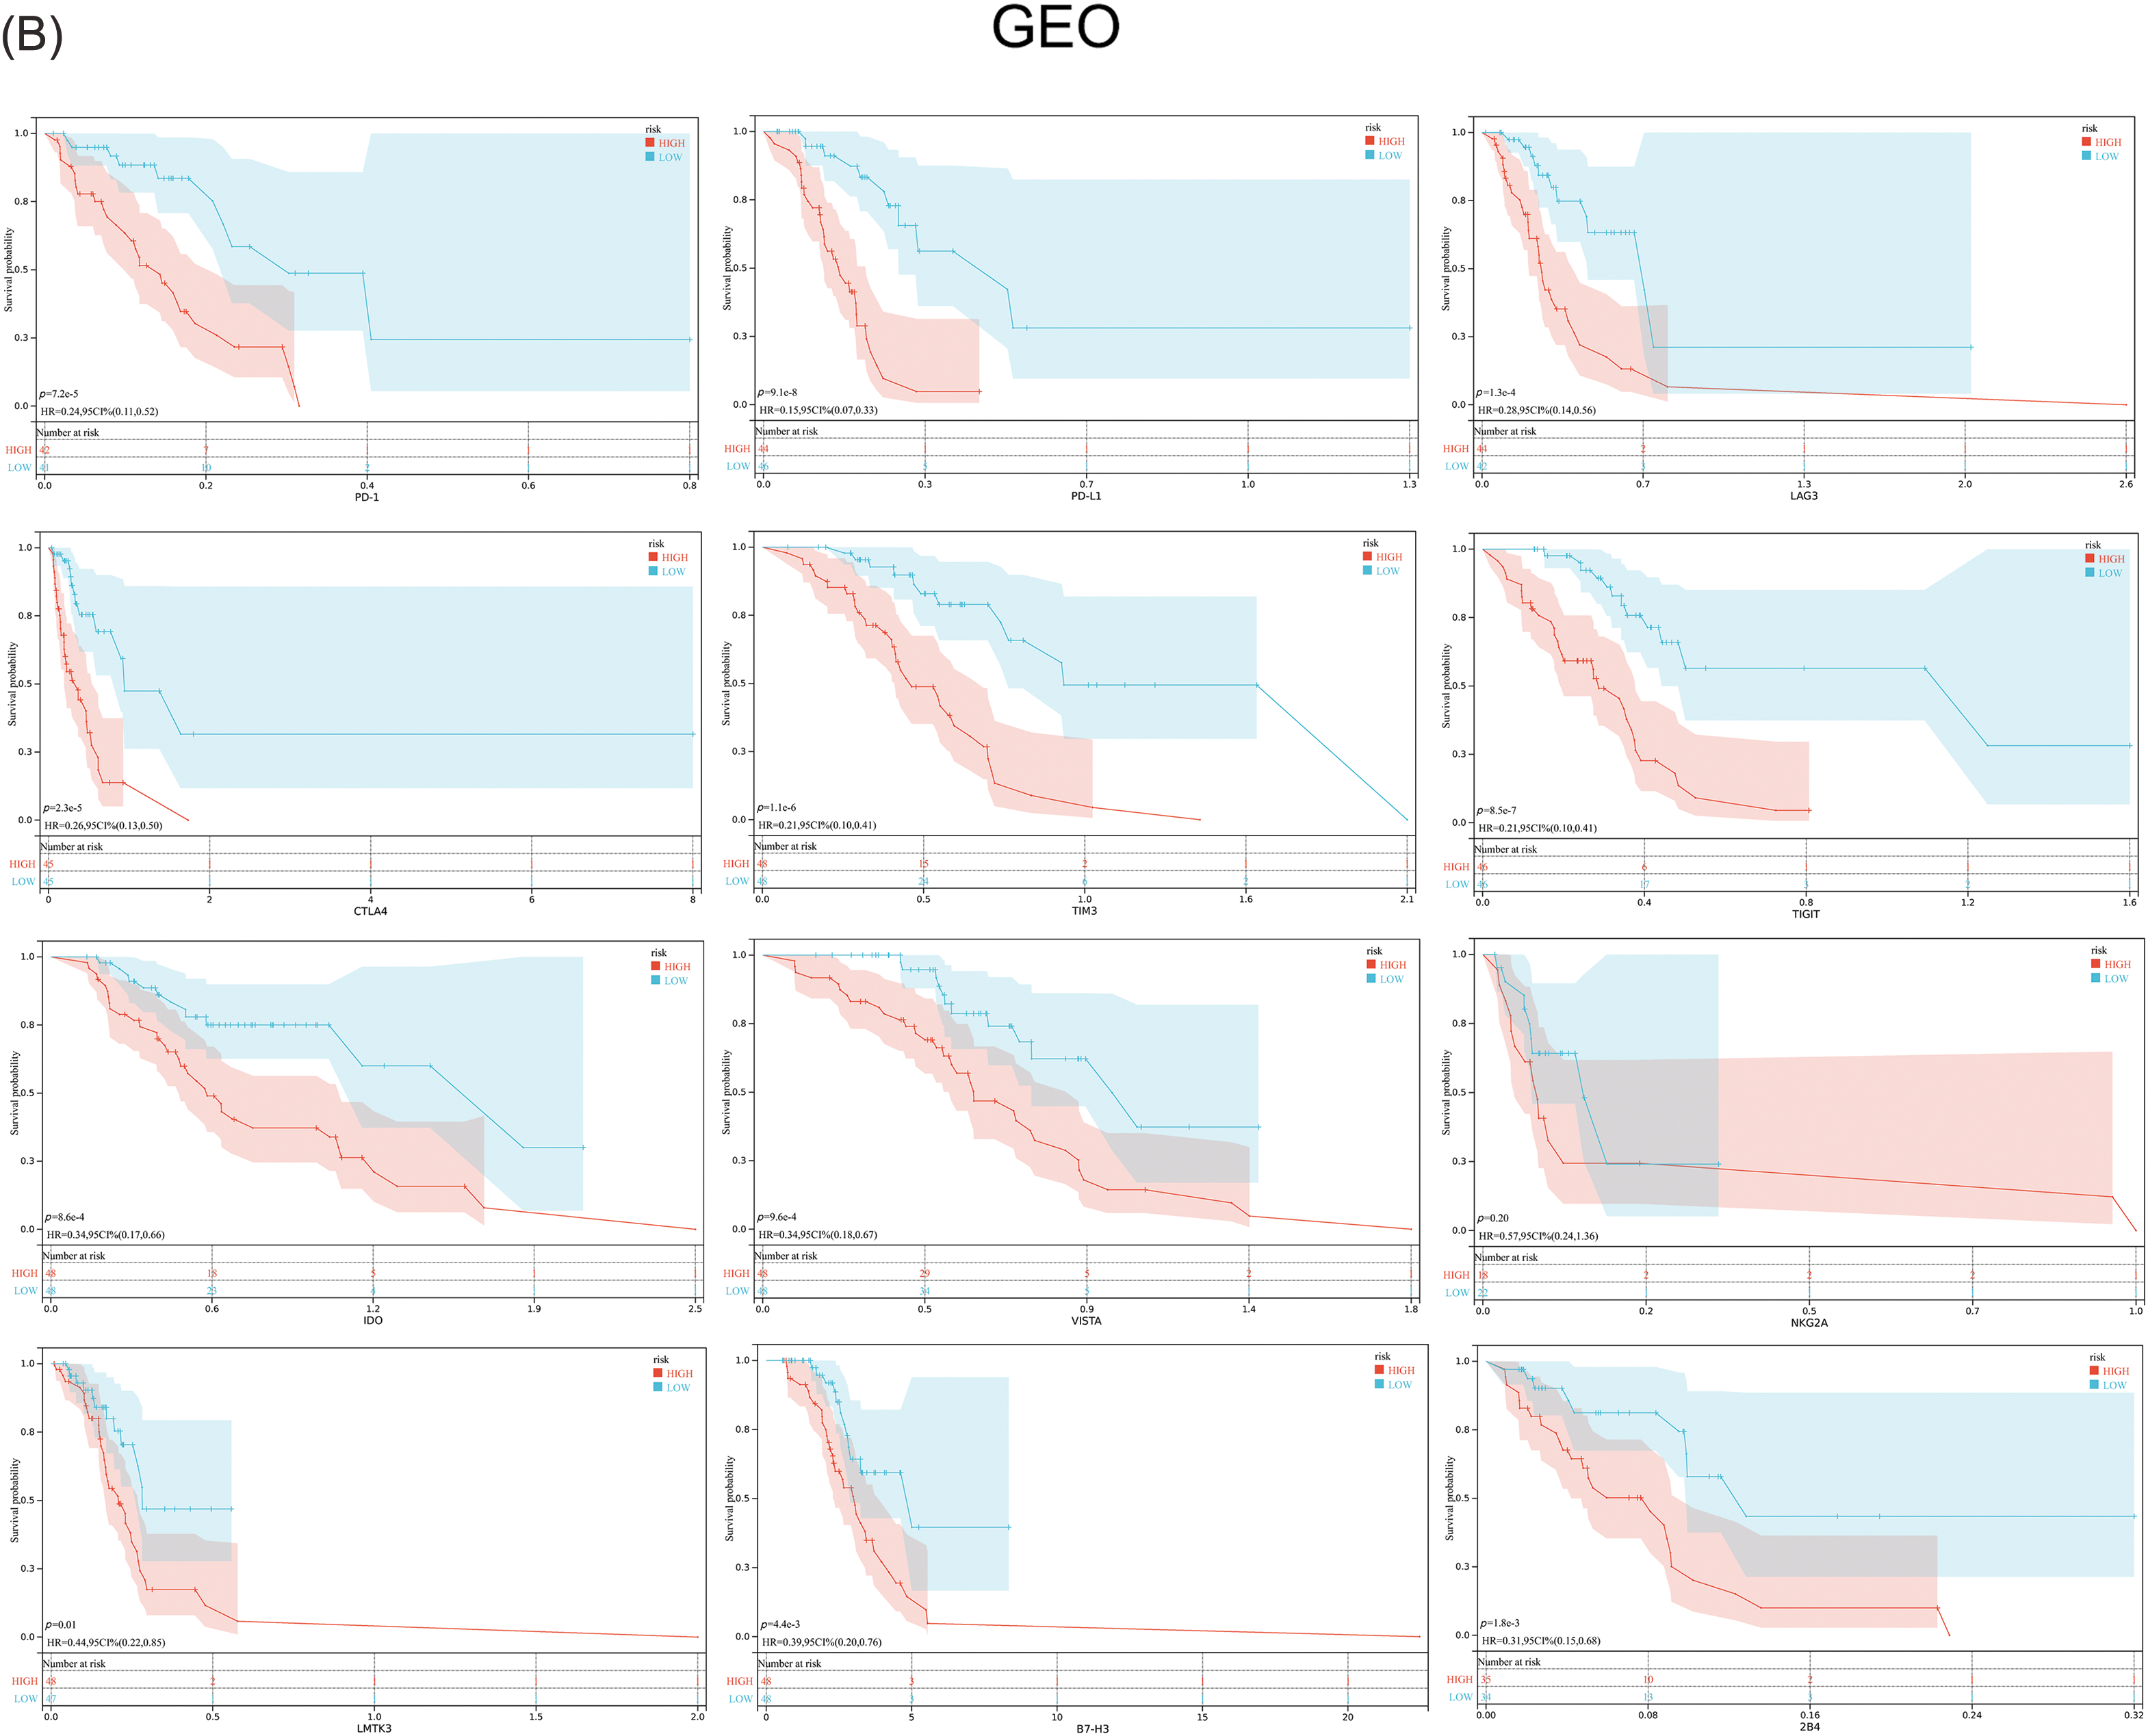
Figure 8: Expression of the key immune checkpoint molecules in the high-risk and low-risk groups. (A) TCGA; (B) GEO.
MAPK9 promotes migratory, invasive, and proliferative capacities of PCa cells in vitro
The coefficients associated with the MAPK9 gene were remarkably elevated in the construction of the signature, indicating its substantial prognostic significance. Consequently, MAPK9 became the focal point of our subsequent investigations. Western blot assays were conducted to examine variations in MAPK9 protein expressions between PCa cell lines and healthy prostate epithelial cell lines, considering the distinct characteristics of different cell lines (Fig. 9A). To investigate the underlying biological effect of MAPK9 on PCa cells, siRNA was employed to silence MAPK9 expression in PC3 and 22RV1 cells. Knockout efficiency of transfected cell lines was calculated using qRT-PCR (Fig. 9B). This finding was further verified by Western blot assays (Fig. 9C). Transwell migration and Matrigel invasion assays demonstrated a significant reduction in PCa cell invasion and migration upon the knockdown of the MAPK9 gene (Figs. 9D, 9E). Additionally, both CCK8 and colony formation assays validated that the MAPK9 knockdown decreased the proliferative capacity in PC3 and 22RV1 cells (Figs. 9F–9I). Accordingly, it was found that MAPK9 knockdown inhibited 22RV1 and PC3 cell migration through wound healing assays (Figs. 9J, 9K). Altogether, the above in vitro findings suggested that MAPK9, as an oncogene, could enhance PCa cell proliferation, migration, and invasion.
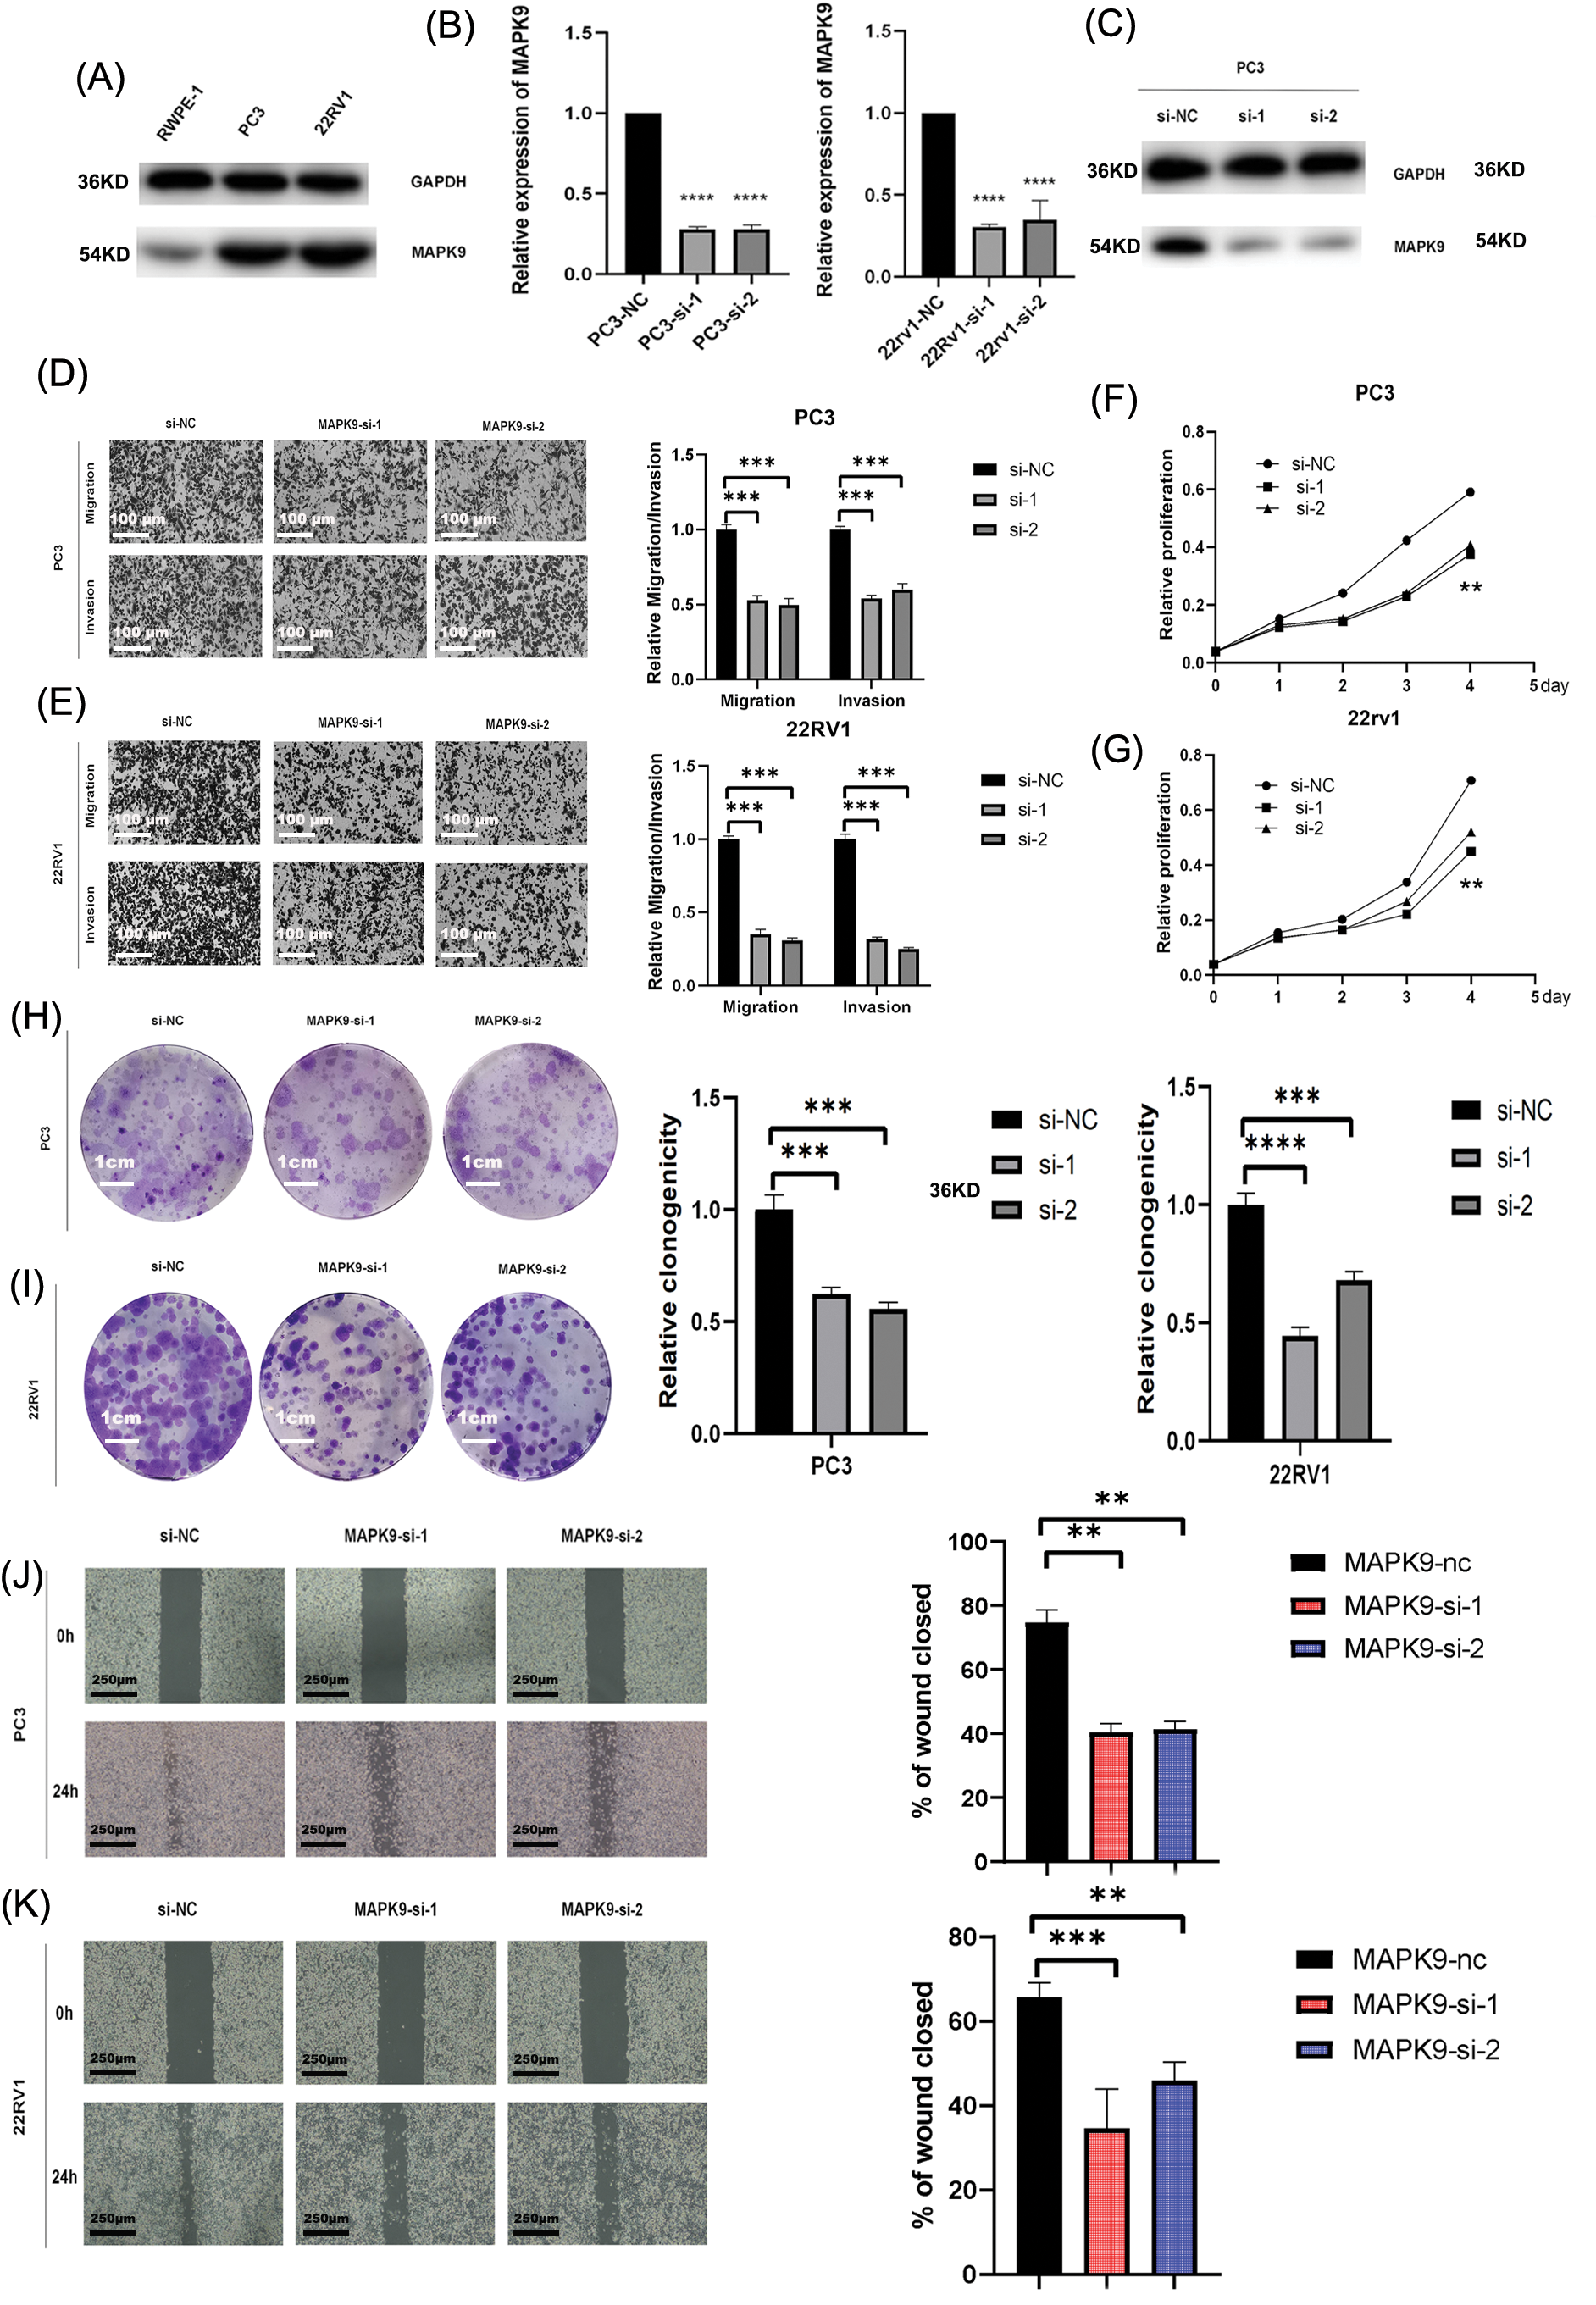
Figure 9: Downregulated expression of MAPK9 inhibits the proliferative, migratory, and invasive capabilities of the cell. (A) Western blot analysis indicating differential expression of MAPK9 in RWPE-1 and PCa cells. (B, C) qRT-PCR and western blot analysis of PC3 and 22RV1 cells following transfection with MAPK9-siRNA or siRNA-NC. (D, E) Assessment of migratory and invasive capabilities of transfected cells using transwell migration and matrigel invasion assays. Scale bar = 100 μm. (F–I) Evaluation of cell proliferation capacity of transfected cells through colony formation assay and CCK8 assay. Scale bar = 1 cm. (J, K) Wound healing assays to assess the cell migration capacity of transfected cells. Scale bar = 250 μm (**p < 0.01; ***p < 0.001, ****p < 0.0001).
MAPK9 knockdown inhibits ferroptosis in vitro and suppresses proliferation in vivo
The sensitivity of PC3 and 22RV1 cells to ferroptosis was assessed following transfection with MAPK9-siRNA or siRNA-NC. The levels of Fe2+ release, malondialdehyde (MDA), reactive oxygen species (ROS), and glutathione (GSH) were measured in prostate cancer (PCa) cells over a 24-hour period under various experimental conditions. Compared with si-NC-MAPK9-treated PCa cells, Fe2+, MDA, and ROS levels in si-MAPK9-treated PCa cells were considerably decreased, whereas the GSH level was considerably increased (Figs. 10A, 10B).
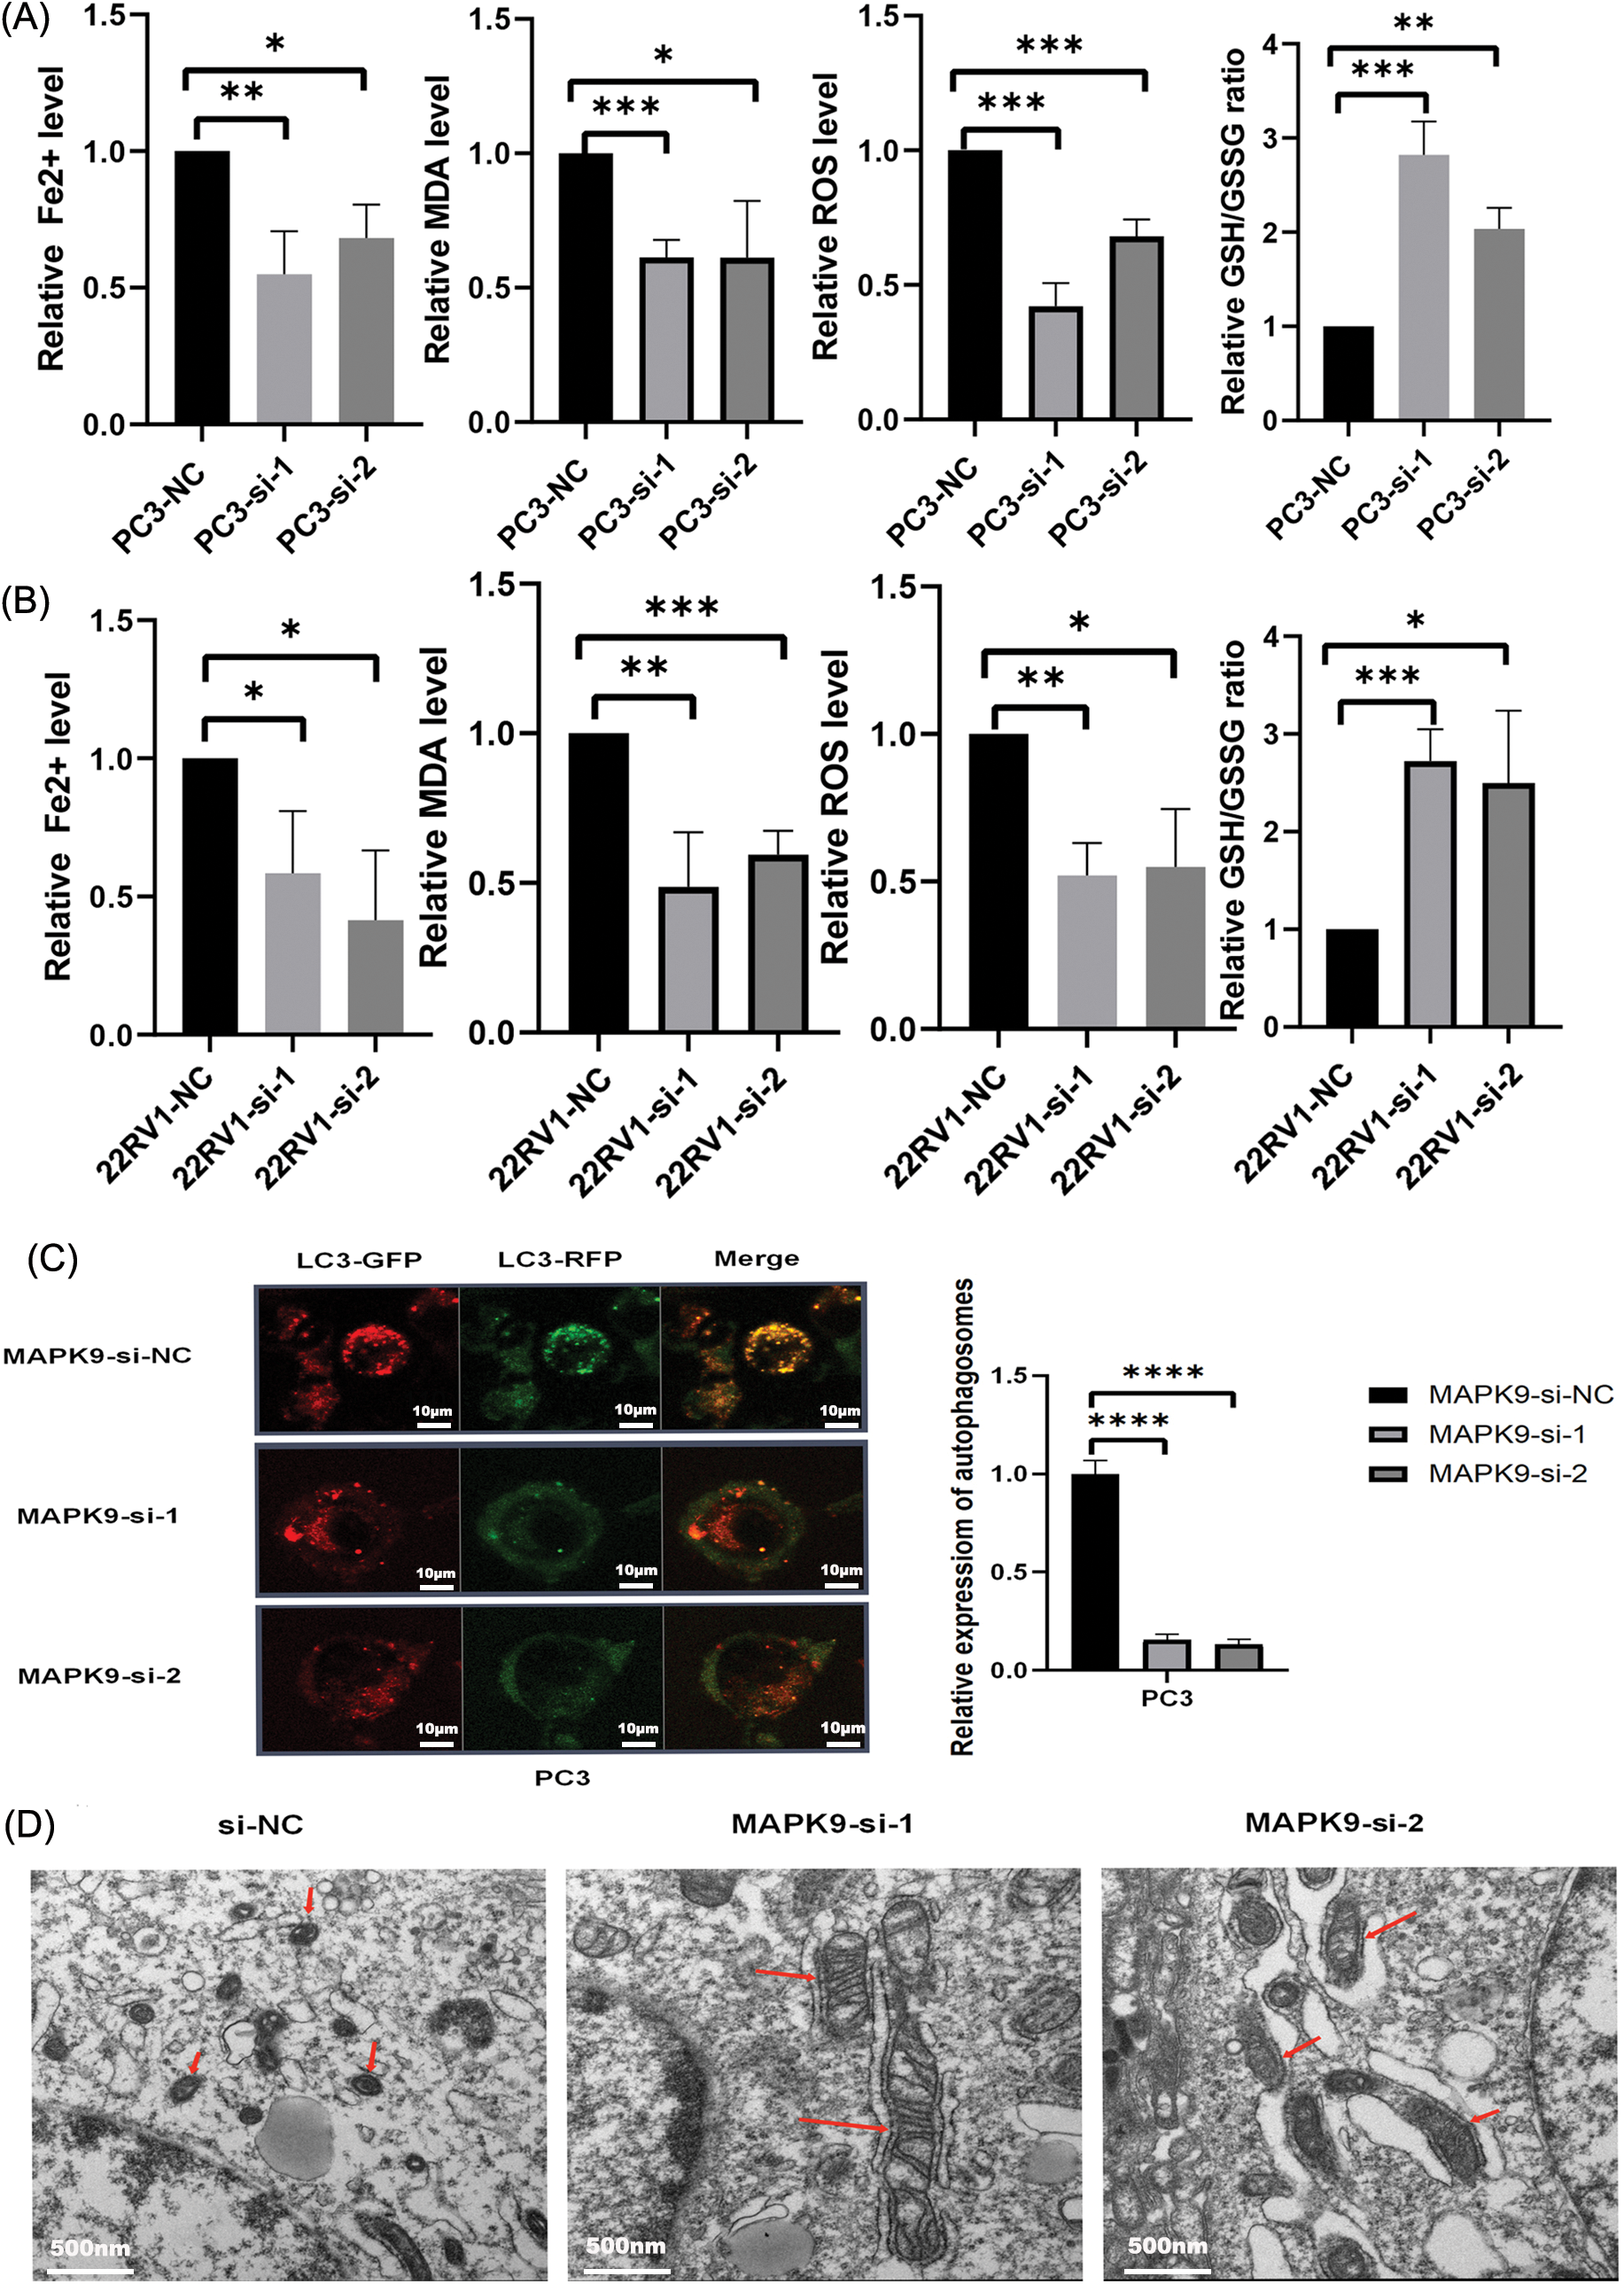
Figure 10: MAPK9 knockdown inhibits ferroptosis in vitro. (A, B) Fe2+ release, malondialdehyde (MDA), glutathione (GSH), and ROS levels determined utilizing Assay Kit in PC3 and 22RV1 cells following transfection with MAPK9-siRNA or siRNA-NC. (C) PC3 cells subjected to infection with a GFP-RFP-LC3 adenovirus. Autolysosomes, denoted by red puncta, and autophagosomes, denoted by yellow puncta in the merged images, were detected utilizing fluorescence microscopy. Scale bar = 10 μm. (D) MAPK9 increased mitochondrial damage in PC3 cells. Alterations in mitochondrial morphology in PC3 cells subjected to treatment with MAPK9-siRNA or siRNA-NC. Scale bar = 500 nm (*p < 0.05; **p < 0.01; ***p < 0.001; ****p < 0.0001).
To explore the potential impact of MAPK9 on the modulation of ferroptosis in prostate cancer (PCa), human PCa PC3 cells were exposed to either control siRNA or siRNA specifically targeting the MAPK9 gene. The transfected PC3 cells were subjected to infection with mRFP-GFP-LC3 adenovirus, and the autophagy flux was monitored. Considering that GFP is pH-sensitive, the reduction in pH after the fusion of the lysosome and autophagosome inhibits the fluorescence of GFP. Consequently, when red and green fluorescence merge, the autophagosomes inside the cell exhibit a yellow appearance. As depicted in Fig. 10C, the combination of red and green puncta in PC3 cells produced yellow puncta, indicating successful induction of autophagy flux. Apart from reduced LC3 accumulation, fewer yellow puncta were observed in MAPK9-siRNA-treated cells relative to control cells, indicating a reduction in autophagosomes and autophagic flux. In conclusion, the phagocytosis of ferritin in PC3 cells treated with MAPK9-siRNA was reduced.
The typical characteristics of ferroptosis are mitochondrial iron overload accompanied by subsequent mitochondrial damage. Electron microscopy was utilized to observe the impacts of MAPK9 on mitochondrial morphology. As depicted in Fig. 10D, PC3 cells treated with si-NC-MAPK9 exhibited a fuzzy mitochondrial structure, smaller mitochondria, higher membrane density, and reduced cristae compared to si-MAPK9-treated PC3 cells.
Collectively, the inhibition of ferroptosis in PCa cell lines is evident upon the knockdown of the MAPK9 gene. Thus far, the phospholipid hydroperoxide-reducing enzyme, glutathione peroxidase 4 (GPX4), and the primary iron storage protein, ferritin heavy chain 1 (FTH1), are recognized for their involvement in safeguarding against ferroptosis [10,31]. Therefore, this research aimed to investigate the influence of MAPK9 knockdown on ferroptosis by examining the expression of GPX4 and FTH1 proteins. The results exhibited a significant impact (Figs. 11A, 11B), suggesting the potential involvement of these two pathways in ferroptosis. As a crucial protein linked to ferroptosis, the suppression of GPX4 has been demonstrated to inhibit tumor progression. Therefore, this research performed co-immunoprecipitation (Co-IP) experiments to examine if MAPK9 and GPX4 interact with each other. The findings suggest that MAPK9 coimmunoprecipitated with GPX4 in PCa cells (Figs. 11C–11F).
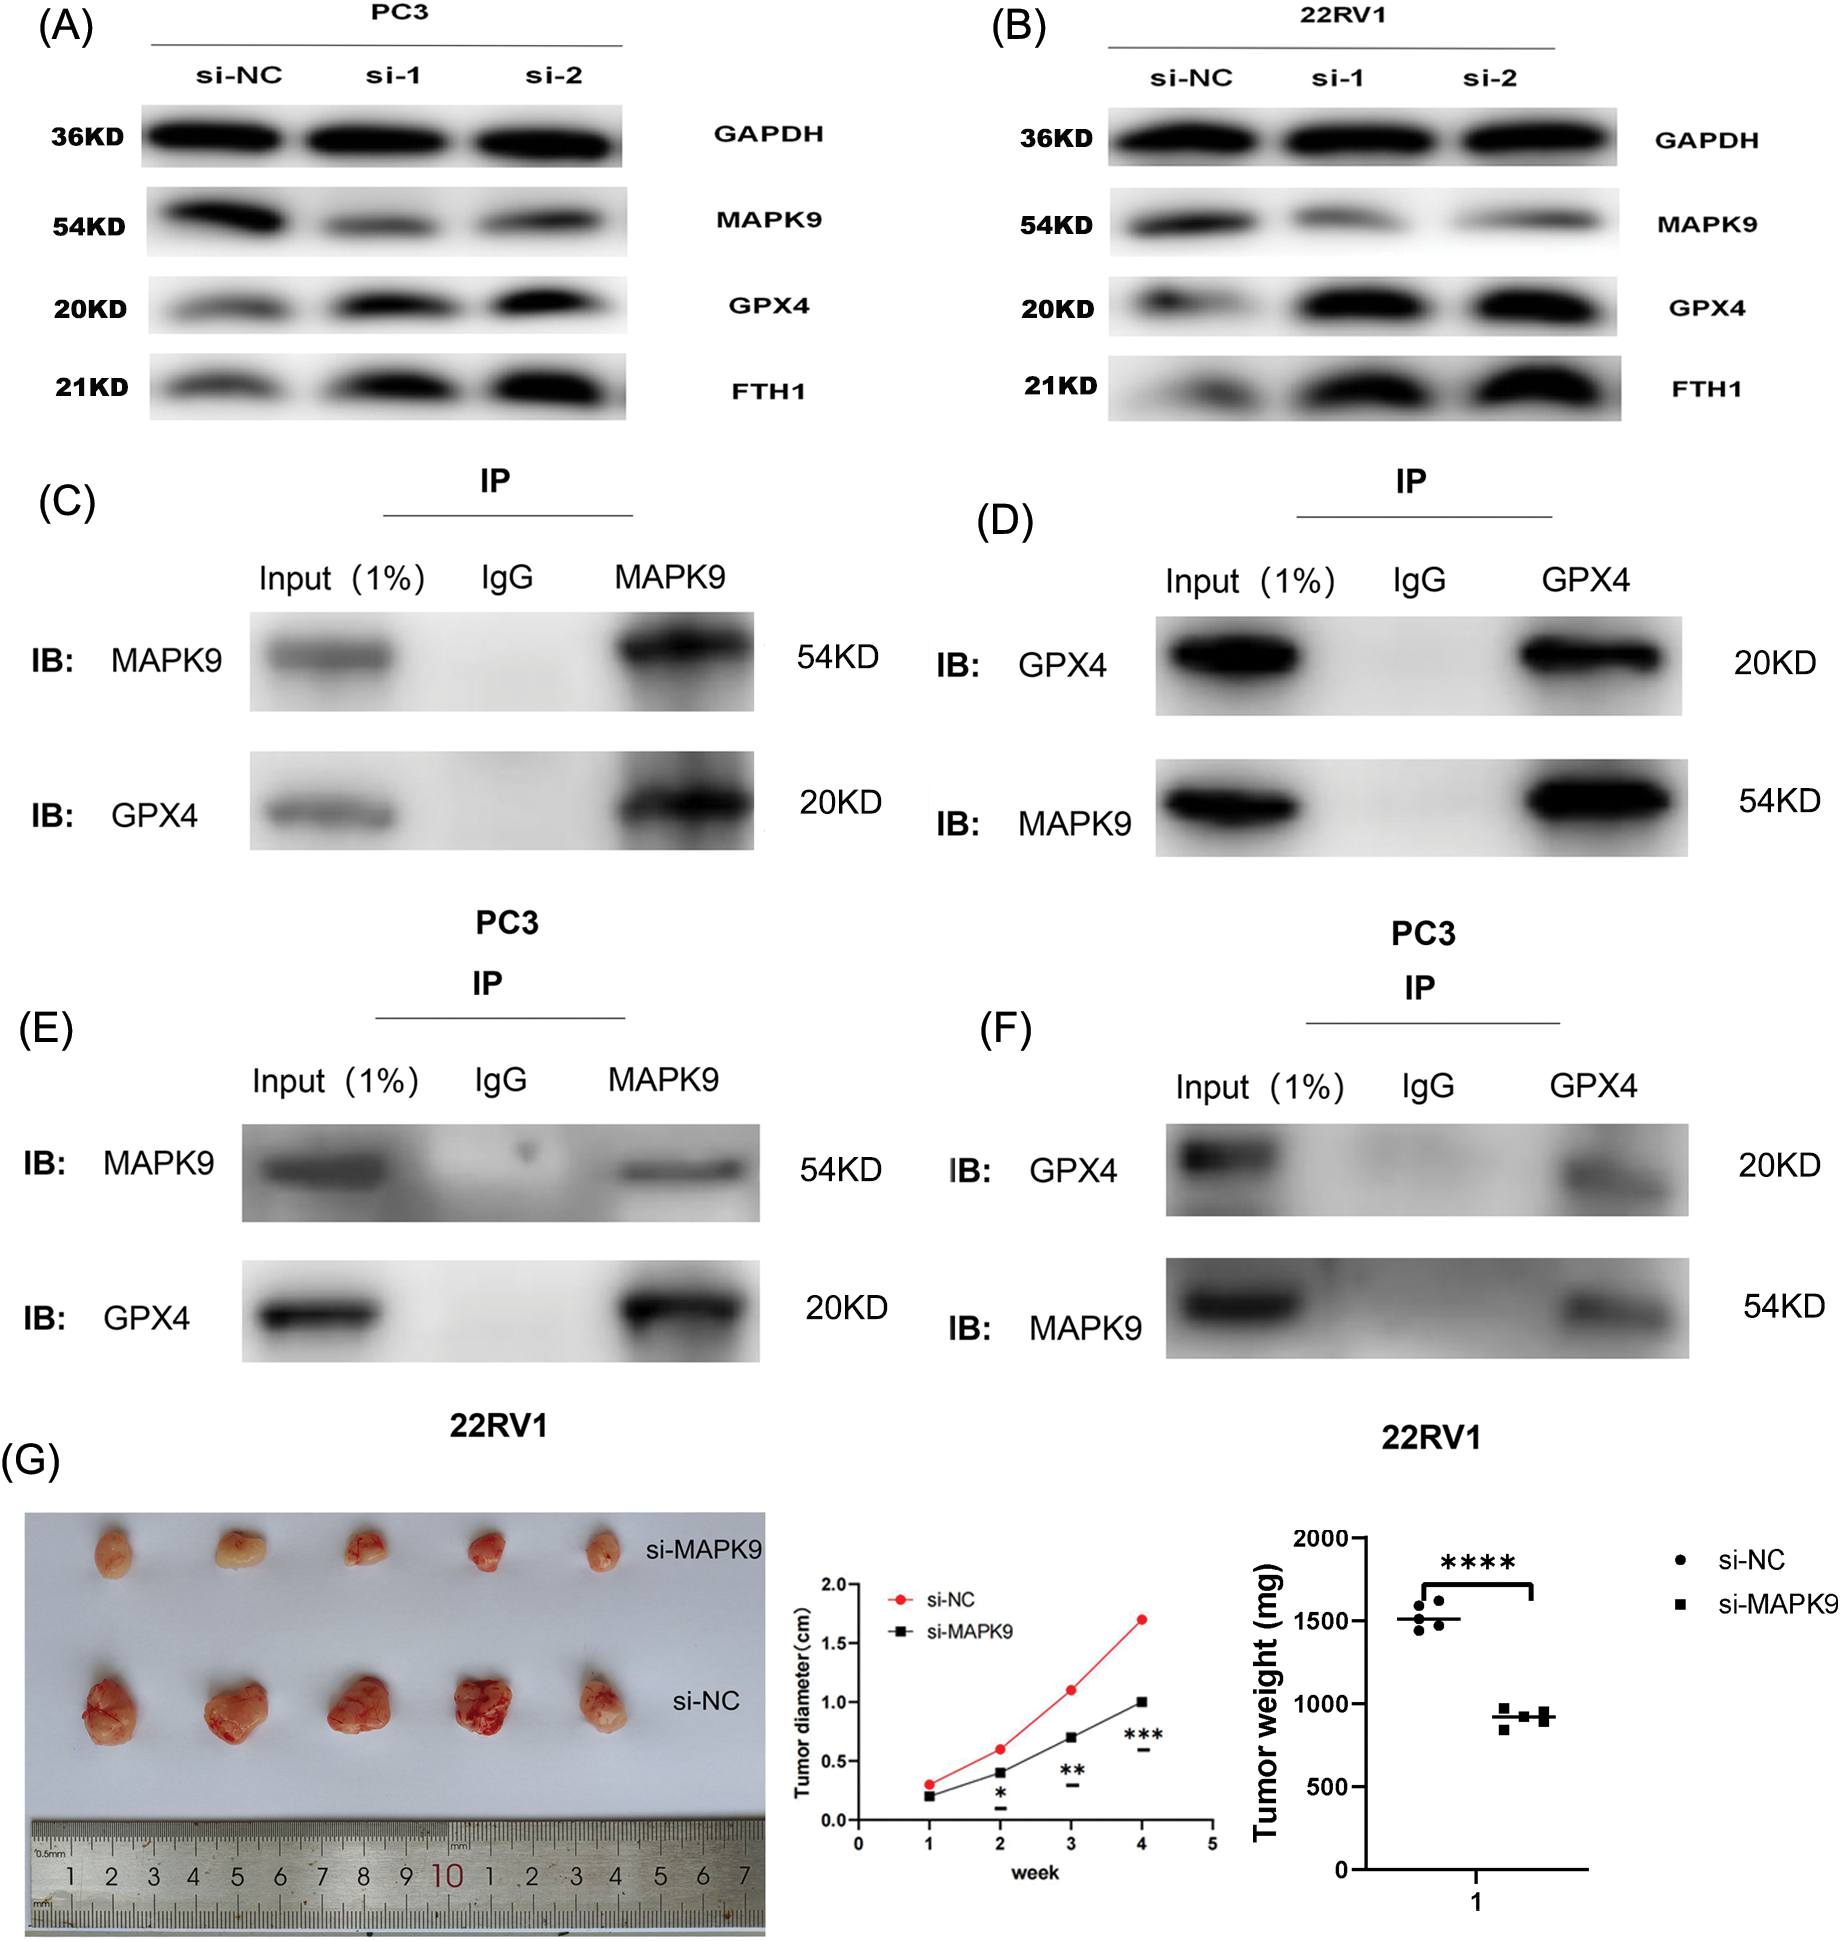
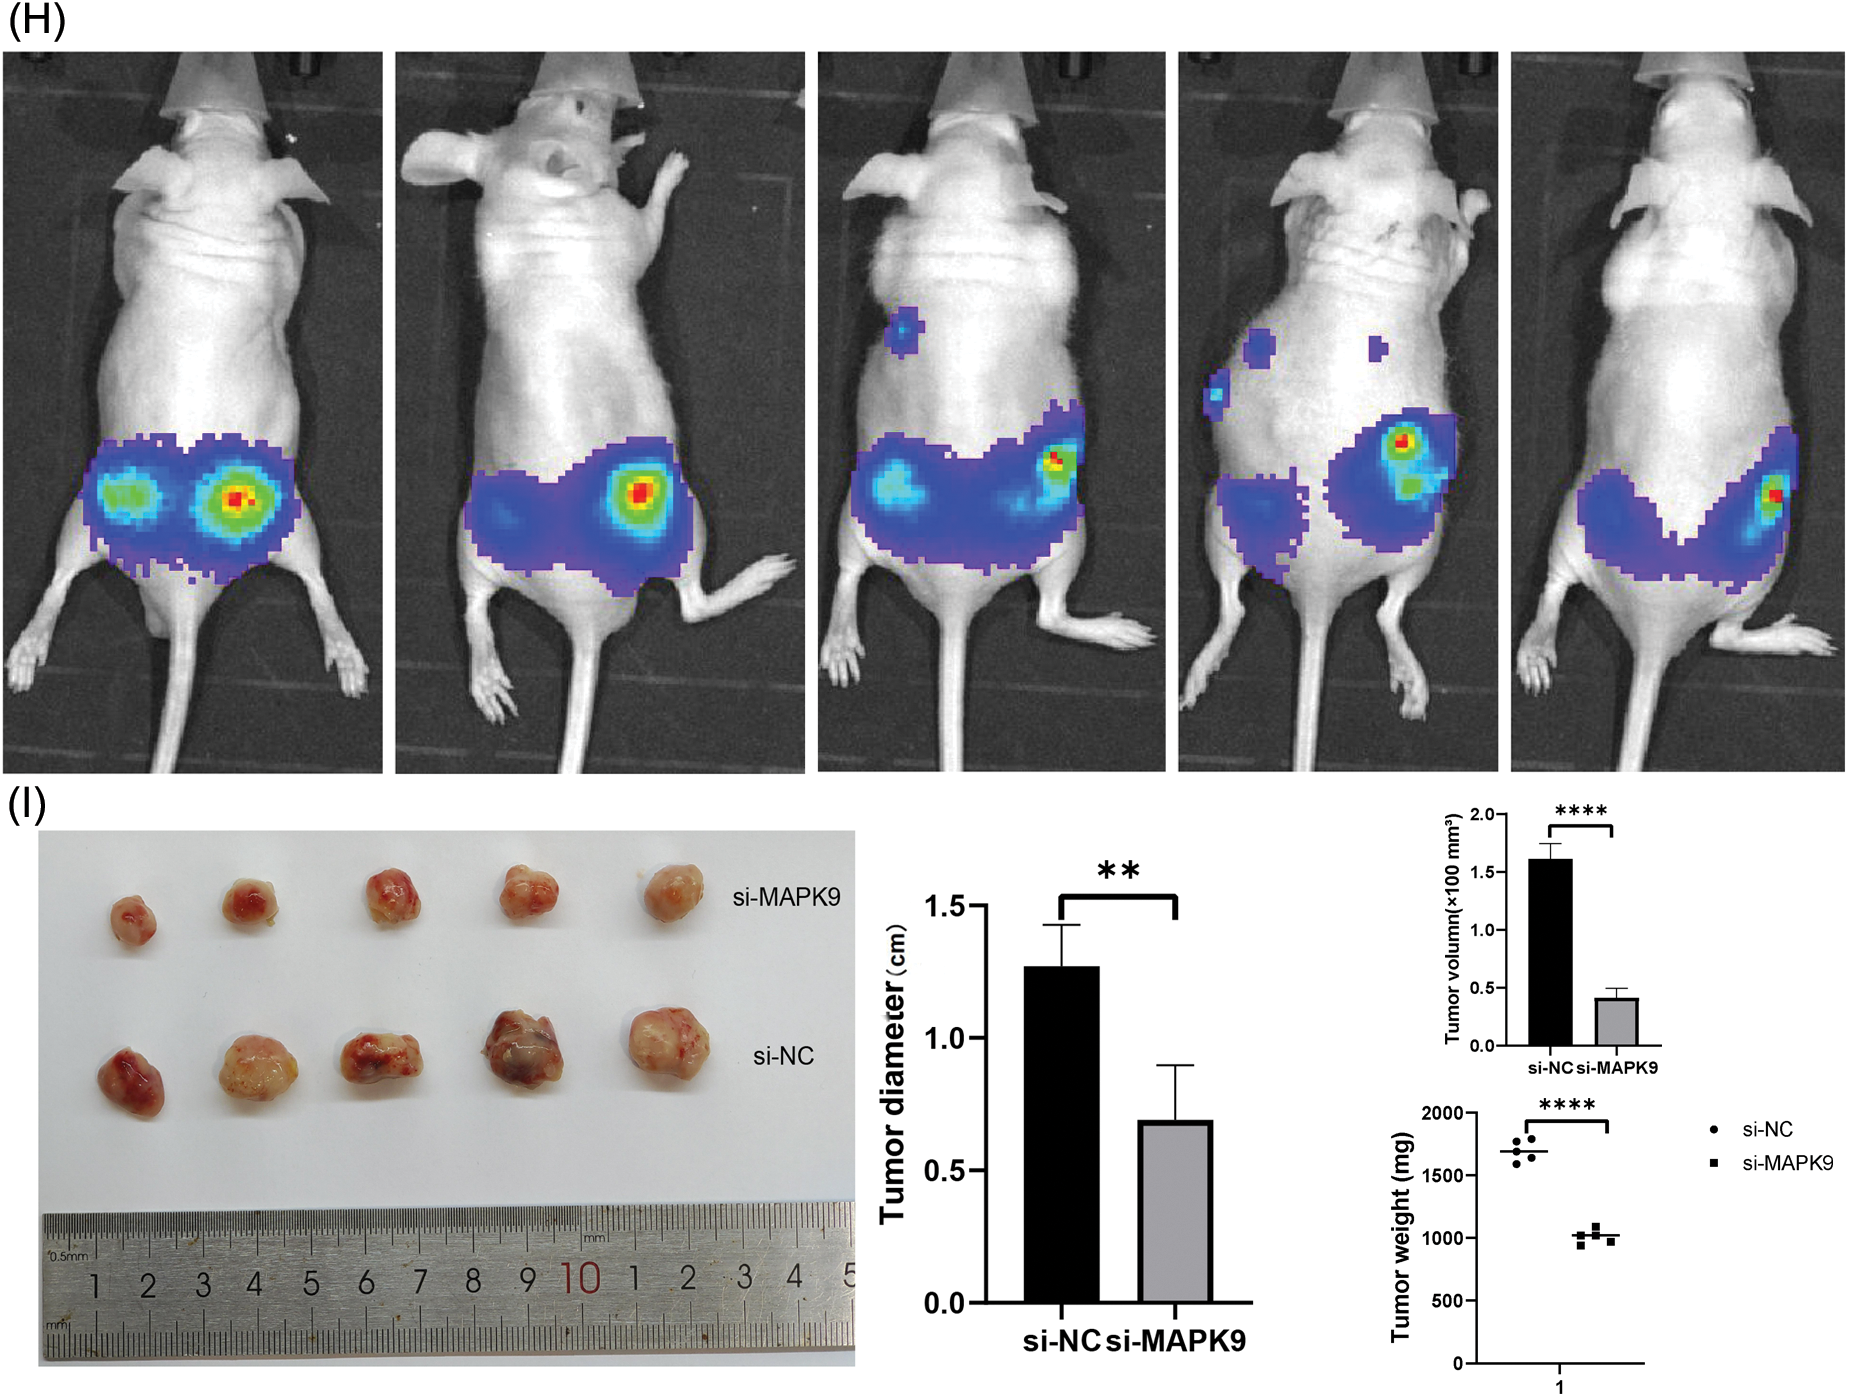
Figure 11: Relationship of MAPK9 to the potential ferroptosis pathway and MAPK9 knockdown suppress proliferation in vivo. (A, B) MAPK9 knockdown affects GPX4 and FTH1 protein expressions. (C–F) PCa cells were subjected to lysis, and immunoprecipitation was conducted using indicated antibodies. The immunocomplexes were subjected to western blot analysis. (G) Xenograft tumors in nude mouse models. (H, I) Orthotopically xenografted tumors in nude mouse models (*p < 0.05; **p < 0.01; ***p < 0.001; ***p < 0.0001).
In the final phase of the study, in vivo experiments were performed to investigate the impact of MAPK9 on the initiation and progression of PCa. BALB/c nude mice received a subcutaneous injection of PC3 cells stably transfected with either si-MAPK9 or si-NC-MAPK9. Tumor growth was monitored over a four-week period, and postmortem evaluation of tumors was conducted. The results indicated a remarkable reduction in tumor weight and volume in the MAPK9 knockdown group relative to the control group, indicating that MAPK9 knockdown suppressed the tumorigenicity of PCa cells (Fig. 11G).
Additionally, PC3 cells expressing luciferase were orthotopically xenografted into the left and right anterior prostate of nude mice. Tumors were categorized as (1) PC3-Luc+MAPK9-si (left) and (2) PC3-Luc+MAPK9-NC (right) to evaluate the influence of MAPK9 on prostate tumorigenesis. After four weeks, tumor formation was recorded using IVIS (Fig. 11H), and a postmortem tumor evaluation was conducted. The tumors’ weight and volume were markedly lower in the MAPK9 knockdown group compared to the control group, offering additional support for the inhibition of prostate cancer cell tumorigenicity following MAPK9 knockdown (Fig. 11I).
PCa, a prevalent malignancy in men, ranks as the second leading cause of male mortality globally, particularly in developed nations [32,33]. PSA has been used since the 1990s as a widely accepted PCa detection method and is considered a significant predictive factor for PCa. PSA recurrence occurs in almost 27%–53% of patients with RP and radiotherapy [34]. Such BCR enhances the progression of advanced CRPC, leading to an elevated risk of distant metastasis, PCa-specific death, and overall mortality [35,36]. Therefore, identifying novel prognostic biomarkers of BCR after RP becomes crucial, addressing the limitations of existing biological markers.
Ferroptosis, recently recognized as a form of programmed cell death influenced by cellular mechanisms, is characterized by distinctive morphological alterations in mitochondria, such as reduced membrane density, flattened crest, and diminished volume. Notably, this distinctive cellular death is characterized by the accumulation of lipid reactive oxygen species (ROS) and iron. Unlike other forms of regulated cell death, such as apoptosis, ferroptosis lacks morphological, biochemical, or genetic similarities [11]. Since its discovery in 2012, extensive efforts have gradually unraveled the pathogenesis of ferroptosis. This intricate process involves numerous biomolecules and metabolites and is intricately linked to various pathophysiological processes. In related research, Brent R. Stockwell and colleagues have described that metabolism is indispensable for the normal generation of energy and biomolecules, and it often goes awry in many diseases. Metabolism and cell death are closely intertwined in the phenomenon of ferroptosis. Glutathione peroxidase 4 (GPX4) utilizes glutathione to eliminate lipid peroxides, protecting cells from ferroptotic cell death. Recent data reveal a glutathione/GPX4-independent axis that inhibits ferroptosis, providing deeper insights into the regulatory roles of iron and mitochondria in ferroptosis [37]. The suppression of ferroptosis is now recognized as a potential therapeutic target for certain diseases [38]. Despite considerable advancements in ferroptosis research over time, uncovering the underlying mechanisms remains a persistent challenge.
Despite the intricate nature of ferroptosis pathogenesis, the growing body of research regarding cancer treatment opens up new possibilities for its potential application in cancer therapy [12]. In oncology research, certain genes have been found to promote one type of cancer while suppressing another [39]. A similar phenomenon in ferroptosis has been identified. For example, Su et al. [40] discovered that p53 induces ferroptosis upon ROS-induced stresses. In contrast, Xie et al. [16] found that TP53 suppresses erastin-caused ferroptosis transcription independently by blocking dipeptidyl peptidase 4 (DPP4) activity. Recent findings suggest that the impact of ferroptosis is influenced by diverse biological factors within the cancer microenvironment, demonstrating a correlation between ferroptosis and cancer initiation, progression, and drug sensitivity [40,41]. Non-small cell lung cancer cells reduce ferroptosis via the nuclear factor erythroid 2-related factor 2 (NRF2)-kelch like ECH associated protein 1 (KEAP1) signaling pathway [42]. Inducing ferroptosis plays a role in resolving tumor drug resistance and restraining progression and metastasis. Specifically, Sun et al. [43] discovered that the downregulation of metallothionein-1G (MT-1G) increased the sensitivity of sorafenib for HCC by facilitating ferroptosis. Research shows that blocking cysteine dioxygenase 1 (CDO1) promotes cellular glutathione (GSH) levels, prohibits ROS production, and reduces lipid peroxidation of gastric cancer cells treated with erastin [44]. Despite specific effects on tumor cells through the induction of cell iron-dependent programmed ferroptosis [45], our understanding of whether ferroptosis in cancer cells inhibits or enhances tumors, and the mechanisms of ferroptosis are yet to be elucidated.
Recently, there has been increased focus on the involvement of ferroptosis in PCa. Nassar et al. [46] demonstrated that downregulation of the (2,4-dienoyl-CoA reductase 1) DECR1 gene promoted ferroptosis, which hindered tumor cell proliferation and migration by the accumulation of cellular polyunsaturated fatty acids (PUFA), reinforcing mitochondrial oxidative stress and lipid peroxidation. Pannexin 2 (PANX2) is considered a novel marker for PCa, which facilitates PCa cell proliferation and invasion through ferroptosis regulation [47]. Tousignant et al. [21] reported that studies of ferroptosis provide novel strategies for inhibiting treatment tolerance status in advanced PCa, which may have a delayed and antagonistic effect on androgen receptor resistance. Though existing evidence has confirmed some markers related to PCa ferroptosis, the correlation of other FRGs with PCa prognosis is still unclear.
High-throughput gene sequencing in biological samples facilitates extensive omics research. This research dealt with identifying a ferroptosis-based genetic marker for predicting BCR in PCa. Initially, 52 ferroptosis-related genes (FRGs) potentially associated with biochemical recurrence (BCR) in prostate cancer (PCa) were identified through the analysis of differential expression between tumor and healthy tissues and univariate Cox regression analysis results. Protein interaction and gene expression correlation network analyses revealed significant functional and expression relationships among these genes. Subsequently, Lasso regression analysis was conducted using the 52 genes to develop a prognostic signature comprising four ferroptosis-related genes. The predictive ability of this signature for BCR in PCa was demonstrated through biochemical recurrence-free survival (bRFS) analysis.
Additionally, the computed risk scores were identified as independent risk factors for PCa BCR based on univariate and multivariate Cox regression analyses. Furthermore, a positive correlation was observed between the risk score and poor clinicopathological attributes, including BCR state, Gleason score (GS), and T-staging. In general, lower risk scores denote elevated levels of immune cell infiltration and enhanced activity of immune-associated processes. Particularly, the elevation in Type_II_IFN_Reponse indicates the activation of immune cells, which further indicates that it inhibits tumor formation and development. Notably, two independent PCa queues (TCGA and GEO) verified all of these findings.
As per the analysis of the four-gene model, MAPK9 genes comprised a significant proportion of the major predictors, primarily influencing the risk scores of patients. We selected MAPK9 as a core target gene for tumors through bioinformatics methods and suppressed its expression using siRNA technology, thereby inhibiting the growth and migration of the tumor. Furthermore, a series of studies confirmed that MAPK9 serves as an inducer of ferroptosis, promoting the process of iron-dependent cell death. Although the results revealed inconsistent effects of MAPK9’s oncogenic promotion and the increase in the process of ferroptosis, the current understanding of whether ferroptosis in cancer cells inhibits or enhances tumor progression, as well as the underlying mechanisms of ferroptosis, remains incomplete. In a previous study, Jiang et al. delved into the subject of ferroptosis, highlighting the tumor-suppressive role of BAP1, which can facilitate ferroptosis. However, it remains unclear whether the ferroptotic activity of BAP1 contributes to its anti-cancer function [38]. However, whether the ferroptotic activity of BAP1 contributes to its anti-cancer function is still unclear. Therefore, our next step in research will focus on investigating the impact of MAPK9’s promotion of ferroptosis on the progression of prostate cancer. In our review of previous studies, it was discovered that MAPK9 phosphorylates multiple transcription factors, thereby regulating cell proliferation, migration, and programmed cell death. Li et al. [48] reported the potential role of maternally expressed 3 (MEG3) and myocardial infarction associated transcript (MIAT) in promoting lung adenocarcinoma progression by interacting with miR-106, thereby modulating the involvement of MAPK9 in the MAPK signal transduction pathway. Furthermore, MAPK9, identified as a gene associated with ferroptosis, serves as a potential biomarker for predicting overall survival in esophageal squamous-cell carcinoma (ESCC) [49]. According to the findings of our study, most Type II IFN Responses were associated with the low-risk group, suggesting an increase in immune cell activation and reinforcement of the immune response with an elevation in Type II IFN Responses. This further confirms the reliability of the signature in assessing patient prognosis. Importantly, some signature genes are also implicated in immune responses. MAPK9, also known as JNK2, has been shown to regulate B7.1 (CD80), which interacts with cytotoxic T-lymphocyte associated protein 4 (CTLA-4) to facilitate the initiation of immune responses. Lim et al. [50] found that Lipopolysaccharide (LPS)-induced B7.1 expression was significantly inhibited by si-JNK2 RNAs, suggesting that reduced MAPK9 expression in ESCC potentially promotes carcinogenesis by inhibiting B7.1-mediated immune response activation. Besides MAPK9, the three other signature genes are also related to ferroptosis and cancer, according to basic and clinical studies. MAP1LC3B is critically involved in ovarian cancer. The high expression of MAP1LC3B-II exhibits a positive association with ferroptosis sensitivity in 10 ovarian cancer cell lines.
Moreover, the baseline expression levels of MAP1LC3B are generally distributed in 60 human cancer cell lines across 15 tissues, especially after treatment with classical ferroptosis activators [51]. RPL8 plays a novel role as a ferroptosis regulator in driving hepatic ischemia-reperfusion injury [52], and its amplification may be involved in the pathogenesis of osteosarcoma [53]. FOXM1 overexpression has been found in many cancer types, suggesting that FOXM1 is critically involved in tumor development [54–56]. Moreover, recent studies have shown that dihydroartemisinin (DHA) causes cell arrest in an iron-dependent manner by modulating FOXM1 levels of head and neck squamous cell carcinoma (HNSCC).
This research has certain limitations. Firstly, the findings rely on a retrospective public dataset, necessitating further validation in prospective cohorts. Moreover, addressing the inherent tumor heterogeneity and technical noise associated with cross-platform sequencing presents a challenge in effectively managing expression data for the application of the four-gene signature. The simplicity of the validation set underscores the need for further investigation into the model’s accuracy in real-world scenarios. Therefore, future efforts should prioritize data preprocessing, including scaling and normalization, when handling RNA-seq data from patients in both research and clinical settings. The development of a standardized and commercially available genetic test kit featuring the four genes for automated risk score calculation could enhance its practical utility. Lastly, the underlying biological mechanism, particularly how MAPK9 affects the iron-drooping process in PCa, remains unknown and requires comprehensive investigation in future studies. The gene is currently in the early stages of development, necessitating extensive research by the scientific community.
This study developed a four-gene signature linked to ferroptosis, showcasing accurate predictive abilities for biochemical recurrence (BCR) in prostate cancer (PCa). Elevated risk scores were indicative of increased BCR likelihood and poorer clinicopathological characteristics. This signature provides a valuable means to distinguish between high-risk and low-risk PCa patients, enriching our understanding of the role of cellular ferroptosis in PCa onset and advancement. Ultimately, it was proved that MAPK9, which accounts for a significant proportion of the signature, plays a positive role in promoting tumor progression by relevant basic experiments. However, the relationship between the carcinogenic effect of MAPK9 and the ferroptosis process it induces remains elusive, necessitating further in-depth investigation.
Acknowledgement: None.
Funding Statement: The authors received no specific funding for this study.
Author Contributions: Bin Xu, Ye Tian, Wei Chen and Cheng-Gong Luo: Conceptualization, Methodology, Software and experimental design. Bin Xu, Jiao Zhang, Yun-Zhao An, Xuan Liu, Shuai-Jie Li: Data curation and performed the experiments. Wei Zhang, Kai Li, Xu Zhao, Dong-Bo Yuan and Ling-Yue An: Visualization, Investigation. Cheng-Gong Luo, Ye Tian and Wei Chen: Writing-original draft preparation. All authors read and approved the final manuscript.
Availability of Data and Materials: The datasets generated and analyzed during the current study are available in TCGA and GEO official website repository (https://portal.gdc.cancer.gov/; https://www.ncbi.nlm.nih.gov/geo/). We analyzed the functional protein association network with STRING database (https://string-db.org/).
Ethics Approval: This study was approved by the Ethics Committee of the First Affiliated Hospital of Sun Yat-sen University and the Institutional Animal Care and Use Committee of Sun Yat-sen University. In addition, all methods were executed in accordance with the relevant guidelines and regulations (Approval number: 2021-039).
Conflicts of Interest: The authors declare that they have no conflicts of interest to report regarding the present study.
Supplementary Materials: The supplementary material is available online at https://doi.org/10.32604/biocell.2024.048878.
References
1. Caggiano C, Pieraccioli M, Panzeri V, Sette C, Bielli P. c-MYC empowers transcription and productive splicing of the oncogenic splicing factor Sam68 in cancer. Nucleic Acids Res. 2019;47(12):6160–71. doi:10.1093/nar/gkz344. [Google Scholar] [PubMed] [CrossRef]
2. Siegel RL, Miller KD, Jemal A. Cancer statistics, 2020. CA Cancer J Clin. 2020;70(1):7–30. doi:10.3322/caac.21590. [Google Scholar] [PubMed] [CrossRef]
3. Han M, Partin AW, Pound CR, Epstein JI, Walsh PC. Long-term biochemical disease-free and cancer-specific survival following anatomic radical retropubic prostatectomy. The 15-year Johns Hopkins experience. Urol Clin North Am. 2001;28(3):555–65. doi:10.1016/S0094-0143(05)70163-4. [Google Scholar] [PubMed] [CrossRef]
4. Roehl KA, Han M, Ramos CG, Antenor JA, Catalona WJ. Cancer progression and survival rates following anatomical radical retropubic prostatectomy in 3,478 consecutive patients: long-term results. J Urol. 2004;172(3):910–4. doi:10.1097/01.ju.0000134888.22332.bb. [Google Scholar] [PubMed] [CrossRef]
5. Hull GW, Rabbani F, Abbas F, Wheeler TM, Kattan MW, Scardino PT. Cancer control with radical prostatectomy alone in 1,000 consecutive patients. J Urol. 2002;167(2):528–34. doi:10.1016/S0022-5347(01)69079-7. [Google Scholar] [PubMed] [CrossRef]
6. Amling CL, Blute ML, Bergstralh EJ, Seay TM, Slezak J, Zincke H. Long-term hazard of progression after radical prostatectomy for clinically localized prostate cancer: continued risk of biochemical failure after 5 years. J Urol. 2000;164(1):101–5. doi:10.1016/s0022-5347(05)67380-7. [Google Scholar] [CrossRef]
7. Brockman JA, Alanee S, Vickers AJ, Scardino PT, Wood DP, Kibel AS, et al. Nomogram predicting prostate cancer-specific mortality for men with biochemical recurrence after radical prostatectomy. Eur Urol. 2015;67(6):1160–7. doi:10.1016/j.eururo.2014.09.019. [Google Scholar] [PubMed] [CrossRef]
8. Farolfi A, Ceci F, Castellucci P, Graziani T, Siepe G, Lambertini A, et al. 68Ga-PSMA-11 PET/CT in prostate cancer patients with biochemical recurrence after radical prostatectomy and PSA < 0.5 ng/ml. Efficacy and impact on treatment strategy. Eur J Nucl Med Mol Imaging. 2019;46(1):11–9. doi:10.1007/s00259-018-4066-4. [Google Scholar] [PubMed] [CrossRef]
9. Wang Z, Li Y, Wang D, Shen Y. Ferroptosis molecular inducers: a future direction for malignant tumor chemotherapy. BIOCELL. 2022;46(7):1599–611. doi:10.32604/biocell.2022.018530. [Google Scholar] [CrossRef]
10. Stockwell BR, Friedmann Angeli JP, Bayir H, Bush AI, Conrad M, Dixon SJ, et al. Ferroptosis: a regulated cell death nexus linking metabolism, redox biology, and disease. Cell. 2017;171(2):273–85. doi:10.1016/j.cell.2017.09.021. [Google Scholar] [PubMed] [CrossRef]
11. Dixon SJ, Lemberg KM, Lamprecht MR, Skouta R, Zaitsev EM, Gleason CE, et al. Ferroptosis: an iron-dependent form of nonapoptotic cell death. Cell. 2012;149(5):1060–72. doi:10.1016/j.cell.2012.03.042. [Google Scholar] [PubMed] [CrossRef]
12. Hassannia B, Vandenabeele P, Vanden Berghe T. Targeting ferroptosis to iron out cancer. Cancer Cell. 2019;35(6):830–49. doi:10.1016/j.ccell.2019.04.002. [Google Scholar] [PubMed] [CrossRef]
13. Zhang Y, Shi J, Liu X, Feng L, Gong Z, Koppula P, et al. BAP1 links metabolic regulation of ferroptosis to tumour suppression. Nat Cell Biol. 2018;20(10):1181–92. doi:10.1038/s41556-018-0178-0. [Google Scholar] [PubMed] [CrossRef]
14. Jiang L, Kon N, Li T, Wang SJ, Su T, Hibshoosh H, et al. Ferroptosis as a p53-mediated activity during tumour suppression. Nat. 2015;520(7545):57–62. doi:10.1038/nature14344. [Google Scholar] [PubMed] [CrossRef]
15. Tarangelo A, Magtanong L, Bieging-Rolett KT, Li Y, Ye J, Attardi LD, et al. p53 suppresses metabolic stress-induced ferroptosis in cancer cells. Cell Rep. 2018;22(3):569–75. doi:10.1016/j.celrep.2017.12.077. [Google Scholar] [PubMed] [CrossRef]
16. Xie Y, Zhu S, Song X, Sun X, Fan Y, Liu J, et al. The tumor suppressor p53 limits ferroptosis by blocking DPP4 activity. Cell Rep. 2017;20(7):1692–704. doi:10.1016/j.celrep.2017.07.055. [Google Scholar] [PubMed] [CrossRef]
17. Zhang M, Qin X, Zhao Z, Du Q, Li Q, Jiang Y, et al. A self-amplifying nanodrug to manipulate the Janus-faced nature of ferroptosis for tumor therapy. Nanoscale Horiz. 2022;7(2):198–210. doi:10.1039/D1NH00506E. [Google Scholar] [PubMed] [CrossRef]
18. Chen X, Kang R, Kroemer G, Tang D. Broadening horizons: the role of ferroptosis in cancer. Nat Rev Clin Oncol. 2021;18(5):280–96. doi:10.1038/s41571-020-00462-0. [Google Scholar] [PubMed] [CrossRef]
19. Liang C, Zhang X, Yang M, Dong X. Recent progress in ferroptosis inducers for cancer therapy. Adv Mater. 2019;31(51):e1904197. doi:10.1002/adma.201904197. [Google Scholar] [PubMed] [CrossRef]
20. Ghoochani A, Hsu EC, Aslan M, Rice MA, Nguyen HM, Brooks JD, et al. Ferroptosis inducers are a novel therapeutic approach for advanced prostate cancer. Cancer Res. 2022;82(6):1495–508. doi:10.1158/0008-5472.CAN-21-2883. [Google Scholar] [CrossRef]
21. Tousignant KD, Rockstroh A, Poad BLJ, Talebi A, Young RSE, Taherian Fard A, et al. Therapy-induced lipid uptake and remodeling underpin ferroptosis hypersensitivity in prostate cancer. Cancer Metab. 2020;8(1):11. doi:10.1186/s40170-020-00217-6. [Google Scholar] [PubMed] [CrossRef]
22. Yang Y, Liu T, Hu C, Xia H, Liu W, Chen J, et al. Ferroptosis inducer erastin downregulates androgen receptor and its splice variants in castration‐resistant prostate cancer. Oncol Rep. 2021;45(4):25. doi:10.3892/or.2021.7976. [Google Scholar] [PubMed] [CrossRef]
23. Qin Z, Ou S, Xu L, Sorensen K, Zhang Y, Hu DP, et al. Design and synthesis of isothiocyanate-containing hybrid androgen receptor (AR) antagonist to downregulate AR and induce ferroptosis in GSH-Deficient prostate cancer cells. Chem Biol Drug Des. 2021;97(5):1059–78. doi:10.1111/cbdd.13826. [Google Scholar] [PubMed] [CrossRef]
24. Liang JY, Wang DS, Lin HC, Chen XX, Yang H, Zheng Y, et al. A novel ferroptosis-related gene signature for overall survival prediction in patients with hepatocellular carcinoma. Int J Biol Sci. 2020;16(13):2430–41. doi:10.7150/ijbs.45050. [Google Scholar] [PubMed] [CrossRef]
25. Rooney MS, Shukla SA, Wu CJ, Getz G, Hacohen N. Molecular and genetic properties of tumors associated with local immune cytolytic activity. Cell. 2015;160(1–2):48–61. doi:10.1016/j.cell.2014.12.033. [Google Scholar] [PubMed] [CrossRef]
26. Hou W, Xie Y, Song X, Sun X, Lotze MT, Zeh HJ, et al. Autophagy promotes ferroptosis by degradation of ferritin. Autophagy. 2016;12(8):1425–8. doi:10.1080/15548627.2016.1187366. [Google Scholar] [PubMed] [CrossRef]
27. Gao M, Monian P, Pan Q, Zhang W, Xiang J, Jiang X. Ferroptosis is an autophagic cell death process. Cell Res. 2016;26(9):1021–32. doi:10.1038/cr.2016.95. [Google Scholar] [PubMed] [CrossRef]
28. Kim R, Taylor D, Vonderheide RH, Gabrilovich DI. Ferroptosis of immune cells in the tumor microenvironment. Trends Pharmacol Sci. 2023;44(8):542–52. doi:10.1016/j.tips.2023.06.005. [Google Scholar] [PubMed] [CrossRef]
29. Liao P, Wang W, Wang W, Kryczek I, Li X, Bian Y, et al. CD8+ T cells and fatty acids orchestrate tumor ferroptosis and immunity via ACSL4. Cancer Cell. 2022;40(4):365–78.E6. doi:10.1016/j.ccell.2022.02.003. [Google Scholar] [PubMed] [CrossRef]
30. Wang W, Green M, Choi JE, Gijón M, Kennedy PD, Johnson JK, et al. CD8+ T cells regulate tumour ferroptosis during cancer immunotherapy. Nat. 2019;569(7755):270–4. doi:10.1038/s41586-019-1170-y. [Google Scholar] [PubMed] [CrossRef]
31. Tian Y, Lu J, Hao X, Li H, Zhang G, Liu X, et al. FTH1 inhibits ferroptosis through ferritinophagy in the 6-OHDA model of Parkinson’s disease. Neurotherapeutics. 2020;17(4):1796–812. doi:10.1007/s13311-020-00929-z. [Google Scholar] [PubMed] [CrossRef]
32. Connor MJ, Shah TT, Horan G, Bevan CL, Winkler M, Ahmed HU. Cytoreductive treatment strategies for de novo metastatic prostate cancer. Nat Rev Clin Oncol. 2020;17(3):168–82. doi:10.1038/s41571-019-0284-3. [Google Scholar] [PubMed] [CrossRef]
33. Farashi S, Kryza T, Clements J, Batra J. Post-GWAS in prostate cancer: from genetic association to biological contribution. Nat Rev Cancer. 2019;19(1):46–59. doi:10.1038/s41568-018-0087-3. [Google Scholar] [PubMed] [CrossRef]
34. Yuan P, Ling L, Fan Q, Gao X, Sun T, Miao J, et al. A four-gene signature associated with clinical features can better predict prognosis in prostate cancer. Cancer Med. 2020;9(21):8202–15. doi:10.1002/cam4.3453. [Google Scholar] [PubMed] [CrossRef]
35. van den Broeck T, van den Bergh RCN, Arfi N, Gross T, Moris L, Briers E, et al. Prognostic value of biochemical recurrence following treatment with curative intent for prostate cancer: a systematic review. Eur Urol. 2019;75(6):967–87. doi:10.1016/j.eururo.2018.10.011. [Google Scholar] [PubMed] [CrossRef]
36. Meng J, Lu X, Zhou Y, Zhang M, Gao L, Gao S, et al. Characterization of the prognostic values and response to immunotherapy/chemotherapy of Krüppel-like factors in prostate cancer. J Cell Mol Med. 2020;24(10):5797–810. doi:10.1111/jcmm.15242. [Google Scholar] [PubMed] [CrossRef]
37. Stockwell BR, Jiang X, Gu W. Emerging mechanisms and disease relevance of ferroptosis. Trends Cell Biol. 2020;30(6):478–90. doi:10.1016/j.tcb.2020.02.009. [Google Scholar] [PubMed] [CrossRef]
38. Jiang X, Stockwell BR, Conrad M. Ferroptosis: mechanisms, biology and role in disease. Nat Rev Mol Cell Biol. 2021;22(4):266–82. doi:10.1038/s41580-020-00324-8. [Google Scholar] [PubMed] [CrossRef]
39. Radtke F, Raj K. The role of Notch in tumorigenesis: oncogene or tumour suppressor? Nat Rev Cancer. 2003;3(10):756–67. doi:10.1038/nrc1186. [Google Scholar] [PubMed] [CrossRef]
40. Su Y, Zhao B, Zhou L, Zhang Z, Shen Y, Lv H, et al. Ferroptosis, a novel pharmacological mechanism of anti-cancer drugs. Cancer Lett. 2020;483:127–36. doi:10.1016/j.canlet.2020.02.015. [Google Scholar] [PubMed] [CrossRef]
41. Wang Y, Wei Z, Pan K, Li J, Chen Q. The function and mechanism of ferroptosis in cancer. Apoptosis. 2020;25(11–12):786–98. doi:10.1007/s10495-020-01638-w. [Google Scholar] [PubMed] [CrossRef]
42. Gai C, Yu M, Li Z, Wang Y, Ding D, Zheng J, et al. Acetaminophen sensitizing erastin-induced ferroptosis via modulation of Nrf2/heme oxygenase-1 signaling pathway in non-small-cell lung cancer. J Cell Physiol. 2020;235(4):3329–39. doi:10.1002/jcp.29221. [Google Scholar] [PubMed] [CrossRef]
43. Sun X, Niu X, Chen R, He W, Chen D, Kang R, et al. Metallothionein-1G facilitates sorafenib resistance through inhibition of ferroptosis. Hepatol. 2016;64(2):488–500. doi:10.1002/hep.28574. [Google Scholar] [PubMed] [CrossRef]
44. Hao S, Yu J, He W, Huang Q, Zhao Y, Liang B, et al. Cysteine dioxygenase 1 mediates erastin-induced ferroptosis in human gastric cancer cells. Neoplasia. 2017;19(12):1022–32. doi:10.1016/j.neo.2017.10.005. [Google Scholar] [PubMed] [CrossRef]
45. Yang Y, Luo M, Zhang K, Zhang J, Gao T, Connell DO, et al. Nedd4 ubiquitylates VDAC2/3 to suppress erastin-induced ferroptosis in melanoma. Nat Commun. 2020;11(1):433. doi:10.1038/s41467-020-14324-x. [Google Scholar] [PubMed] [CrossRef]
46. Nassar ZD, Mah CY, Dehairs J, Burvenich IJ, Irani S, Centenera MM, et al. Human DECR1 is an androgen-repressed survival factor that regulates PUFA oxidation to protect prostate tumor cells from ferroptosis. eLife. 2020;9:3068. doi:10.7554/eLife.54166. [Google Scholar] [PubMed] [CrossRef]
47. Liao D, Yang G, Yang Y, Tang X, Huang H, Shao J, et al. Identification of pannexin 2 as a novel marker correlating with ferroptosis and malignant phenotypes of prostate cancer cells. Onco Targets Ther. 2020;13:4411–21. doi:10.2147/OTT.S249752. [Google Scholar] [PubMed] [CrossRef]
48. Li DS, Ainiwaer JL, Sheyhiding I, Zhang Z, Zhang LW. Identification of key long non-coding RNAs as competing endogenous RNAs for miRNA-mRNA in lung adenocarcinoma. Eur Rev Med Pharmacol Sci. 2016;20(11):2285–95. doi:10.3892/or.2021.7976. [Google Scholar] [CrossRef]
49. Song J, Liu Y, Guan X, Zhang X, Yu W, Li Q. A novel ferroptosis-related biomarker signature to predict overall survival of esophageal squamous cell carcinoma. Front Mol Biosci. 2021;8:675193. doi:10.3389/fmolb.2021.675193. [Google Scholar] [PubMed] [CrossRef]
50. Lim W, Gee K, Mishra S, Kumar A. Regulation of B7.1 costimulatory molecule is mediated by the IFN regulatory factor-7 through the activation of JNK in lipopolysaccharide-stimulated human monocytic cells. J Immunol. 2005;175(9):5690–700. doi:10.4049/jimmunol.175.9.5690. [Google Scholar] [PubMed] [CrossRef]
51. Li J, Liu J, Xu Y, Wu R, Chen X, Song X, et al. Tumor heterogeneity in autophagy-dependent ferroptosis. Autophagy. 2021;17(11):3361–74. doi:10.1080/15548627.2021.1872241. [Google Scholar] [PubMed] [CrossRef]
52. Nazzal M, Madsen EC, Armstrong A, van Nispen J, Murali V, Song E, et al. Novel NMP split liver model recapitulates human IRI and demonstrates ferroptosis modulators as a new therapeutic strategy. Pediatr Transplant. 2021;26(2):e14164. doi:10.1111/petr.14164. [Google Scholar] [PubMed] [CrossRef]
53. Yang J, Zhang W. New molecular insights into osteosarcoma targeted therapy. Curr Opin Oncol. 2013;25(4):398–406. doi:10.1097/CCO.0b013e3283622c1b. [Google Scholar] [PubMed] [CrossRef]
54. Laoukili J, Stahl M, Medema RH. FoxM1: at the crossroads of ageing and cancer. Biochim Biophys Acta. 2007;1775(1):92–102. doi:10.1016/j.bbcan.2006.08.006. [Google Scholar] [PubMed] [CrossRef]
55. Pilarsky C, Wenzig M, Specht T, Saeger HD, Grützmann R. Identification and validation of commonly overexpressed genes in solid tumors by comparison of microarray data. Neoplasia. 2004;6(6):744–50. doi:10.1593/neo.04277. [Google Scholar] [PubMed] [CrossRef]
56. Halasi M, Gartel AL. FOX(M1) news--it is cancer. Mol Cancer Ther. 2013;12(3):245–54. doi:10.1158/1535-7163.mct-12-0712. [Google Scholar] [PubMed] [CrossRef]
Cite This Article
 Copyright © 2024 The Author(s). Published by Tech Science Press.
This work is licensed under a Creative Commons Attribution 4.0 International License , which permits unrestricted use, distribution, and reproduction in any medium, provided the original work is properly cited.
 Downloads
 Citation Tools