
 Submit a Paper
 Propose a Special lssue
 Open Access
ARTICLE
CARD11 serves as a therapeutic biomarker for the drug therapies of ccRCC
Department of Urology, Guangdong Provincial People’s Hospital (Guangdong Academy of Medical Sciences), Southern Medical University, Guangzhou, 510080, China
* Corresponding Authors: YANLIN TANG. Email: ; JIUMIN LIU. Email:
# Kaiwen Tian and Hanzhong Chen contributed equally to this work
(This article belongs to the Special Issue: Frontiers in cancer: tumor microenvironment)
BIOCELL 2024, 48(5), 817-834. https://doi.org/10.32604/biocell.2024.048737
Received 16 December 2023; Accepted 29 January 2024; Issue published 06 May 2024
 View Full Text
 Download PDF
Abstract
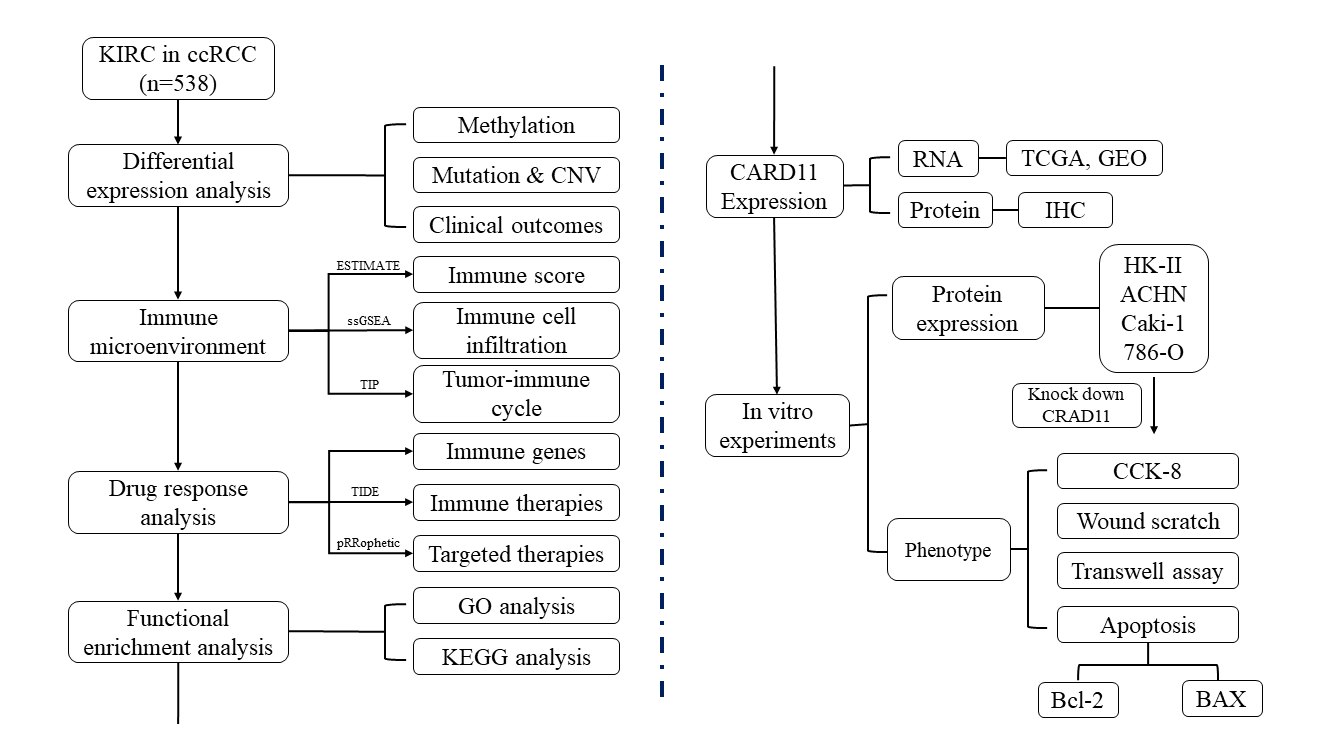
Background: The incidence of clear cell renal cell carcinoma (ccRCC) is globally high; however, despite the introduction of innovative drug therapies, there remains a lack of effective biomarkers for evaluating treatment response. Recently, Caspase recruiting domain-containing protein 11 (CARD11) has garnered attention due to its significant association with tumor development and the immune system. Methods: The expression of CARD11 mRNA and protein in ccRCC were analyzed by public database and immunohistochemistry. The focus of this study is on the epigenomic modifications of CARD11, its expression of ccRCC immunophenotype, and its correlation with response to immunotherapy and targeted therapy. Furthermore, to investigate the mechanism of this molecule’s influence on different biological behaviors of cells, cell tests in vitro have been conducted to observe the impact of its expression level. Results: CARD11 expression was upregulated which may be mainly modified by body methylation and was correlated with poor prognosis in ccRCC. In the tumor microenvironment of ccRCC, CARD11 expression was positively correlated with increased T lymphocyte infiltration and increased expression of inhibitory immune checkpoints. Moreover, ccRCC patients with high CARD11 expression had a better response to immunotherapy and targeted therapy. The knockdown of CARD11 ultimately suppressed the proliferation, migration, and invasion capabilities of ccRCC cells while simultaneously enhancing tumor cell apoptosis. Conclusion: We identified CARD11 as a novel therapeutic biomarker for immunotherapy and targeted therapy in ccRCC.Graphic Abstract
Keywords
Supplementary Material
Supplementary Material FileAbbreviation
| ccRCC | Clear cell renal cell carcinoma |
| CARD11 | Caspase recruiting domain-containing protein 11 |
| RCC | Renal cell carcinoma |
| VEGF | vascular endothelial growth factor |
| VHL | von Hippel-Lindau tumor suppressor |
| FDA | Food and Drug Administration |
| TKIs | tyrosine kinase inhibitors |
| ICIs | immune checkpoint inhibitors |
| PD-1 | programmed cell death 1 |
| TME | tumor microenvironment |
| TIICs | tumor infiltrating immune cells |
| HE | hematoxylin-eosin staining |
| TCGA | The Cancer Genome Atlas |
| GEO | Genome Expression Omnibus |
| IHC | Immunohistochemistry |
| OS | overall survival |
| DFS | disease-free survival |
| EWAS Atlas | Epigenome Wide Association Study Atlas |
| CNV | copy number variation |
| ESTIMATE | Estimation of Stromal and Immune cells in Malignant Tumor tissues using Expression data |
| ssGSEA | single-sample Gene Set Enrichment Analysis |
| CCR | chemokine-chemokine receptor |
| APC | antigen-presenting cell |
| HLA | human leukocyte antigen |
| MHC-I | major histocompatibility complex I |
| IFN | interferon |
| TISIDB | Tumor-Immune System Interactions Database |
| TIP | Tumor Immunophenotype Profiling |
| TIM-3 | T cell immunoglobulin and mucin domain 3 |
| PD-L1 | Programmed cell death 1 ligand 1 |
| LAG3 | lymphocyte-activation gene-3 |
| LAIR1 | Leukocyte-associated immunoglobulin-like receptor 1 |
| PVR | poliovirus receptor |
| IDO1 | indoleamine 2,3-dioxygenase 1 |
| CTLA4 | cytotoxic T-lymphocyte associated protein 4 |
| TIGIT | T cell immunoreceptor with Ig and ITIM domains |
| CD200R1 | CD200 receptor 1 |
| CEACAM1 | arcinoembryonic antigen-related cell adhesion molecule 1 |
| KIR3DL1 | killer cell immunoglobulin-like receptor, three Ig domains and long cytoplasmic tail 1 |
| BTLA | B and T lymphocyte associated |
| ADORA2A | adenosine A2a receptor |
| LGALS3 | lectin galactoside-binding soluble 3 |
| VTCN1 | V-set domain containing T cell activation inhibitor 1 |
| TCIA | The Cancer Immune Atlas |
| TIDE | Tumor Immune Dysfunction and Exclusion |
| GDSC | Genomics of Drug Sensitivity in Cancer |
| GSEA | Gene Set Enrichment Analysis |
| GO | Gene Ontology |
| KEGG | Kyoto Encyclopedia of Genes and Genomes |
| DMEM | Dulbecco’s modified eagle medium |
| RPMI | Roswell Park Memorial Institute |
| WB | Western blot |
| RIPA | Radioimmunoprecipitation analysis |
| Bcl2 | B-cell lymphoma-2 |
| BAX | Bcl2 associated X |
| Th1 cell | type 1 T helper cell |
| Tfh | T follicular helper cell |
| MDSC | myeloid-derived suppressor cell |
| Treg | regulatory T cell |
| CCL | C-C motif chemokine ligand |
| CXCL | C-X-C motif chemokine ligand |
| XCL | X-C motif chemokine ligand |
| CXCR | C-X-C motif chemokine receptor |
| BCR | B cell receptors |
| TCR | T cell receptors |
| NF-κB | nuclear factor-kappa B |
| JNK | Jun N-terminal kinase |
| mTOR | mammalian target of rapamycin |
| Th2 cell | type 2 T helper cell |
| IL-2 | interleukin-2 |
| TNF | tumor necrosis factor |
| FOXP3 | Forkhead box protein P3 |
| BCL2A1 | BCL2 related protein A1 |
| MALT1 | mucosa associated lymphoid tissue lymphoma translocation gene 1 |
| BCL10 | B cell leukemia/lymphoma |
Renal cell carcinoma (RCC) is among the top ten cancer types diagnosed worldwide in both males and females, with an estimated 13,000 kidney cancer-related fatalities projected for the United States in 2021 [1]. RCC can be classified into several histological subtypes which clear cell renal cell carcinoma (ccRCC) is the most prevalent and aggressive subtype [2]. While surgical resection effectively manages early-stage ccRCC cases, it proves inadequate for patients at advanced stages, which constitute one-third of all ccRCC cases [2]. Fortunately, significant advancements have been made in the drug treatment of RCC, progressing from non-specific cytokine therapy to targeted therapy against the vascular endothelial growth factor (VEGF) and currently encompassing novel immunotherapy drugs. Additionally, certain metabolic and inflammatory pathways are involved in regulating this process [3,4]. Presently, the U.S. Food and Drug Administration (FDA) has approved several tyrosine kinase inhibitors (TKIs), such as Sunitinib and Pazopanib, as first-line treatments for metastatic ccRCC with anti-angiogenic properties [5–7]. Furthermore, immune checkpoint inhibitors (ICIs) have demonstrated positive efficacy in treating advanced/metastatic malignancies over recent years [8–10]. Nivolumab, an ICI, exerts its therapeutic effect in ccRCC by specifically targeting programmed cell death 1 (PD-1), thereby disrupting tumor immune evasion and enhancing anti-tumor activity mediated by the immune system [11]. However, the efficacy of these innovative therapies remains uncertain. Individual patients may exhibit varying responses to different treatment strategies, and the potential for developing tolerance varies as well, necessitating the identification of reliable biomarkers to facilitate personalized therapeutic approaches for clinicians [12].
In addition to cancer cells, the tumor microenvironment (TME) encompasses a diverse array of cellular components (endothelial cells, immune cells, fibroblasts, etc.) [13–15] and various secretory factors (growth factors and chemokines) [16,17], whose composition varies depending on the specific tumor type. Extensive research has demonstrated intricate interactions between cancer cells and multiple constituents within the tumor microenvironment [18], which are believed to play a pivotal role in tumorigenesis. Immune cells constitute a significant component of the TME, and their infiltration can profoundly modulate tumor cell growth [19]. ccRCC has been shown to exhibit a high level of tumor-infiltrating immune cells (TIICs), indicating potential for immunotherapeutic intervention [20]. ICIs such as nivolumab have demonstrated the ability to modify TIICs, leading to therapeutic effects. Moreover, patients with varying degrees of TIIC infiltration display different responses and tolerance statuses towards ICIs [21,22]. Additionally, the extent of TIIC infiltration is associated with VEGF-targeted therapy response. Beuselinck et al. suggested that ccRCC patients with reduced T-cell infiltration may exhibit poor response to TKIs [23,24]. With advancements in high-throughput sequencing technologies, researchers are now able to investigate gene expression profiles to gain insights into the characteristics of TIICs within tumors for the identification of therapeutic and prognostic predictors [25]. Therefore, it is both reasonable and beneficial to explore gene expression patterns and TIICs in ccRCC for improved immunotherapeutic strategies.
Caspase recruiting domain-containing protein 11 (CARD11, also known as CARMA1 and Bimp3), as a member of membrane-associated guanylate kinase (MAGUK) family proteins, exhibits lymphocyte-specificity and plays a crucial role in the proliferation and cytokine production of immune cells [26]. It has been noted that differential expression patterns of CARD11 can lead to either lymphoproliferative disorders or immune deficiency, with its involvement in tumorigenesis also being identified [27]. However, limited knowledge exists regarding the expression patterns and functions of CARD11 in ccRCC. Furthermore, different gene modifications may result in distinct gene expression profiles. For instance, promoter methylation can decrease gene expression while body methylation may increase it [28]. Thus, comprehending the expression levels and the associated modification of CARD11 in ccRCC is imperative. In this study, we utilized public databases and online tools to investigate the expression of CARD11 together with its correlation with the immune landscape in ccRCC for the potential identification of therapeutic biomarkers.
This study enrolled six patients (P1 to P6) diagnosed with ccRCC, who underwent laparoscopic radical nephrectomy at Guangdong Provincial People’s Hospital between June 2020 and July 2021 without prior medical treatment. All patients provided written informed consent, and the hospital ethics committee approved the program and procedures (No. KY-2-2022-257-01). Following hematoxylin-eosin staining (HE) and immunohistochemical labeling, two independent pathologists examined postoperative pathological sections of tumor specimens from all six ccRCC patients. The eighth edition of the American Joint Committee on Cancer staging system was utilized for postoperative pathological staging. The comprehensive clinical features of these patients are presented in Suppl. Table 1 in the supplementary materials.
Following surgery procedures, tumor specimens were extracted ex vivo from six patients diagnosed with ccRCC. Subsequently, the kidney and tumor specimens were separated along the long-axis coronal plane. Depending on the size and invasion of the tumor, two to four tissues measuring approximately 3 mm3 in volume were collected from distinct regions of the tumor (with a minimum distance of 1 cm between them). The precise location of each sampling point was meticulously recorded. Afterward, by changing equipment, normal renal tissues were obtained as paired neighboring tissues from a site located more than 2 cm away from the margin of the tumor margin. In total, eighteen tumor samples and six adjacent samples were collected from six ccRCC patients. The ccRCC tissues were placed in empty 2 mL cryopreservation tubes and immediately cryopreserved in liquid nitrogen for subsequent exon sequencing and transcriptome sequencing.
Genomic data acquisition and differential expression analysis
The Cancer Genome Atlas (TCGA) is a publicly funded cancer genomics program, supported by the National Cancer Institute and National Human Genome Research Institute. It provides comprehensive genomic, epigenomic, transcriptomic, and proteomic data on 33 different types of cancer. In this study, we obtained the mRNA expression data and corresponding clinical data for ccRCC from the Kidney Clear Cell Carcinoma (KIRC) project within TCGA through the Genomics Data Commons Data Portal. This dataset consisted of 539 tumor samples and 72 normal samples. To analyze the differential expression of CARD11 between tumor and normal samples in ccRCC, we utilized the R package “limma” [29]. Additionally, we selected 72 paired tumors and adjacent normal samples to perform paired differential expression analysis of CARD11 in ccRCC. Furthermore, to validate our findings, we included two additional RNA expression profiling datasets: GSE53757 (n = 144) and GSE40435 (n = 202), which were retrieved from Gene Expression Omnibus (GEO). GEO is a publicly accessible repository that stores original expression data submitted by researchers across various fields along with series and platform records. These two datasets contain a substantial number of paired ccRCC and adjacent normal samples suitable for validating differential expression results. Moreover, single-cell RNA sequencing (scRNA-seq) data for CARD11 in normal kidney tissue were extracted to further investigate its expression pattern. The aforementioned data were sourced from publicly available databases, thus obviating the need for ethical consent.
Using a 4% paraformaldehyde (P0099, Beyotime, Shanghai, China) solution and paraffin fixation, the clinical samples were subsequently sectioned into paraffin sections with a thickness of 3–5 μm. The paraffin sections underwent desaponification, rehydration, antigen recovery, and endogenous peroxidase treatment. They were then incubated overnight at 4°C with CARD11 antibody (1:200, 21741-1-AP, Proteintech, Wuhan, China). After washing, the sections were incubated with a horseradish peroxidase-labeled antibody (PR30011, Proteintech, Wuhan, China) for 50 min at room temperature. Finally, color development was performed on the aforementioned sections using the DAB horseradish peroxidase color development kit (G1212-200T, Servicebio, Wuhan, China).
Analysis of the relationship between CARD11 expression and clinical features characteristics in ccRCC
The clinical data extracted from the TCGA database included survival time, survival state, age, sex, Fuhrman grade, and AJCC stage (including T stage, N stage, and M stage). Samples with a survival time was less than 30 days were excluded. A total of 515 samples with overall survival (OS) time and 420 samples with disease-free survival (DFS) time were utilized for subsequent analysis. The samples were stratified into different groups based on age (<65y vs. >65y), sex (male vs. female), Fuhrman grade (grades 1–4), AJCC stage (stages 1–4), T stage (T1–T4), N stage (N0 vs. N1), and M stage (M0 vs. M1). Subsequently, CARD11 expression was compared among each subgroup. Kaplan-Meier survival analysis using the R package “survminer” [30] was performed to assess OS and DFS in ccRCC patients according to high or low CARD11 expression groups. The optimal cutoff point for dividing the CARD11 expression groups was determined using X-tile 3.6.1 [31].
Analysis of the epigenomic modification of CARD11 in ccRCC
For a more comprehensive understanding of the CARD11 expression in ccRCC, we utilized online databases to analyze the epigenomic modification of CARD11. Epigenome Wide Association Study Atlas (EWAS Atlas, https://ngdc.cncb.ac.cn/ewas/) is a knowledge base that facilitates the analysis of clinical traits and their relationship with epigenomes [32]. Through EWAS Atlas, we obtained information on the methylation status of the CARD11 promoter and body in ccRCC, as well as the methylation levels of individual CpG islands. Additionally, we analyzed the correlation between CARD11 methylation and both its expression level and overall survival (OS) in ccRCC patients using this website. Furthermore, data on copy number variation (CNV) and mutations in CARD11 were retrieved from cBioPortal for Cancer Genomics (cBioPortal, https://www.cbioportal.org/), which enables multidimensional analysis of cancer genomes [33]. We compared CARD11 expression levels across different CNV and mutation statuses while conducting prognostic analyses to determine the prognostic value of CARD11 CNV and mutation.
Analysis of the CARD11-related infiltrating immune cells in ccRCC
Estimation of STromal and Immune cells in MAlignant Tumours using Expression data (ESTIMATE) utilizes the cancer expression profile to infer the cellular composition of cancers, with a specific focus on immune cells and stromal cells [34]. Using R software, the immune score in ccRCC was calculated and correlated with CARD11 expression. Subsequently, we performed single sample Gene Set Enrichment Analysis (ssGSEA) through the R package “GSVA” [35] to assess the status of TIICs in ccRCC by analyzing the expression of 23 gene sets. Correlation analysis was employed to identify which infiltrating immune cell subset was associated with CARD11 expression, and Kaplan-Meier survival analysis was conducted to demonstrate the prognostic value of CARD11-related TIICs in ccRCC. In addition to TIICs, several immune functions (T cell co-stimulation, checkpoint, T cell co-inhibition, para-inflammation, chemokine-chemokine receptor (CCR), inflammation-promoting, antigen-presenting cell (APC) co-stimulation, APC co inhibition, cytolytic activity, human leukocyte antigen (HLA), major histocompatibility complex I (MHC-I), Type I Interferon (IFN) response, Type II IFN response) were similarly related to CARD11 expression. Furthermore, we investigated CARD11-related immune chemokines and receptors through an integrated repository portal for tumor-immune system interactions (TISIDB). This user-friendly web tool allows browsing multiple roles of a particular gene in tumor-immunity interaction across 30 TCGA tumors [36].
Cancer-immunity cycle analysis
Xu et al. developed an open-access website, Tumor Immunophenotype Profiling (TIP, http://biocc.hrbmu.edu.cn/TIP/) to facilitate researchers in the analysis of the 7-step cancer-immunity cycle [37]. Subsequently, by uploading the RNA expression file of ccRCC, we obtained compared the disparities in each step of the cancer-immunity cycle between high and low CARD11 expression groups.
Online single-cell RNA sequencing analysis
CancerSEA (http://biocc.hrbmu.edu.cn/CancerSEA/) is an alternative online tool that integrates scRNA-seq data for public research [38]. CancerSEA offers a means to investigate the correlation between a selected gene and various functional states of cancer cells. Therefore, we utilized CancerSEA to explore CARD11 expression in distinct cell types in normal kidney tissue and its relationship with different functional states of ccRCC cells.
Analysis of the relationship between CARD11 expression and drug response
RNA expression of 20 inhibitory immune checkpoints (T cell immunoglobulin and mucin domain 3 (TIM-3), Programmed cell death 1 ligand 1 (PD-L1), CD86, lymphocyte-activation gene-3 (LAG3), Leukocyte-associated immunoglobulin-like receptor 1 (LAIR1), poliovirus receptor (PVR), indoleamine 2,3-dioxygenase 1 (IDO1), CD80, cytotoxic T-lymphocyte associated protein 4 (CTLA4), PD-1, T cell immunoreceptor with Ig and ITIM domains (TIGIT), CD200 receptor 1 (CD200R1), carcinoembryonic antigen-related cell adhesion molecule 1 (CEACAM1), CD276, CD200, killer cell immunoglobulin-like receptor, three Ig domains and long cytoplasmic tail 1 (KIR3DL1), B and T lymphocyte associated (BTLA), adenosine A2a receptor (ADORA2A), lectin galactoside-binding soluble 3 (LGALS3), V-set domain containing T cell activation inhibitor 1 (VTCN1)) in ccRCC from TCGA was extracted and analyzed between high and low CARD11 groups. Meanwhile, we investigated the association between CARD11 expression and the therapeutic response to immune checkpoint blockade using data from The Cancer Immune Atlas (TCIA, https://tcia.at/home) and Tumor Immune Dysfunction and Exclusion (TIDE, http://tide.dfci.harvard.edu/) [39]. In addition to immunotherapies, we compared the sensitivity of five FDA-approved drugs (Axitinib, Mitomycin, Sorafenib, Pazopanib, and Sunitinib) between high and low CARD11 expression groups. The drug sensitivity was calculated based on the RNA expression data of ccRCC in TCGA utilizing the R package “pRRophetic” [40], which takes advantage of the data from Genomics of Drug Sensitivity in Cancer (GDSC, https://www.cancerrxgene.org).
Functional enrichment analysis of CARD11
Gene Set Enrichment Analysis (GSEA) is employed to annotate and interpret the enrichment function of a given gene expression data based on existing gene sets [41,42]. The software GSEA 4.1.0 along with two gene sets (c5.go.v7.4.symbols.gmt and c2.cp.kegg.v7.4.symbols.gmt) were downloaded (https://www.gsea-msigdb.org/). The Gene Ontology (GO) gene sets encompass three types of functional annotation including biological processes, cellular components, and molecular functions. Additionally, the Kyoto Encyclopedia of Genes and Genomes (KEGG) gene sets facilitate the correlation between gene expression and multiple signaling pathways. To conduct functional enrichment analysis, CARD11 expression data of ccRCC from TCGA was divided into high and low groups based on the median value and utilized with the two gene sets through the software GSEA 4.1.0.
Cell culture and establishment of stable transgenic lines
The normal renal tubular epithelial cells (HK-II) and renal cancer cell lines (786-O, ACHN, and Caki-I) were obtained from Procell (Wuhan, China). HK-II cells were cultured in Dulbecco’s modified Eagle medium/F12 (C1330500BT, Gibco, USA). Caki-I and ACHN cells were cultured in high-glucose DMEM medium (C11995500BT, Gibco, USA), while 786-O cells were cultured in Roswell Park Memorial Institute (RPMI)-1640 basal medium (C11875500BT, Gibco, USA). The cells were cultured in a medium supplemented with 10% fetal bovine serum (FBS, FSP500, ExCell, Shanghai, China), as well as 1000 units/mL of penicillin and 1000 μg/mL of streptomycin (15140122, Gibco, USA). One lentiviral vector (pLKO.1) was used to create the shRNA plasmid (shCARD11-1 5′-GCTGGTCAACAGGATCTACAA-3′; shCARD11-2 5′-CGGCTGTTGGACATTCTACAT-3′). To induce viral infection, 8 μg/mL of polybrene was introduced. For stable interfering cell lines, a puromycin screening concentration of 2 μg/mL was used.
Radioimmunoprecipitation analysis (RIPA, G2002, Servicebio, Wuhan, China) solution with the protease inhibitor (P1005, Beyotime, Shanghai, China) was used to obtain the cell lysate, and the protein concentration of the product was measured by the BCA kit (P0009, Beyotime, Shanghai, China). The WB analysis experiment was carried out according to the detection method described previously [43]. The following antibodies were applied: CARD11(1:1000, 4435, CST, Danvers, Massachusetts, USA), B-cell lymphoma-2 (Bcl2, 1:2000, 68103-1-Ig, Proteintech, Wuhan, China), Bcl2 associated X (BAX, 1:2000, 50599-2-Ig, Proteintech, Wuhan, China), GAPDH (1:50000, 60004-1-Ig, Proteintech, Wuhan, China).
The apoptosis assay, proliferation assay, scratch assay, and transwell assay
The apoptosis assay was performed using the Annexin V-FITC/PI fluorescent double-staining apoptosis detection kit (E-CK-A211B, Elabscience, Wuhan, China). Each staining solution (5 μL) was added to every 2.5 * 105 cells and incubated at room temperature for 15–20 min in the absence of light. Apoptosis was detected by flow cytometry.
In the cell proliferation experiment, the cells were initially seeded in 96-well plates at a density of 3000 cells per well, and the culture medium was refreshed every 24 h. Cell Counting Kit-8 (CCK-8) reagent (C0038, Beyotime, Shanghai, China) was introduced at 24, 48, and 72 h time points, followed by measurement of absorbance values at 450 nm using an enzyme-labeled detector (Multiskan GO, Thermo Fisher Scientific, USA).
For the scratch experiment, cells were seeded in 12-well plates at a density of 5 * 105 cells per well. Once the cells reached approximately 90% confluence, a consistent force was applied to mark the center of each petri dish using a 200 μL pipette gun. Shed cells were then removed with PBS and replaced with a serum-free medium. The scratch area was photographed at both 0 and 24 h, and healing was quantified using Image J software.
The Transwell experiment employed a permeable cell culture chamber (3422, Corning, Washington, DC, USA) with an 8 μm pore size. For the invasion experiment, 100 μL of Matrigel matrix gel (354230, Corning, New York, USA) diluted at a ratio of 1:8 was added to the chamber incubated in a cell incubator at 37°C for 30 min (The transwell migration experiment did not require matrix gel components). Once the matrix gel had solidified, 100 μL of cell suspension (blank medium) containing 15,000 cells per well was introduced into the chamber. Additionally, approximately 600 μL of complete medium containing 20% FBS was added to the lower well. Following cultivation for a period ranging from 24 to 36 h and subsequent fixation using a solution consisting of 4% paraformaldehyde and staining with crystal violet dye (GC307002, Servicebio, Wuhan, China) were performed. Finally, the number of cells on the outer surface of the membrane was documented through photography and recording.
All the data analyses were achieved employing SPSS 25.0, R 4.0.2 and the mentioned web tools. Both R 4.0.2 and GraphPad Prism 8 were used for data visualization. If the sample data adheres to a normal distribution, the variables are represented as mean ± standard deviation (
CARD11 expression is upregulated in ccRCC
By comparing the CARD11 expression in tumor and normal samples from ccRCC patients in TCGA, CARD11 expression was significantly upregulated in ccRCC (Fig. 1A). Paired differential analysis further confirmed that ccRCC tissue exhibited a higher level of CARD11 expression compared to adjacent normal tissue (Fig. 1B). To validate these findings, two GEO datasets, GSE53757, and GSE40435 were used for delivering the same results (Figs. 1C and 1D). Similarly, our analysis of clinically sequenced samples from our hospital revealed significantly elevated CARD11 expression levels compared to adjacent normal tissues (Fig. 1E). Subsequently, scRNA-seq data provided insights into the distribution of CARD11 within the kidney microenvironment (Fig. 1F), demonstrating its presence in T cells, B cells, ductal cells, urothelial cells, macrophages, and collecting duct cells; however proximal tubular cells from which ccRCC originates did not express CARD11 [44]. Finally, the IHC results demonstrate a significantly elevated expression of CARD11 in ccRCC tissues compared to normal tissues, indicating a marked difference in protein expression levels (Figs. 1G–1M).
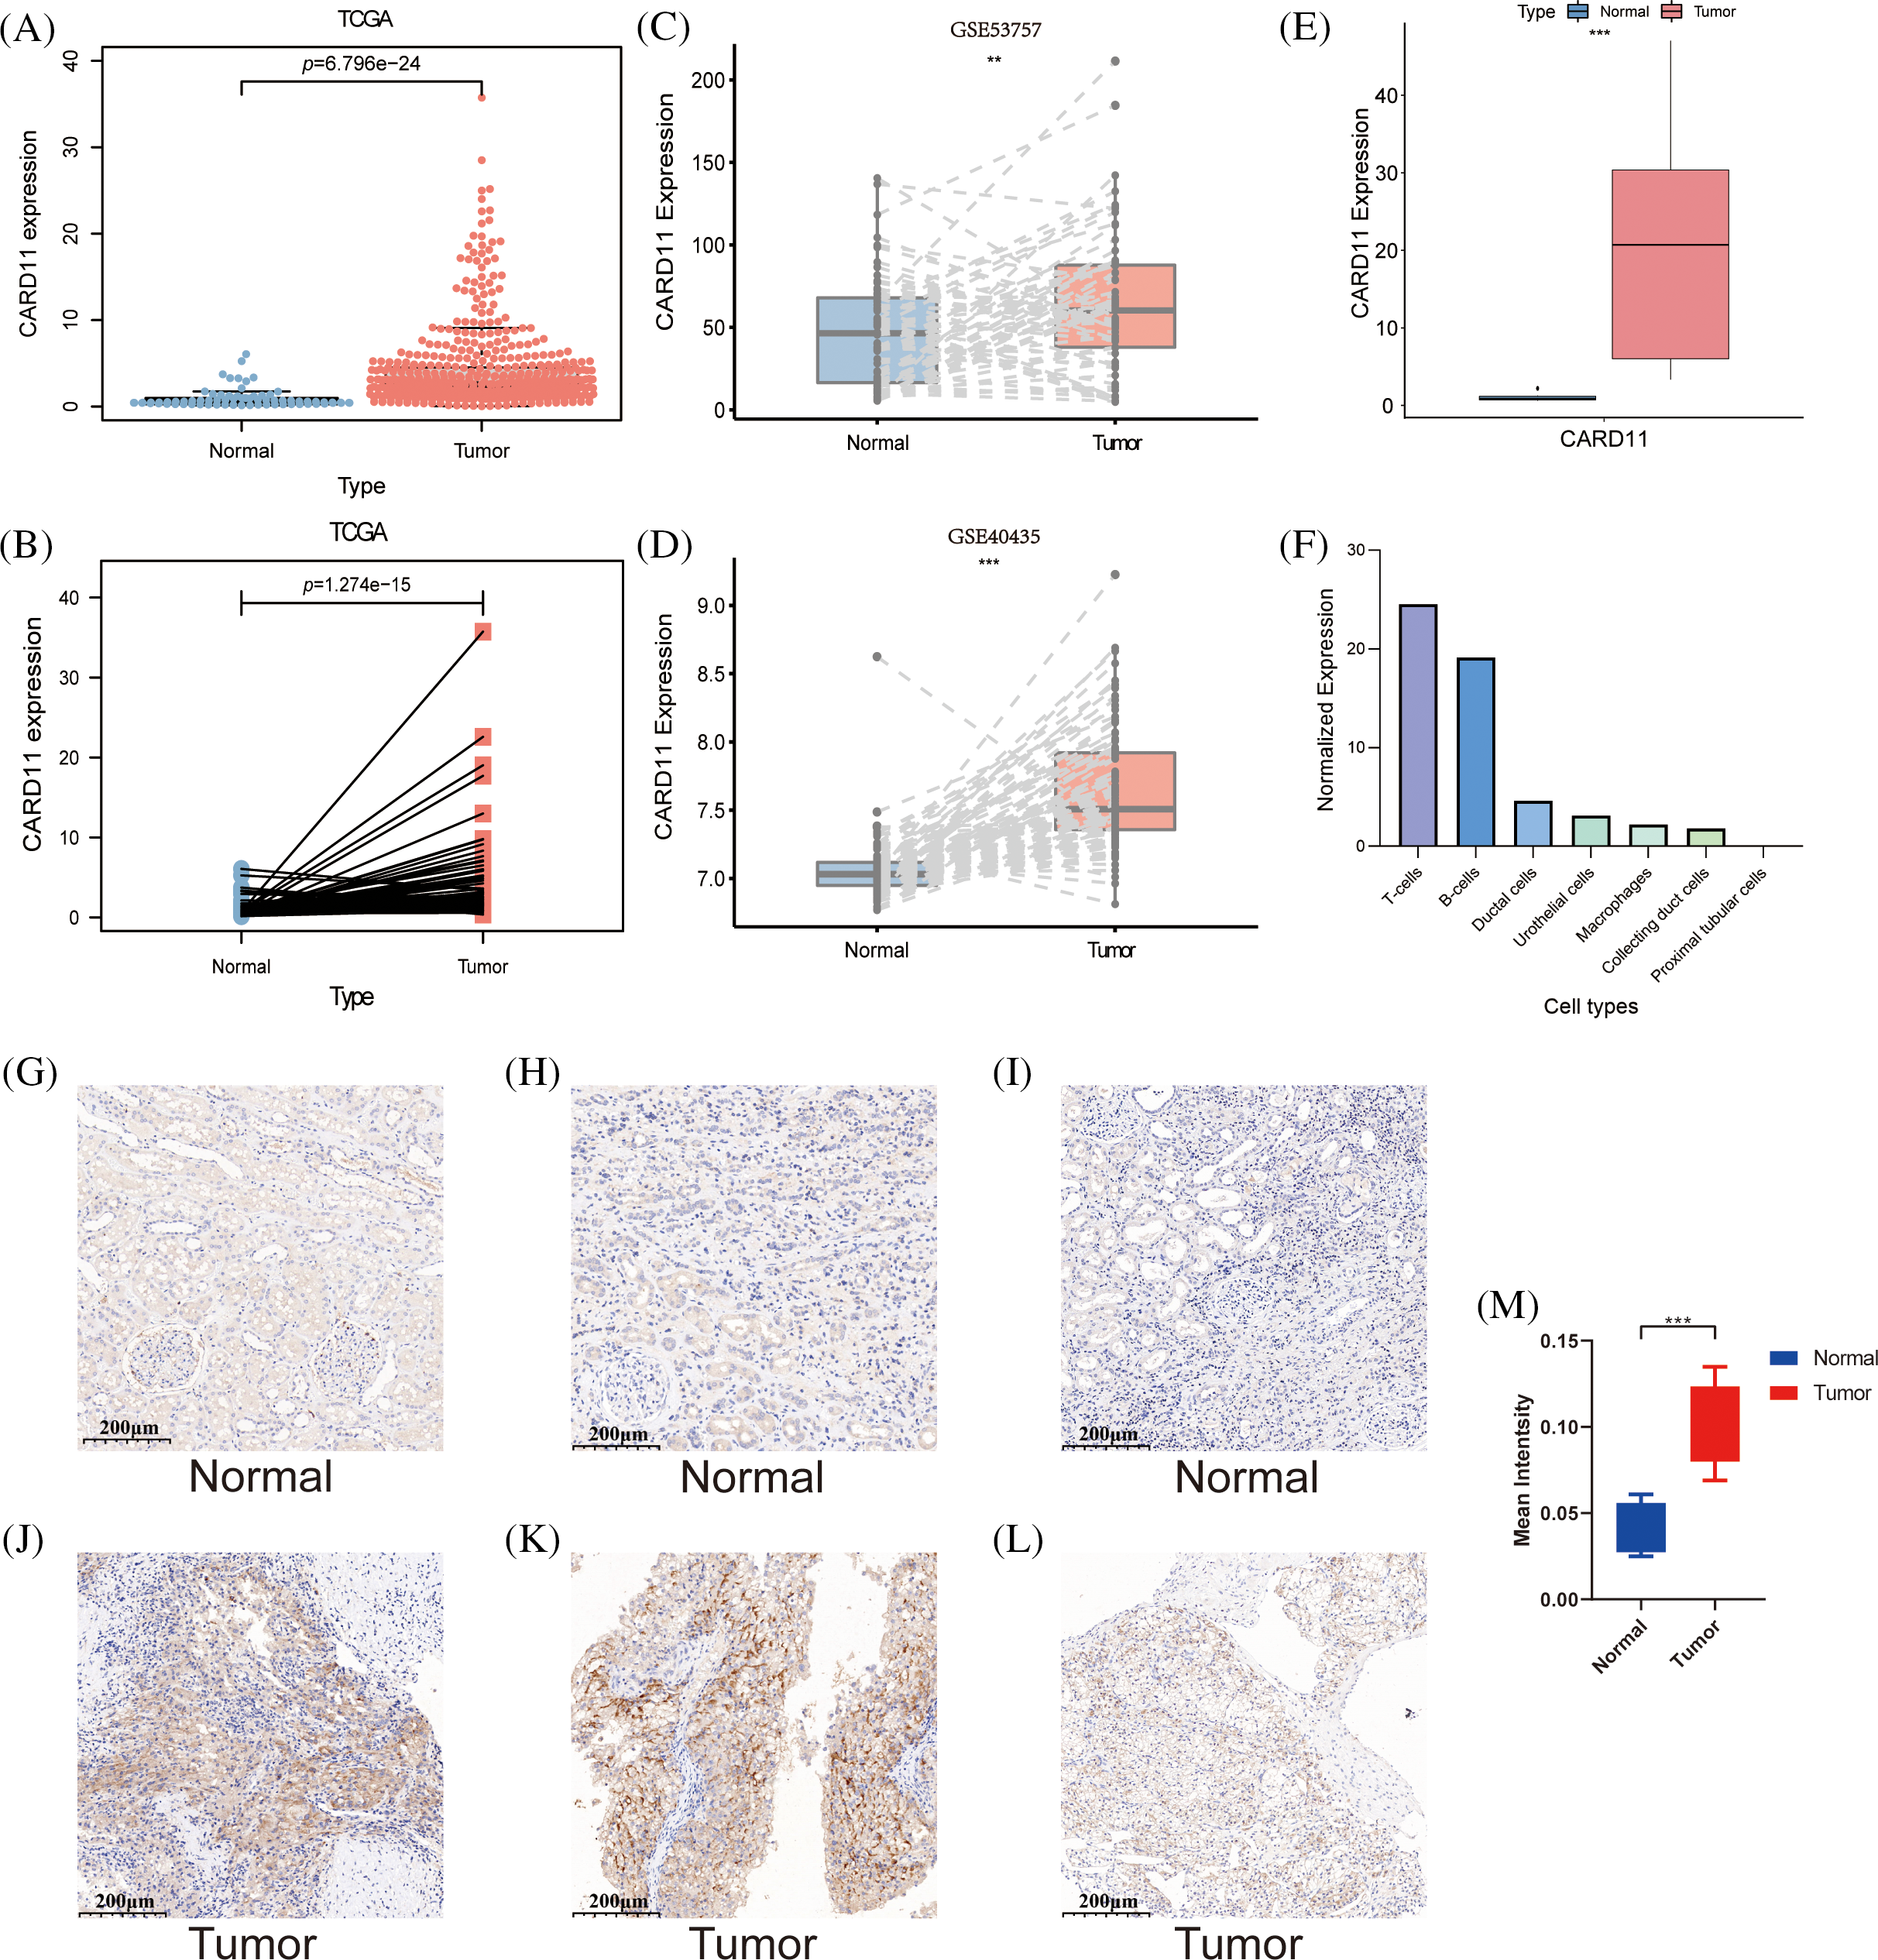
Figure 1: The expression of CARD11 was upregulated at both transcription and protein levels. (A–E) The RNA expression level of CARD11 was found to be elevated in tumor tissue relative to adjacent normal tissue across multiple cohorts, including TCGA, GSE53757, GSE40435, and our data. (F) In normal kidney tissue, CARD11 demonstrated predominant expression in T cells and B cells rather than proximal tubular cells. (G–L) CARD11 is highly expressed in ccRCC tumor tissue compared to normal kidney tissue. (M) The mean intensity of IHC results from normal and tumor tissue. **p < 0.01; ***p < 0.001.
Upregulated CARD11 is correlated with a poor prognosis of ccRCC
Given the notable upregulation of CARD11 in ccRCC, it is imperative to investigate its correlation with clinical features of ccRCC patients. Analysis of CARD11 expression based on different clinical features revealed associations with sex, Fuhrman grade, AJCC stage, T stage, N stage, and M stage. Specifically, male patients exhibited higher levels of CARD11 expression compared to female patients. Moreover, increased expression of CARD11 was observed in patients with high-grade tumors and advanced stages. Additionally, elevated CARD11 expression was detected in patients with higher T stages as well as those presenting lymph node metastasis or distant metastasis (Figs. 2A–2F). Furthermore, prognosis analysis in ccRCC patients from TCGA demonstrated a strong association between upregulated CARD11 expression and shorter OS and DFS rates (Figs. 2G and 2H). Collectively, these findings unequivocally indicate that heightened CARD11 expression is closely linked to poor prognosis in ccRCC.
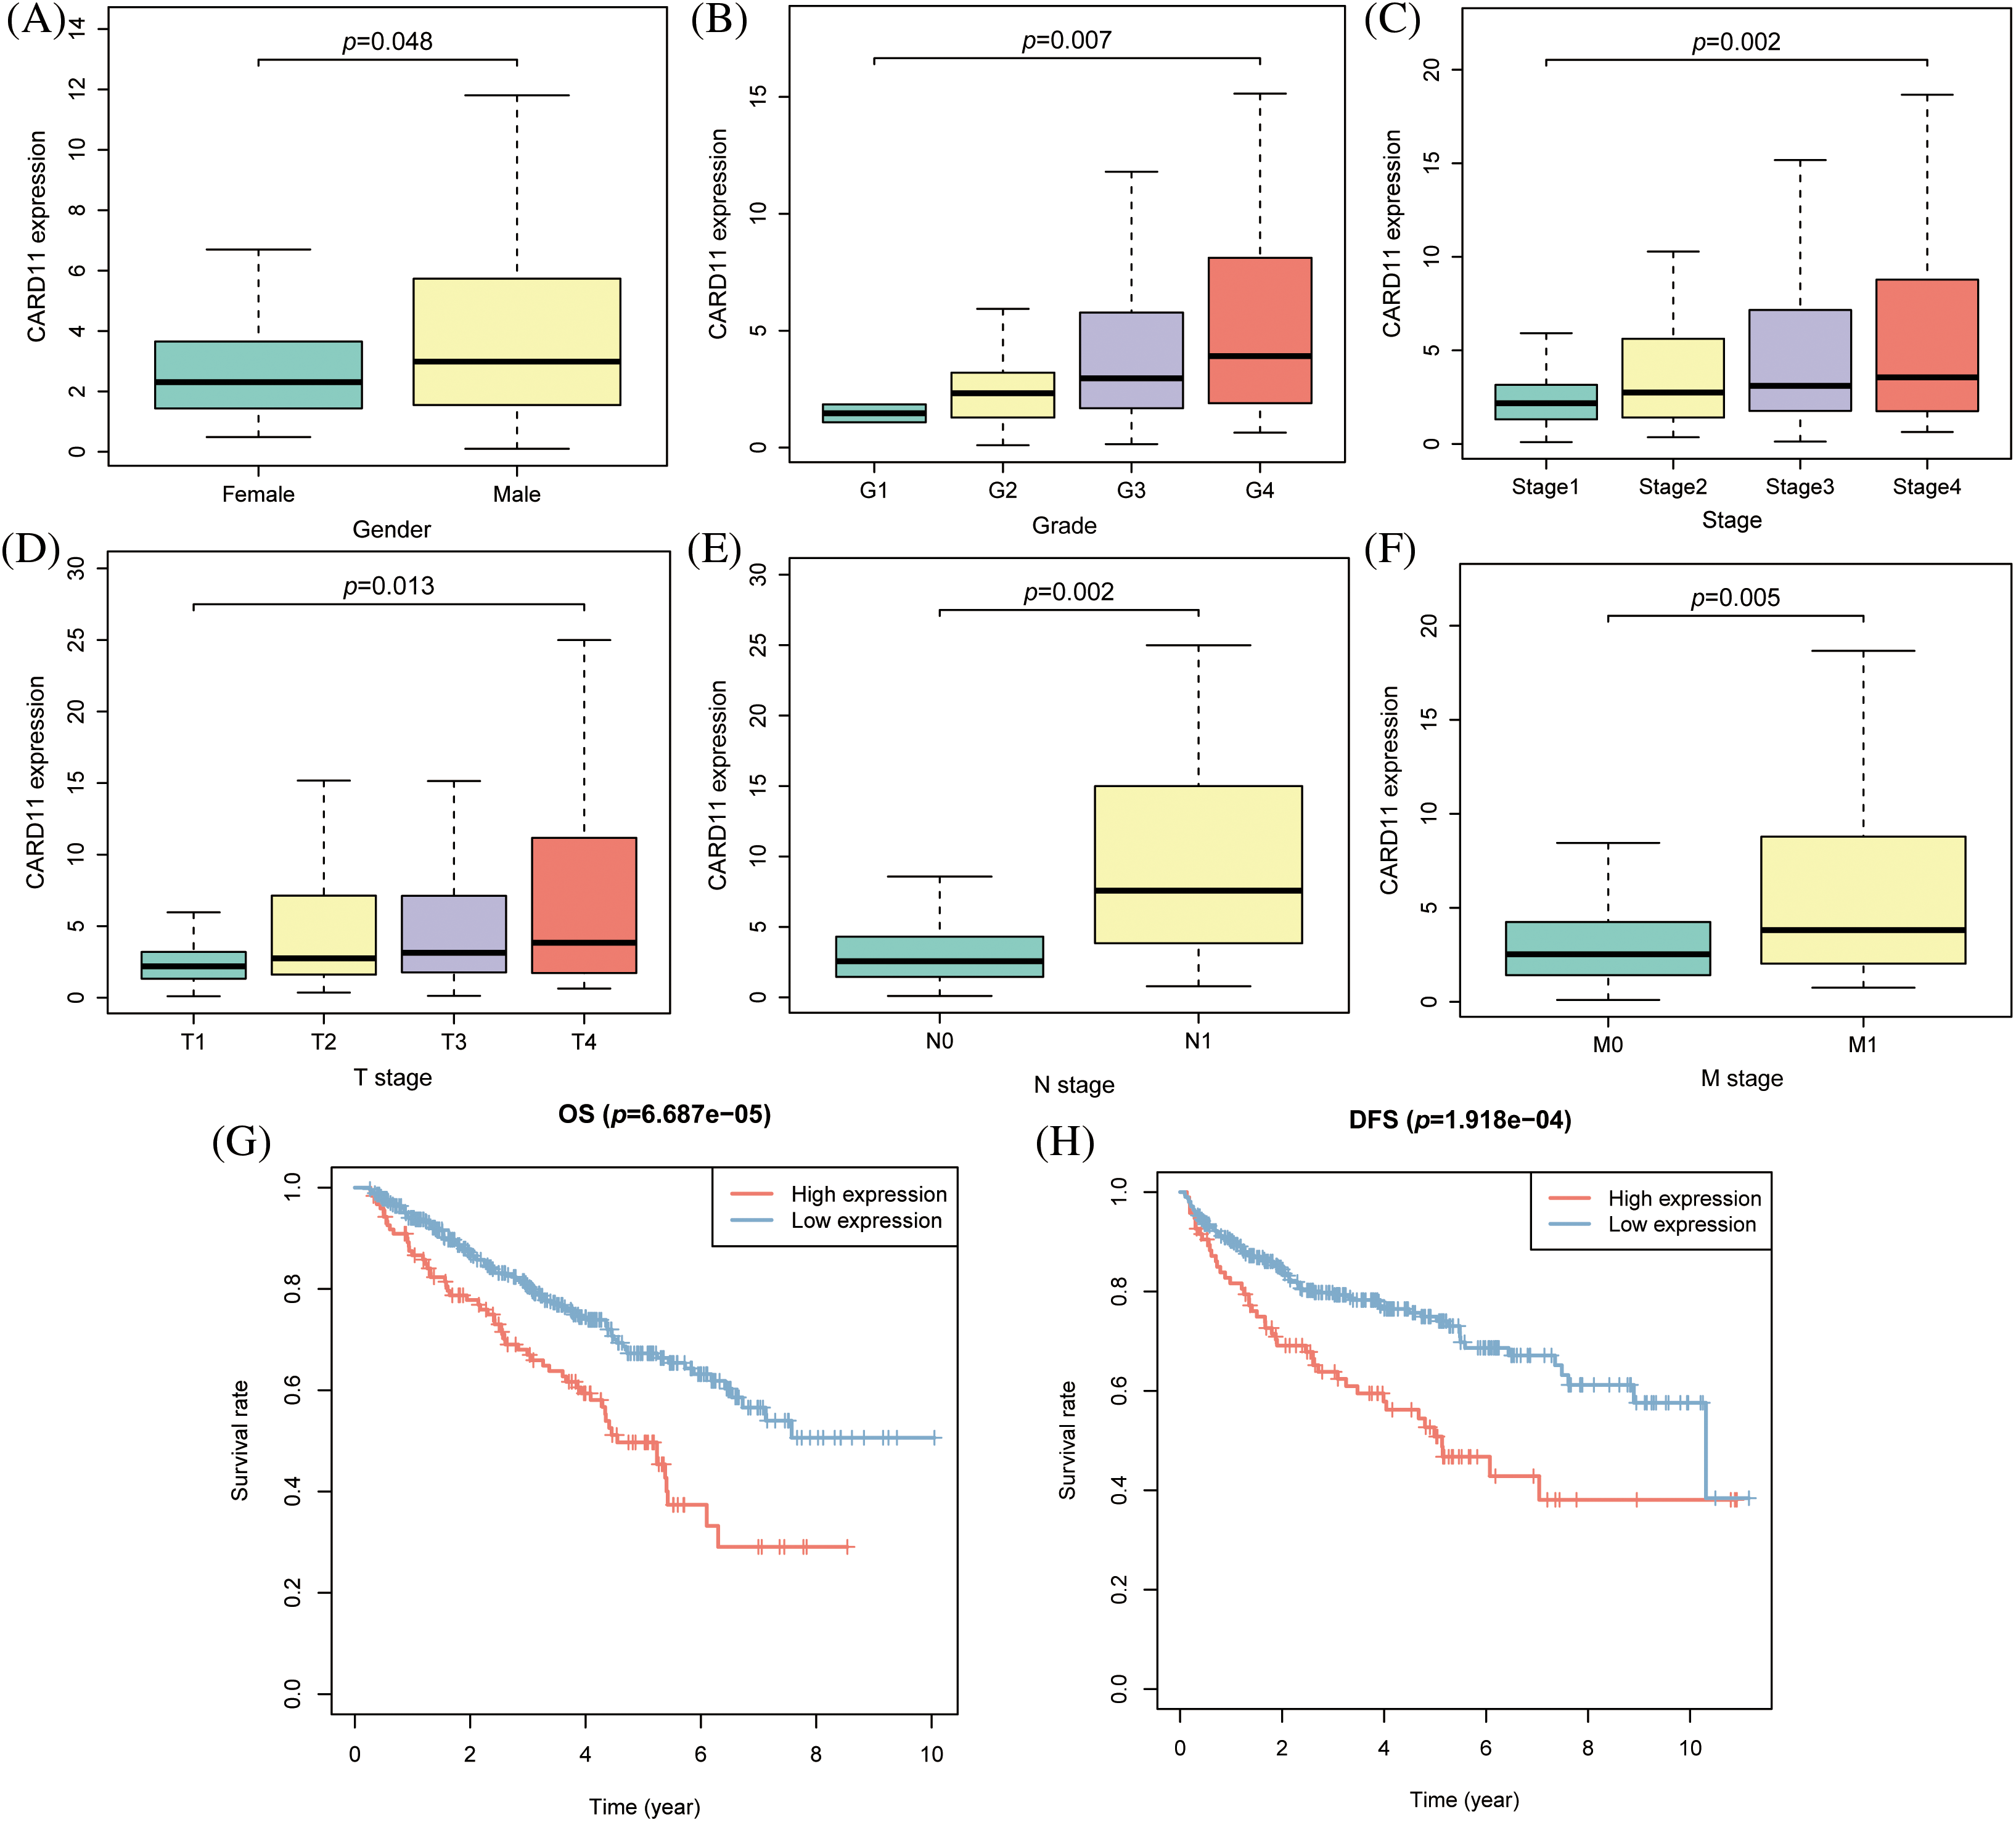
Figure 2: The clinical significance of CARD11 expression in ccRCC. (A) Male patients exhibited a higher level of CARD11 expression compared to female patients. (B–F) Patients with elevated Fuhrman grade, AJCC stage, T stage, N stage, and M stage demonstrated increased levels of CARD11 expression. (G and H) Elevated CARD11 expression was associated with shorter OS and DFS in patients.
CARD11 expression in ccRCC is modified by body methylation
To elucidate the epigenomic modification of CARD11 in ccRCC, we employed web tools to investigate its expression. According to the findings from EWAS Atlas, CARD11 expression was negatively correlated with promoter methylation level (r = −0.2627, p < 0.0001, Fig. 3A) and positively correlated with body methylation level (r = 0.5755, p < 0.0001, Fig. 3C) in ccRCC. However, the promoter methylation level failed to distinguish OS among ccRCC patients; conversely, those with high body methylation levels exhibited significantly shorter OS compared to those with low body methylation levels (Figs. 3B and 3D). Subsequently, we identified 14 prognostic CpG islands that displayed an association with increased CARD11 expression (Fig. 3E). Apart from methylation, we also explored the CNV and mutation status of CARD11 in ccRCC. Data from cBioPortal demonstrated that only 1.8% of the CARD11 gene experienced alteration. Notably, CNV gain events were predominantly detected and correlated with higher CARD11 expression in ccRCC samples analyzed (Fig. 3F). Furthermore, a small proportion of mutations were observed within the CARD11 gene in ccRCC cases; however, the majority of these mutations were missense mutations which had no discernible effect on altering CARD11 expression (Fig. 3G). Nevertheless, the presence of CNV gain for CARD11 did not exert any significant impact on OS among ccRCC patients (Fig. 3H). In conclusion, it can be inferred that body methylation plays a substantial role in influencing the expression of CARD11 in ccRCC.
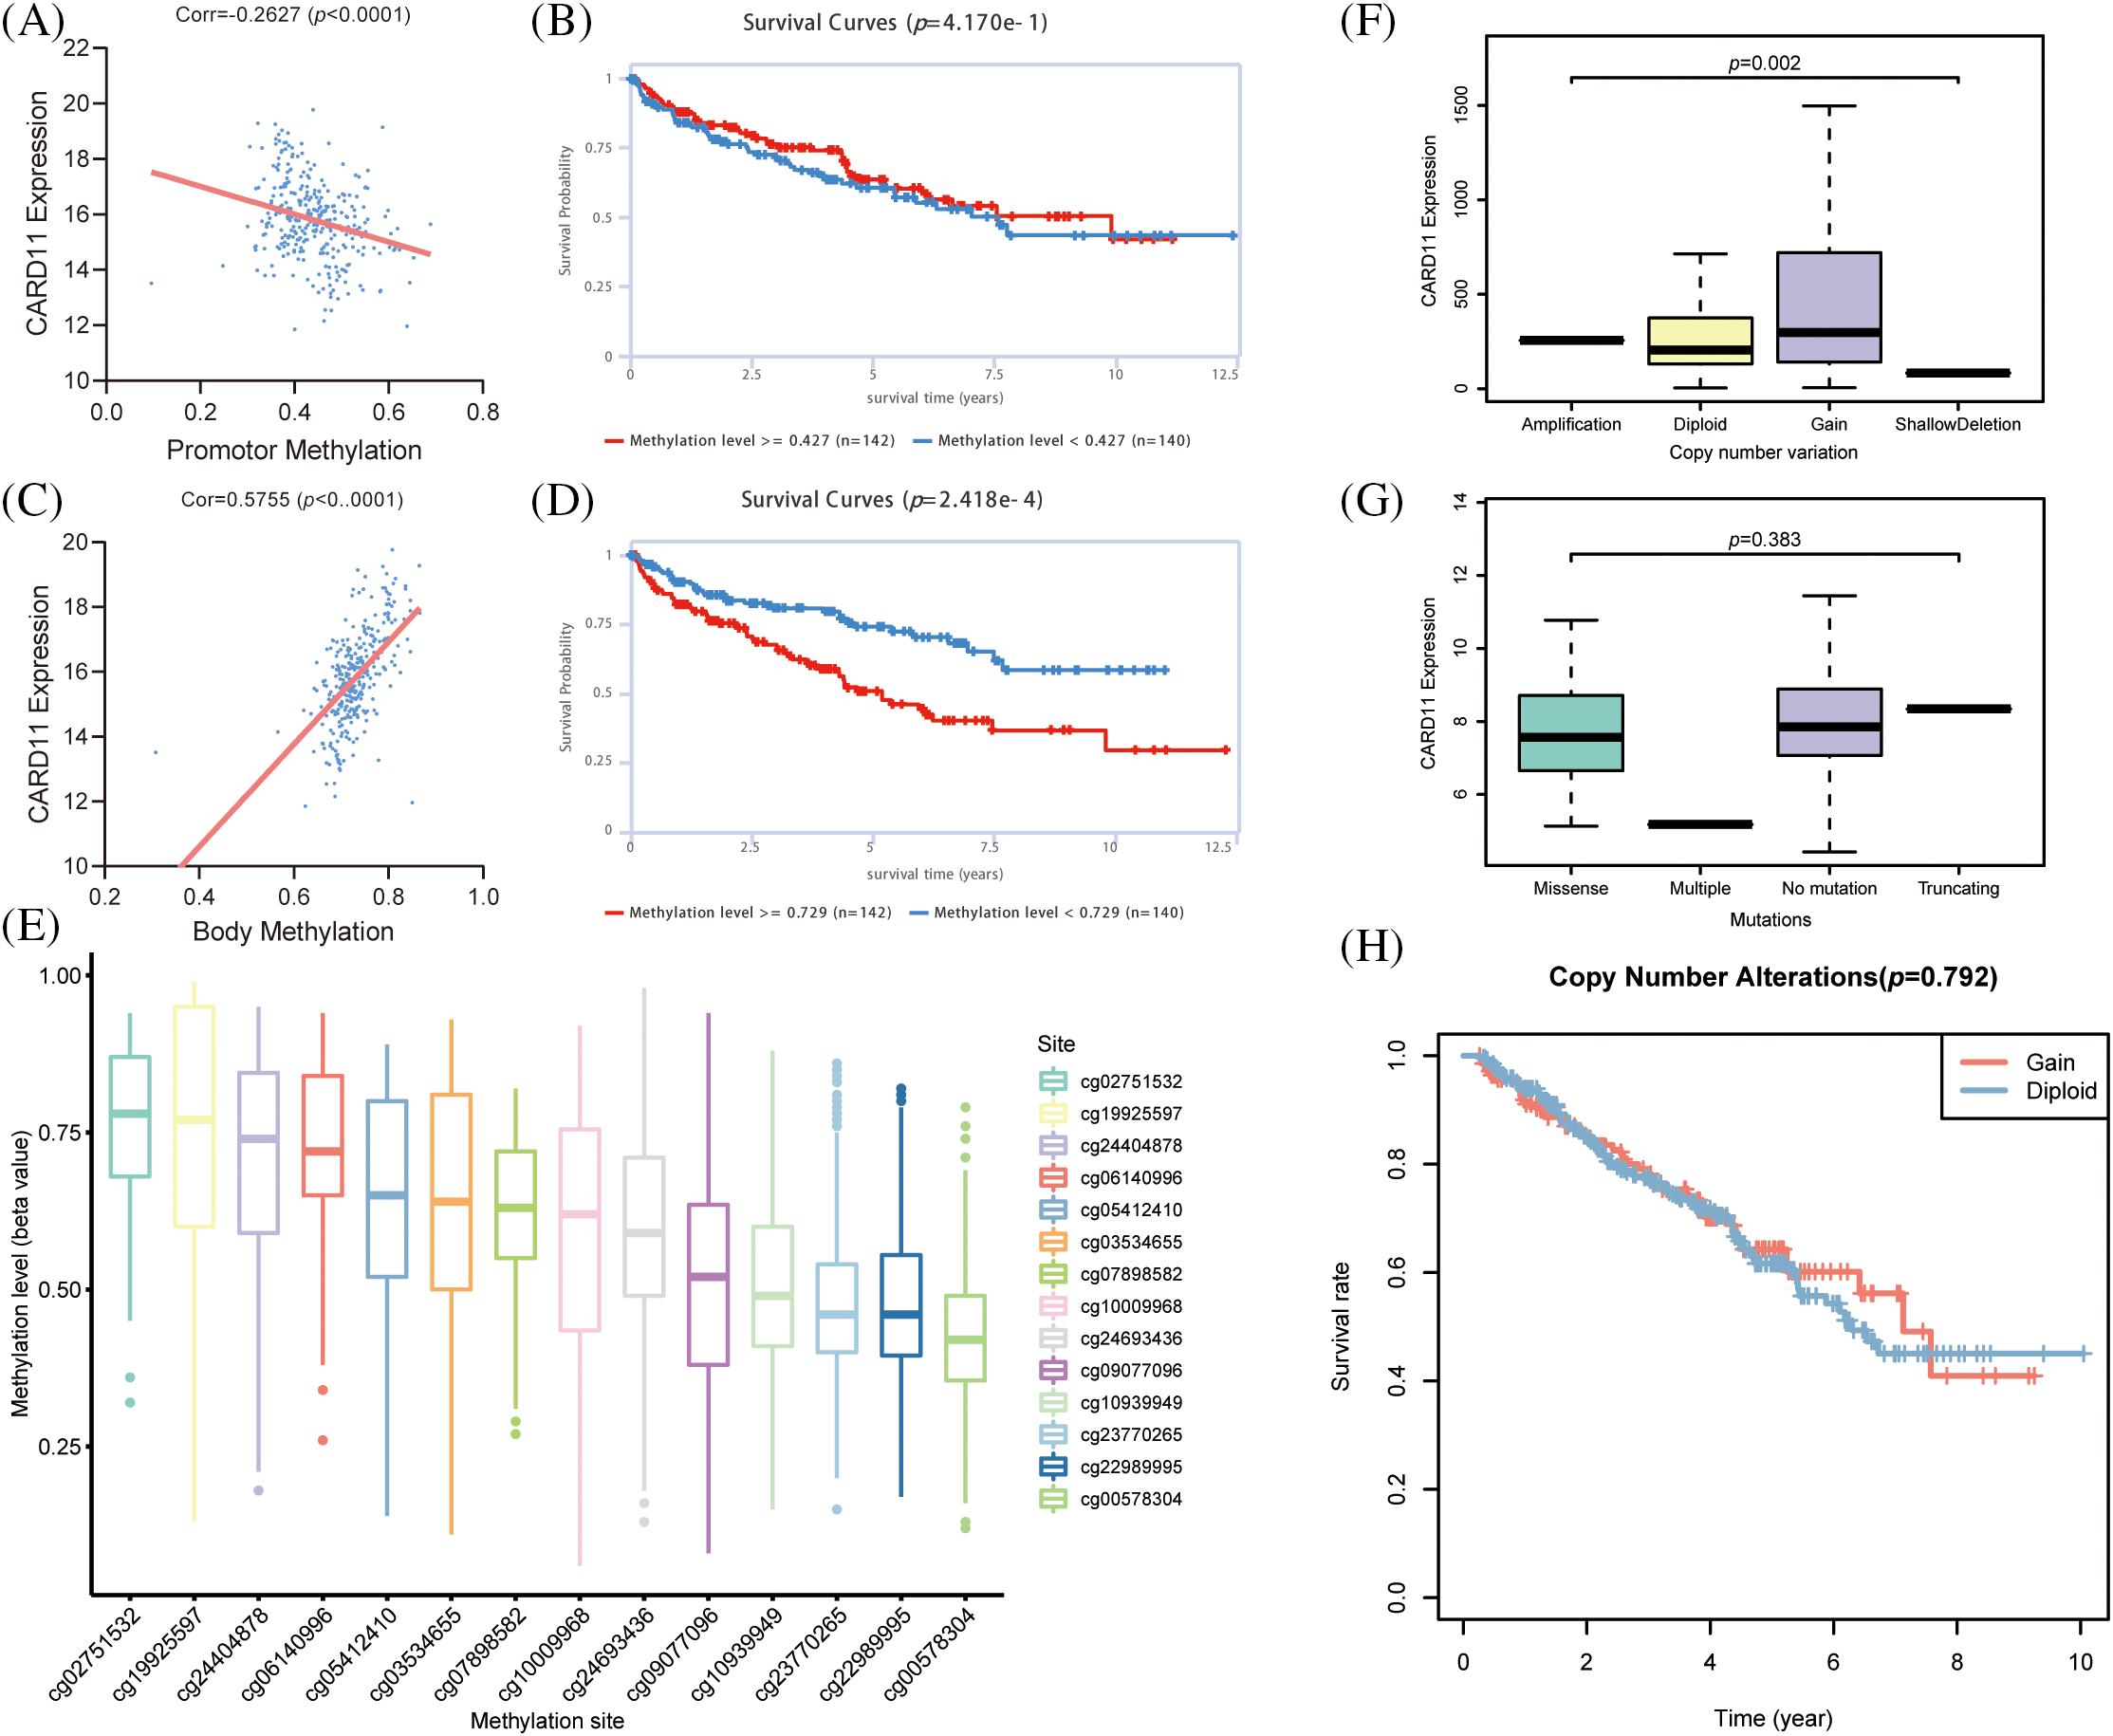
Figure 3: The epigenomic modification of CARD11 expression in ccRCC. (A) The promoter methylation level of CARD11 exhibited a negative correlation with its expression level. (B) The promoter methylation level of CARD11 did not show discriminatory ability for overall survival (OS) prediction in ccRCC patients. (C) There was a positive correlation between the body methylation level of CARD11 and its expression level. (D) Patients with high body methylation levels of CARD11 had shorter OS survival compared to those with low body methylation levels. (E) The study investigated the methylation status of 14 CpG islands on the CARD11 gene. (F) CNV gain was identified as the predominant CNV change in the CARD11 gene, which was associated with higher expression levels compared to those without CNV changes. (G) Missense mutations were found to be the major type of mutation in the CARD11 gene, and these mutations did not significantly alter its expression levels. (H) The CNV gain of CARD11 did not have a statistically significant impact on the OS of ccRCC patients.
CARD11 expression is correlated with immune cell reserve in the microenvironment of ccRCC
Concerning the crucial role of immune cells in the TME, we calculated the immune scores of the ccRCC samples from the TCGA cohort and correlated them with CARD11 expression. It is demonstrated that CARD11 expression owns a significantly positive relationship with the immune score in ccRCC (r = 0.499, p < 0.0001). Subsequently, CARD11 expression was further analyzed with infiltrating immune cells estimated through ssGSEA algorithm, revealing that upregulated CARD11 expression was correlated with higher infiltration of several protective immune cells, including type 1 T helper cell (Th1, r = 0.604, p < 0.001), activated CD4 T cell (r = 0.578, p < 0.001), T follicular helper cell (Tfh, r = 0.572, p < 0.001), activated CD8 T cell (r = 0.564, p < 0.001), immature B cell (r = 0.553, p < 0.001) and activated B cell (r = 0.543, p < 0.001). Meanwhile, several APCs (r = 0.491, natural killer cell r = 0.475, and macrophage r = 0.455, p < 0.001) were revealed to be positively related to CARD11 expression. However, a notable correlation was also identified between inhibitory immune cells (myeloid-derived suppressor cell, MDSC, r = 0.644; regulatory T cell, Treg, r = 0.52, p < 0.001) and CARD11 expression (Fig. 4A). Interestingly, in addition to the two inhibitory immune cells, helper T lymphocytes (activated CD4 T cell and Th1 cell) and APCs (macrophage and activated dendritic cell) were shown to possess a negative prognostic effect on ccRCC patients (Figs. 4D–4I). Further analysis demonstrated that CARD11 expression was involved in multiple immune functions encompassing both pro-inflammatory and inhibitory roles (Fig. 4B). There existed a strong correlation between CARD11 expression and T cell co-stimulation (r = 0.654, p < 0.001), as well as T cell co-inhibition (r = 0.592, p < 0.001). Subsequently, we investigated the involvement of CARD11 in the cancer-immunity cycle of ccRCC to determine its participation in specific steps of this cycle which comprises seven sequential events crucial for initiating and progressing anti-cancer immune responses [45]. The results indicated that samples with elevated CARD11 expression exhibited higher scores for cancer antigen release, cancer antigen presentation, immune cell priming, and activation processes. High levels of CARD11 expression were positively associated with increased recruitment of CD8+ T cells and Th1 cells along with enhanced recognition of cancer cells by the immune system (Fig. 4C). However, high- and low-expression groups showed similar scores for both T cell infiltration into tumor tissues as well as killing efficiency against cancer cells indicating that while CARD11 correlated significantly with the overall immune landscape of ccRCC including an increased reserve of immune cells it did not confer an enhanced ability to eliminate cancerous cells.
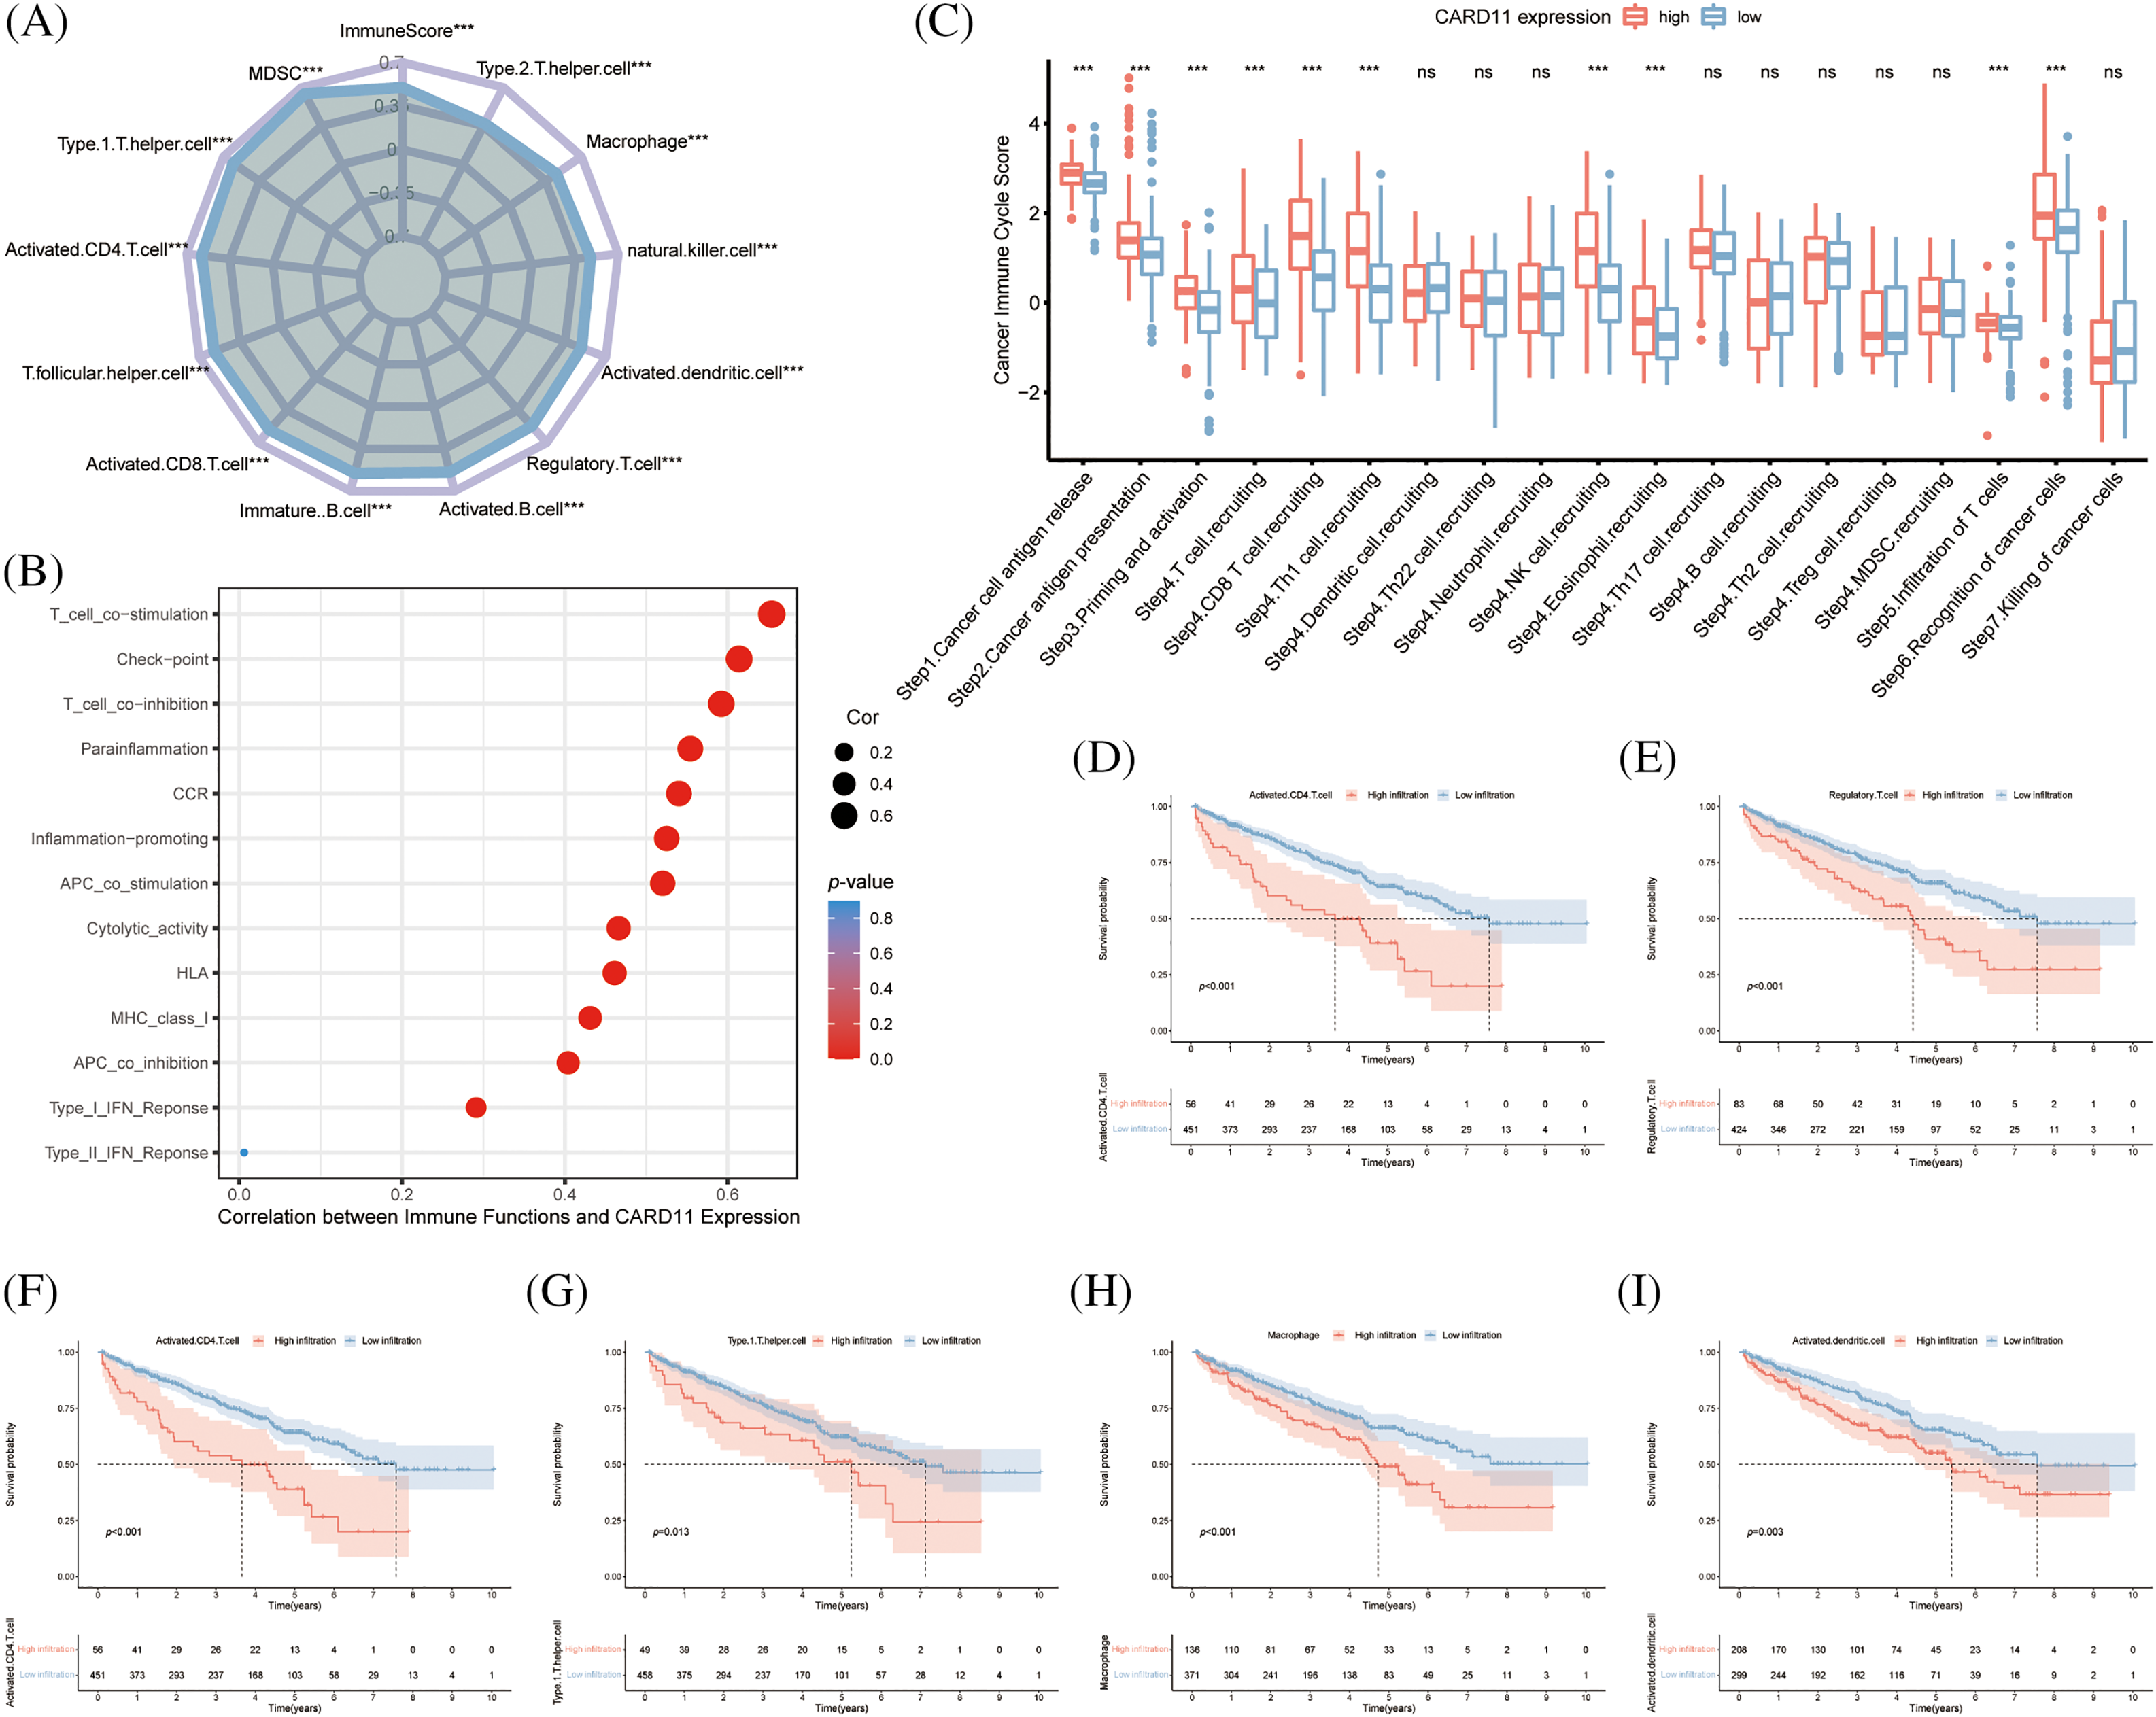
Figure 4: Analysis of the role of CARD11 in the immune microenvironment of ccRCC. (A) Upregulated expression of CARD11 exhibited a positive correlation with the infiltration of multiple immune cell subsets in ccRCC. (B) CARD11 was implicated in a multitude of immunological functions within the context of ccRCC. (C) Patients displaying divergent levels of CARD11 expression demonstrated significant disparities across various stages encompassing the cancer immune cycle. (D–I) Enhanced infiltration by MDSC, Tregs, activated CD4 T cells, type 1 T helper cells, macrophages, and activated dendritic cells were associated with reduced overall survival among patients diagnosed with ccRCC. Ns, non-significant; ***p < 0.001.
CARD11 expression is correlated with the drug response of ccRCC patients
The majority of the patients exhibiting upregulated CARD11 expression demonstrated elevated level of immune checkpoint inhibitors, including CD86, LAG3, LAIR1, PVR, CD80, CTLA4, PD-1, TIGIT, CD200R1, CD276, and BTLA (Fig. 5A). Conversely, decreased expression of KIR3DL1 and ADORA2A were presented in the high CARD11 expression group. Subsequently, a scoring system called immunophenoscore (IPS) was introduced from TCIA to depict the immune landscape and especially the response to ICIs [46]. High IPS scores were indicative of improved responses towards immunotherapies; notably, patients with upregulated CARD11 expression exhibited higher IPS scores in response to PD-1 blockade therapy alone or in combination with CTLA-4 blockade therapy (Fig. 5B). Furthermore, data obtained from TIDE revealed a positive correlation between CARD11 expression and cytotoxic T lymphocyte (CTL) level (Figs. 5C and 5D), which are considered positive markers for the response of ICIs [47].
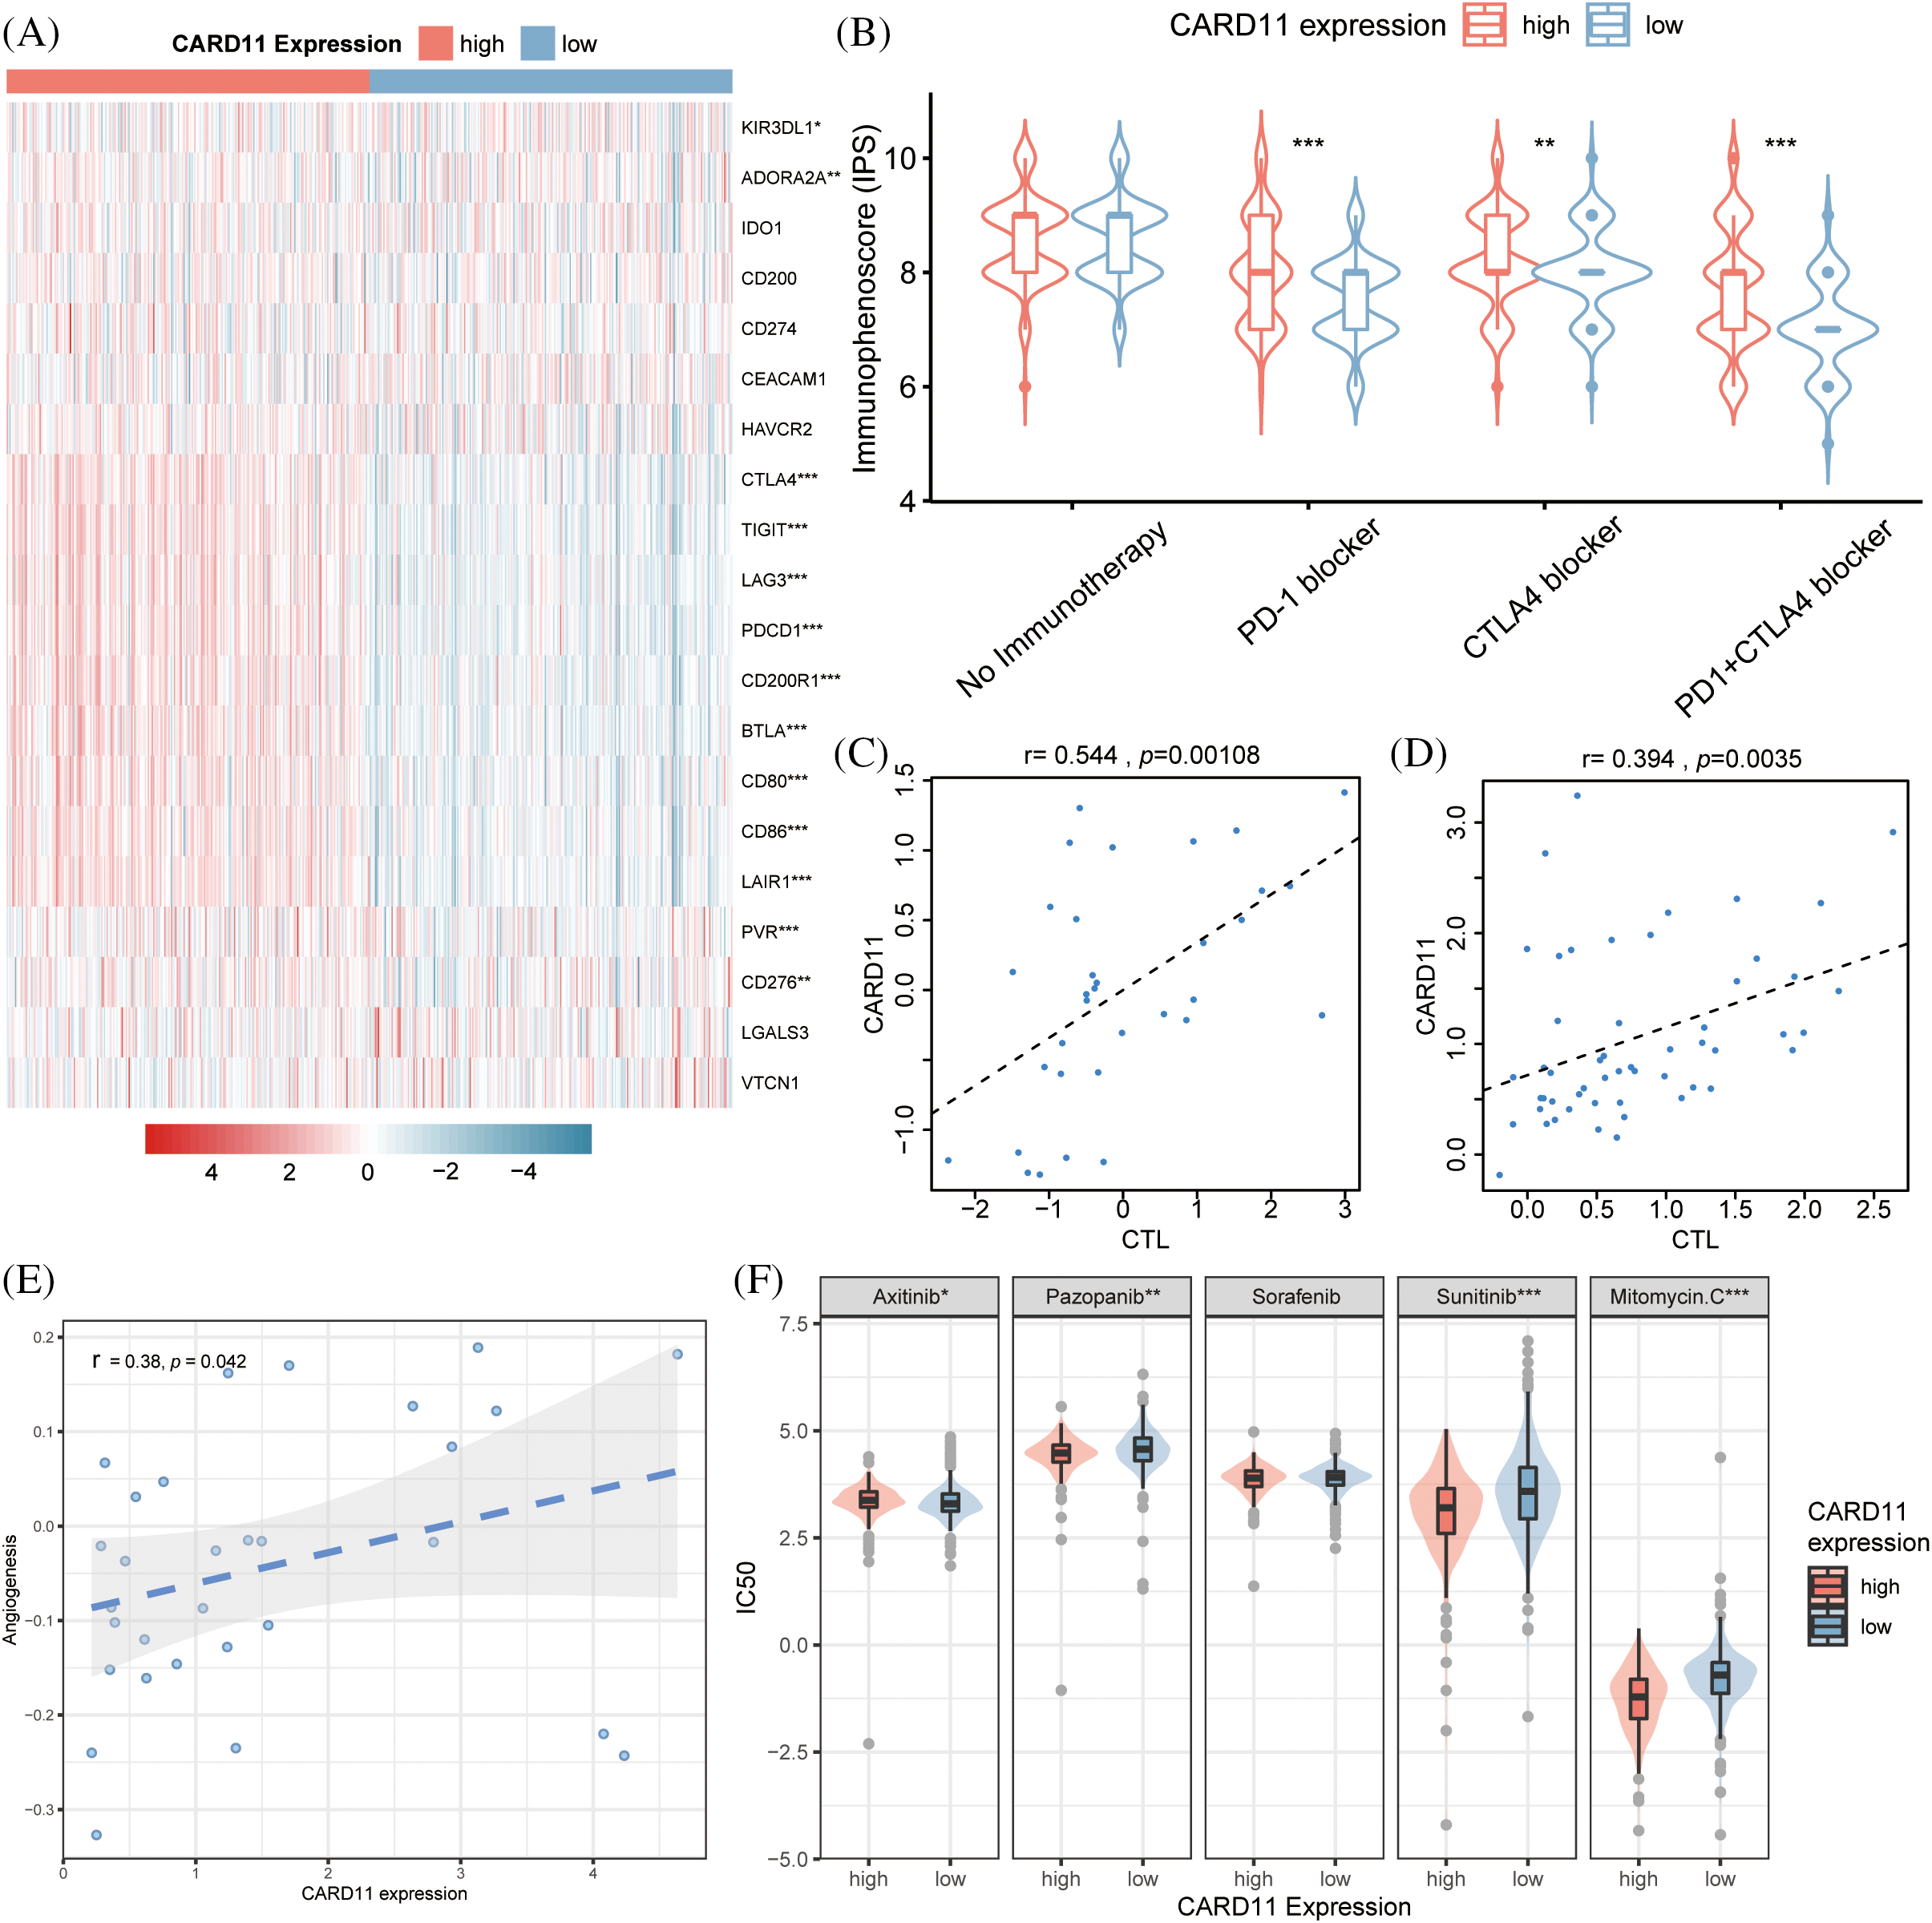
Figure 5: Analysis of the drug response in different CARD11 expression groups. (A) The difference in inhibitory checkpoint expression between high and low CARD11 expression groups. (B) The high CARD11 expression group had a significantly higher IPS toward PD-1 blocker, CTLA4 blocker, and PD-1 + CTLA4 blocker than those in the low CARD11 expression group. (C and D) There was a positive correlation between the expression level of CARD11 and the response to immune checkpoint inhibitors in two separate trials. (E) A positive association was found between CARD11 expression and the angiogenesis score of renal cell carcinoma. (F) High CARD11 expression resulted in decreased half maximal inhibitory concentration (IC50) to Sunitinib, Pazopanib, and Mitomycin C but had increased IC50 to Axitinib. *p < 0.05; **p < 0.01; ***p < 0.001.
Moreover, according to the scRNA-seq analysis results from CancerSEA, CARD11 expression was positively related to the angiogenesis of RCC (r = 0.38, p < 0.05, Fig. 5E). In light of this finding, we investigated the response of different CARD11 expression groups to four FDA-approved VEGF-targeted drugs, Sorafenib, Sunitinib, Pazopanib, and Axitinib. Patients with upregulated CARD11 expression exhibited increased sensitivity to Sunitinib and Pazopanib but decreased sensitivity toward Axitinib (Fig. 5F). There was no significant difference in the sensitivity to Sorafenib between high and low CARD11 expression groups. Additionally, Mitomycin C, another drug that is proven to be effective in ccRCC, was revealed to be more effective in the high CARD11 expression group. Therefore, CARD11 may have a great effect on both the immunotherapies and targeted therapies of ccRCC patients.
Enrichment functions of CARD11 in ccRCC
Further analysis using GSEA revealed the enrichment functions of CARD11 in ccRCC, including adaptive immune response, regulation of lymphocyte cell-cell adhesion, and regulation of T cell activation and differentiation (Fig. 6A). Moreover, results obtained from KEGG gene sets indicated that CARD11 was associated with antigen processing and presentation, chemokine signaling pathway, B cells, T cells receptor signaling pathway, cytokine-cytokine receptor interaction, and toll-like receptor signaling pathway (Fig. 6B). Using TISIDB database helped to obtain the relationship between CARD11 expression and specific chemokines (Fig. 6C) as well as receptors (Fig. 6D). Chemokines C-C motif chemokine ligand 4 (CCL4, r = 0.543), CCL5 (r = 0.564), C-X-C motif chemokine ligand 13 (CXCL13, r = 0.544), CXCL16 (r = 0.556) and X-C motif chemokine ligand 1 (XCL1, r = 0.545) showed relatively high correlation with CARD11 expression, while the top five correlated immune receptors were CCR5 (r = 0.647), C-X-C motif chemokine receptor 6 (CXCR6, r = 0.647), CXCR3 (r = 0.654), CCR8 (r = 0.594), and CCR1 (r = 0.535).
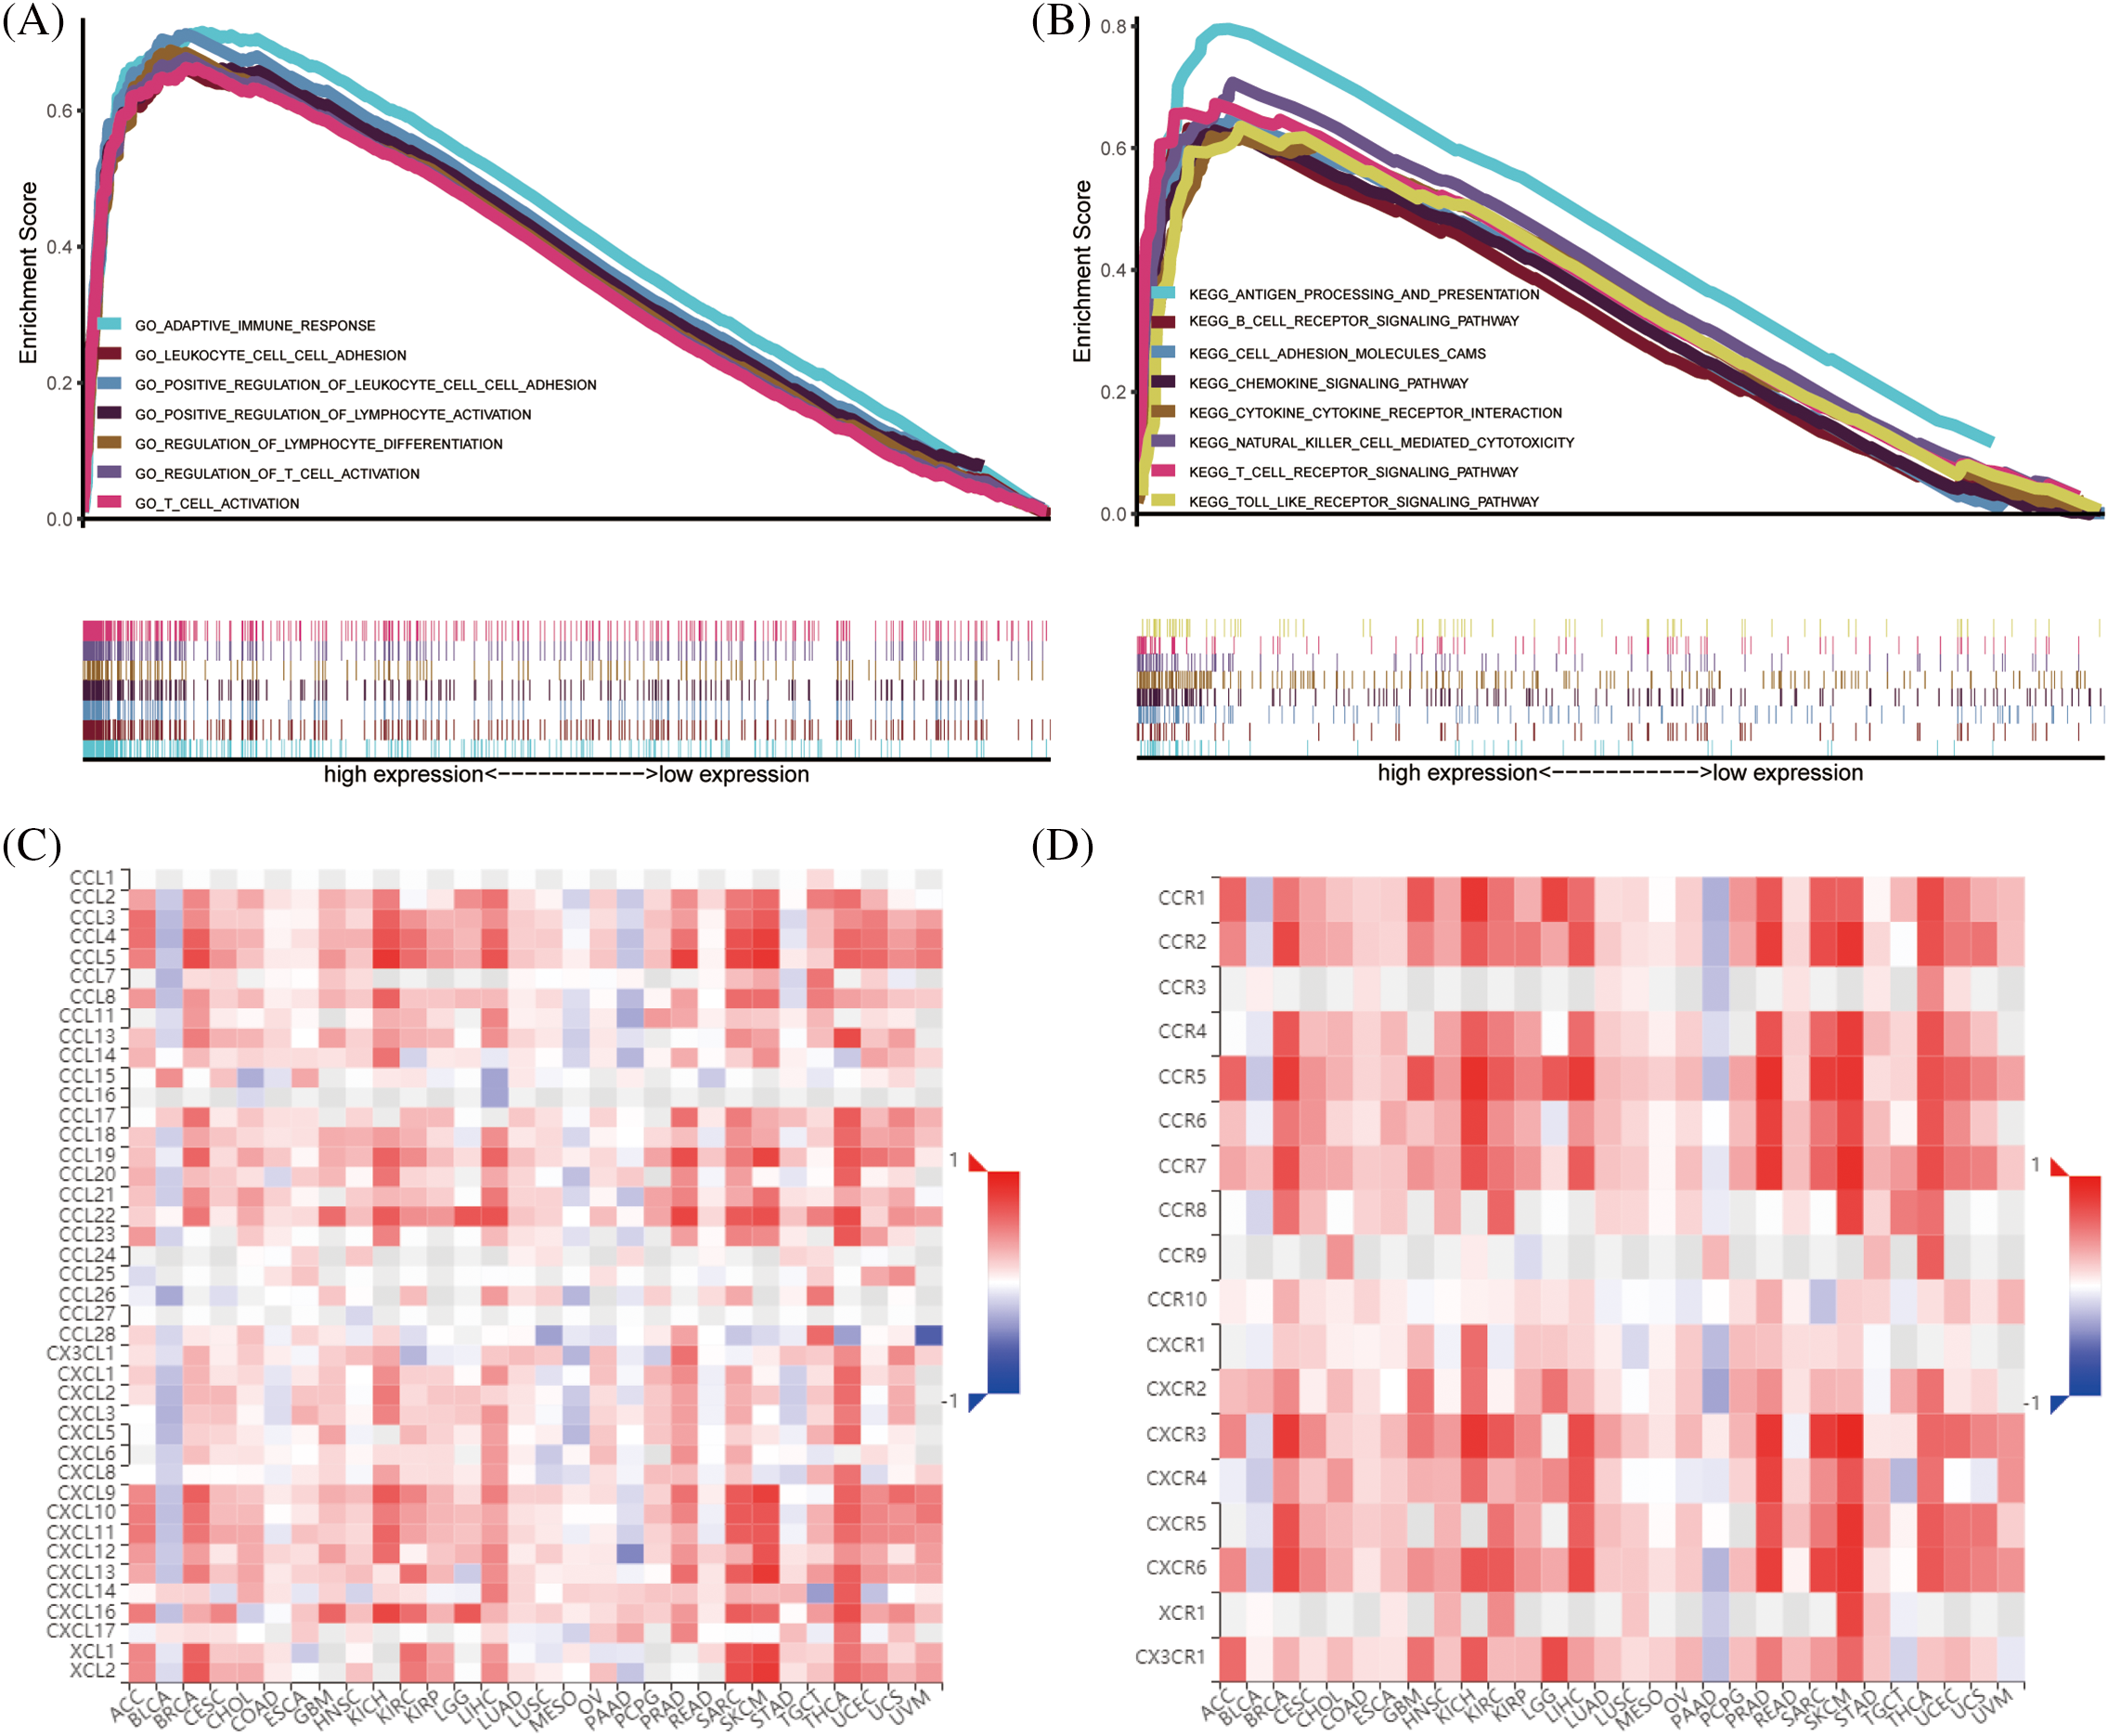
Figure 6: The enrichment functions of CARD11 in ccRCC. (A and B) The functional enrichment analysis results of CARD11 in ccRCC derived from GO and KEGG gene sets. (C and D) The correlation between CARD11 expression and immune chemokines and receptors in different cancer types.
The knockdown of CARD11 disrupts the malignant biological behavior of ccRCC cells in vitro
We conducted in vitro trials to investigate the role of CARD11 in ccRCC cells. Firstly, we examined the expression of CARD11 in both the normal tubular epithelial cell line (HK-II) and RCC cell line (Fig. 7A) and confirmed the knockdown efficiency of the shRNA sequence in 786-O and Caki-I cells (Figs. 7B and 7C). Subsequently, our phenotypic experiments revealed that knockdown of CARD11 significantly increased apoptosis rates in 786-O cells (Fig. 7D), which could be attributed to a significant reduction in the ratio of Bcl2/BAX (Fig. 7F), following a similar trend observed in Caki-I (Figs. 7E–7G). Furthermore, functional assays including CCK-8 assay (Figs. 7H and 7I), scratch assay (Figs. 8A and 8B), and transwell assay (Figs. 8C and 8D) demonstrated that CARD11 exerted a pronounced promoting effect on ccRCC cell proliferation, migration, and invasion abilities.
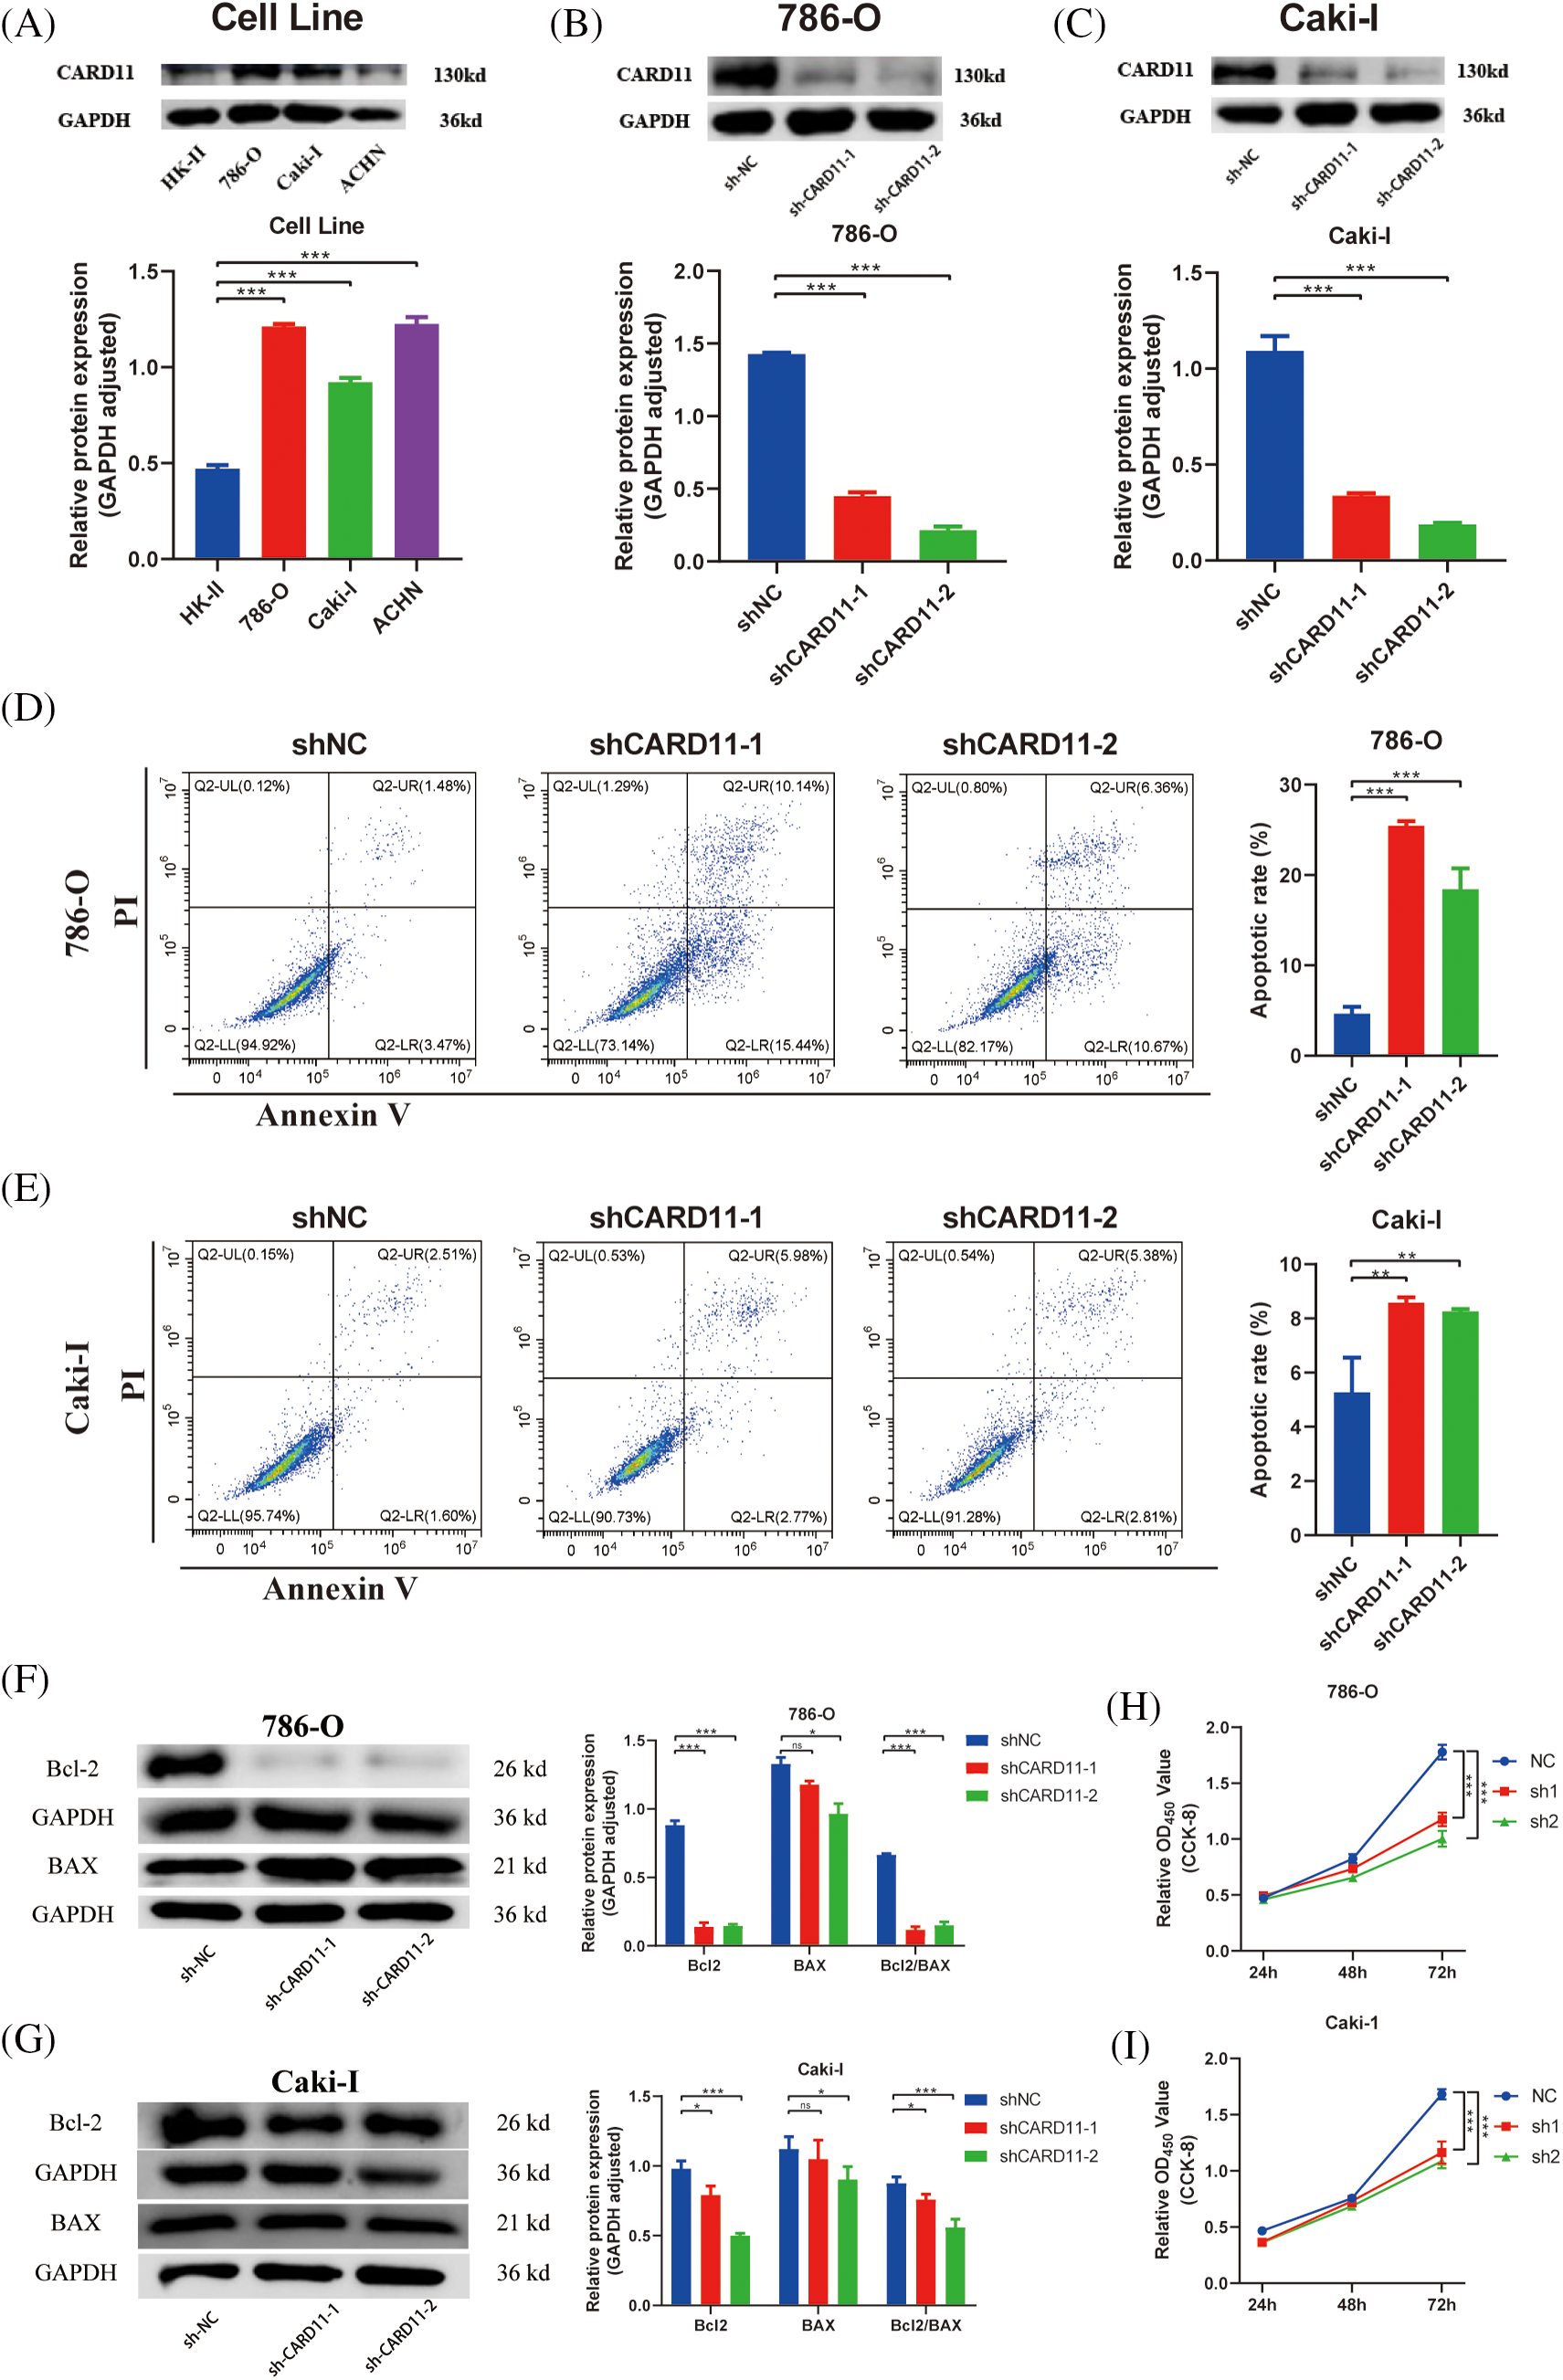
Figure 7: Knocking down the high expression of CARD11 in the ccRCC cell line can promote apoptosis and inhibit proliferation. (A) The expression of CARD11 in the ccRCC cell line was markedly elevated compared to that in HK-II. (B and C) The knockdown efficiency of shRNA sequences targeting CARD11 in 786-O and Caki-I. (D–G) WB and flow cytometry confirmed that the knockdown of CARD11 led to an increase of apoptosis. (H and I) The cck-8 assay is employed for quantifying cellular proliferation. n = 3, *p < 0.05; **p < 0.01; ***p < 0.001.
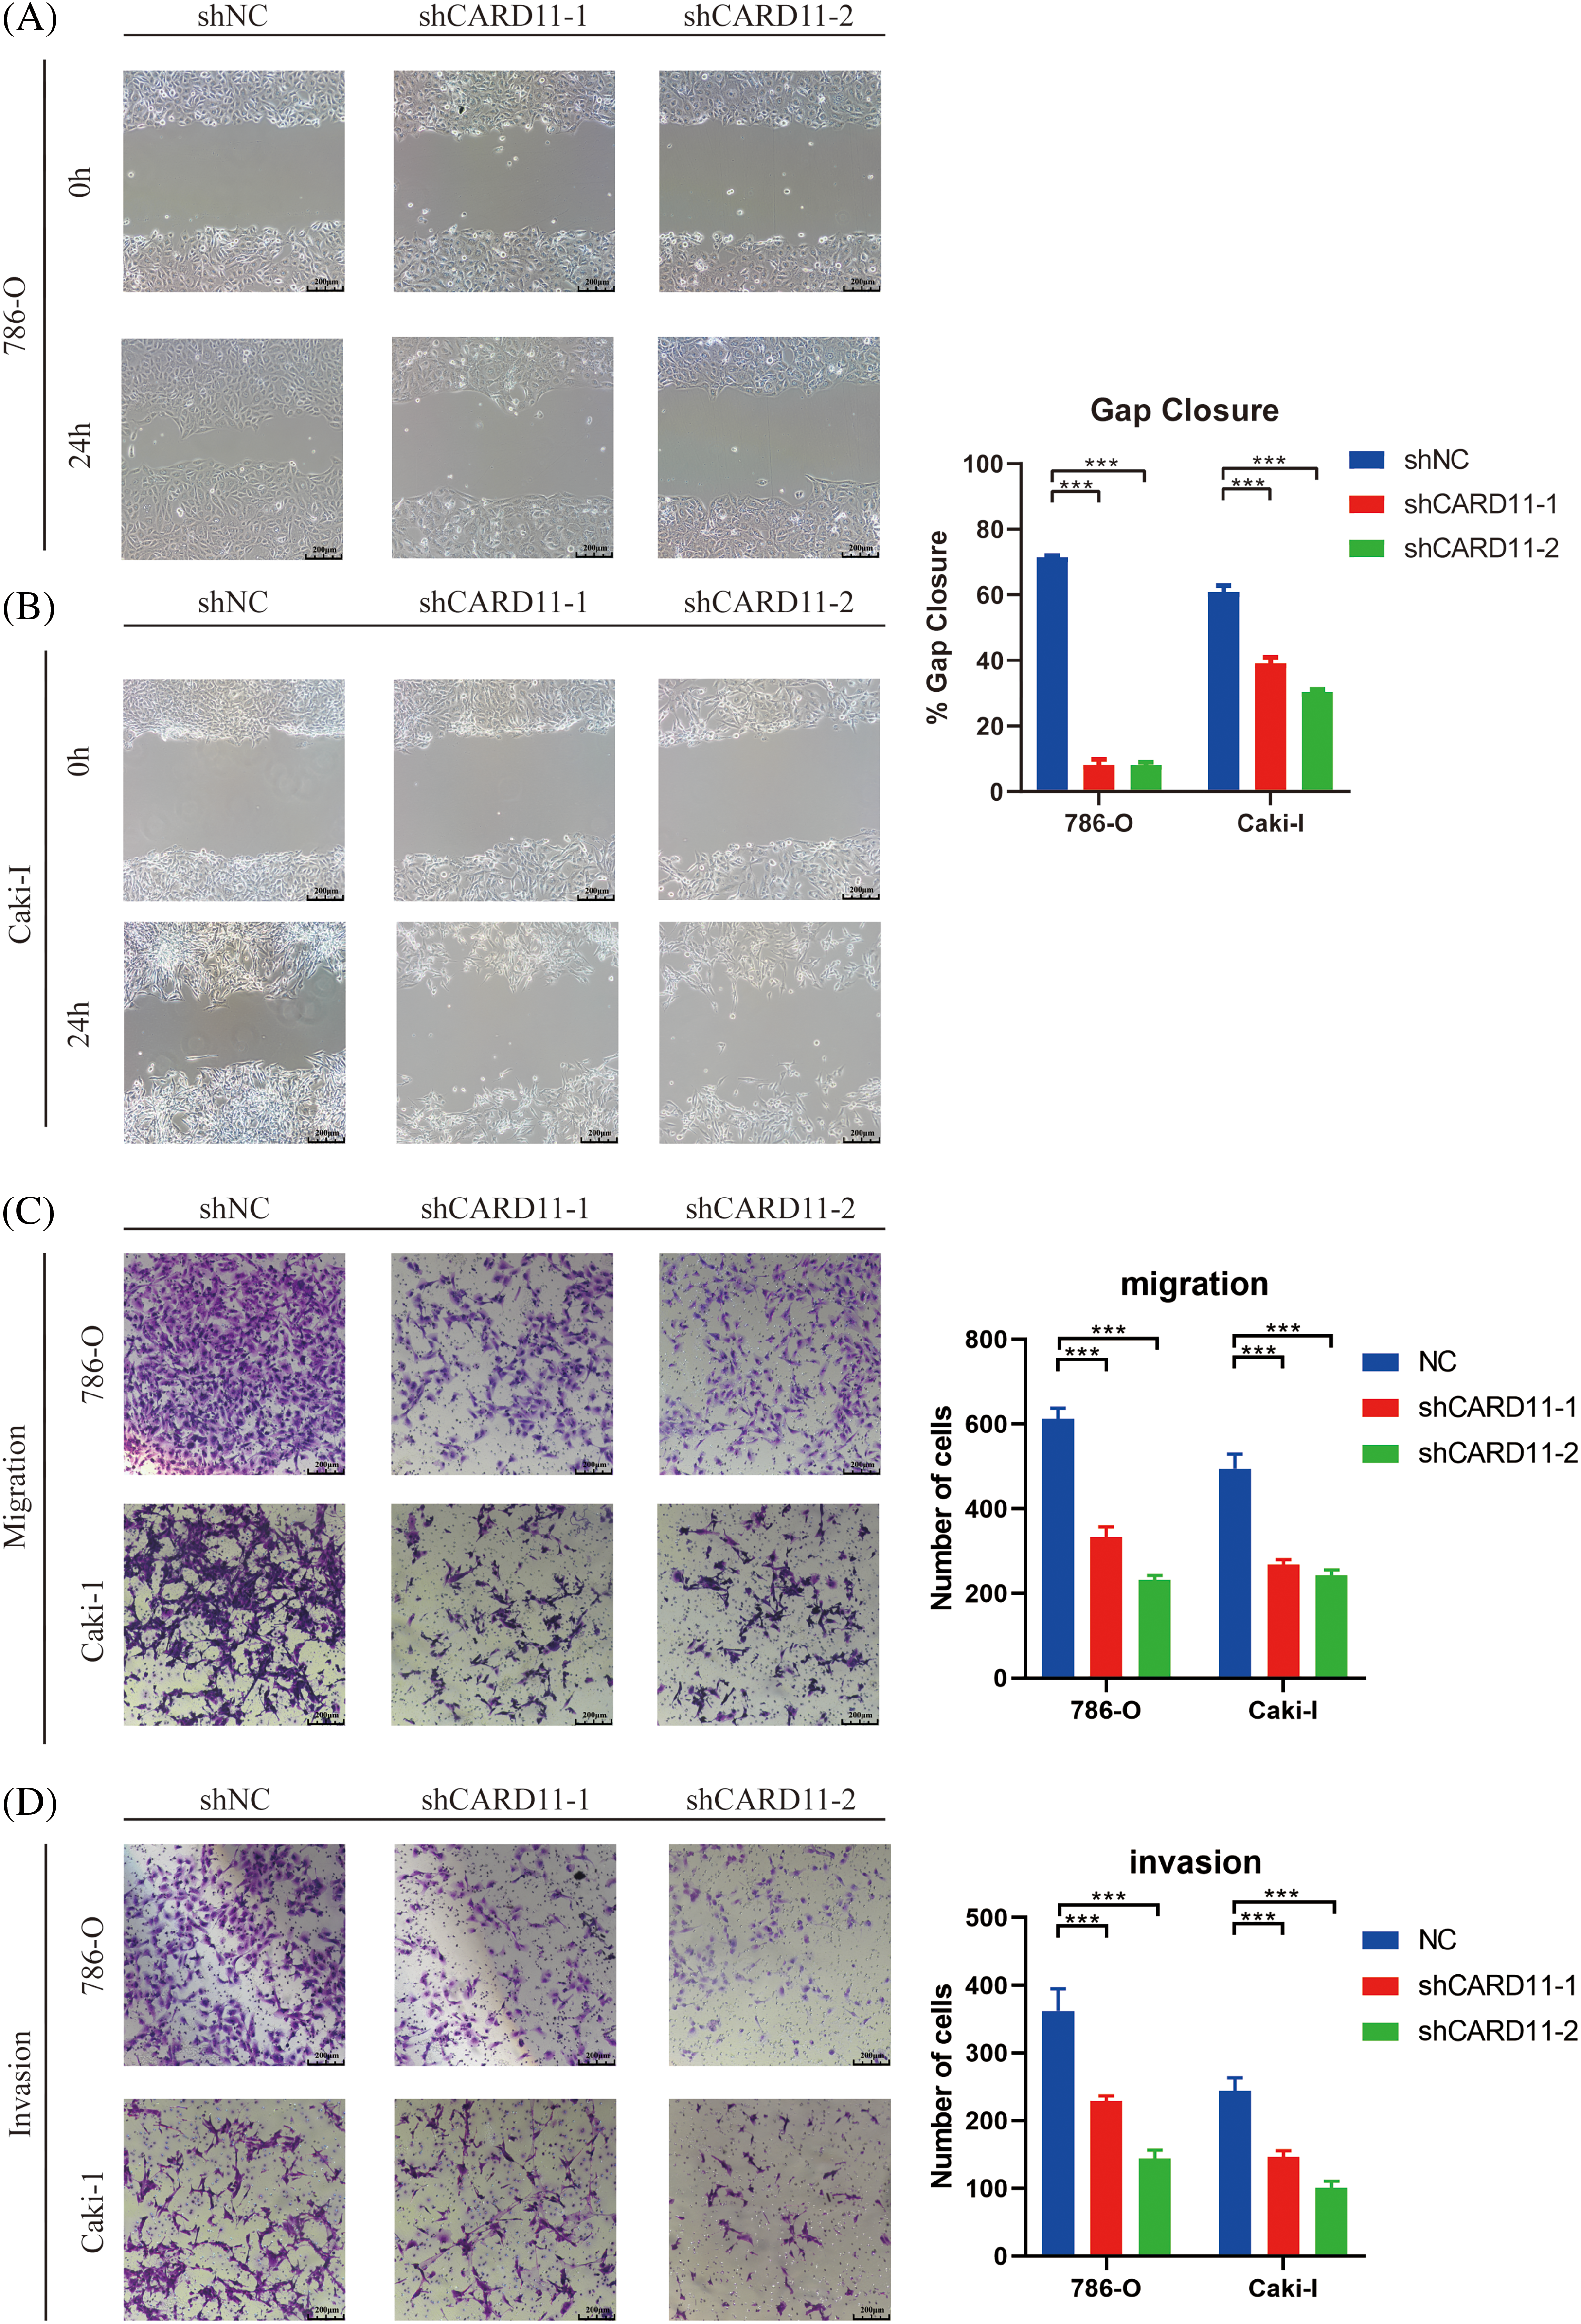
Figure 8: The migration and invasion ability of ccRCC cells was attenuated upon down-regulation of CARD11. (A–C) Migration ability was measured by scratch test (n = 4) and transwell migration assay (n = 5). (D) The invasion of ccRCC cells was measured by transwell invasion assay (n = 5). ***p < 0.001.
RCC affects over 400,000 individuals worldwide annually, with the majority being diagnosed with the common subtype known as ccRCC [48]. Although early-stage ccRCC can be effectively treated with surgery, a considerable proportion of ccRCC patients progress to the advanced stage necessitating more efficacious therapeutic interventions beyond surgical options. Targeted therapy and immunotherapy have emerged as promising novel approaches for metastatic ccRCC; however, their efficacy remains uncertain and unpredictable; however, their efficacy remains uncertain and unpredictable. In light of recent insights into the immune landscape of ccRCC and its association with TIICs and gene expression patterns related to them, these factors hold potential as biomarkers for personalized therapy [49]. Therefore, considering CARD11’s relevance in immune regulation and pro-tumorigenic effects, we investigated the CARD11 expression levels along with its correlation to the immune environment and the therapeutic response in ccRCC to guide clinical utilization of novel therapies.
The results revealed a significant upregulation of CARD11’s RNA expression in ccRCC tissue compared to normal tissue. Furthermore, scRNA-seq data and immunohistochemistry data demonstrated the potential activation of CARD11 expression during the transition from the proximal tubular cells to ccRCC cells. CARD11 is a lymphocyte-restricted multi-domain scaffold protein that participates in multiple signaling pathways essential for adaptive immune response. It has been extensively investigated as an integrator conveying signals from B cell receptor (BCR) and T cell receptors (TCR) to nuclear factor-kappa B (NF-κB), Jun N-terminal kinase (JNK), and mammalian target of rapamycin (mTOR) which are critical for lymphocyte activation, survival, and proliferation [50]. Due to its close association with the immune system, alterations in the CARD11 gene can result in dysregulated signaling of lymphocyte activation.
However, the CARD11 expression in ccRCC is primarily influenced by the CNV and methylation rather than somatic mutations. Notably, the body methylation of the CARD11 gene significantly contributes to its high expression and short OS in ccRCC. Previous studies have highlighted the crucial role of gene body methylation in oncogenesis and its potential as a therapeutic target in cancer [51]. With these concerns, a comprehensive investigation into CARD11 methylation, including the regulation of each associated CpG island, could provide valuable insights into the development of therapeutic drugs for ccRCC.
As an immune-related gene, CARD11 exhibits strong connectivity with the immune microenvironment of ccRCC. Furthermore, it has been revealed that CARD11 expression is positively associated with increased infiltration levels of TIICs, including both anti-tumor lymphocytes (CD8+ T cells, Th1 cells, and Tfh cells) and pro-tumorigenic lymphocytes (MDSC, Tregs and Th2 cells). CD8+ T cells are cytotoxic T lymphocytes that play a crucial role in defending against tumors. Functional CD8+ T cells can specifically recognize MHC-I molecules on tumor cells and eliminate them through the secretion of pro-inflammatory cytokines and cytotoxic granules [52]. The increased infiltrating level of CD8+ T cells within the TME has been correlated with improved outcomes in a variety of cancers [53]. Th1 cells represent a subset of CD4+ helper T cells that produce interleukin-2 (IL-2), IFN-γ, and tumor necrosis factor-β (TNF-β) [54]. They can elicit an immune response by activating antigen-specific effector T cells such as CD8+ T cells and recruiting innate immune cells [55]. In the TME of most cancers, activation of Th1 cells is a crucial mechanism of CD8+ T cell-mediated anti-tumor activity and is associated with prolonged survival [56]. However, the situation in the TME of ccRCC is different. The prognostic analysis in this study revealed that infiltration of both protective T lymphocytes and APCs was negatively correlated with the prognosis of ccRCC, and the infiltration level of CD8+ T cells was not associated with improved prognosis. Previous studies have also indicated that increased infiltration of CD8+ T cells in ccRCC is related to poor outcomes [57]. One possible explanation for this phenomenon may be linked to the infiltration of inhibitory lymphocytes including MDSC and Tregs. MDSC is a subtype of myeloid cells known for their ability to suppress the adaptive immune response. They not only disrupt the migration and formation of CD8+ T cells but also promote the proliferation of Tregs [58]. In the tumor microenvironment, these characteristics facilitate immune evasion by tumor cells, promote angiogenesis, and contribute to tumor progression, which is associated with advanced stages and poor prognosis in cancer patients [59]. It has been identified that targeting MDSC could overcome immune resistance and serve as a therapeutic target for immunotherapies in RCC [60]. Tregs are characterized by the expression of surface markers CD4, CD25, and Forkhead box protein P3 (FOXP3) [61]. Tregs play a pivotal role in maintaining self-tolerance and immune homeostasis under physiological conditions by suppressing excessive or dysregulated immune responses [62]. However, within the tumor microenvironment, the suppression function of Tregs impedes the cytotoxic activity of CD8+ T cells and facilitates the evasion of tumor cells from immune surveillance. The cancer-immunity cycle also suggests that increased CARD11 expression may enhance activation and recruitment of T cells augmenting their anti-tumor capabilities. Consequently, an elevated infiltration level of Treg cells is associated with shorter survival time in ccRCC [63]. Another pro-tumorigenic subset of T cells is Th2 cells, which share a common origin with Th1 cells but produce distinct cytokines and exert different functions. Th2 cells predominantly secrete IL-4, IL-5, and IL-13 and contribute to the development of allergic inflammatory diseases such as asthma and atopic dermatitis [64]. When tumors exhibit polarization towards Th2 cells among TIICs, they tend to have higher rates of metastasis and progression [65]. Therefore, although elevated CARD11 expression correlates with an immunologically enriched in ccRCC, it tends to be immunosuppressive and is associated with advanced tumor stage and poor prognosis.
Another potential mechanism contributing to the unfavorable prognosis observed in ccRCC with high CARD11 expression could be the upregulation of the inhibitory immune checkpoints. These inhibitory immune checkpoints, expressed on T lymphocytes, play a crucial role in maintaining immune homeostasis by inducing apoptosis of effector T cells and promoting the survival of Tregs [66]. Exploiting this feature, tumor cells develop immune resistance through mechanisms such as the PD-1 pathway [67]. Although ccRCC with high CARD11 expression was found to exhibit enhanced activation and recruitment of CD8+ T cells and Th1 cells, creating a pro-inflammatory microenvironment, their function is restricted due to increased expression of inhibitory immune checkpoints. Exhausted CD8+ T cells expressing multiple inhibitory immune checkpoints display weakened cytotoxic activity and are associated with poor prognosis in ccRCC [68]. Furthermore, Amarnath et al. demonstrated that PD-1 not only induces exhaustion in Th1 cells but also converts them into a regulatory phenotype capable of suppressing cell-mediated immunity [69]. Nonetheless, the abundance of inhibitory immune checkpoints observed in the high CARD11 expression group suggests a favorable response to immunotherapies. ICIs prevent tumor evasion from host immunity and restore the cytotoxicity of effector T cells [70]. During this process, the increased expression of immune checkpoints such as PD-1 has been considered as positive biomarkers for therapeutic response [71]. Moreover, the upregulation of multiple immune checkpoints offers a potential for a flexible selection of different ICIs combinations, which exhibit superior efficacy compared to monotherapy. For instance, the simultaneous blockade of PD-1 and LAG-3 demonstrates enhanced performance in advanced ccRCC [72]. In addition, throughout the immune cycle in ccRCC, elevated CARD11 expression correlates with heightened activation and recruitment of CD8+ T cells, thereby establishing a substantial reserve of effector T lymphocytes that critically influences the therapeutic effect of ICIs. Apart from immunotherapies, CARD11 could also assist in the selection of TKIs. The expression level of CARD11 was significantly associated with angiogenesis and immune cell infiltration, which were two crucial determinants of the therapeutic response to TKIs. High angiogenesis predicts improved susceptibility to TKIs like Sunitinib and Axitinib. Furthermore, patients receiving targeted therapies such as Sunitinib would benefit from a tumor microenvironment characterized by high-density levels of CD8+ T lymphocytes [73,74]. Furthermore, TKIs have been shown to expand the repertoire of anti-tumor CD8+ T lymphocytes in ccRCC patients through various functional mechanisms. For example, Sunitinib can eliminate the infiltration of inhibitory immune cells in the microenvironment. thereby enabling more CD8+ T lymphocytes to maintain their cytotoxic functions and creating a favorable environment for ICI therapies [75]. Recent studies also discovered the advantage of the combination therapy of TKIs and ICIs based on angiogenesis conditions, TME, and checkpoint expression [76]. In summary, CARD11 expression not only serves as a novel biomarker for selecting immunotherapeutic drugs and targeted therapies but also facilitates investigations into combination therapies in ccRCC.
Subsequently, functional enrichment analysis was conducted to explore the underlying mechanism of CARD11 expression in ccRCC. Upregulated CARD11 expression was enriched in adaptive immune response pathways, especially the T lymphocyte differentiation and activation, which may involve the chemokine signaling pathway and cytokine-cytokine receptor interaction. Chemokines are a family of chemotactic cytokines functioning to recruit a variety of cells including immune cells [77]. The interaction of chemokines and their cognate receptors is a critical regulatory mechanism in TME and is associated with tumor development, progression, and treatment outcomes [78]. Utilizing TISIDB allowed us to identify potential immune chemokines and receptors associated with CARD11. CCL4 and CCL5 both are CC chemokines that likely exert their function by interacting with CCR5. It has been demonstrated that CCL4 can recruit Tregs along with other pro-tumorigenic immune cells leading to tumor progression [79]. Similarly, CCL5 plays a crucial role in driving CD8+ T cell exhaustion and Tregs engagement within the TME. The interaction between CXCL13 and its specific receptor CXCR5 facilitates the delivery of immune cells to TME, exerting either anti-tumor or pro-tumorigenic activity. CXCR5 has been recognized as one of the determinants of the cytotoxic activity of CD8+ T cells while CXCL13-CXCR5 interaction may contribute to the suppressive function of Tregs through the induction of IL-10 [80]. The CXCL16-CXCR6 axis was also revealed to participate in the infiltration of Tregs. Additionally, some studies have pointed out that the increased activity of this axis may be related to decreased tumor cell proliferation, invasion, and metastasis, which is worth further investigation [81]. Overall, these findings enhance our understanding of CARD11 expression’s functionality and provide potential therapeutic targets for ccRCC.
Furthermore, the amino terminus CARD domain (caspase recruitment domain) of CARD11 and is essential for mediating interactions with numerous other proteins that also possess the CARD domain. The NF-κB pathway’s activation [82] and the control of apoptosis [83] rely on these connections. In this investigation, we found that when CARD11 was knocked down in cells, there was a drop in the ratio of Bcl2/BAX with a notable rise in the proportion of apoptosis. The functional studies demonstrated that the gain of function in CARD11 could enhance the transcriptional activity of anti-apoptotic BCL2A1, thereby exerting regulatory control over apoptosis levels [83,84]. Additionally, the CBM complex, which is made up of mucosa associated lymphoid tissue lymphoma translocation gene 1 (MALT1), B cell leukemia/lymphoma 10 (BCL10), and CARD11, modifies the NF-κB pathway’s activity. Dysregulation of CBM signaling has been implicated in immune deficiencies, autoimmune disorders, and cancer development [85–87]. This mechanism may elucidate how CARD11 enhances the malignant biological behavior of tumor cells and promotes ccRCC development.
In summary, the present research identified the upregulated CARD11 expression in ccRCC and comprehensively investigated its correlation with the TME, highlighting its potential as a personalized therapy biomarker. However, certain limitations were encountered during this investigation. First, reliance on publicly available databases and online tools whose data may introduce unknown defects. Second, due to the data restriction, only specific drugs were selected for therapeutic response analysis. Further research involving clinical samples and additional clinically proven beneficial drugs should be conducted to further elucidate the role of CARD11 expression as a therapeutic biomarker.
This study represents the first investigation into CARD11 expression in ccRCC, revealing a significant correlation between upregulated CARD11 expression and advanced stage as well as poor prognosis of ccRCC. Moreover, it was observed that ccRCC with elevated CARD11 expression exhibited heightened levels of immune cell infiltration and immune checkpoint expression, thereby displaying a more favorable response to immunotherapy and targeted therapy. Additionally, several chemokine-receptor axes associated with CARD11 function were identified, potentially serving as promising therapeutic targets. These findings hold great potential for guiding clinicians in tailoring individualized immunotherapies for ccRCC patients while also shedding light on future research endeavors about drug therapy for ccRCC.
Acknowledgement: The information utilized in this study was retrieved from The Cancer Genome Atlas (TCGA), ArrayExpress, Genome Expression Omnibus (GEO), Epigenome Wide Association Study Atlas, cBioPortal for Cancer Genomics, TISIDB, Tumor Immunophenotype Profiling, CancerSEA, Genomics of Drug Sensitivity in Cancer and Gene Set Enrichment Analysis. We sincerely appreciate their sharing of the data and information.
Funding Statement: This study was supported by grants from the Guangdong Provincial Department of Finance Project in 2022 (KS0120220267, KS0120220268, KS0120220272, KS0120220271), Guangdong Basic and Applied Basic Research Natural Science Funding (2023A1515012485), Science and Technology Projects in Guangzhou (202102020058), and Launch funding of the National Natural Science Foundation of China (8210101099).
Author Contributions: All authors contributed to the study conception and design. Kaiwen Tian, Methodology, Experiment, Writing; Hanzhong Chen: Formal analysis, Original draft preparation; Qianqian Wang and Fenglian Jiang: Data collection; Chunxiang Feng, Teng Li and Xiaoyong Pu: Writing-Reviewing and Editing; Yanlin Tang and Jiumin Liu: Visualization, software, conceptualization and funding, Supervision. All authors read and approved the final version of the manuscript.
Availability of Data and Materials: The data and information demonstrated and analyzed throughout the present study were obtained from the Genomics Data Commons Data Portal (GDC, https://portal.gdc.cancer.gov/), Gene Expression Omnibus (GEO, https://www.ncbi.nlm.nih.gov/geo/), Epigenome Wide Association Study Atlas (EWAS Atlas, https://ngdc.cncb.ac.cn/ewas/), the cBioPortal for Cancer Genomics (cBioPortal, https://www.cbioportal.org/), Tumor Immunophenotype Profiling (TIP, http://biocc.hrbmu.edu.cn/TIP/), CancerSEA (http://biocc.hrbmu.edu.cn/CancerSEA/), The Cancer Immune Atlas (TCIA, https://tcia.at/home), Tumor Immune Dysfunction and Exclusion (TIDE, http://tide.dfci.harvard.edu/), Genomics of Drug Sensitivity in Cancer (GDSC, https://www.cancerrxgene.org), Gene Set Enrichment Analysis (GSEA, https://www.gsea-msigdb.org/).
Ethics Approval: This study was approved by the ethics committee of Guangdong Provincial People’s Hospital (No. KY-2-2022-257-01). We certify that the study was performed in accordance with the 1964 declaration of HELSINKI and later amendments. Written informed consent was obtained from all the patients.
Conflicts of Interest: The authors declare that they have no conflicts of interest to report regarding the present study.
Supplementary Materials: The supplementary material is available online at https://doi.org/10.32604/biocell.2024.048737.
References
1. Siegel RL, Miller KD, Fuchs HE, Jemal A. Cancer statistics, 2021. CA: A Cancer J Clin. 2021;71(1):7–33. [Google Scholar] [PubMed]
2. Bahadoram S, Davoodi M, Hassanzadeh S, Bahadoram M, Barahman M, Mafakher L. Renal cell carcinoma: an overview of the epidemiology, diagnosis, and treatment. G Ital Nefrol. 2022;39(3). [Google Scholar]
3. Lucarelli G, Rutigliano M, Ferro M, Giglio A, Intini A, Triggiano F, et al. Activation of the kynurenine pathway predicts poor outcome in patients with clear cell renal cell carcinoma. Urol Oncol. 2017;35(7):461.e15–27. [Google Scholar] [PubMed]
4. Netti GS, Lucarelli G, Spadaccino F, Castellano G, Gigante M, Divella C, et al. PTX3 modulates the immunoflogosis in tumor microenvironment and is a prognostic factor for patients with clear cell renal cell carcinoma. Aging. 2020;12(8):7585–602. [Google Scholar] [PubMed]
5. Santoni M, Massari F, Bracarda S, Grande E, Matrana MR, Rizzo M, et al. Cabozantinib in patients with advanced renal cell carcinoma primary refractory to first-line immunocombinations or tyrosine kinase inhibitors. Eur Urol Focus. 2022;8(6):1696–702. [Google Scholar] [PubMed]
6. Atkins MB, Tannir NM. Current and emerging therapies for first-line treatment of metastatic clear cell renal cell carcinoma. Cancer Treat Rev. 2018;70:127–37. [Google Scholar] [PubMed]
7. Choueiri TK, Motzer RJ. Systemic therapy for metastatic renal-cell carcinoma. N Engl J Med. 2017;376(4):354–66. [Google Scholar] [PubMed]
8. Santoni M, Rizzo A, Mollica V, Matrana MR, Rosellini M, Faloppi L, et al. The impact of gender on the efficacy of immune checkpoint inhibitors in cancer patients: the MOUSEION-01 study. Crit Rev Oncol Hematol. 2022;170:103596. [Google Scholar] [PubMed]
9. Mollica V, Rizzo A, Marchetti A, Tateo V, Tassinari E, Rosellini M, et al. The impact of ECOG performance status on efficacy of immunotherapy and immune-based combinations in cancer patients: the MOUSEION-06 study. Clin Exp Med. 2023;23(8):5039–49. [Google Scholar] [PubMed]
10. Rosellini M, Marchetti A, Mollica V, Rizzo A, Santoni M, Massari F. Prognostic and predictive biomarkers for immunotherapy in advanced renal cell carcinoma. Nat Rev Urol. 2023;20(3):133–57. [Google Scholar] [PubMed]
11. Zarrabi K, Fang C, Wu S. New treatment options for metastatic renal cell carcinoma with prior anti-angiogenesis therapy. J Hematol Oncol. 2017;10(1):38. [Google Scholar] [PubMed]
12. Lalani AA, McGregor BA, Albiges L, Choueiri TK, Motzer R, Powles T, et al. Systemic treatment of metastatic clear cell renal cell carcinoma in 2018: current paradigms, use of immunotherapy, and future directions. Eur Urol. 2019;75(1):100–10. [Google Scholar] [PubMed]
13. Lasorsa F, Rutigliano M, Milella M, Ferro M, Pandolfo SD, Crocetto F, et al. Cellular and molecular players in the tumor microenvironment of renal cell carcinoma. J Clin Med. 2023;12(12):3888. [Google Scholar] [PubMed]
14. Tamma R, Rutigliano M, Lucarelli G, Annese T, Ruggieri S, Cascardi E, et al. Microvascular density, macrophages, and mast cells in human clear cell renal carcinoma with and without bevacizumab treatment. Urol Oncol. 2019;37(6):355.e11–19. [Google Scholar] [PubMed]
15. Gigante M, Pontrelli P, Herr W, Gigante M, D’Avenia M, Zaza G, et al. miR-29b and miR-198 overexpression in CD8+ T cells of renal cell carcinoma patients down-modulates JAK3 and MCL-1 leading to immune dysfunction. J Transl Med. 2016;14:84. [Google Scholar] [PubMed]
16. Lasorsa F, Rutigliano M, Milella M, Ferro M, Pandolfo SD, Crocetto F, et al. Complement system and the kidney: iits role in renal diseases, kidney transplantation and renal cell carcinoma. Int J Mol Sci. 2023;24(22):16515. [Google Scholar] [PubMed]
17. Lucarelli G, Netti GS, Rutigliano M, Lasorsa F, Loizzo D, Milella M, et al. MUC1 expression affects the immunoflogosis in renal cell carcinoma microenvironment through complement system activation and immune infiltrate modulation. Int J Mol Sci. 2023;24(5):4814. [Google Scholar] [PubMed]
18. Vuong L, Kotecha RR, Voss MH, Hakimi AA. Tumor microenvironment dynamics in clear-cell renal cell carcinoma. Cancer Discov. 2019;9(10):1349–57. [Google Scholar] [PubMed]
19. Gajewski TF, Schreiber H, Fu YX. Innate and adaptive immune cells in the tumor microenvironment. Nat Immunol. 2013;14(10):1014–22. [Google Scholar] [PubMed]
20. Lasorsa F, di Meo NA, Rutigliano M, Milella M, Ferro M, Pandolfo SD, et al. Immune checkpoint inhibitors in renal cell carcinoma: mmolecular basis and rationale for their use in clinical practice. Biomedicines. 2023;11(4):1071. [Google Scholar] [PubMed]
21. Díaz-Montero CM, Rini BI, Finke JH. The immunology of renal cell carcinoma. Nat Rev Nephrol. 2020;16(12):721–35. [Google Scholar]
22. Ghini V, Laera L, Fantechi B, Monte FD, Benelli M, McCartney A, et al. Metabolomics to assess response to immune checkpoint inhibitors in patients with non-small-cell lung cancer. Cancers. 2020;12(12):3574. [Google Scholar] [PubMed]
23. Verbiest A, Couchy G, Job S, Zucman-Rossi J, Caruana L, Lerut E, et al. Molecular Subtypes of clear cell renal cell carcinoma are associated with outcome during pazopanib therapy in the metastatic setting. Clin Genitourin Cancer. 2018;16(3):e605–12. [Google Scholar] [PubMed]
24. Beuselinck B, Job S, Becht E, Karadimou A, Verkarre V, Couchy G, et al. Molecular subtypes of clear cell renal cell carcinoma are associated with sunitinib response in the metastatic setting. Clin Cancer Res. 2015;21(6):1329–39. [Google Scholar] [PubMed]
25. Senbabaoglu Y, Gejman RS, Winer AG, Liu M, Van Allen EM, de Velasco G, et al. Tumor immune microenvironment characterization in clear cell renal cell carcinoma identifies prognostic and immunotherapeutically relevant messenger RNA signatures. Genome Biol. 2016;17(1):231. [Google Scholar] [PubMed]
26. DeVore SB, Khurana Hershey GK. The role of the CBM complex in allergic inflammation and disease. J Allergy Clin Immunol. 2022;150(5):1011–30. [Google Scholar] [PubMed]
27. Hara H, Wada T, Bakal C, Kozieradzki I, Suzuki S, Suzuki N, et al. The MAGUK family protein CARD11 is essential for lymphocyte activation. Immunity. 2003;18(6):763–75. [Google Scholar] [PubMed]
28. Liu J, Huang B, Ding F, Li Y. Environment factors, DNA methylation, and cancer. Environ Geochem Health. 2023;45(11):7543–68. [Google Scholar] [PubMed]
29. Ritchie ME, Phipson B, Wu D, Hu Y, Law CW, Shi W, et al. Limma powers differential expression analyses for RNA-sequencing and microarray studies. Nucleic Acids Res. 2015;43(7):e47. [Google Scholar] [PubMed]
30. Kassambara A, Kosinski M, Biecek P, Fabian SJDSCugPackage ‘survminer’. 2017. Available from: https://cran.r-project.org/src/contrib/Archive/survminer/. [Accessed 2023]. [Google Scholar]
31. Camp RL, Dolled-Filhart M, Rimm DL. X-tile: a new bio-informatics tool for biomarker assessment and outcome-based cut-point optimization. Clin Cancer Res. 2004;10(21):7252–9. [Google Scholar] [PubMed]
32. Li M, Zou D, Li Z, Gao R, Sang J, Zhang Y, et al. EWAS Atlas: a curated knowledgebase of epigenome-wide association studies. Nucleic Acids Res. 2019;47(D1):D983–8. [Google Scholar] [PubMed]
33. Gao J, Aksoy BA, Dogrusoz U, Dresdner G, Gross B, Sumer SO, et al. Integrative analysis of complex cancer genomics and clinical profiles using the cBioPortal. Sci Signal. 2013;6(269):pl1. [Google Scholar] [PubMed]
34. Yoshihara K, Shahmoradgoli M, Martinez E, Vegesna R, Kim H, Torres-Garcia W, et al. Inferring tumour purity and stromal and immune cell admixture from expression data. Nat Commun. 2013;4:2612. [Google Scholar] [PubMed]
35. Hänzelmann S, Castelo R, Guinney JJBB. GSVA: gene set variation analysis for microarray and RNA-seq data. 2013;14(1):1–15. [Google Scholar]
36. Ru B, Wong CN, Tong Y, Zhong JY, Zhong SSW, Wu WC, et al. TISIDB: an integrated repository portal for tumor-immune system interactions. Bioinformatics. 2019;35(20):4200–2. [Google Scholar] [PubMed]
37. Xu L, Deng C, Pang B, Zhang X, Liu W, Liao G, et al. TIP: a web server for resolving tumor immunophenotype profiling. Cancer Res. 2018;78(23):6575–80. [Google Scholar] [PubMed]
38. Yuan H, Yan M, Zhang G, Liu W, Deng C, Liao G, et al. CancerSEA: a cancer single-cell state atlas. Nucleic Acids Res. 2019;47(D1):D900–8. [Google Scholar] [PubMed]
39. Fu J, Li K, Zhang W, Wan C, Zhang J, Jiang P, et al. Large-scale public data reuse to model immunotherapy response and resistance. Genome Med. 2020;12(1):21. [Google Scholar] [PubMed]
40. Barbour JD, Geeleher P, Cox N, Huang RS. pRRophetic: an R package for prediction of clinical chemotherapeutic response from tumor gene expression levels. PLoS One. 2014;9(9):e107468. [Google Scholar]
41. Subramanian A, Tamayo P, Mootha VK, Mukherjee S, Ebert BL, Gillette MA, et al. Gene set enrichment analysis: a knowledge-based approach for interpreting genome-wide expression profiles. Proc Natl Acad Sci USA. 2005;102(43):15545–50. [Google Scholar]
42. Mootha VK, Lindgren CM, Eriksson K-F, Subramanian A, Sihag S, Lehar J, et al. PGC-1α-responsive genes involved in oxidative phosphorylation are coordinately downregulated in human diabetes. Nat Genet. 2003;34(3):267–73. [Google Scholar]
43. Feng C, Wang Z, Liu C, Liu S, Wang Y, Zeng Y, et al. Integrated bioinformatical analysis, machine learning and in vitro experiment-identified m6A subtype, and predictive drug target signatures for diagnosing renal fibrosis. Front Pharmacol. 2022;13:909784. [Google Scholar] [PubMed]
44. Buttner F, Winter S, Rausch S, Reustle A, Kruck S, Junker K, et al. Survival prediction of clear cell renal cell carcinoma based on gene expression similarity to the proximal tubule of the Nephron. Eur Urol. 2015;68(6):1016–20. [Google Scholar] [PubMed]
45. Chen DS, Mellman I. Oncology meets immunology: the cancer-immunity cycle. Immunity. 2013;39(1):1–10. [Google Scholar] [PubMed]
46. Charoentong P, Finotello F, Angelova M, Mayer C, Efremova M, Rieder D, et al. Pan-cancer immunogenomic analyses reveal genotype-immunophenotype relationships and predictors of response to checkpoint blockade. Cell Rep. 2017;18(1):248–62. [Google Scholar] [PubMed]
47. Jiang P, Gu S, Pan D, Fu J, Sahu A, Hu X, et al. Signatures of T cell dysfunction and exclusion predict cancer immunotherapy response. Nat Med. 2018;24(10):1550–8. [Google Scholar] [PubMed]
48. Bray F, Ferlay J, Soerjomataram I, Siegel RL, Torre LA, Jemal A. Global cancer statistics 2018: gLOBOCAN estimates of incidence and mortality worldwide for 36 cancers in 185 countries. CA Cancer J Clin. 2018;68(6):394–424. [Google Scholar] [PubMed]
49. McDermott DF, Huseni MA, Atkins MB, Motzer RJ, Rini BI, Escudier B, et al. Clinical activity and molecular correlates of response to atezolizumab alone or in combination with bevacizumab versus sunitinib in renal cell carcinoma. Nat Med. 2018;24(6):749–57. [Google Scholar] [PubMed]
50. Bedsaul JR, Carter NM, Deibel KE, Hutcherson SM, Jones TA, Wang Z, et al. Mechanisms of regulated and dysregulated CARD11 signaling in adaptive immunity and disease. Front Immunol. 2018;9:2105. [Google Scholar] [PubMed]
51. Yang B, Wang JQ, Tan Y, Yuan R, Chen ZS, Zou C. RNA methylation and cancer treatment. Pharmacol Res. 2021;174:105937. [Google Scholar] [PubMed]
52. Leclerc M, Voilin E, Gros G, Corgnac S, de Montpreville V, Validire P, et al. Regulation of antitumour CD8 T-cell immunity and checkpoint blockade immunotherapy by Neuropilin-1. Nat Commun. 2019;10(1):3345. [Google Scholar] [PubMed]
53. Paijens ST, Vledder A, de Bruyn M, Nijman HW. Tumor-infiltrating lymphocytes in the immunotherapy era. Cell Mol Immunol. 2021;18(4):842–59. [Google Scholar] [PubMed]
54. Ruterbusch M, Pruner KB, Shehata L, Pepper M. In vivo CD4+ T cell differentiation and function: rrevisiting the Th1/Th2 paradigm. Annu Rev Immunol. 2020;38:705–25. [Google Scholar] [PubMed]
55. Rasoulouniriana D, Santana-Magal N, Gutwillig A, Farhat-Younis L, Wine Y, Saperia C, et al. A distinct subset of FcgammaRI-expressing Th1 cells exert antibody-mediated cytotoxic activity. J Clin Invest. 2019;129(10):4151–64. [Google Scholar] [PubMed]
56. Marques HS, De Brito BB, Da Silva FAF, Santos MLC, De Souza JCB, Correia TML, et al. Relationship between Th17 immune response and cancer. World J Clin Oncol. 2021;12(10):845–67. [Google Scholar] [PubMed]
57. Kim MC, Jin Z, Kolb R, Borcherding N, Chatzkel JA, Falzarano SM, et al. Updates on immunotherapy and immune landscape in renal clear cell carcinoma. Cancers. 2021;13(22):5856. [Google Scholar] [PubMed]
58. Salminen A, Kaarniranta K, Kauppinen A. Photoaging: UV radiation-induced inflammation and immunosuppression accelerate the aging process in the skin. Inflamm Res. 2022;71(7–8):817–31. [Google Scholar] [PubMed]
59. Li T, Liu T, Zhu W, Xie S, Zhao Z, Feng B, et al. Targeting MDSC for immune-checkpoint blockade in cancer immunotherapy: ccurrent progress and new prospects. Clin Med Insights Oncol. 2021;15:11795549211035540. [Google Scholar] [PubMed]
60. Sica A, Guarneri V, Gennari A. Myelopoiesis, metabolism and therapy: a crucial crossroads in cancer progression. Cell Stress. 2019;3(9):284–94. [Google Scholar] [PubMed]
61. Zhang Z, Guo J, Jia R. Treg plasticity and human diseases. Inflamm Res. 2023;72(12):2181–97. [Google Scholar] [PubMed]
62. Stucchi A, Maspes F, Montee-Rodrigues E, Fousteri G. Engineered treg cells: the heir to the throne of immunotherapy. J Autoimmun. 2023;11:102986. doi:10.1016/j.jaut.2022.102986. [Google Scholar] [PubMed] [CrossRef]
63. Combe P, de Guillebon E, Thibault C, Granier C, Tartour E, Oudard S. Trial watch: therapeutic vaccines in metastatic renal cell carcinoma. Oncoimmunol. 2015;4(5):e1001236. [Google Scholar]
64. León B. Understanding the development of Th2 cell-driven allergic airway disease in early life. Front Allergy. 2022;3:1080153. [Google Scholar]
65. Basu A, Ramamoorthi G, Albert G, Gallen C, Beyer A, Snyder C, et al. Differentiation and regulation of TH cells: a balancing act for cancer immunotherapy. Front Immunol. 2021;12:669474. [Google Scholar] [PubMed]
66. Han Y, Liu D, Li L. PD-1/PD-L1 pathway: current researches in cancer. Am J Cancer Res. 2020;10(3):727–42. [Google Scholar]
67. Singh S, Singh N, Baranwal M, Sharma S, Devi SSK, Kumar S. Understanding immune checkpoints and PD-1/PD-L1-mediated immune resistance towards tumour immunotherapy. 3 Biotech. 2023;13(12):411. [Google Scholar] [PubMed]
68. Dolina JS, van Braeckel-Budimir N, Thomas GD, Salek-Ardakani S. CD8+ T cell exhaustion in cancer. Front Immunol. 2021;12:715234. [Google Scholar] [PubMed]
69. Amarnath S, Mangus CW, Wang JC, Wei F, He A, Kapoor V, et al. The PDL1-PD1 axis converts human TH1 cells into regulatory T cells. Sci Transl Med. 2011;3(111):111ra20. [Google Scholar]
70. Singh S, Hassan D, Aldawsari HM, Molugulu N, Shukla R, Kesharwani P. Immune checkpoint inhibitors: a promising anticancer therapy. Drug Discov Today. 2020;25(1):223–9. [Google Scholar] [PubMed]
71. de Miguel M, Calvo E. Clinical challenges of immune checkpoint inhibitors. Cancer Cell. 2020;38(3):326–33. [Google Scholar] [PubMed]
72. Zelba H, Bedke J, Hennenlotter J, Mostbock S, Zettl M, Zichner T, et al. PD-1 and LAG-3 dominate checkpoint receptor-mediated T-cell inhibition in renal cell carcinoma. Cancer Immunol Res. 2019;7(11):1891–9. [Google Scholar] [PubMed]
73. Hakimi AA, Voss MH, Kuo F, Sanchez A, Liu M, Nixon BG, et al. Transcriptomic profiling of the tumor microenvironment reveals distinct subgroups of clear cell renal cell cancer: ddata from a randomized phase III trial. Cancer Discov. 2019;9(4):510–25. [Google Scholar] [PubMed]
74. George DJ, Martini JF, Staehler M, Motzer RJ, Magheli A, Escudier B, et al. Immune biomarkers predictive for disease-free survival with adjuvant sunitinib in high-risk locoregional renal cell carcinoma: from randomized phase III S-TRAC study. Clin Cancer Res. 2018;24(7):1554–61. [Google Scholar] [PubMed]
75. Zizzari IG, Napoletano C, Botticelli A, Caponnetto S, Calabro F, Gelibter A, et al. TK inhibitor pazopanib primes DCs by downregulation of the beta-catenin pathway. Cancer Immunol Res. 2018;6(6):711–22. [Google Scholar] [PubMed]
76. Sharma R, Kadife E, Myers M, Kannourakis G, Prithviraj P, Ahmed N. Determinants of resistance to VEGF-TKI and immune checkpoint inhibitors in metastatic renal cell carcinoma. J Exp Clin Cancer Res. 2021;40(1):186. [Google Scholar] [PubMed]
77. Qin R, Ren W, Ya G, Wang B, He J, Ren S, et al. Role of chemokines in the crosstalk between tumor and tumor-associated macrophages. Clin Exp Med. 2023;23(5):1359–73. [Google Scholar] [PubMed]
78. Märkl F, Huynh D, Endres S, Kobold S. Utilizing chemokines in cancer immunotherapy. Trends Cancer. 2022;8(8):670–82. [Google Scholar]
79. Mukaida N, Sasaki SI, Baba TJTM. CCL4 signaling in the tumor microenvironment. Adv Exp Med Biol. 2020;1231:23–32. [Google Scholar]
80. Hussain M, Adah D, Tariq M, Lu Y, Zhang J, Liu J. CXCL13/CXCR5 signaling axis in cancer. Life Sci. 2019;227:175–86. [Google Scholar] [PubMed]
81. Korbecki J, Bajdak-Rusinek K, Kupnicka P, Kapczuk P, Siminska D, Chlubek D, et al. The role of CXCL16 in the pathogenesis of cancer and other diseases. Int J Mol Sci. 2021;22(7):3490. [Google Scholar] [PubMed]
82. Sato T, Maeta T, Ito S. Dimethyl fumarate suppresses the proliferation of HTLV-1-infected T cells by inhibiting CBM complex-triggered NF-B signaling. Anticancer Res. 2023;43(5):1901–8. [Google Scholar] [PubMed]
83. Swafford K, Acharya B, Xu YZ, Raney T, McCrury M, Saha D, et al. Targeting a novel G-Quadruplex in the CARD11 oncogene promoter with Naptho(2,1-b)furan-1-ethanol,2-nitro- requires the nitro group. Genes. 2022;13(7):1144. doi:10.3390/genes13071144. [Google Scholar] [PubMed] [CrossRef]
84. Decombis S, Bellanger C, Le Bris Y, Madiot C, Jardine J, Santos JC, et al. CARD11 gain of function upregulates BCL2A1 expression and promotes resistance to targeted therapies combination in B-cell lymphoma. Blood. 2023;142(18):1543–55. doi:10.1182/blood.2023020211. [Google Scholar] [PubMed] [CrossRef]
85. Carter NM, Pomerantz JL. CARD11 signaling in regulatory T cell development and function. Adv Biol Regul. 2022;84:100890. doi:10.1016/j.jbior.2022.100890. [Google Scholar] [PubMed] [CrossRef]
86. Stinson JR, Dorjbal B, McDaniel DP, David L, Wu H, Snow AL. Gain-of-function mutations in CARD11 promote enhanced aggregation and idiosyncratic signalosome assembly. Cell Immunol. 2020;353(12):104129. doi:10.1016/j.cellimm.2020.104129. [Google Scholar] [PubMed] [CrossRef]
87. Singh M, Jackson KJL, Wang JJ, Schofield P, Field MA, Koppstein D, et al. Lymphoma driver mutations in the pathogenic evolution of an iconic human autoantibody. Cell. 2020;180(5):878–94.e19. doi:10.1016/j.cell.2020.01.029. [Google Scholar] [PubMed] [CrossRef]
Cite This Article
 Copyright © 2024 The Author(s). Published by Tech Science Press.
This work is licensed under a Creative Commons Attribution 4.0 International License , which permits unrestricted use, distribution, and reproduction in any medium, provided the original work is properly cited.
 Downloads
 Citation Tools