 Open Access
ARTICLE
Unveiling the predictive power of bacterial response-related genes signature in hepatocellular carcinoma: with bioinformatics analyses and experimental approaches
1 Pediatric Infections Research Center, Research Institute for Children’s Health, Shahid Beheshti University of Medical Sciences, Tehran, 15468-15514, Iran
2 Hematology, Oncology and Stem Cell Transplantation Research Center, Tehran University of Medical Sciences, Tehran, 1461884513, Iran
3 Research Center for Immunodeficiencies, Children’s Medical Center, Tehran University of Medical Sciences, Tehran, 1461884513, Iran
4 Network of Immunity in Infection, Malignancy and Autoimmunity (NIIMA), Universal Scientific Education and Research Network (USERN), Tehran, 1461884513, Iran
5 Department of Immunology, School of Medicine, Tehran University of Medical Sciences, Tehran, 1461884513, Iran
6 Department of Hematology and Blood Banking, School of Allied Medical Sciences, Shahid Beheshti University of Medical Sciences, Tehran, 1985717443, Iran
* Corresponding Authors: FATEMEH FALLAH. Email: ; DAVOOD BASHASH. Email:
(This article belongs to the Special Issue: Gut Microbiota in Human Health: Exploring the Complex Interplay)
BIOCELL 2024, 48(12), 1781-1804. https://doi.org/10.32604/biocell.2024.055848
Received 08 July 2024; Accepted 02 October 2024; Issue published 30 December 2024
Abstract
Background: Despite progress in therapeutic strategies, treatment failure in hepatocellular carcinoma (HCC) remains a major challenge, resulting in low survival rates. The presence of bacteria and the host’s immune response to bacteria can influence the pathogenesis and progression of HCC. We developed a risk model based on bacterial response-related genes (BRGs) using gene sets from molecular signature databases to identify new markers for predicting HCC outcomes and categorizing patients into different risk groups. Methods: The data from the Cancer Genome Atlas (TCGA) portal was retrieved, and differentially expressed BRGs were identified. Uni- and multivariate Cox regression and least absolute shrinkage and selection operator (LASSO) LASSO analyses were executed to develop the prognostic risk model. Key contributor to the prognostic model was identified, and the results were tested by using experimental assays in HCC cell lines. Results: Multivariate analysis demonstrated an independent prognostic factor of 12-BRG signature in HCC patients. The low-risk group had better overall survival with significantly lower tumor mutation burden (TMB). The risk scores were negatively correlated with the presence of tumor-infiltrating immune cells. In an effort to find the key contributor of the 12-BRG signature, we found polo like kinase1 (PLK1) had the best accuracy with 1-, 3-, and 5-year AUC of 0.72, 0.66, and 0.65, respectively. Both PLK1 inhibitor Volasertib and the knockdown of the PLK1 gene resulted in diminished viability in HCC cell lines. The combination of PLK1 inhibition with low-dose chemotherapy exhibited an amplified effect of the treatment. Conclusion: To date, there have been no reports of BRG biomarkers in HCC, and this study represents for the first time that a 12-BRG signature has the potential to predict the survival of HCC.Keywords
Supplementary Material
Supplementary Material FileHepatocellular carcinoma (HCC) stands as a tough global health challenge, characterized by its aggressive nature and dismal prognosis which ranked as the seventh most prevalent cancer and the fourth major cause of cancer-related mortality worldwide, primarily arises from liver cirrhosis triggered by hepatitis viruses and alcohol consumption [1,2]. Despite advancements in treatments such as surgery, radiation therapy, immunotherapy, and targeted therapy [3], the prognosis for HCC patients remains frustrating owing to its high rates of multiple drug resistance, metastasis, and recurrence [4,5]. The Barcelona Clinic Liver Cancer (BCLC) staging system has been used to categorize risk groups and forecast the HCC patient’s prognosis [1]; nevertheless, as this system primarily focuses on clinical factors and does not incorporate the molecular heterogeneity of the disease, there has been an increasing desire to investigate potential molecular prognostic markers.
Emerging research has shed light on the profound influence of the tumor microenvironment (TME) on HCC progression and patient survival. This complex ecosystem, teeming with diverse cell types and signaling molecules, is occasionally influenced by the intricate interplay between cancer cells and the surrounding bacteria. These tiny microorganisms may play intricate roles in tumorigenesis, progression, and therapy response within the local environment [6,7]. There are a substantial number of research have unveiled the presence of abundant bacteria in various tumor types such as breast [8], lung [9], ovarian [10], pancreatic [11], oral [12], and bladder [13] tumors. This dynamic relationship, involving a complex interplay of signaling pathways and immune responses, shapes the tumor’s heterogeneity and ultimately dictates its behavior.
Recently the gut microbiota has garnered interest in the study of HCC development as there is growing recognition of the bidirectional communication between the gut and the liver [14,15]. When the gut experiences injury or inflammation, it can become permeable, allowing the migration of microbes to the liver. The movement of bacteria is facilitated by metabolites and components associated with the microbiota, causing the activation of a series of signaling pathways—all of which are pivotal in the progression of HCC [16]. A general overview of HCC pathogenesis associated with bacteria is depicted in Fig. 1. To date, no reports of bacterial response-related biomarkers in HCC have been documented, and this study represents for the first time that a 12-BRGs prognostic signature has the potential to predict the survival of this malignancy and our findings hold the promise of a novel survival prognostic model for HCC patients, empowering clinicians to stratify patients into distinct risk groups, personalize treatment strategies, and ultimately improve patient outcomes. This study represents a significant step towards a more personalized and effective approach to HCC management.
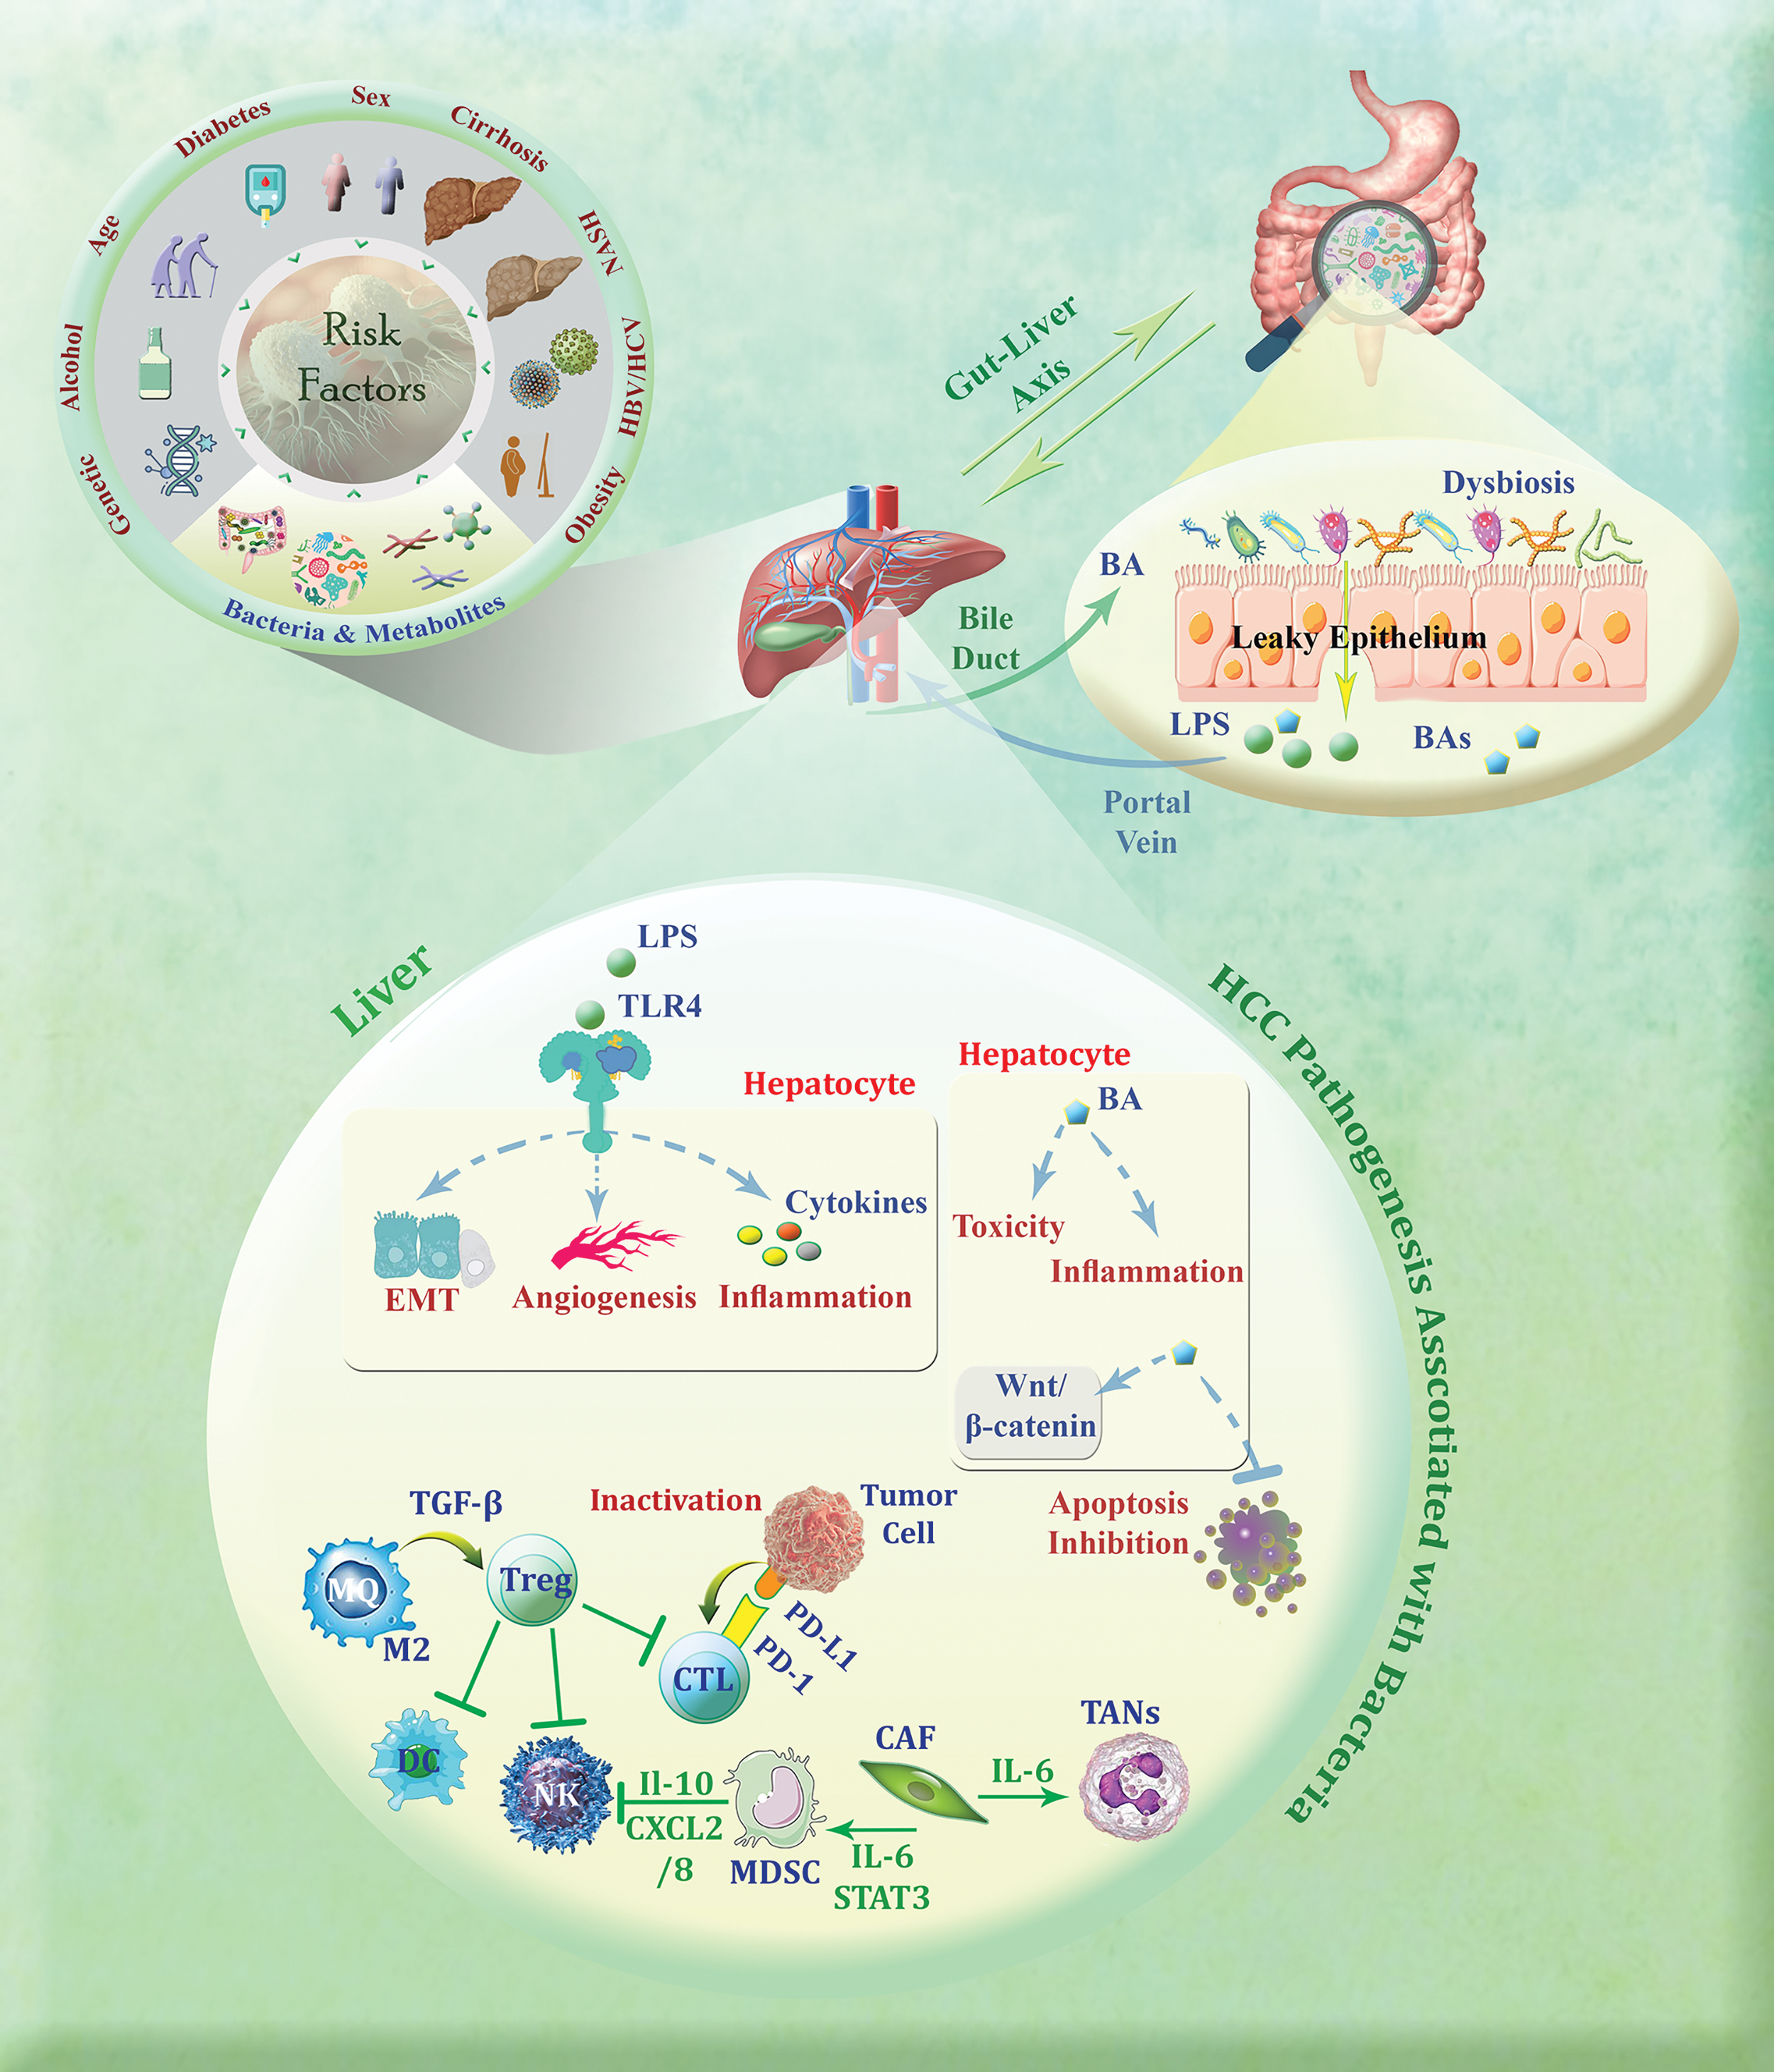
Figure 1: General overview of HCC pathogenesis associated with bacteria. M2 macrophages employ TGF-β to induce the production of regulatory T cells (Tregs), thereby inhibiting the function of cytotoxic T lymphocytes (CTLs), natural killer (NK) cells, and dendritic cells (DCs). Furthermore, the interaction between PD-1 on CTLs and PD-L1 on tumor cells can deactivate these immune cells that are vital in the fight against tumors. Accordingly, cancer-associated fibroblasts (CAFs) contribute to the development of HCC by promoting the differentiation of tumor-associated neutrophils (TANs) and myeloid-derived suppressor cells (MDSCs), which subsequently suppress the activity of NK cells. Dysbiosis, an imbalance in the gut microbiota, can disrupt the integrity of the gut barrier and lead to the release of specific metabolites such as microbe-associated molecular patterns (MAMPs) like LPS (lipopolysaccharide) and bile acid (BA). The conversion of primary bile acids into secondary bile acids by the gut microbiota can lead to reabsorption in the intestine and conjugation in the liver, resulting in inflammation, toxicity, and inhibition of apoptosis. Moreover, the binding of MAMPs such as LPS to Toll-like receptor 4 (TLR4) on hepatocytes can trigger signaling pathways that encourage epithelial-mesenchymal transition (EMT), angiogenesis, and inflammation (The figure was created using Photoshop CS6).
To gather the transcription profiles and clinical data of HCC patients, we employed the R package “TCGAbiolinks” to retrieve the data from the Cancer Genome Atlas (TCGA) portal located at (https://portal.gdc.cancer.gov/) (accessed on 01 October 2024), in which 50 samples classified as normal and 374 samples were cancerous. Additionally, to validate the signature, we procured another microarray dataset (GSE14520) from the renowned Gene Expression Omnibus (GEO) database, accessible at (https://www.ncbi.nlm.nih.gov/geo/) (accessed on 01 October 2024). To enrich our study with an inclusive list of genes associated with bacterial response, we used the Molecular Signatures Database (MSigDB) database (https://www.gsea-msigdb.org/gsea/msigdb/) (accessed on 01 October 2024). By conducting a meticulous search using the keywords “bacteria & bacterium”, we obtained a comprehensive compilation of these genes which can be found in Table S1.
Once we normalized the TCGA dataset, we tried to uncover the crucial bacterial response-related genes (BRGs) that played a pivotal role in the progression of HCC. To this end, we employed the “limma” package [17] to precisely identify differentially expressed genes (DEGs) among cancerous and normal samples. Our criteria for significance were set as genes with |log fold change (FC)| values exceeding 2 and adjusted p-values below 0.01. By merging the BRGs extracted from the MSigDB database, we successfully identified a cohort of differentially expressed bacterial response-related genes (DE-BRGs) for further analysis and exploration.
Functional enrichment analyses
To delve deeper into the potential molecular mechanisms associated with the DE-BRGs, we conducted comprehensive Gene Ontology (GO) and Kyoto Encyclopedia of Genes and Genomes (KEGG) enrichment analyses. These analyses were carried out with the aid of the “cluster Profiler” R package [18] which serves as a powerful tool for investigating functional associations. We deemed an adjusted p-value below 0.05 to be indicative of statistical significance, allowing us to identify meaningful and biologically relevant enrichments in the GO and KEGG pathways related to the DE-BRGs.
Constructing a prognostic model according to risk score and model validation
In this stage, we embarked on a particular process to construct a prognostic prediction model founded on a risk score. First, we excluded normal samples and also samples lacking data on survival, focusing solely on the remaining TCGA-liver hepatocellular carcinoma (TCGA-LIHC) cohort. To ensure our model’s robustness, we divided the cohort into training and testing sets by chance. The training cohort served as our foundation for identifying prognostic BRGs and establishing the prognostic risk model. To validate the prognostic significance, we turned to the testing set. To identify potential DE-BRGs with prognostic value, we subjected the screened DE-BRGs to univariate Cox regression analysis, employing the powerful “survminer” and “survival” R packages. This analysis allowed us to pinpoint the genes that hold immense potential in predicting patient outcomes. To further refine our model and mitigate overfitting, we employed the cutting-edge technique of least absolute shrinkage and selection operator (LASSO) penalized Cox proportional hazards regression. This technique, implemented using the “glmnet” R package [19,20], enabled us to select the optimal genes for constructing the model.
Eventually, by using gene expression levels the risk score for each HCC patient was measured, and the corresponding multivariate Cox regression coefficients. The calculation of the risk score involved a precise formula as follows:
Risk score = (expression of first gene × coefficient of first gene) + (expression of second gene × coefficient of second gene) + ... + (expression of last gene × coefficient of last gene).
To validate the model, 30% of TCGA-LIHC samples and a separate validation dataset (the GSE14520 dataset) were utilized as the internal and external test sets, respectively. In addition, the Kaplan-Meier curves analysis was also performed to strengthen the predictive capability of the risk signature.
Evaluating the established bacterial response-related signature
To assess the true potential of the established bacterial response-related signature, our first task was to determine the optimal cut-off value for the risk score. To accomplish this, we employed the “surv_cutpoint” function from the ‘Survminer’ package, allowing us to identify the ideal threshold for risk stratification. To gauge the prognostic value of the DE-BRG model, we turned to the timeless technique of Kaplan-Meier analysis. With the help of the powerful “survminer” and “survival” R packages, we examined the survival outcomes of patients based on their risk scores.
To further assess the sensitivity and specificity of our signature, we employed receiver operating characteristic (ROC) curve analyses. Specifically, we focused on the 1-, 3-, and 5-year time points and calculated the area under the curve (AUC) employing the reliable “survivalROC” R package [21]. These analyses provided valuable insights into the discriminatory power of our risk signature. To ascertain the independent prognostic significance of the risk score, as well as the clinicopathological features such as age, sex, and TNM stage, we conducted both univariate and multivariate Cox regression analyses. These analyses allowed us to assess the individual contributions of each factor in predicting patient outcomes. Additionally, to provide a deeper understanding of the relationship between the risk signature and various clinicopathological features, we employed the Wilcoxon test to explore potential differences in clinicopathological characteristics among patients stratified by their risk scores.
Illuminating the role of tumor-infiltrating immune cells (TIICs)
To gain deeper insights into the intricate interplay between the tumor microenvironment and our bacterial response-related risk signature, we embarked on an investigation of tumor-infiltrating immune cells (TIICs). Leveraging the power of the CIBERSORT method (https://cibersortx.stanford.edu/) (accessed on 01 October 2024), by using gene expression profiles, we successfully determined the cellular composition of intricate tissues. Additionally, using the CIBERSORT method, we calculated the immune cell infiltration status for each sample to reveal the presence and abundance of various immune cell types within the tumor microenvironment. To explore the association between immune infiltrating cells and risk scores, we also conducted the Spearman correlation analysis. By assessing the correlation between the abundance of different immune cell types and the calculated risk scores, we aimed to uncover potential associations and unveil the impact of immune cell infiltration on the risk signature.
Predicting overall survival (OS) by nomogram construction
The “rms” R library was used to develop a nomogram for estimating overall survival in HCC patients, including age, sex, stage, TNM classification, and the prognostic risk score model. To assess the accuracy of the nomogram, time-dependent calibration curves were generated to evaluate its reliability.
To obtain comprehensive mutation data, we accessed the tumor mutation burden (TMB) and Mutation Annotation Format (MAF) datasets from the esteemed TCGA portal by using the “maftools” R package [22]; this tool enabled us to dissect and interpret the genetic alterations present within the HCC samples. By leveraging various analytical techniques offered by the “maftools” package, we gained valuable insights into the mutational profile of HCC, including the types of mutations, their frequency, and potential driver mutations.
Identification of key contributors based on the LIHC prognosis model
LIHC samples of TCGA were divided into low- and high-expression based on each gene’s optimal cutoff which was calculated by the ROC curve. To assess the prognostic value of each gene, the Kaplan-Meier analysis was performed using “survminer” and “survival” R packages, and to evaluate their sensitivity and specificity, the ROC curve analyses of 1-, 3-, and 5-year were used, and the AUC was calculated using “survivalROC” R package.
Construction of lncRNA-miRNA-mRNA regulatory axis
miRTargetLink (https://ccb-compute.cs.uni-saarland.de/mirtargetlink2) (accessed on 01 October 2024), and also the other database “miRTarBase” (https://mirtarbase.cuhk.edu.cn/~miRTarBase/miRTarBase_2022/php/index.php) (accessed on 01 October 2024) were applied to explore the miRNA targets of the PLK1 gene. To investigate the lncRNA targets of miRNA, we used DIANA-LncBase (https://diana.e-ce.uth.gr/lncbasev3/interactions/) (accessed on 01 October 2024) and RNAInter (http://www.rnainter.org/) (accessed on 01 October 2024). We also analyzed the expression and prognostic values of miRNAs with Student’s t-test and univariate Cox regression coefficient on the TCGA-LIHC dataset.
Cell lines, reagents, WST-1 assay, and siRNA transfection
Huh7 (Japanese Collection of Research Bioresources Cell Bank (JCRB)) and SNU449 (The American Type Culture Collection (Manassas, VA, USA)) HCC cell lines were cultivated in Dulbecco’s Modified Eagle’s Medium (DMEM, Gibco (Thermo Fisher Scientific), #11965-092, Grand Island, NY, USA) and Roswell Park Memorial Institute 1640 (RPMI 1640, Corning, #10041CV, Manassas, VA, USA) medium, respectively, which enriched with antibiotics (Antibiotic-Antimycotic (Anti-Anti), Gibco (Thermo Fisher Scientific), #15240062, Grand Island, NY, USA), 10% fetal bovine serum (Gibco (Thermo Fisher Scientific), #16140071, Grand Island, NY, USA), and 2 mM l-glutamine. The cells were grown in a controlled environment with 5% CO2 at 37°C. Mycoplasma contamination was detected using MycoAlert® Mycoplasma Detection Kit (#LT07-318, Lonza, Inc., Houston, TX, USA). To investigate the effect of PLK1 inhibition on HCC, the cells were exposed to growing concentrations of a potent inhibitor of PLK1 (Volasertib) (#A10135, Adooq Bioscience, Irvine, CA, USA). To assess the inhibitory effects of Volasertib on the metabolic activity of HCC cell lines, the HCC cell lines were treated in 96-well plates (5000 cells/per well). The following day, the cells were exposed to ascending concentrations of the inhibitor for up to 48 h. After removing the liquid medium, the cells were incubated with WST-1 (Sigma-Aldrich, #11644807001, Darmstadt, Germany) solution (5 μL). The resulting formazan was dissolved using DMSO, and the absorbance was measured using an ELISA reader (BioTek Synergy HTX Multimode Reader, #S1LFA, Winooski, VT, USA). To confirm the result of PLK1 inhibition, we also investigated the effect of PLK1 siRNA on Huh7 and SNU449 cells. The HCC cells were seeded at a density of 1 × 10⁵ cells per well in 6-well plates and transfected with the siRNAs (PLK1 siRNA, Thermo Fisher Scientific (Ambion), #4390824, Austin, TX, USA) and AllStars Negative Control, Qiagen, #1027281, Germantown, MD, USA) using Lipofectamine RNAiMAX (Thermo Fisher Scientific, #13778075, Austin, TX, USA) according to the manufacturer’s instructions.
All statistical analyses were performed using R software (version 4.2.1; The R Foundation for Statistical Computing, Vienna, Austria). Additionally, graphical representations and data analysis were conducted using GraphPad Prism (version 10.3.1.; GraphPad Software, San Diego, CA, USA). To visualize the expression patterns of different genes or variables, we employed the R package “pheatmap” [23] to create heatmaps, allowing us to identify patterns, clusters, and trends within our datasets. For the visualization of differential gene expression, we utilized the “ggplot2” package in R [24] to generate a volcano plot that is effective in highlighting genes that display considerable changes in expression between various groups, with the magnitude of change represented on the x-axis and the statistical significance on the y-axis. To analyze the overlap between different sets of elements or datasets, we utilized the Venn diagram tool available at the following URL: (https://bioinformatics.psb.ugent.be/webtools/Venn) (accessed on 01 October 2024). The flowchart of the study is shown in Fig. 2. All experimental tests were done in triplicate (n = 3). Statistical significance was calculated using one-way ANOVA (Dunnett’s multiple comparisons test) using GraphPad Prism Software 10.3.1.
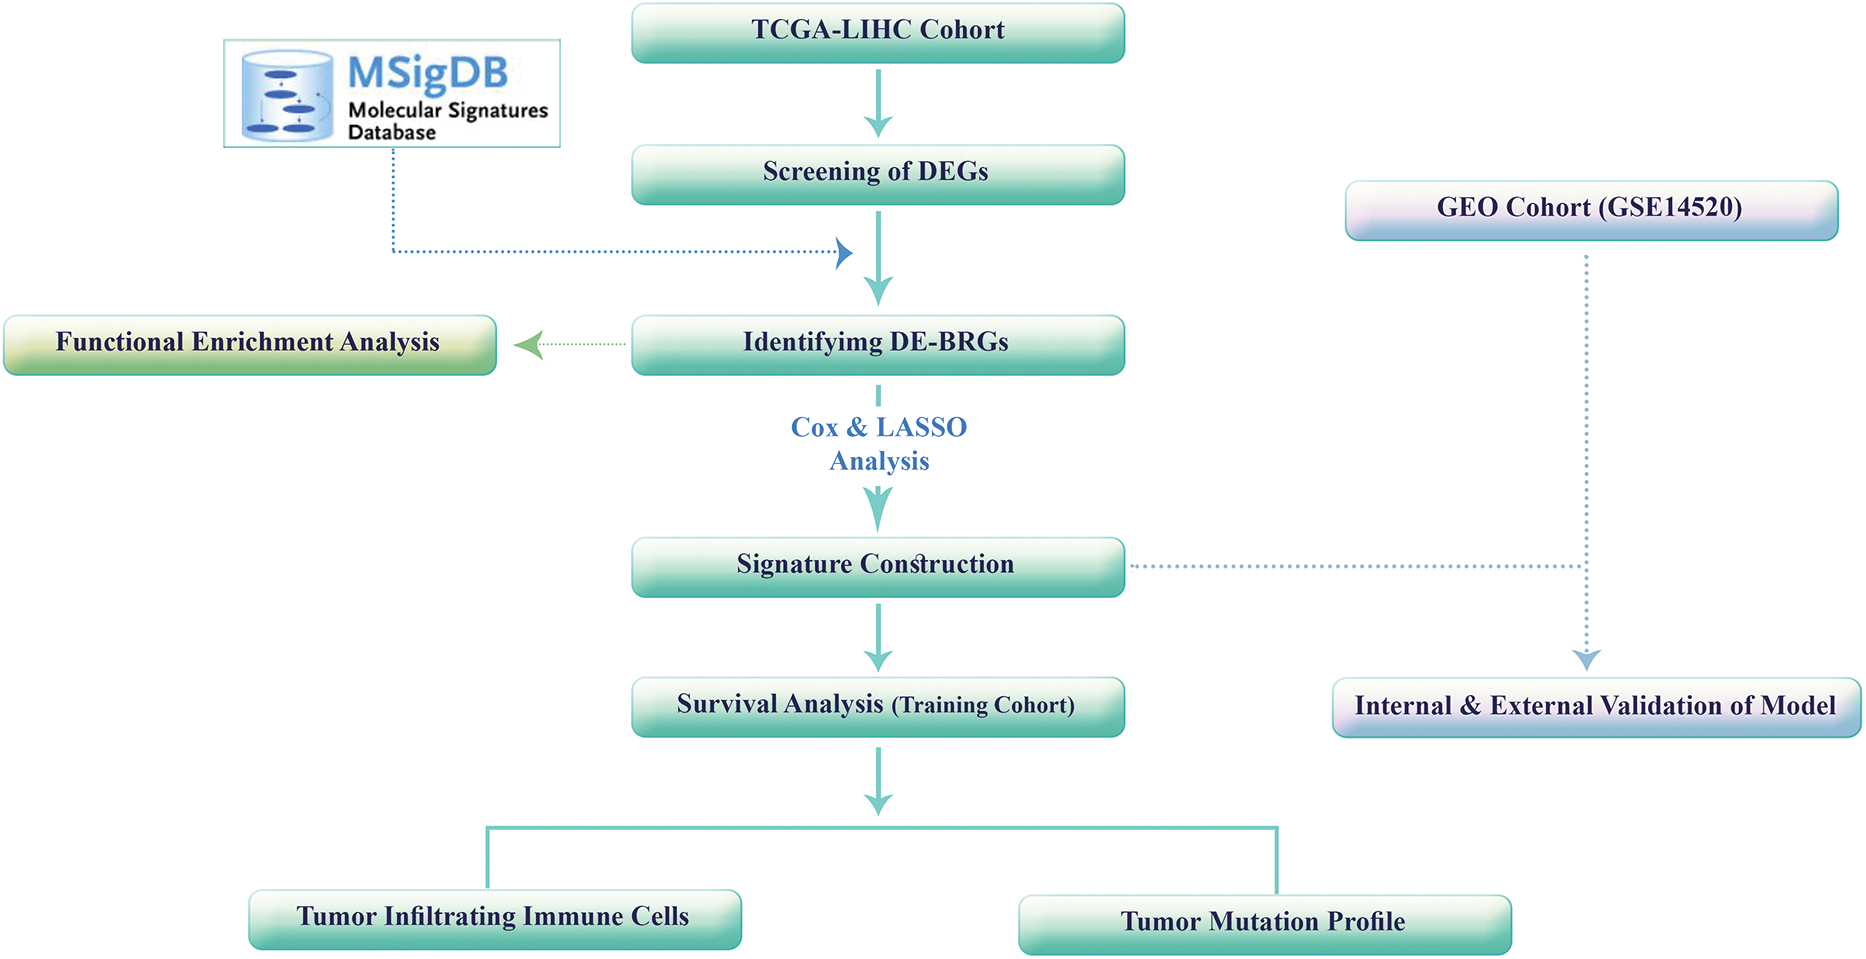
Figure 2: The study’s flowchart.
This study comprised a cohort of 50 normal samples and 374 samples of HCC; seven samples were excluded due to the lack of survival information. The rest of the HCC samples were randomly separated into two cohorts: training and testing sets consisting of 257 and 110 samples, respectively. To ensure comparability, we analyzed the clinical characteristics of the samples in both train and test cohorts, as well as the entire cohort. As detailed in Table S2, there are no significant differences among the training, testing, and total cohorts (p > 0.05); suggesting that the distribution of clinical characteristics, such as age, sex, tumor grade, and other relevant factors was similar between the training and testing cohorts. By carefully considering the patients’ characteristics and confirming the comparability of the training and testing cohorts, we aimed to minimize potential biases and confounding factors that could influence our subsequent findings and interpretations.
To identify DEGs between normal and HCC samples, we applied a significance threshold of adjusted p-value < 0.01 and | log2 (fold change) | > 2. Through this analysis, we identified a total of 428 DEGs (Table S3) within the TCGA-LIHC project dataset. These DEGs exhibited weighty alterations in expression levels among normal and HCC samples (Fig. 3A), indicating potential involvement in HCC development and progression. Next, we integrated a set of 2509 BRGs into our analysis. By comparing the DEGs with the BRGs, we identified 67 overlapped DE-BRGs (Fig. 3B), eight of which were overexpressed in HCC samples in comparison with normal samples, while 59 were downregulated. The specific genes and their expression changes can be found in Table S4.
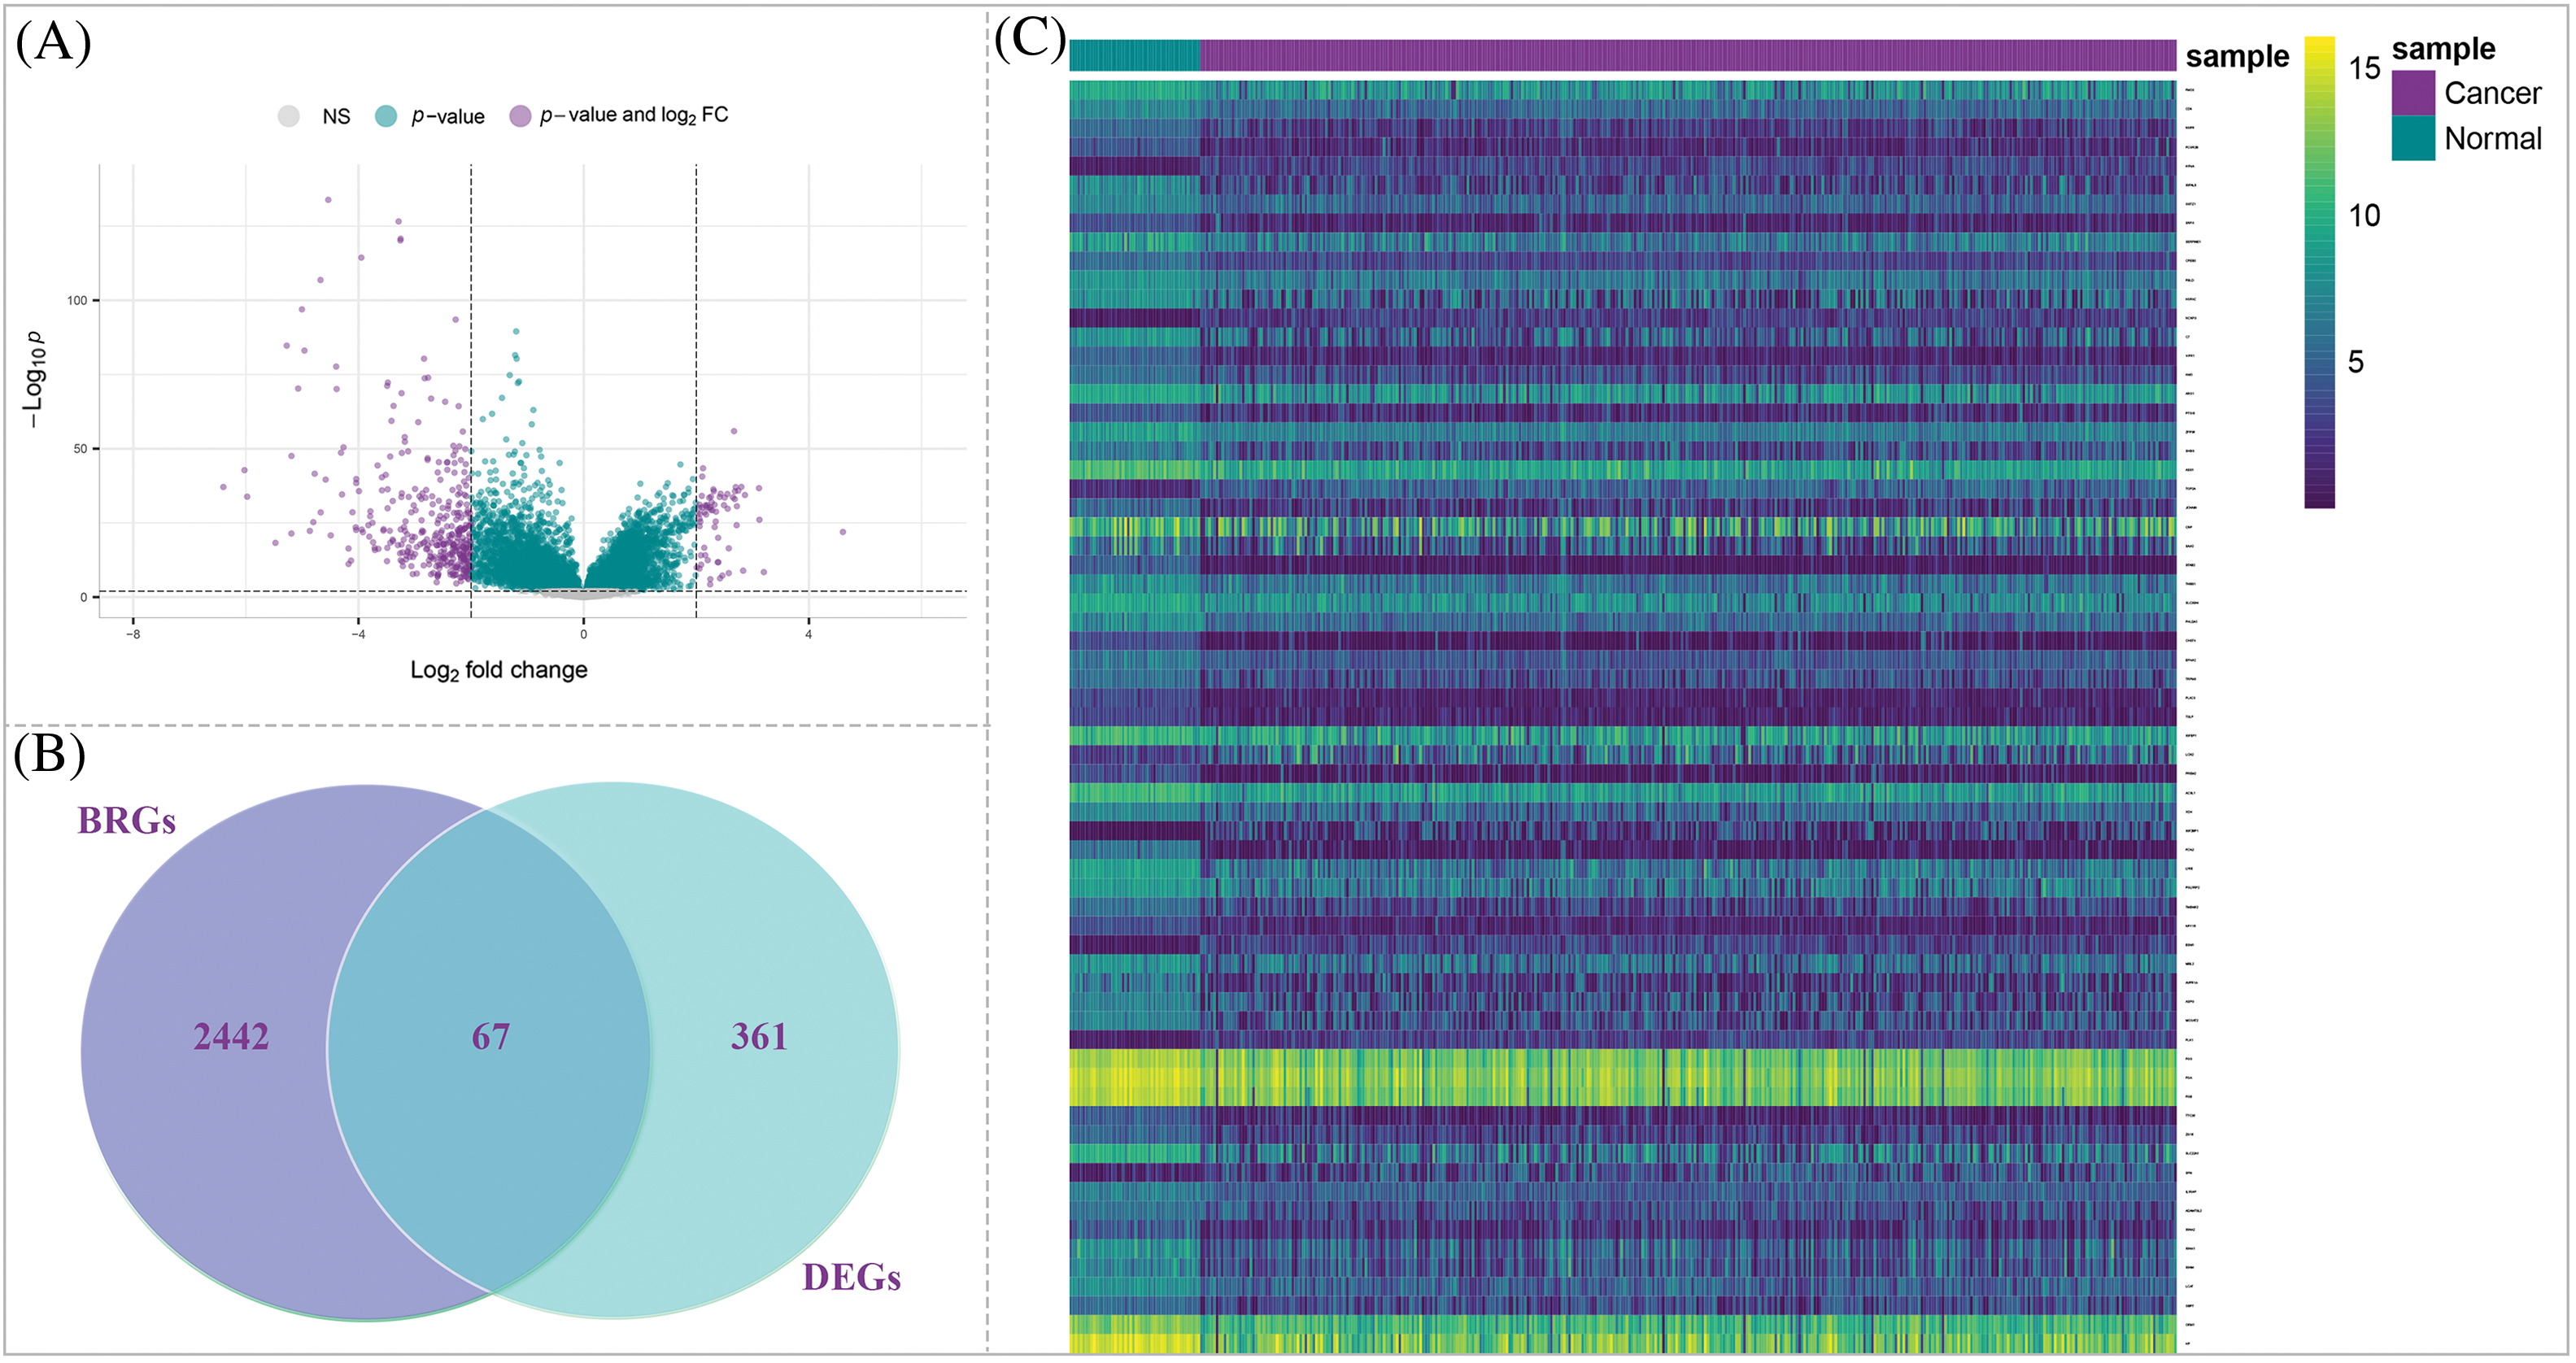
Figure 3: Identification of DE-BRGs between HCC and normal samples. (A) Volcano plot of DEGs. (B) Venn diagram of the mutual genes between HCC DEGs and BRGs. (C) The heatmap of DE-BRGs expression among normal and cancerous samples.
To provide a visual representation of the expression profiles of the DE-BRGs in normal and tumor samples, we generated Fig. 3C; this heatmap highlights differences between normal and tumor samples via illustration of the expression levels of the DE-BRGs. The distinct expression patterns observed in the heatmap further support the potential involvement of these DE-BRGs in the development and progression of LIHC. Then, by screening and identifying DE-BRGs, we aimed to uncover specific bacterial response-related genes that are dysregulated in HCC samples to provide valuable insights into the interplay between the host’s bacterial response and HCC pathogenesis.
Functional enrichment analysis
To gain insights into the functional implications of 67 identified DE-BRGs, we performed functional enrichment analysis. This analysis allowed us to uncover the biological processes (BP), molecular functions (MF), components of cells (CC), and signaling cascades influenced by these DE-BRGs. For the biological process category, the most significantly enriched term (adjusted p-value < 0.05) among the DE-BRGs was “defense response to bacterium”; suggesting that the host’s immune system may play a crucial role in response to bacterial infections within the context of HCC. In terms of molecular function, the enriched term was “peptidoglycan binding”, indicating potential interactions between the DE-BRGs and bacterial cell wall components. Regarding cellular components, the term “blood microparticle” emerged as the most enriched, further emphasizing on the involvement of circulating blood components in the host’s response to bacterial stimuli. Fig. 4 and Table 1 provide an overview of the top eight highly enriched terms for every single one of the 3 ontologies (BP, MF, and CC). In addition to the functional enrichment analysis, we conducted a pathway analysis using the KEGG database. By analyzing the data from the TCGA cohort, we identified three signaling pathways associated with the DE-BRGs; the specific pathways and their relevance to LIHC can be found in Table 2.
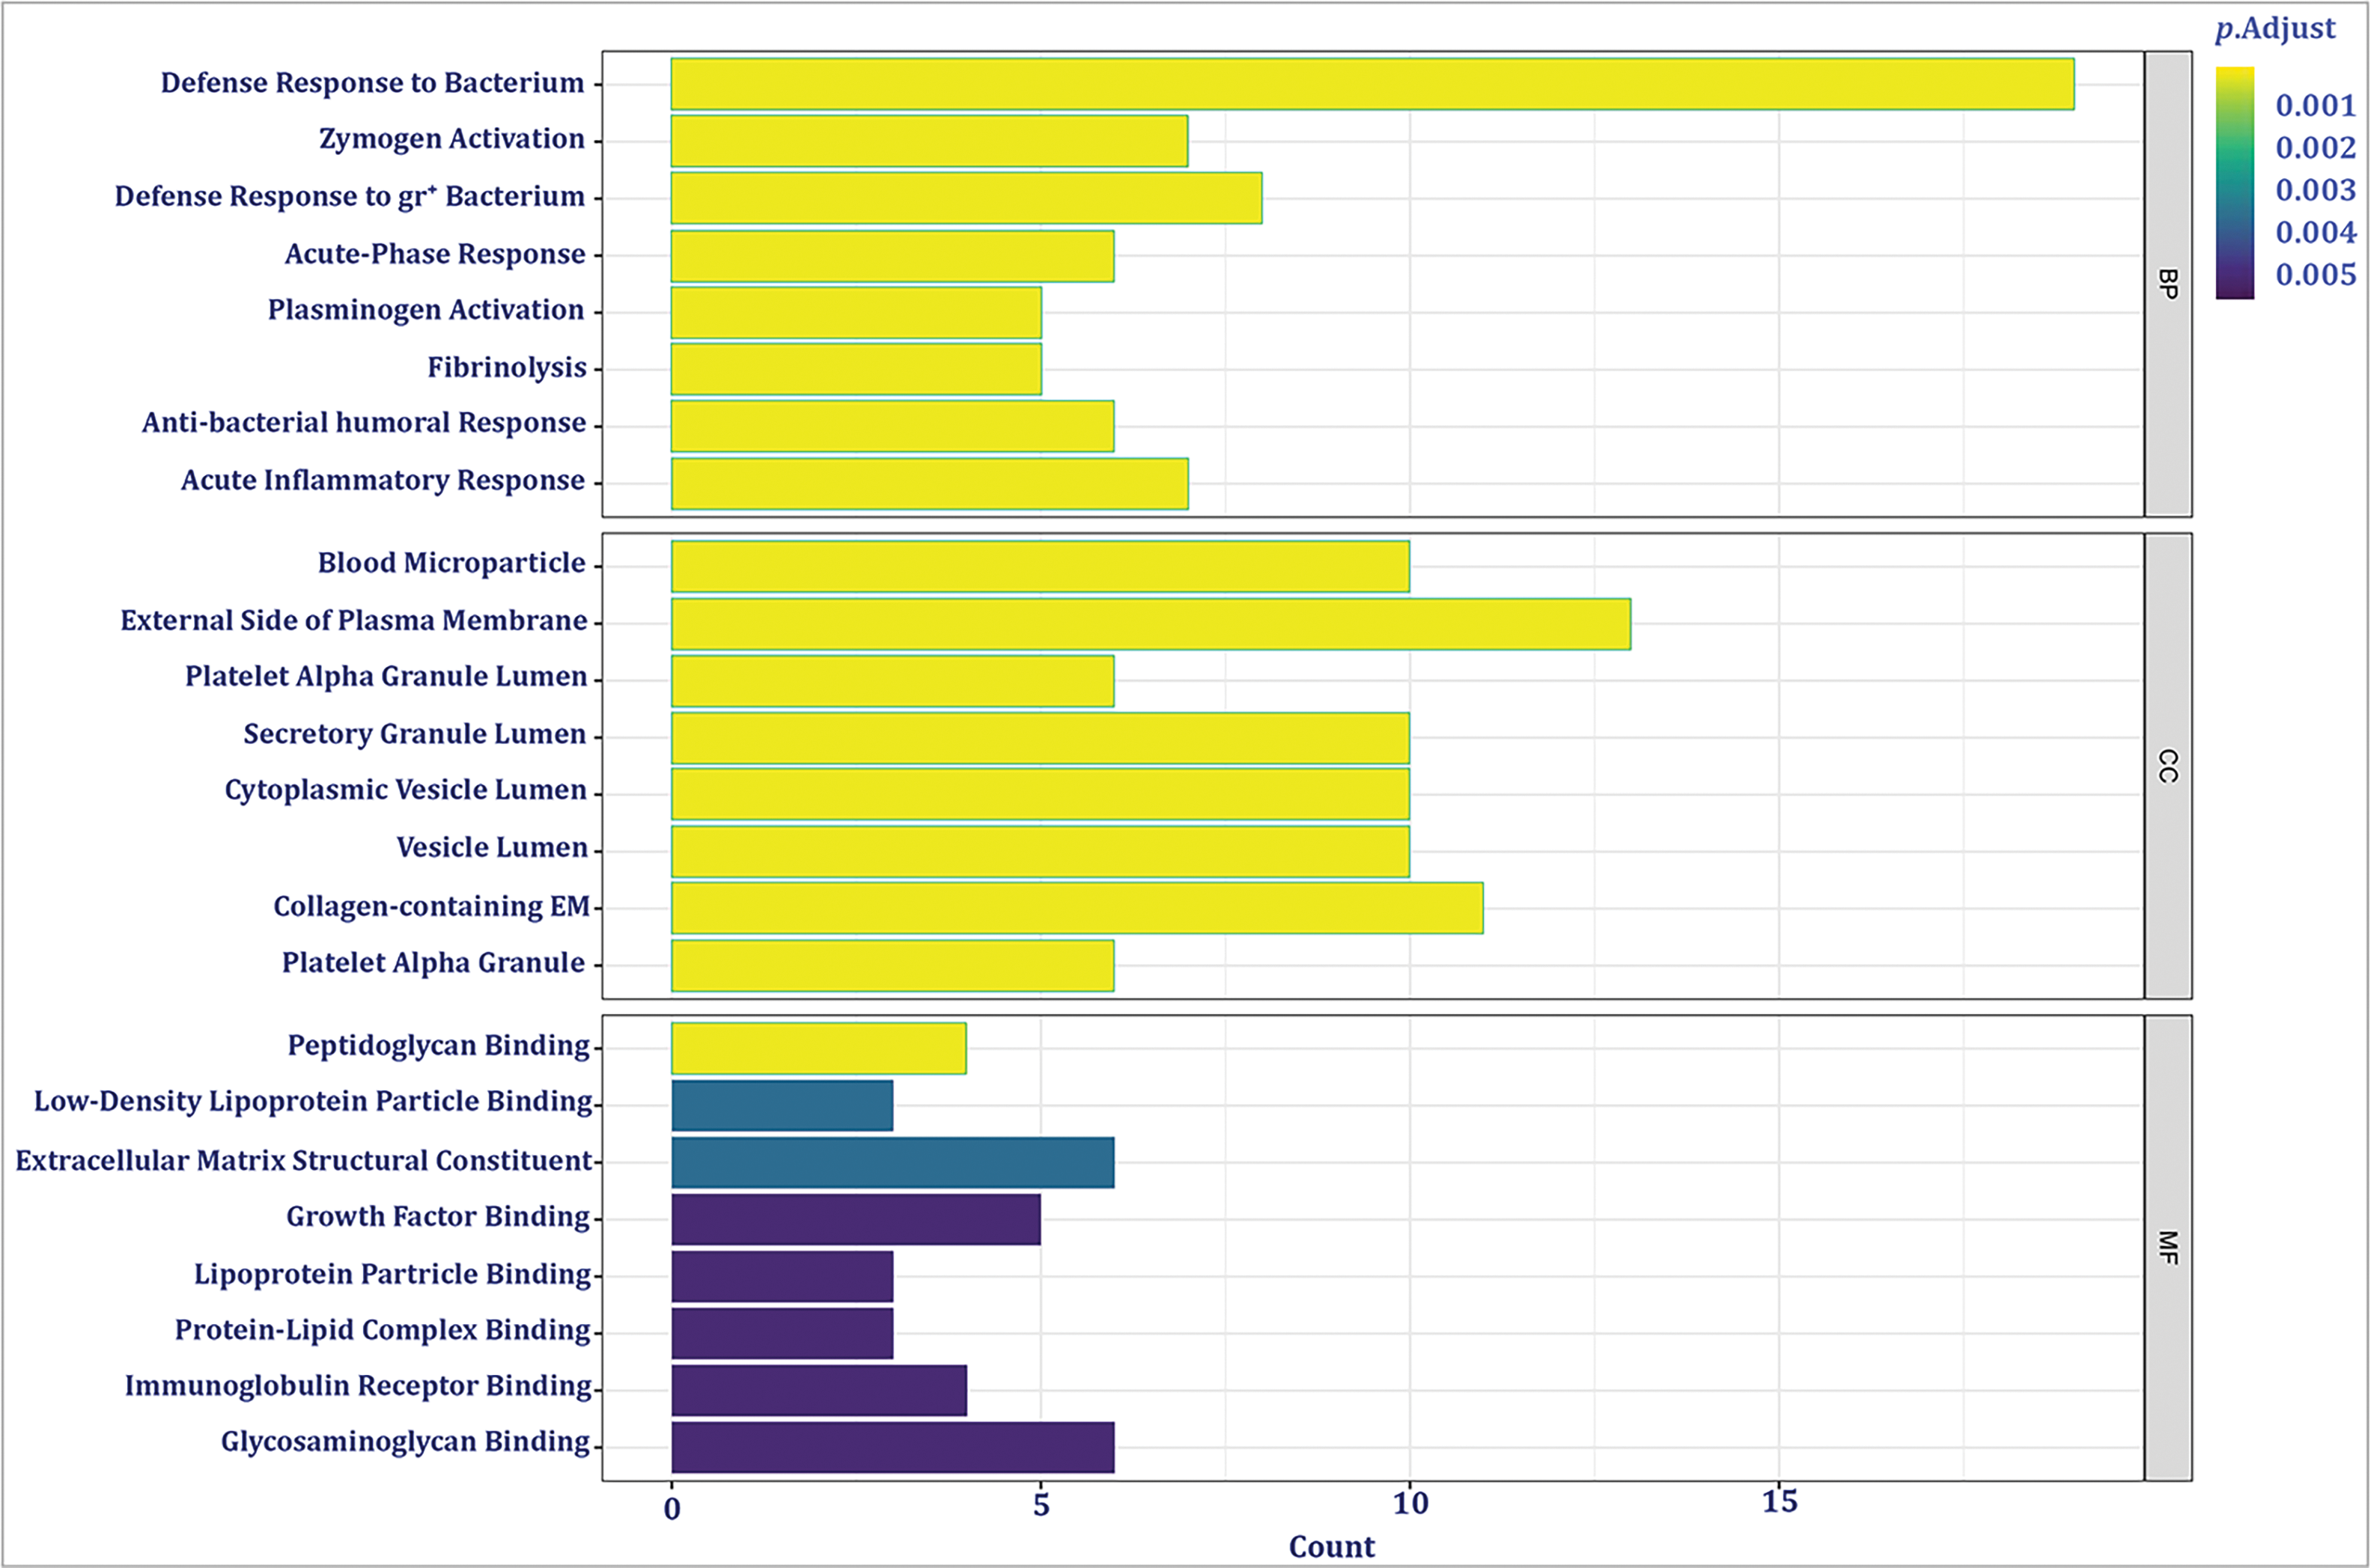
Figure 4: The most significant enriched Gene Ontology (GO) groups for the confirmed DE-BRGs.


Development of prognostic prediction model according to risk score
To develop a prognostic prediction model, we initially performed a univariate Cox regression analysis using the training cohort. This analysis aimed to identify DE-BRGs that were meaningfully related to overall survival (OS) (p < 0.05). As a result, 21 DE-BRGs demonstrated significant correlations with OS; detailed information can be found in Table 3. To further refine the predictive gene set and minimize overfitting, we utilized LASSO Cox regression analysis; this analysis helped remove genes with huge correlations and select the most informative and independent predictors. Consequently, 12 DE-BRGs were identified as potential predictors (Fig. 5A,B). Finally, we employed multivariate Cox regression analysis using the these DE-BRGs to construct the prognostic prediction model. The coefficients obtained from the multivariate Cox regression analysis are presented in Table 4. These coefficients were then used to calculate the risk score for every single one of the patients employing the subsequent equation:


Figure 5: Development of prognostic prediction model. (A) LASSO coefficients of the 21 DE-BRGs. (B) The prognostic risk score model construction.

Risk score = (PLK1 exp. × 0.08319) + (NCAPG exp. × 0.25369) + (VIPR1 exp. × −0.0514) + (SLC22A1 exp. × −0.0194) + (LCAT exp. × 0.00526) + (SFN exp. × 0.08608) + (FMO3 exp. × −0.057) + (ASS1 exp. × −0.03) + (FGB exp. × −0.0212) + (ADAMTSL2 exp. × −0.0923) + (CD4 exp. × 0.1876) + (JCHAIN exp. × −0.042).
In this formula, “exp.” denotes the expression quantity of the respective gene. Each gene’s expression level is multiplied by its corresponding coefficient, and the accumulation of these products determines the risk score for each patient.
Verification of the prognostic prediction model
To validate the prognostic prediction model, we utilized both the total and testing sets as internal validation datasets. The HCC patients in all three sets were separated into low- and high-risk groups according to an optimal cut-off determined by a specific criterion. To evaluate the predictive capability of the prognostic model, we examined the survival changes between the low- and high-risk strata in each cohort employing Kaplan-Meier curves analysis. The results showed a noteworthy distinction in OS between the predicted risk groups in all sets, with high-risk patients demonstrating poorer outcomes (Fig. 6A–C). To further assess the precision of the model, time-dependent ROC curves were generated. The AUC values were calculated for one-, three-, and five-year survival predictions. In the training set, the AUC values were 0.770, 0.733, and 0.703, respectively (Fig. 6D); indicating that the model has the potential to predict the HCC patient’s survival accurately. The AUC values of test and total cohort were also demonstrated in Fig. 6E,F. Additionally, the spread of risk scores and status of survival was analyzed, revealing that patients with greater risk scores had a higher likelihood of encountering unfavorable survival outcomes (Fig. 6G–L).
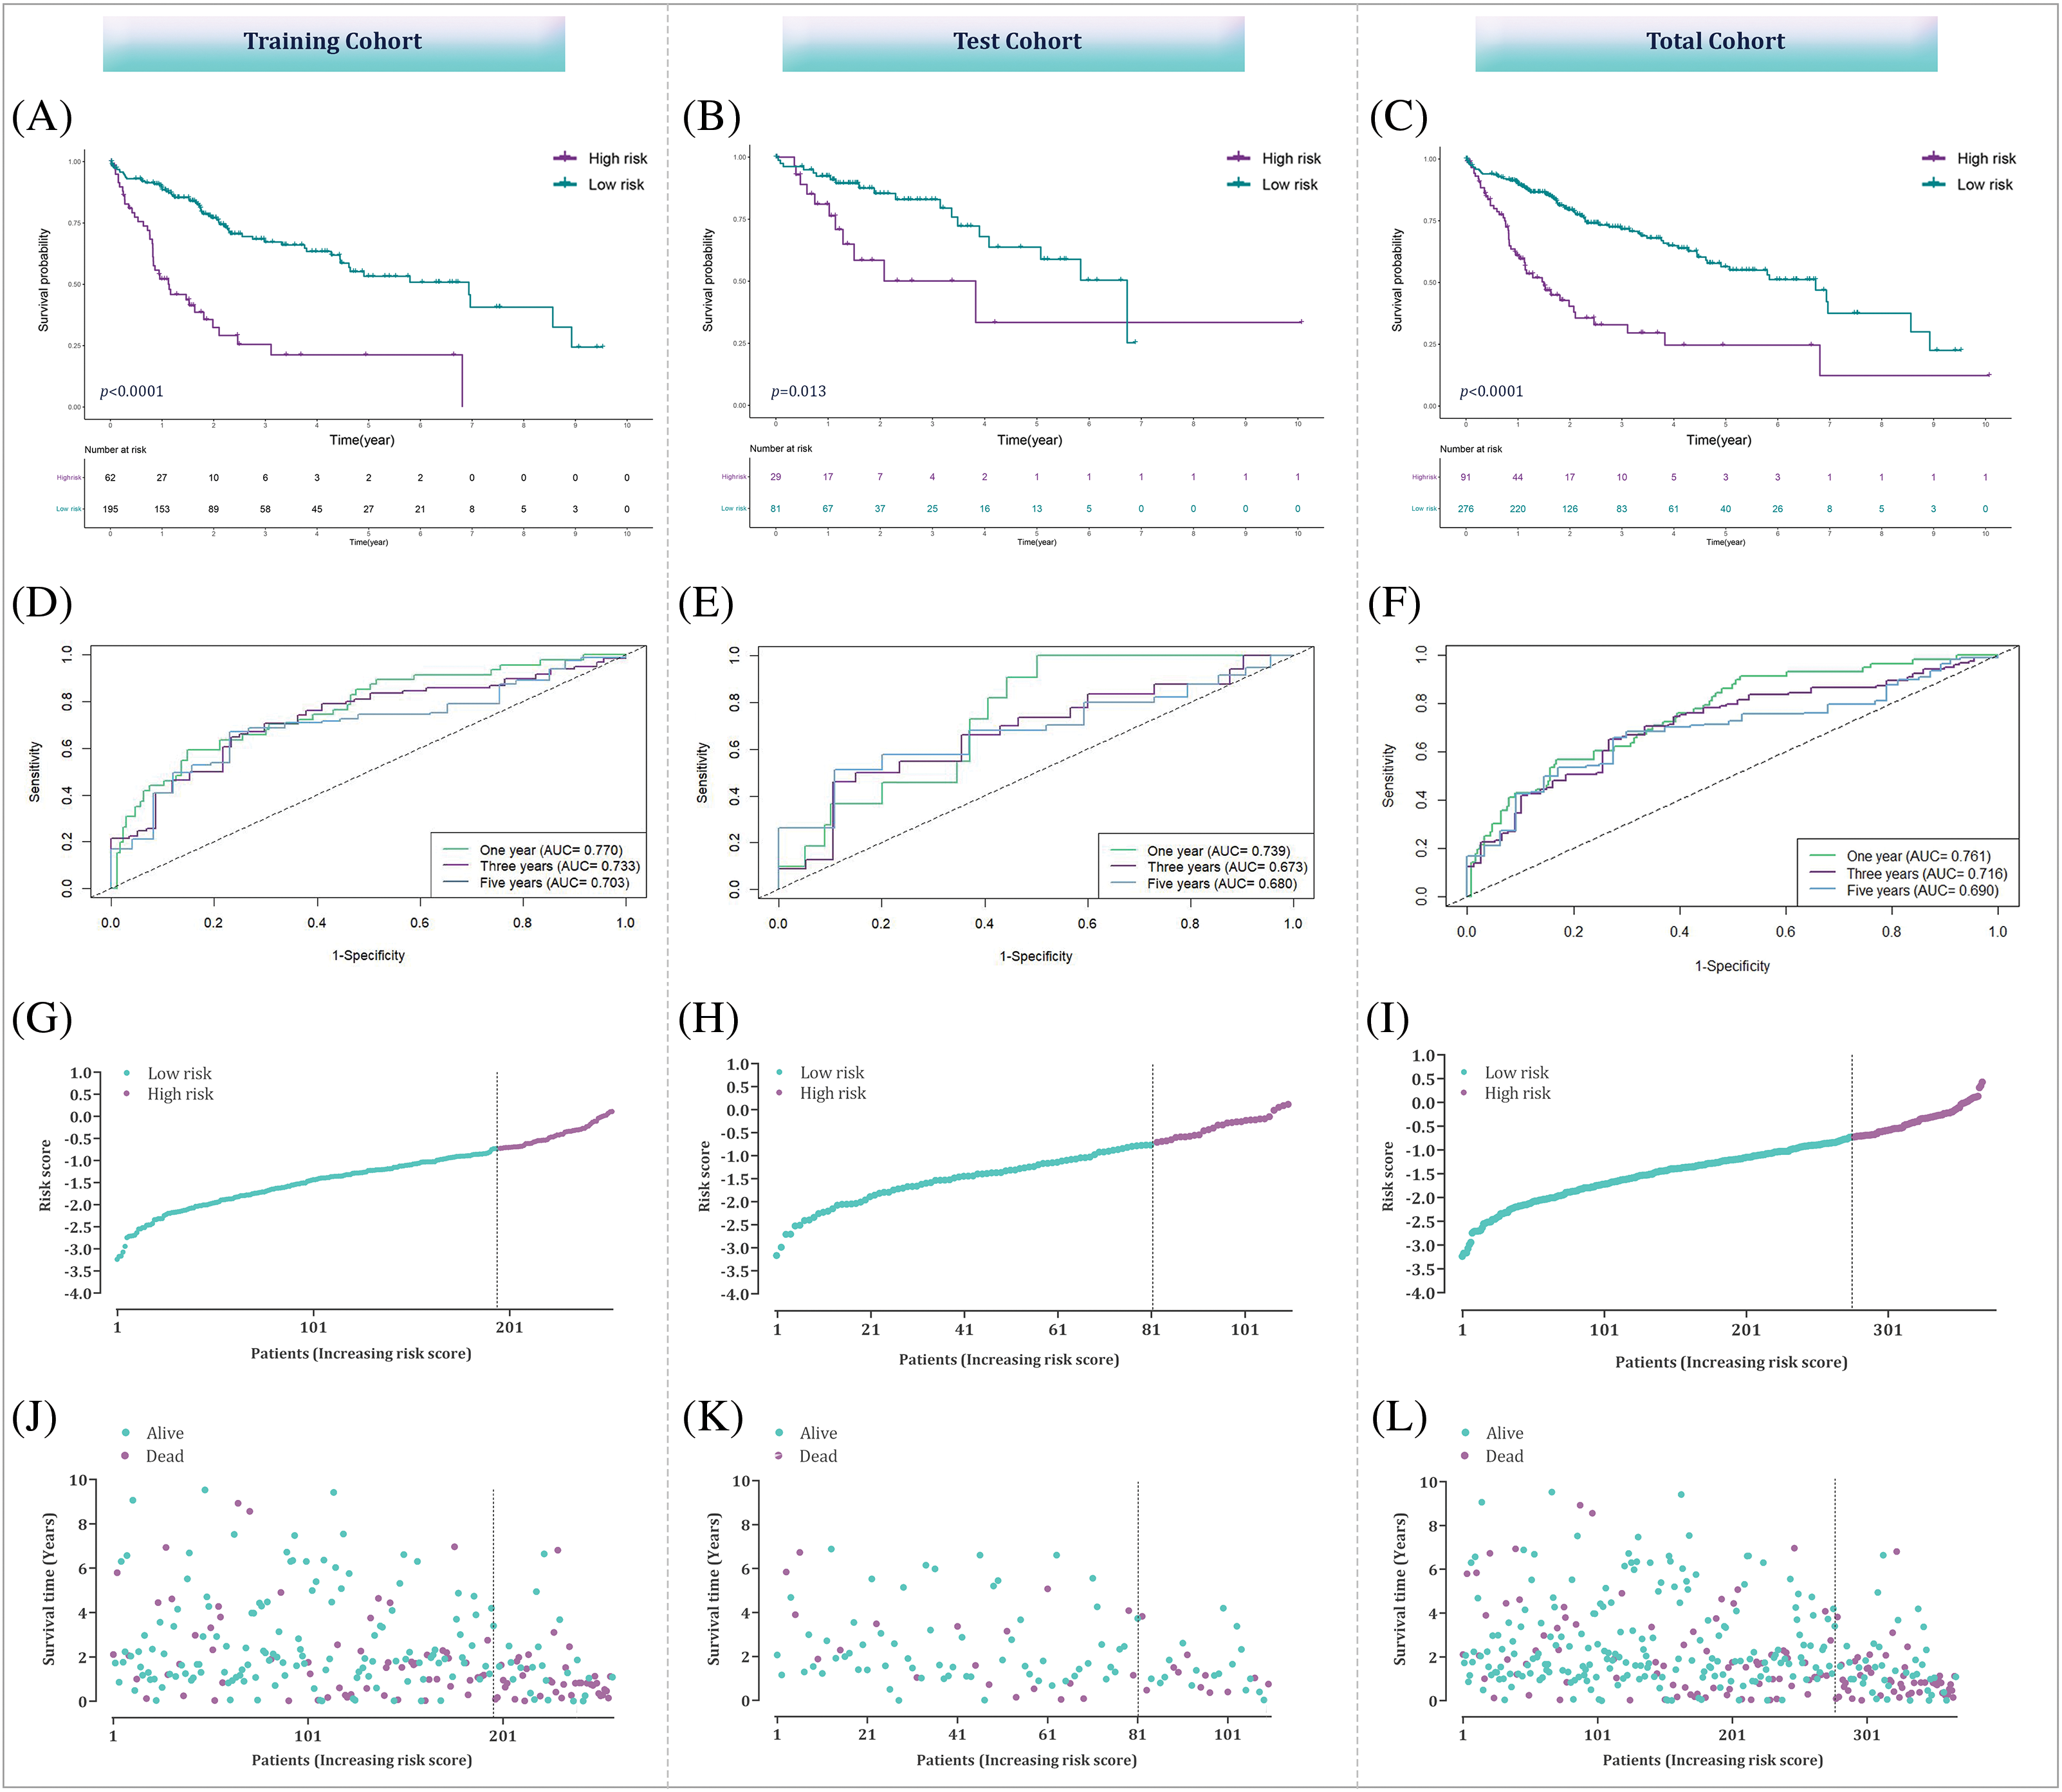
Figure 6: Assessment of the bacterial response-related signature across total, training, and testing datasets. (A–C) Kaplan-Meier curves illustrating the differences between high-risk and low-risk groups within the training, testing, and combined datasets. (D–F) ROC curve analysis to evaluate the performance of the prognostic prediction model in the training, testing, and overall datasets. (G–L) Analysis of risk score distribution alongside survival status in the training, testing, and overall datasets.
Of note, to validate the model externally, a separate validation dataset (the GSE14520 dataset) was utilized; the Kaplan-Meier curves analysis exhibited a more suitable outcome for patients in the low-risk group, reinforcing the predictive capability of the risk signature (Fig. 7). Overall, the validation outcomes indicate that the prognostic prediction model based on the bacterial response-related gene signature shows satisfactory predictive performance in both internal and external validation datasets, providing promising potential for predicting the survival of HCC patients.

Figure 7: External verification of the bacterial response-related signature in the GSE14520 cohort. (A) Kaplan-Meier analysis depicting the survival outcomes of high-risk vs. low-risk groups in the GSE14520 cohort. (B) ROC curve analysis to evaluate the efficacy of the prognostic prediction model within the GSE14520 cohort.
Assessment of the prognostic prediction model
Relation between the model and clinicopathological characteristics
To further understand the clinical relevance of the prognostic prediction model based on the 12-BRG risk score, we examined the association between the risk score and various clinicopathological characteristics of HCC patients.
The outcomes of the Wilcoxon rank sum test revealed a substantial association between the 12-BRG risk score and advanced clinical stage and T classification (p-value < 0.0001) (Fig. 8); highlighting that patients with higher risk scores tend to have more advanced disease stages and larger tumor sizes. The observed relation between the model’s risk score and clinicopathological characteristics suggests that the prognostic significance of the model may, at least partly, be attributed to its correlation with these features.
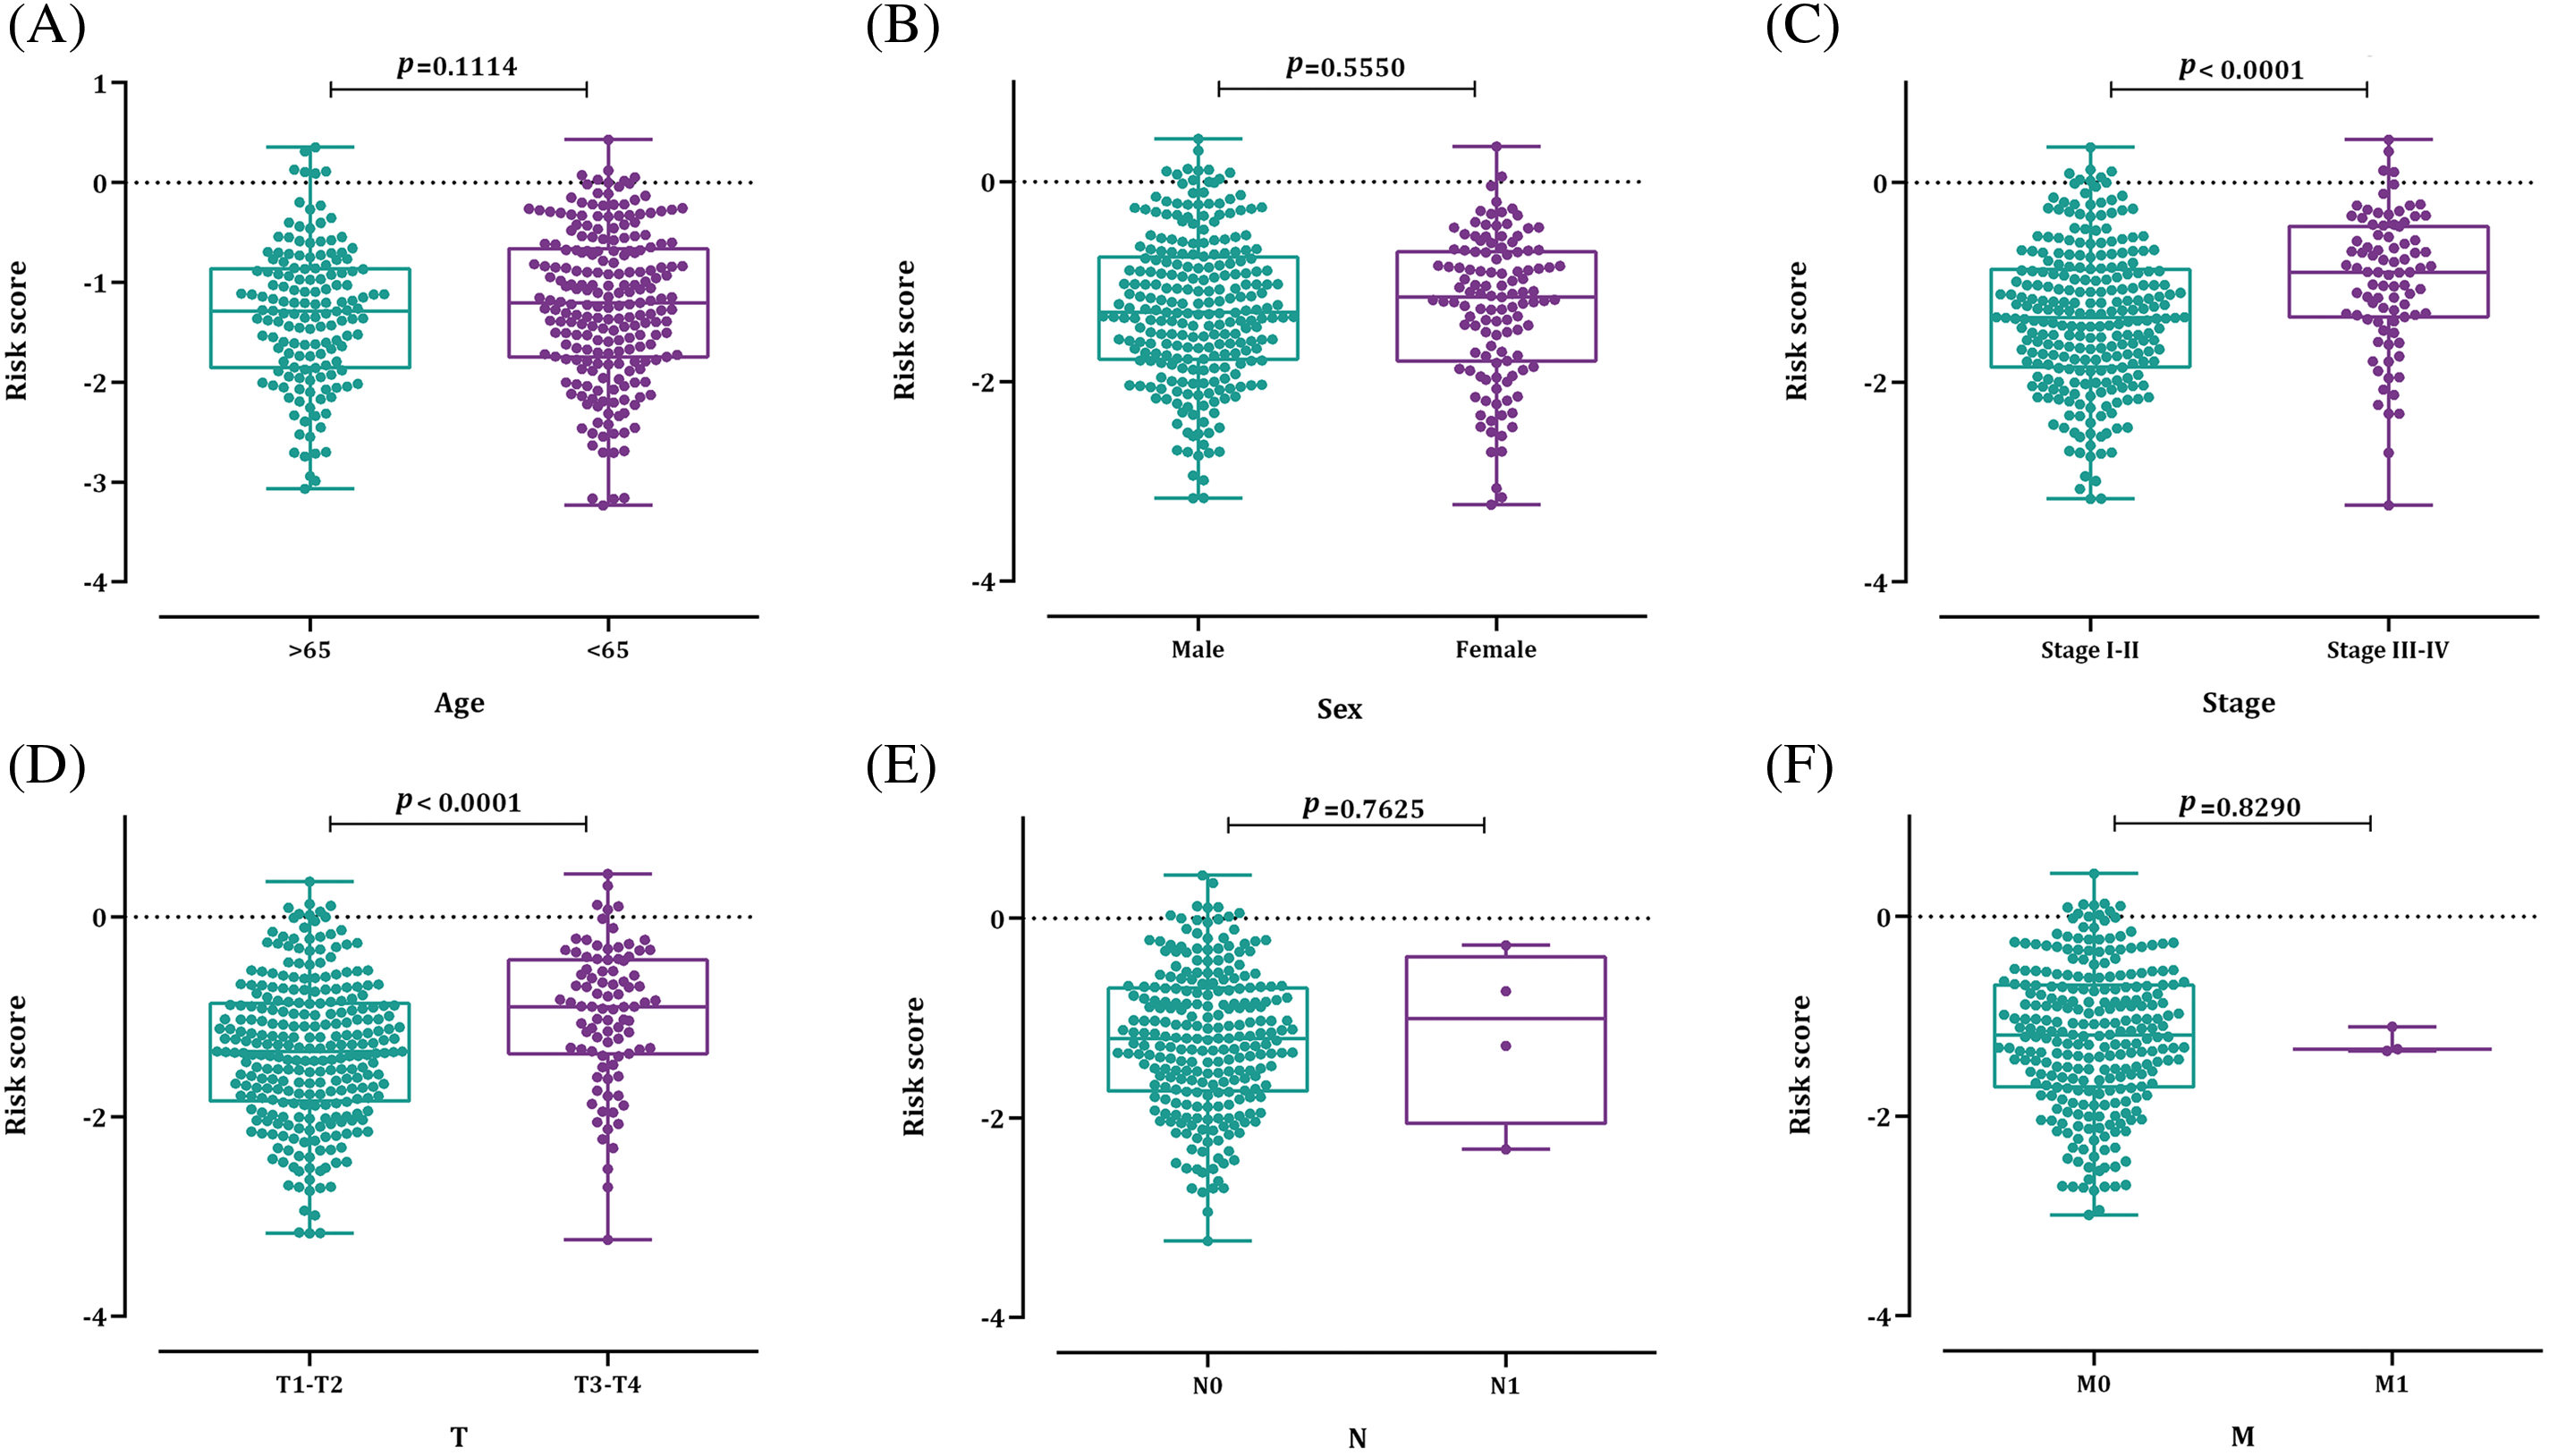
Figure 8: The relation between the bacterial response-related risk signature and (A) age; (B) sex; (C) HCC stage; (D) T stage; (E) N stage; and (F) M stage.
Independency of the prognostic model
To assess the independent prognostic significance of the risk score, univariable Cox regression analysis and multivariable Cox regression analysis were executed. The results indicated that advanced clinical stage, T and M stages, and a high-risk score were associated with unfavorable OS outcomes. However, the most significant association with OS was observed for the risk score in the multivariable Cox regression analysis (HR = 3.378, p = 1.99e–08) (Fig. 9); suggesting that the risk score derived from the BRG signature has an independent prognostic value in HCC patients irrespective of disease stage, age, and TNM stages. In other words, even after accounting for these traditional clinicopathological factors, the risk score remains a significant predictor of patient survival.
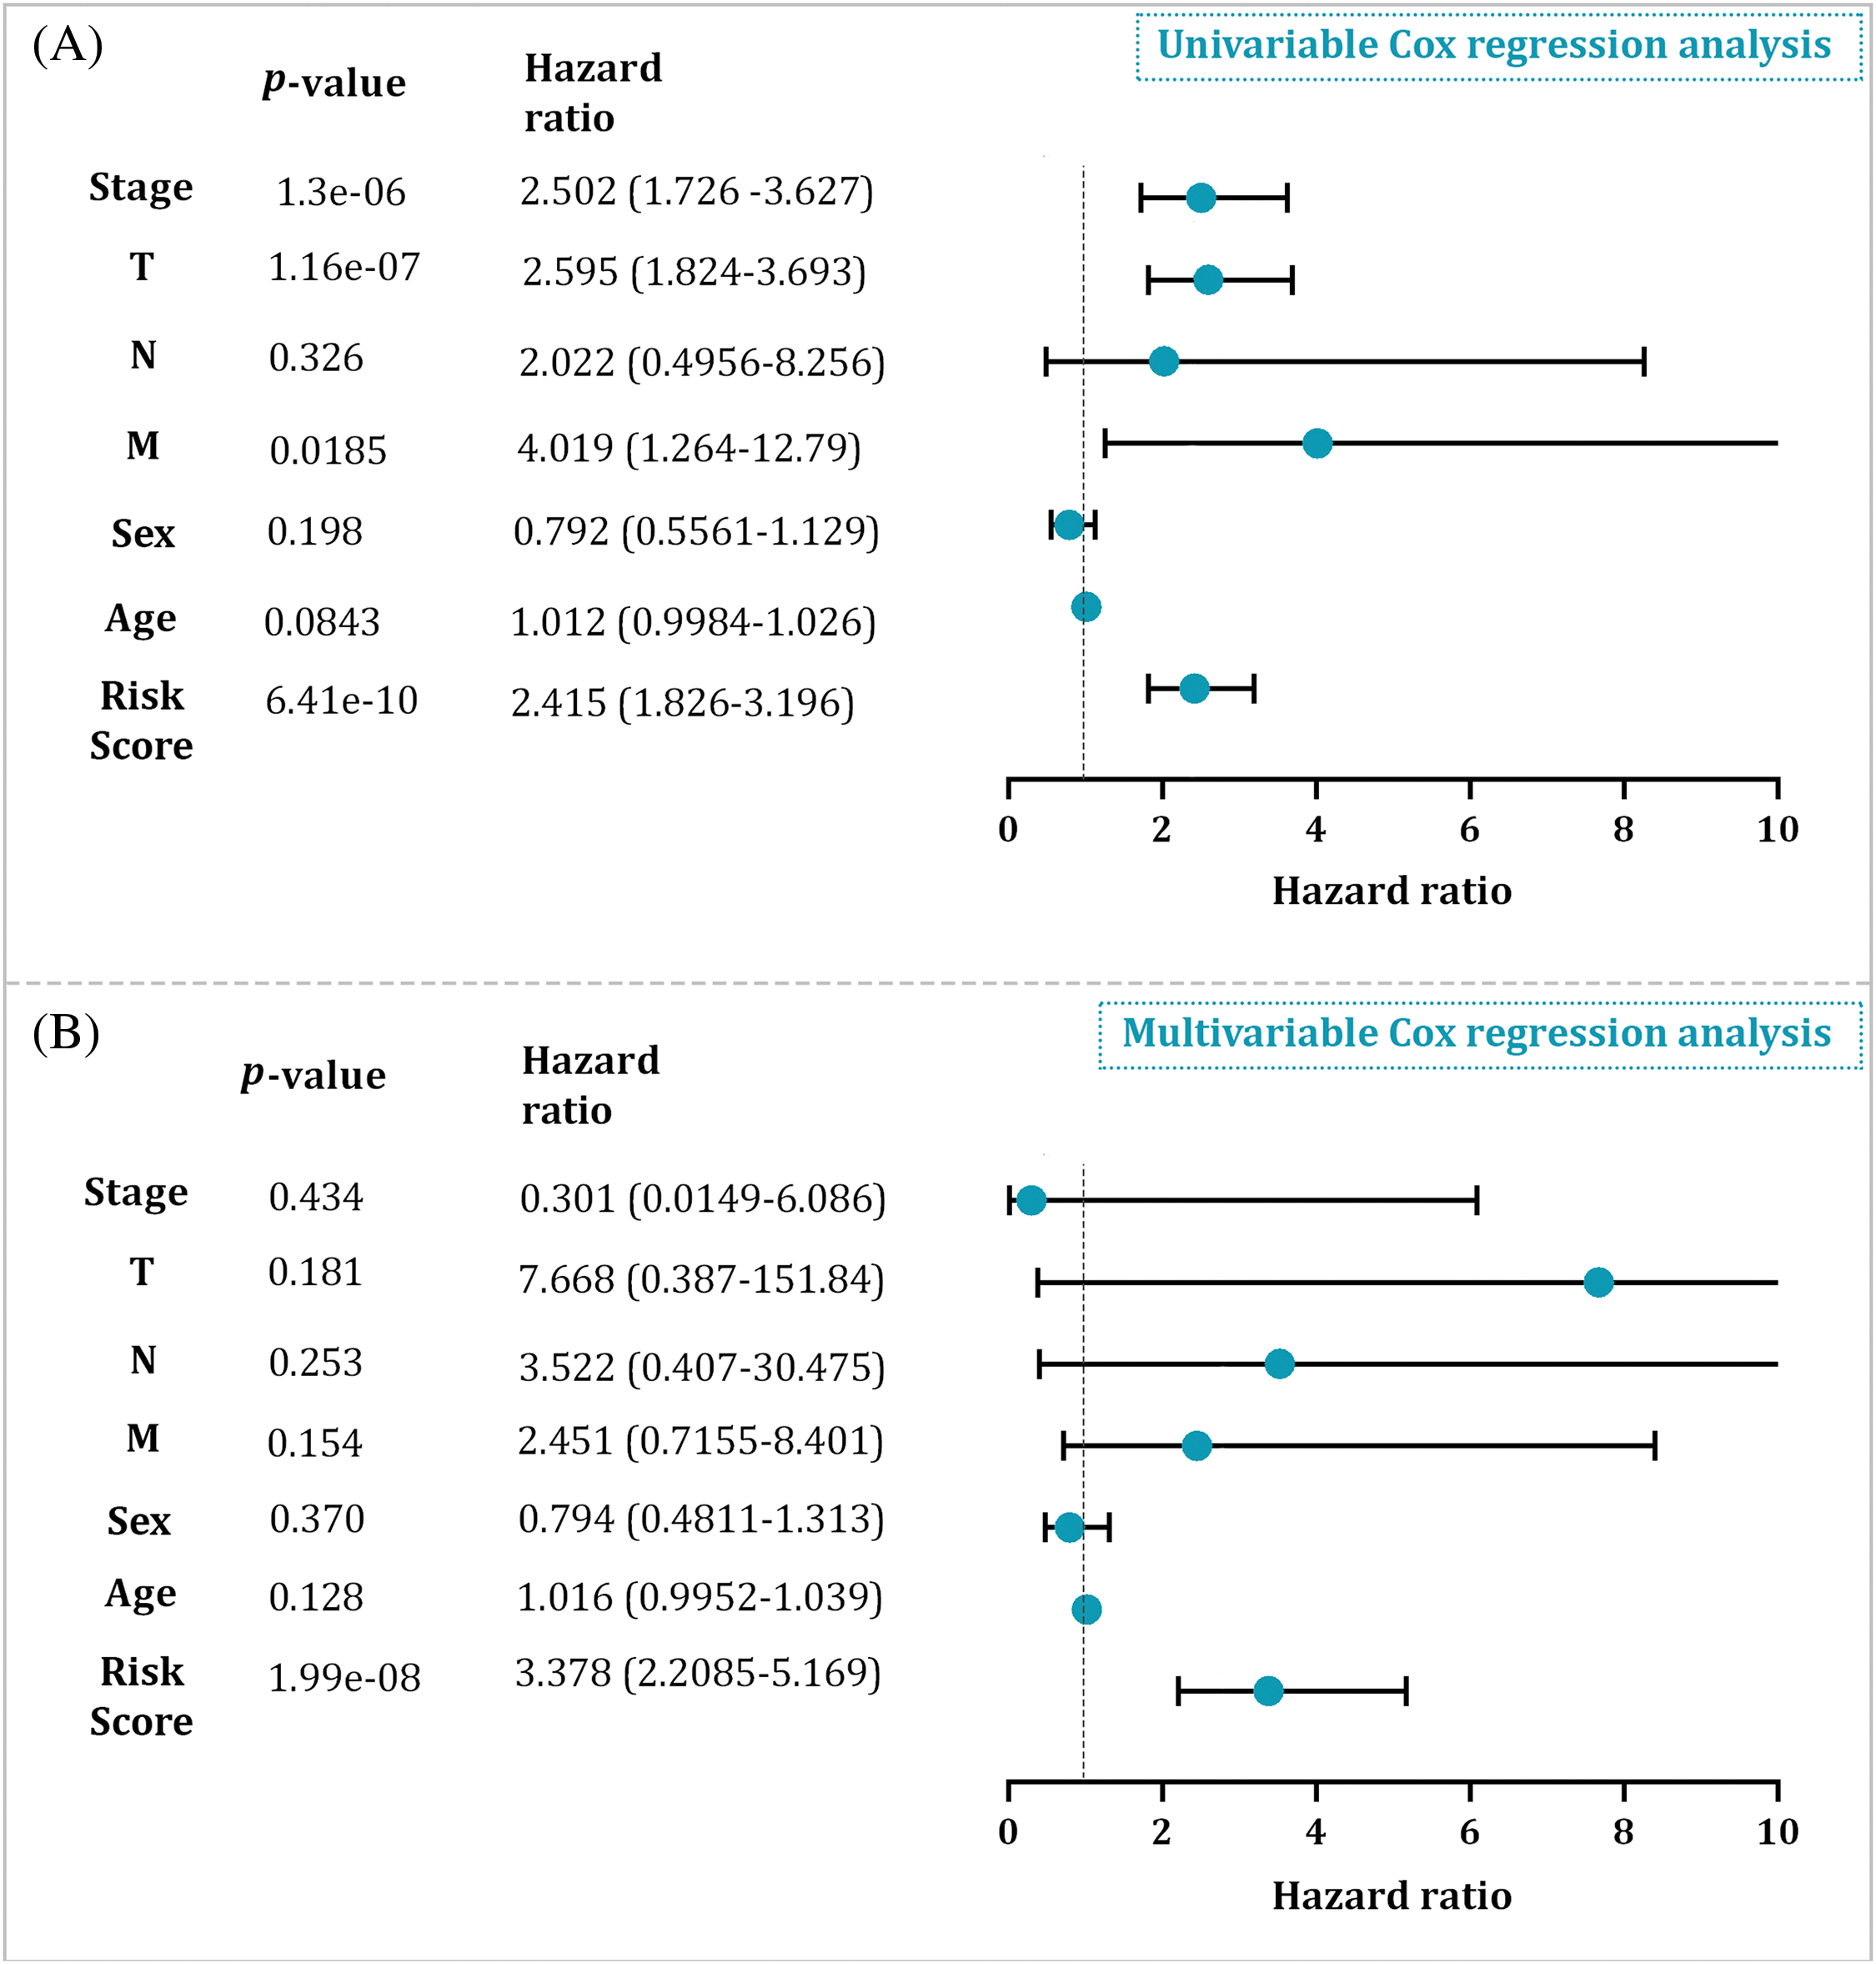
Figure 9: (A) The univariable Cox regression analysis result in the entire cohort. (B) The multivariable Cox regression analysis result in the entire cohort.
Relation between the risk score and TIICs
The relation between the risk score derived from the BRG signature and TIICs was investigated to gain insights into the tumor immune microenvironment of HCC patients. The analysis revealed significant alterations in the proportions of various immune cell subsets between the high- and low-risk groups. Specifically, the high-risk group exhibited a significant decrease in the proportions of resting CD4+ memory T cells (p = 5.504e–05), γδ-T cells (p = 0.0007), resting dendritic cells (p = 0.0386), M1 macrophages (p = 0.000127), and resting mast cells (p = 0.0001) (Fig. 10A,B). Furthermore, the Spearman correlation analysis demonstrated a negative relationship between the risk score and the proportions of resting CD4+ memory T cells (p = 4.806e–07), γδ-T cells (p = 3.1e–05), M1 macrophages (p = 0.0022), and resting mast cells (p = 0.022); representing that as the risk score rises, the proportions of these immune cell subsets tend to decrease. Conversely, some other immune cell populations, including regulatory T cells (p = 8.03e–06), T follicular helper cells (p = 5.275e–07), neutrophils (p = 0.00078), and M0 macrophages (p = 2.978e–07) showed a positive association with the risk scores of HCC patients (Fig. 10C).
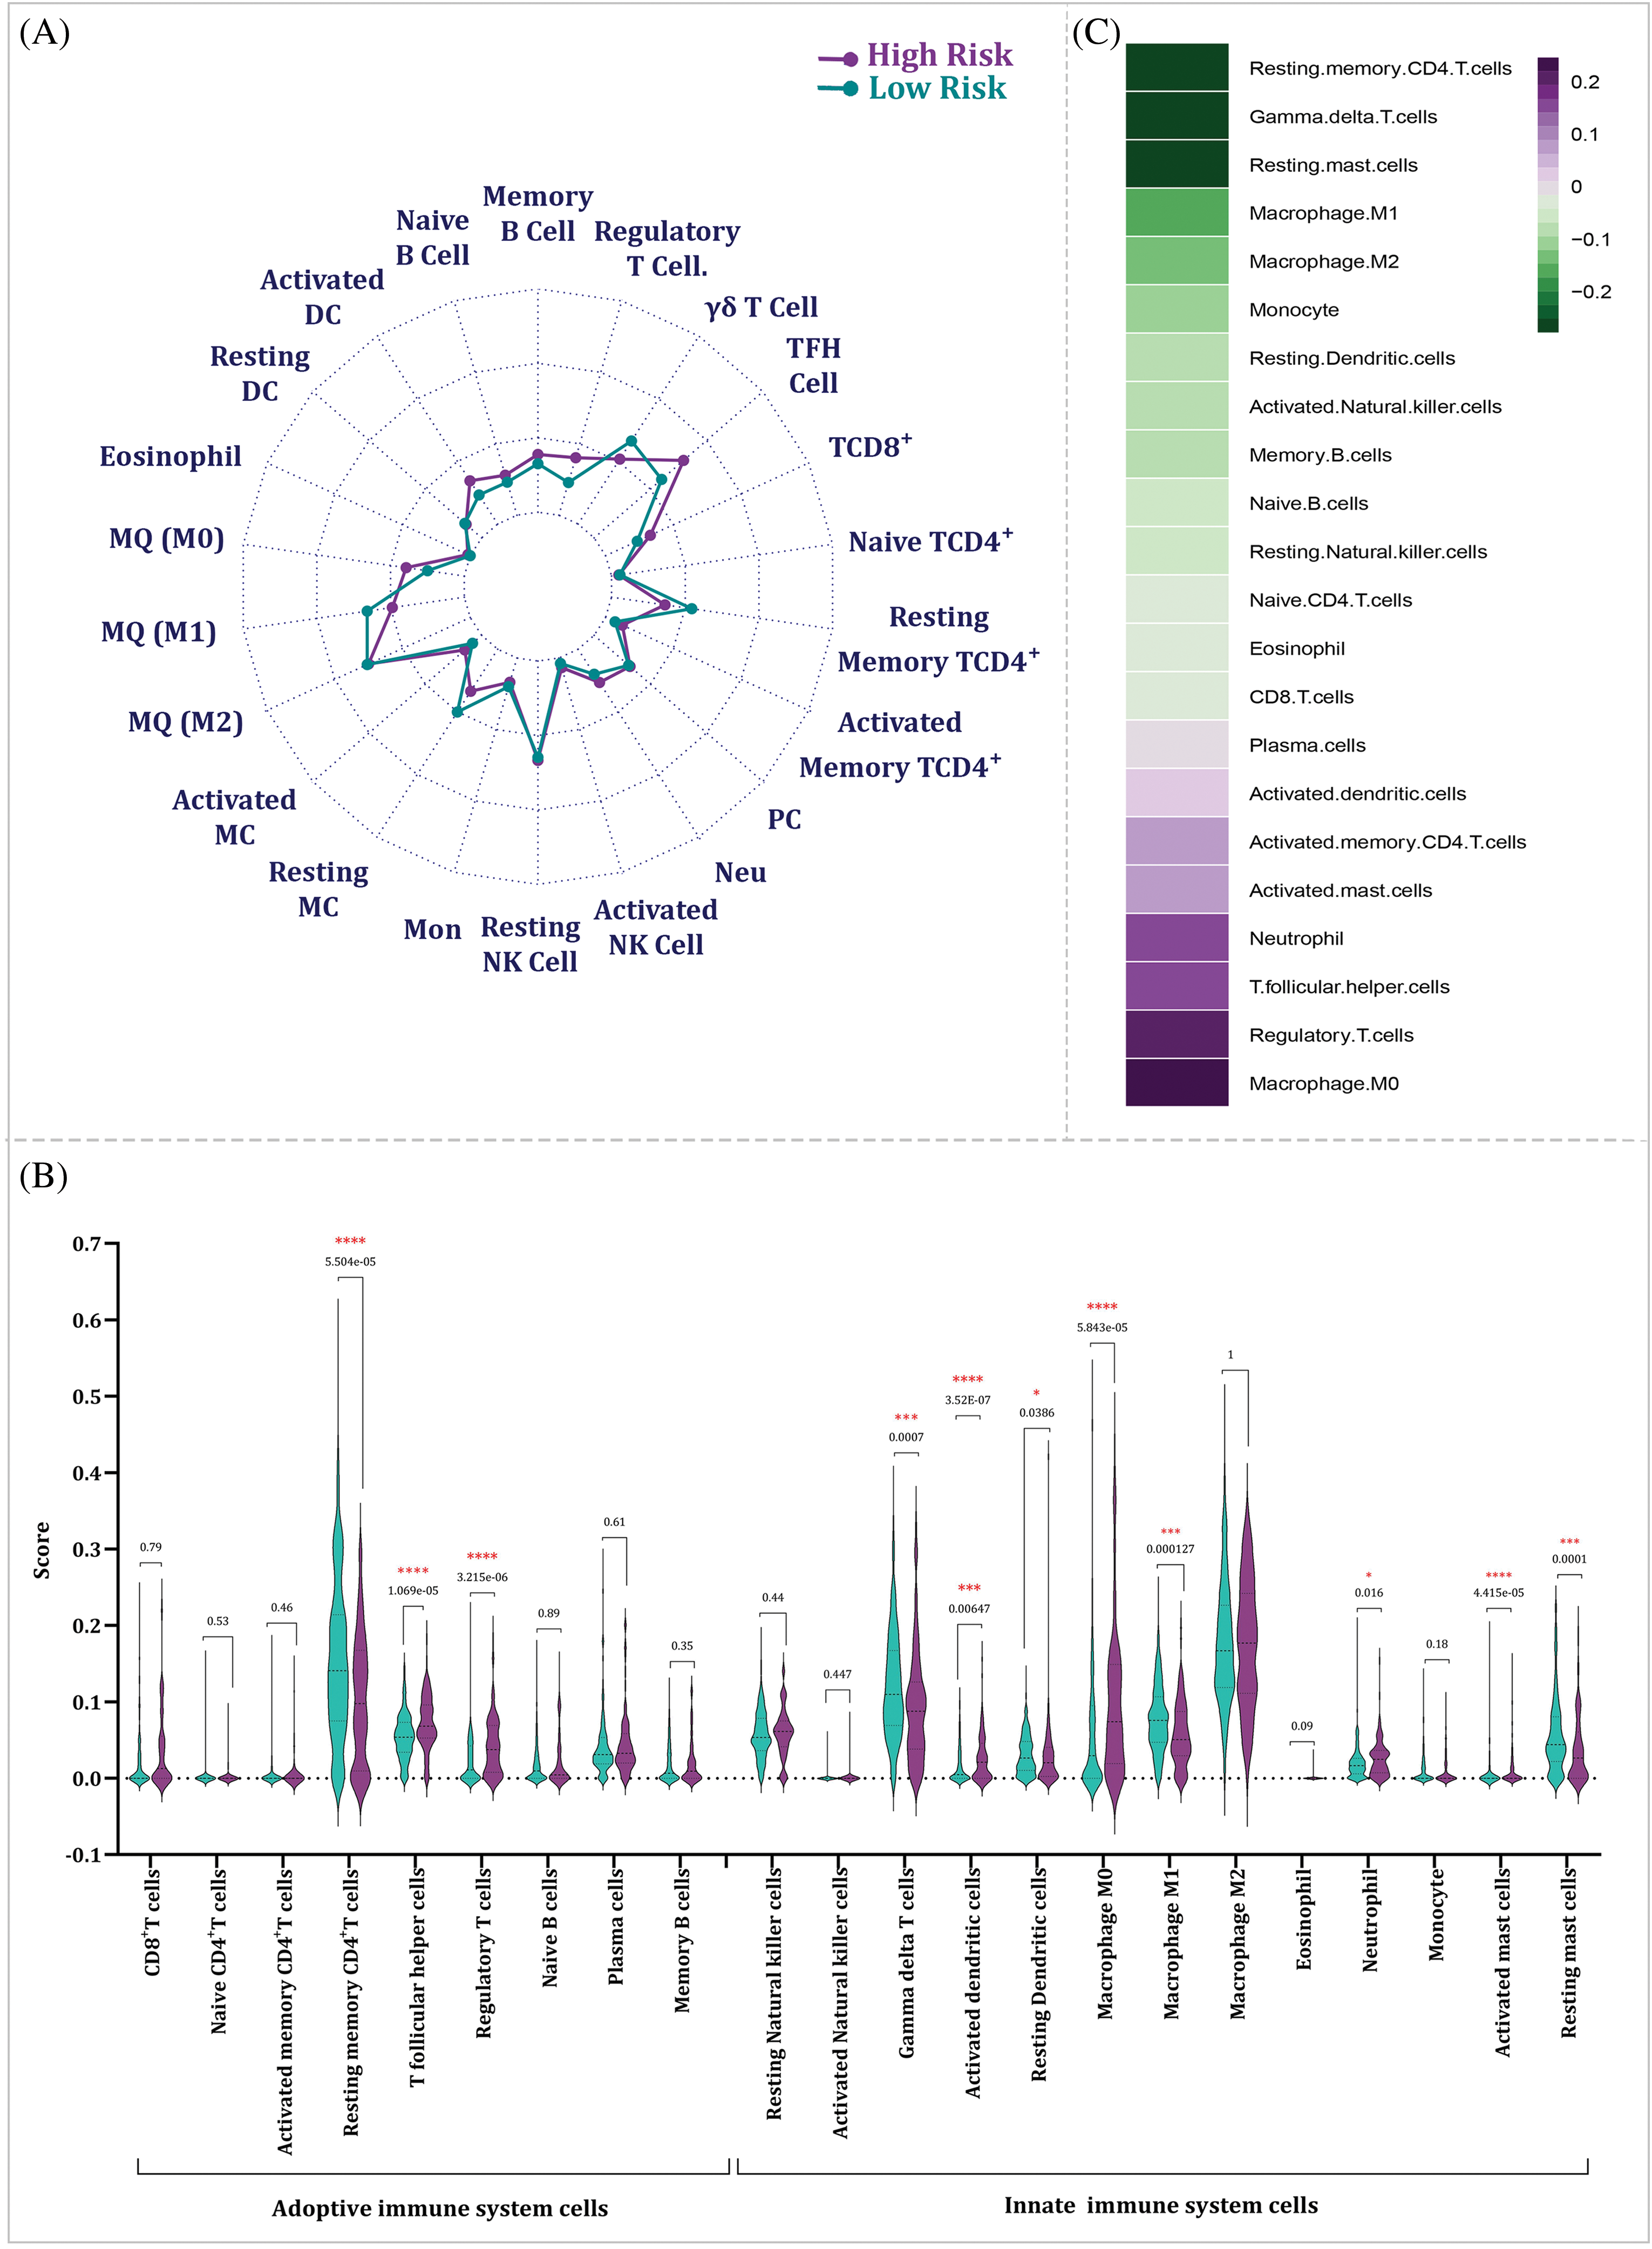
Figure 10: The link among risk score and TIICs. (A) The dissimilarity of TIICs between high- and low-risk groups. (B) Violin plot showing the dissimilarity of TIICs between high- and low-risk groups by p-value. The significancy is depicted by star. (C) The Spearman correlation test among risk scores and TIICs (TFH: T follicular Helper; PC: Plasma Cell; Neu: Neutrophil; NK: Natural Killer; Mon: Monocyte; MC: Mast Cell; MQ: Macrophage; DC: Dendritic Cell).
Relation between the risk score and mutational signature
To explore the connection among the risk score and the mutation profile of HCC patients, we examined the mutation status for every patient. The top 10 most meaningfully altered genes for the low- and high-risk groups were identified and depicted in Fig. 11A,B, respectively. Additionally, we measured the tumor mutational burden (TMB) for each sample, showing that TMB was meaningfully greater in the high-risk group (p < 0.0001) (Fig. 11C). Of note, this finding suggests that high-risk patients display a higher number of mutations in their tumor genomes compared to low-risk patients. Kaplan-Meier was also estimated to examine the correlation between TMB and OS. The results showed a significant difference in OS between the two TMB groups, with high-TMB patients exhibiting poorer outcomes (p = 0.0081) (Fig. 11D).
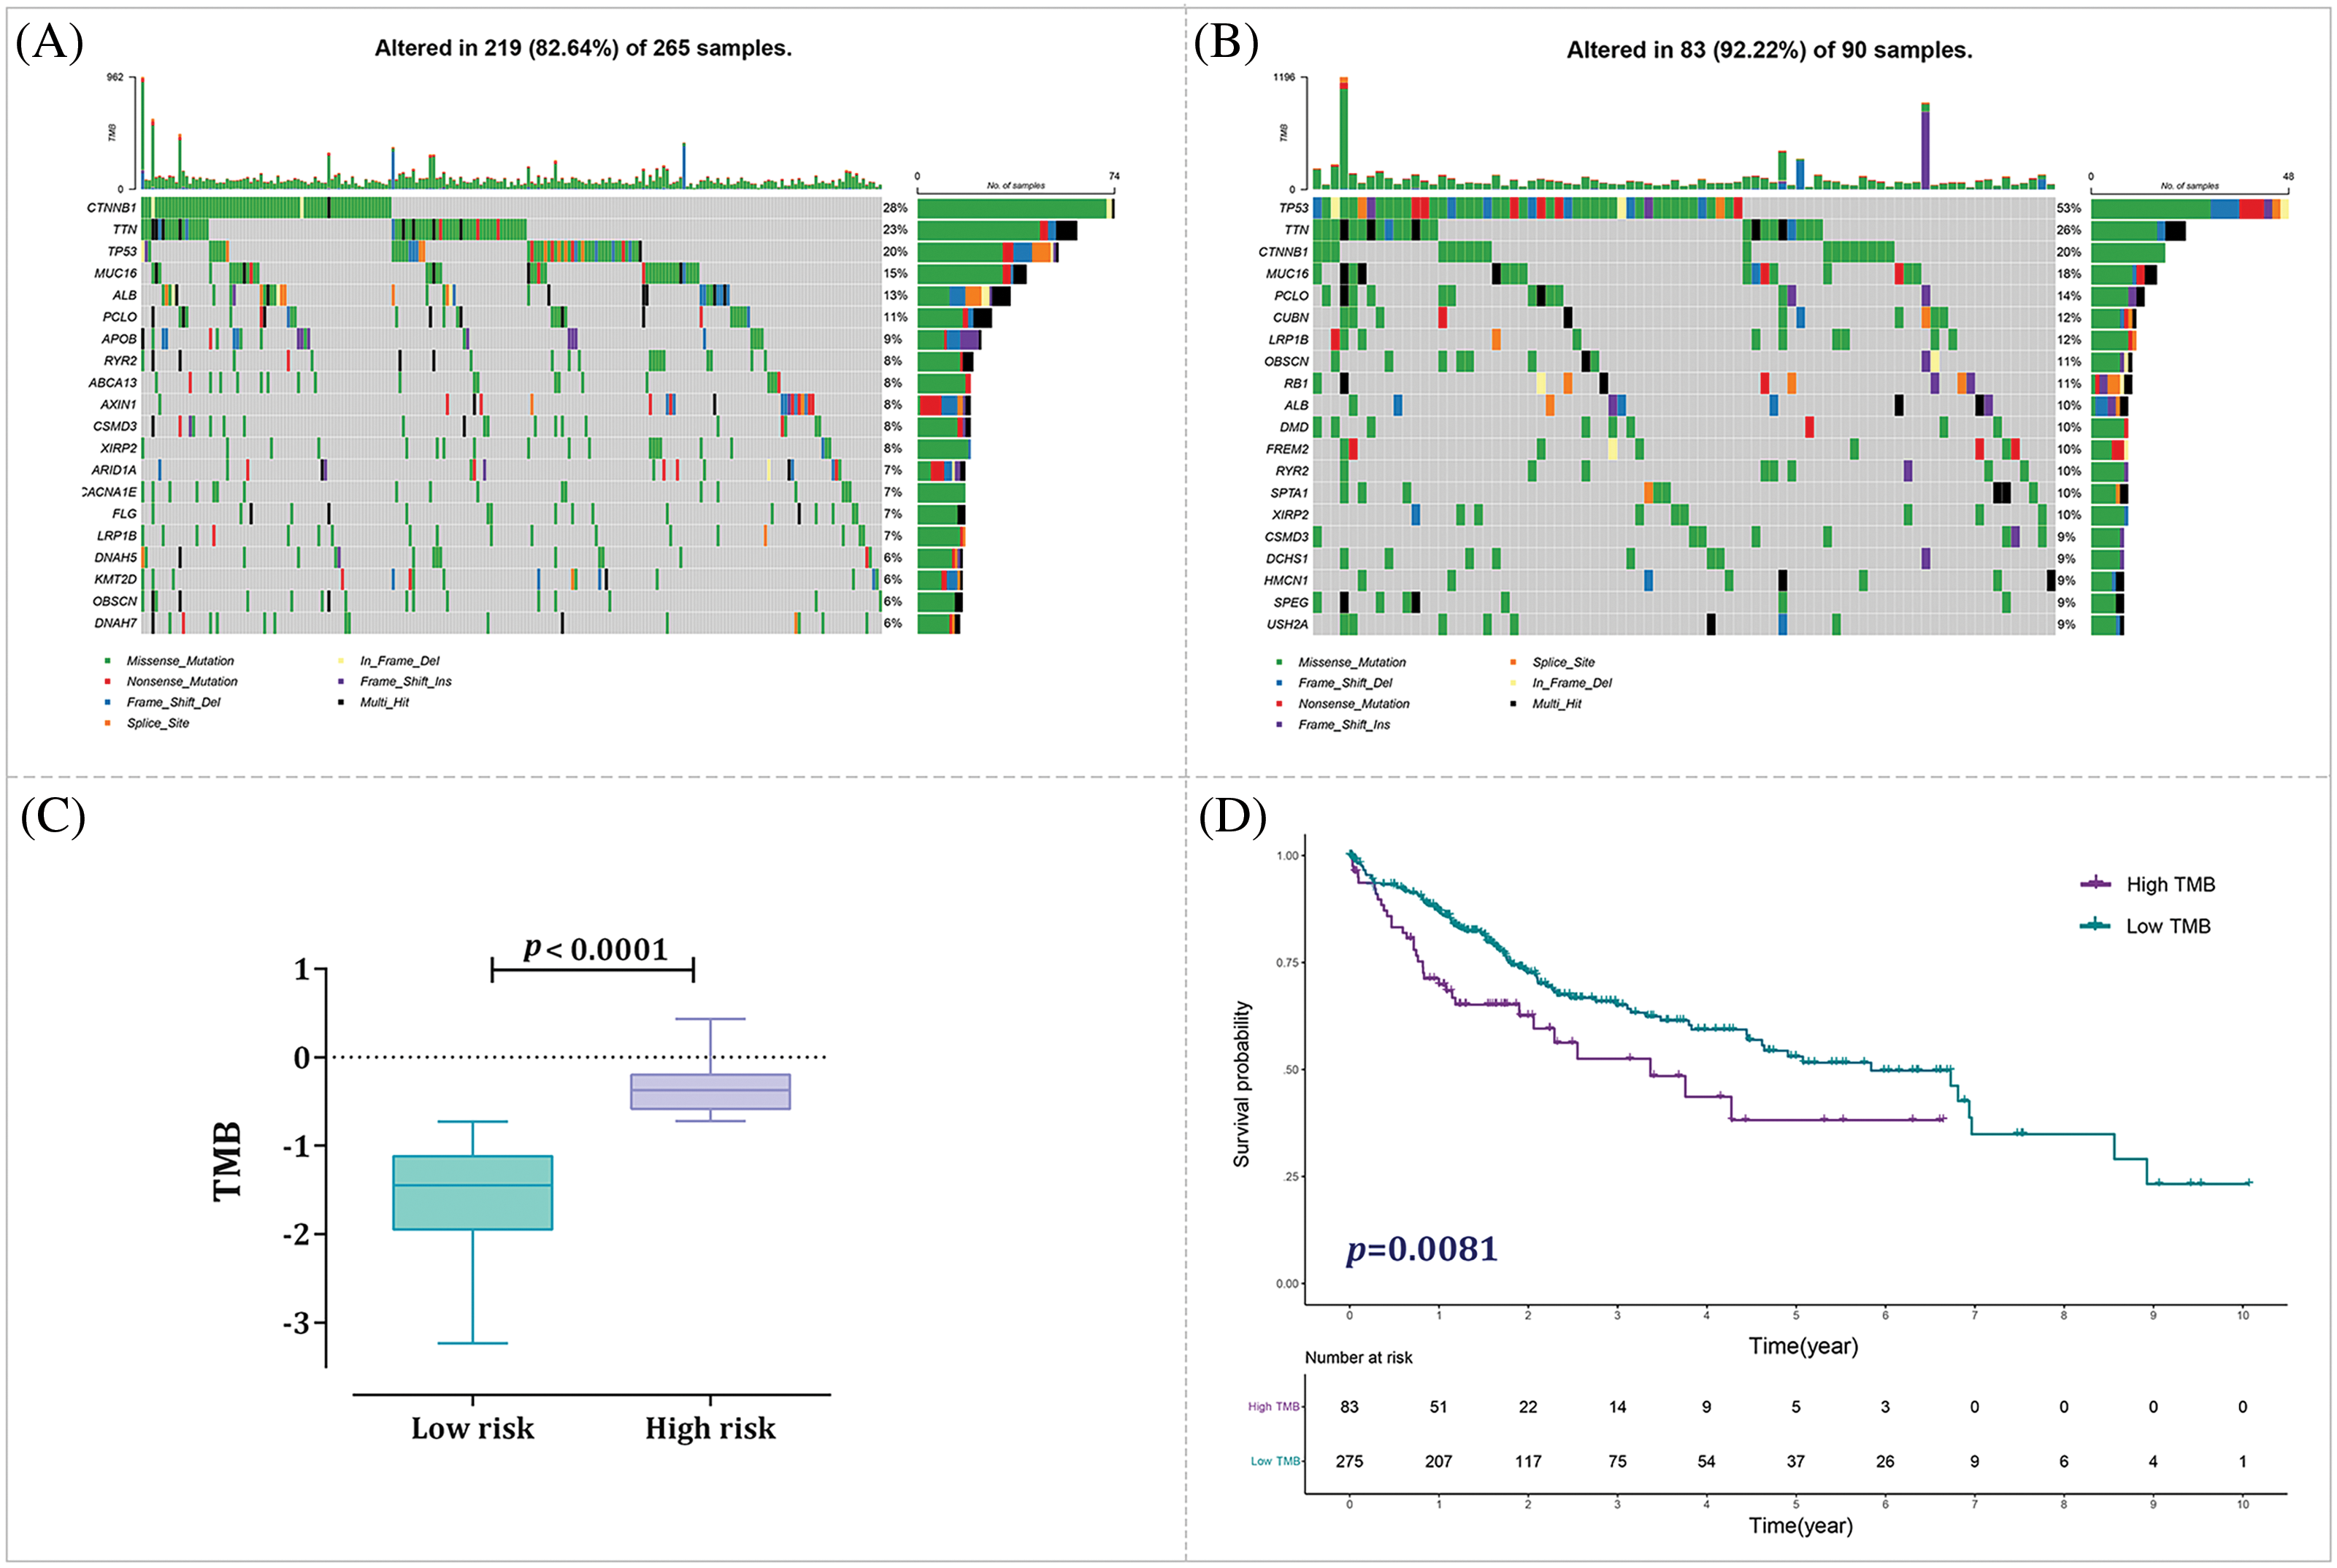
Figure 11: Analysis of tumor mutational burden (TMB) status in distinct risk groups. (A) Mutation profile of the low-risk group. (B) Mutation profile of the high-risk group. (C) Correlation analysis examining the relationship between TMB and risk score. (D) Kaplan-Meier curve analysis for high-TMB and low-TMB groups.
Nomogram Construction for predicting survival
Fig. 12A illustrates the OS predictive nomogram, a graphical tool that integrates various factors including age, sex, TNM staging, stage, and the prognostic risk score model. This nomogram serves as a predictive model for estimating OS in patients diagnosed with HCC. By incorporating multiple variables, the nomogram provides a comprehensive assessment of the patient’s prognosis. To validate the precision and reliability of the nomogram, we examined the calibration curves for the 1-, 2- and 3-year time points, as demonstrated in Fig. 12B. The calibration curves compared the predicted survival probabilities from the nomogram with the actual observed survival rates. The near alignment between the predicted and observed outcomes in the calibration curves indicates the effectiveness of the nomogram in accurately predicting OS in HCC patients at first-, second-, and third-year.
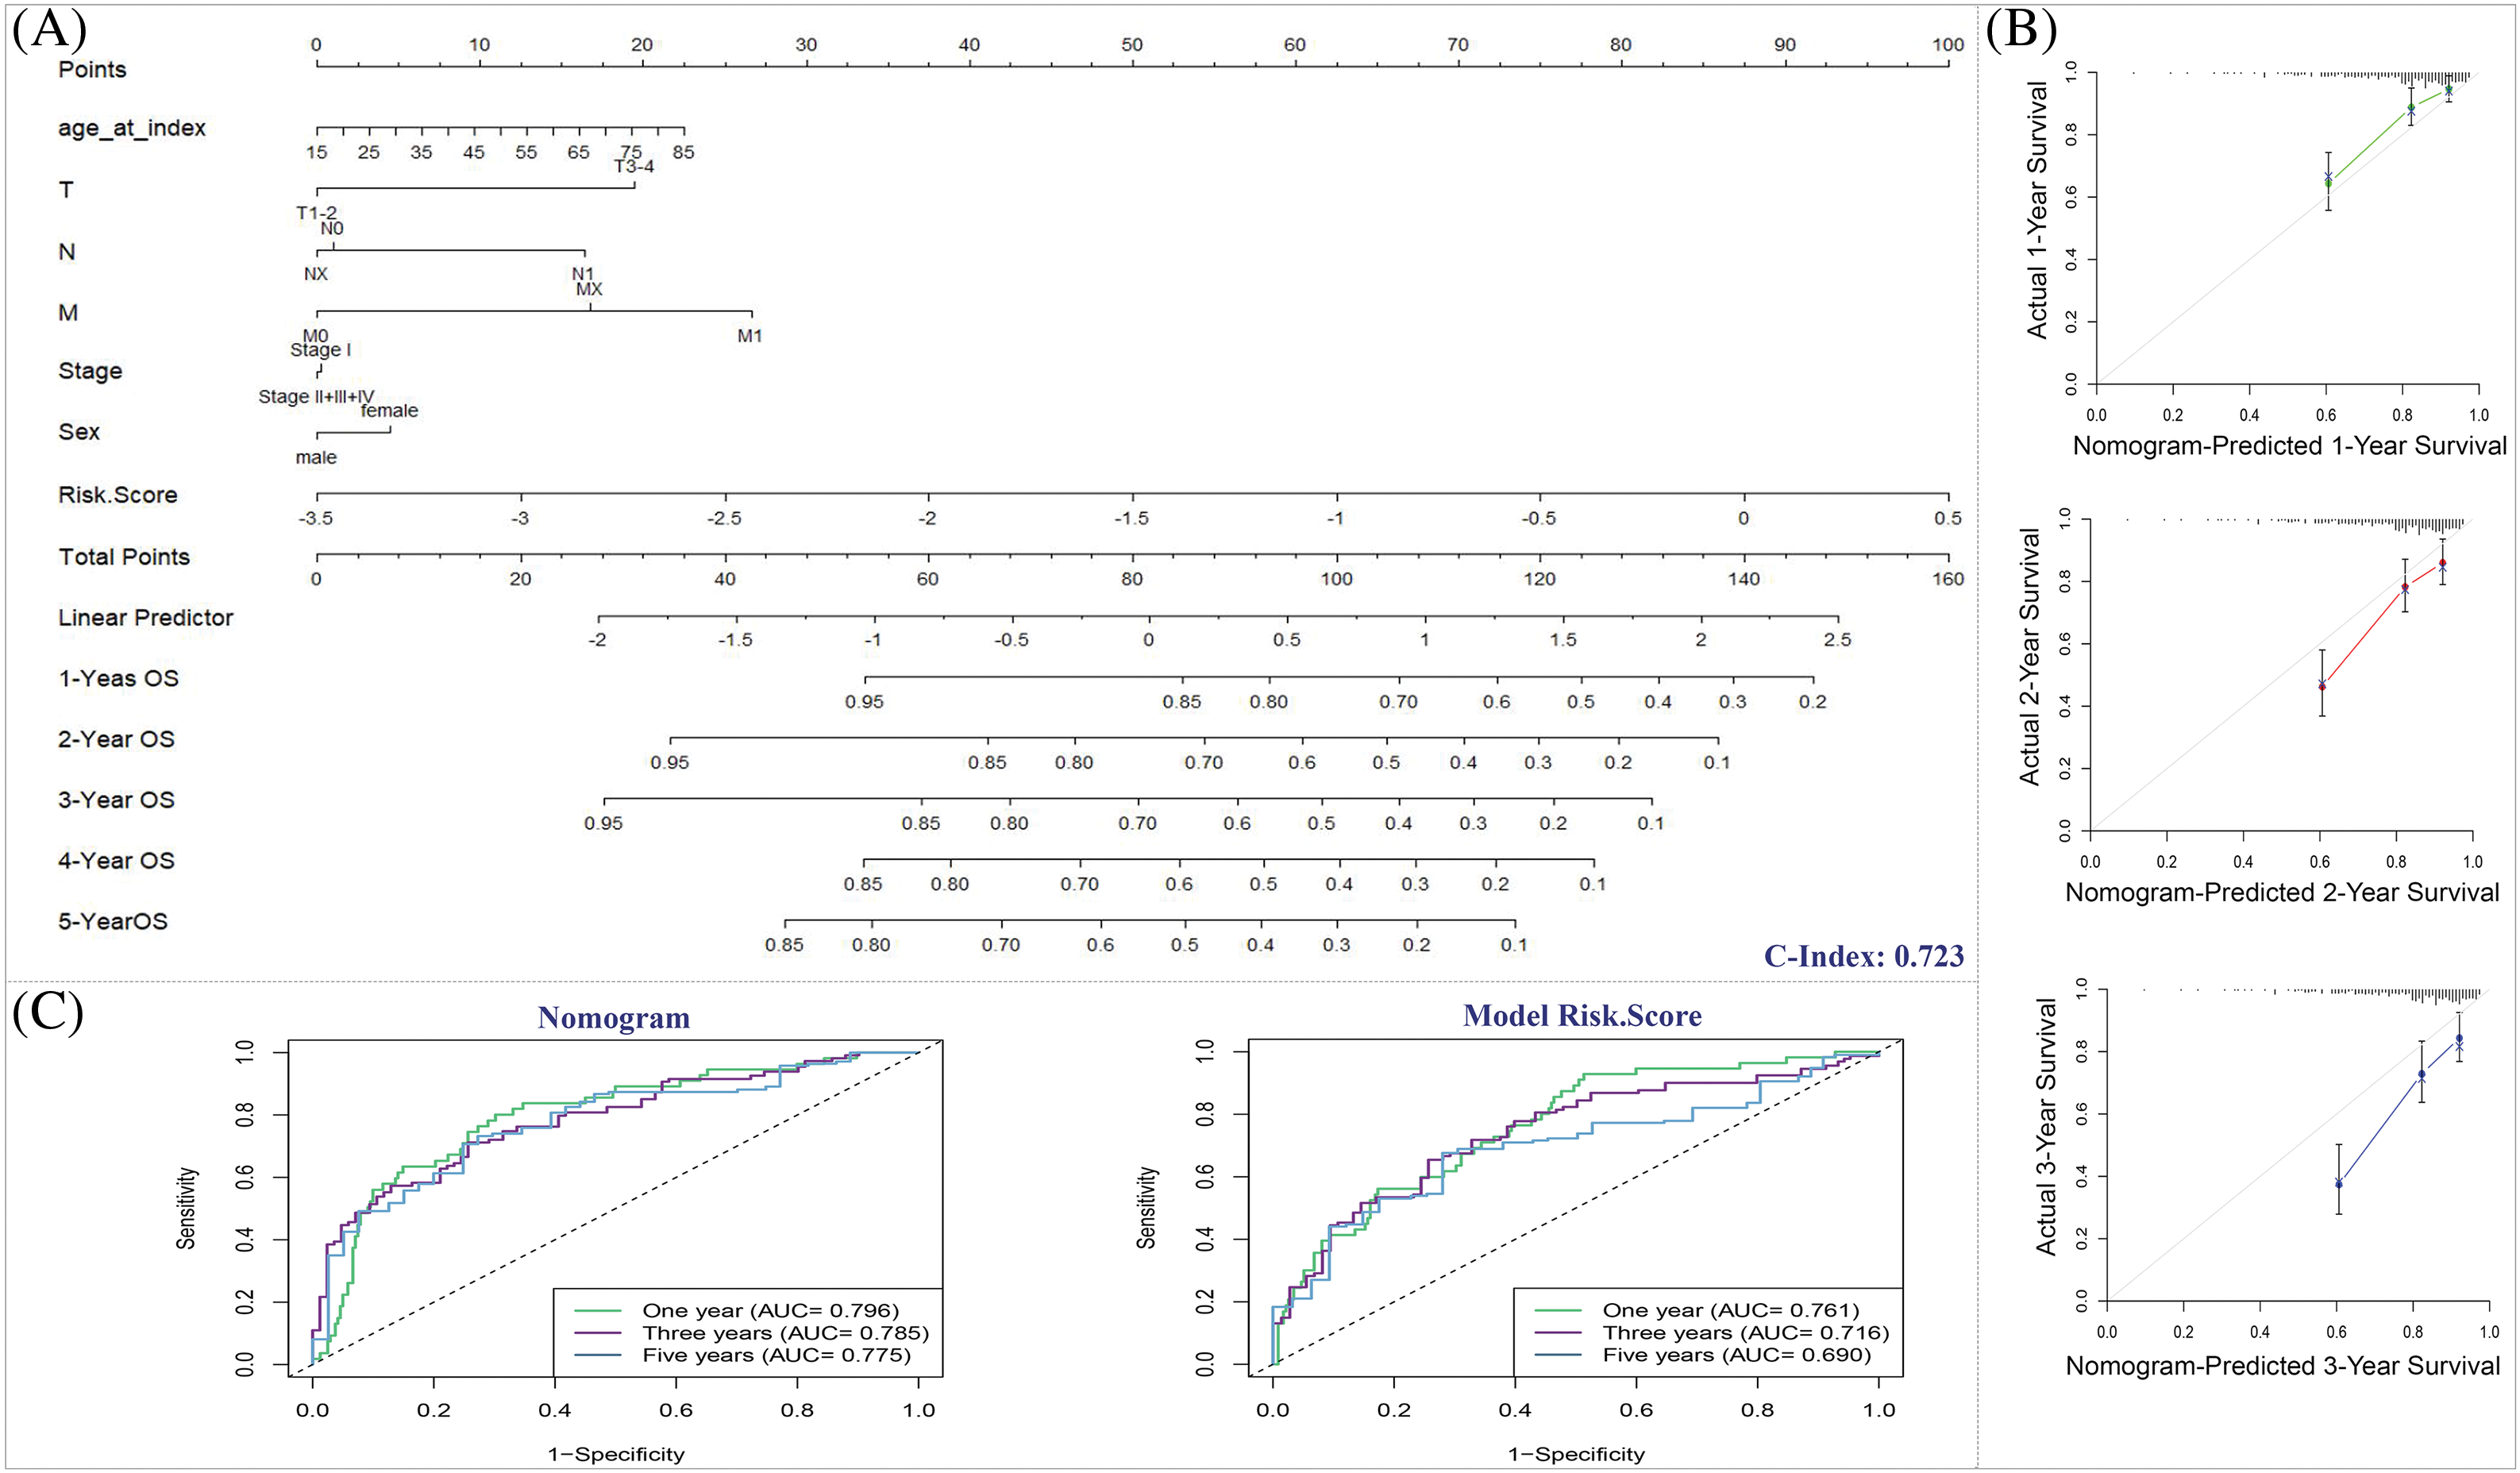
Figure 12: The predictive significance of the nomogram. (A) Nomogram predicting the OS of HCC patients. (B) Nomogram calibration plot. x-axis shows the nomogram-predicted survival, and the observed survival is exhibited on the y-axis. (C) ROC curves of the predictive efficiency of model risk score and nomogram.
The AUC of the nomogram ROC curve was 0.796 at the first-year, demonstrating that it had superior prognostic performance than prognostic risk score model with the AUC of 0.761 at the same year (Fig. 12C).
Identification of key contributors based on the LIHC prognosis prediction model
LIHC samples of TCGA were divided into low- and high-expression based on each 12 gene’s optimal cutoff which calculate by the time-dependent ROC. Then, prognostic value, as well as the accuracy of each of these 12 genes, were assessed by Kaplan-Meier and time-dependent ROC curves analysis, respectively. The analysis demonstrated that there is a weighty difference in OS between patients with high and low expression of PLK1, ASS1, SLC22A1, NCAPG, VIPR1, LCAT, SFN, FMO3, FGB, ADAMTSL2, CD4 and JCHAIN; among which PLK1 had the best p-value (<0.0001) as well as the best accuracy with 1-, 3-, and 5-year AUC of 0.72, 0.66, and 0.65, respectively (Fig. 13).
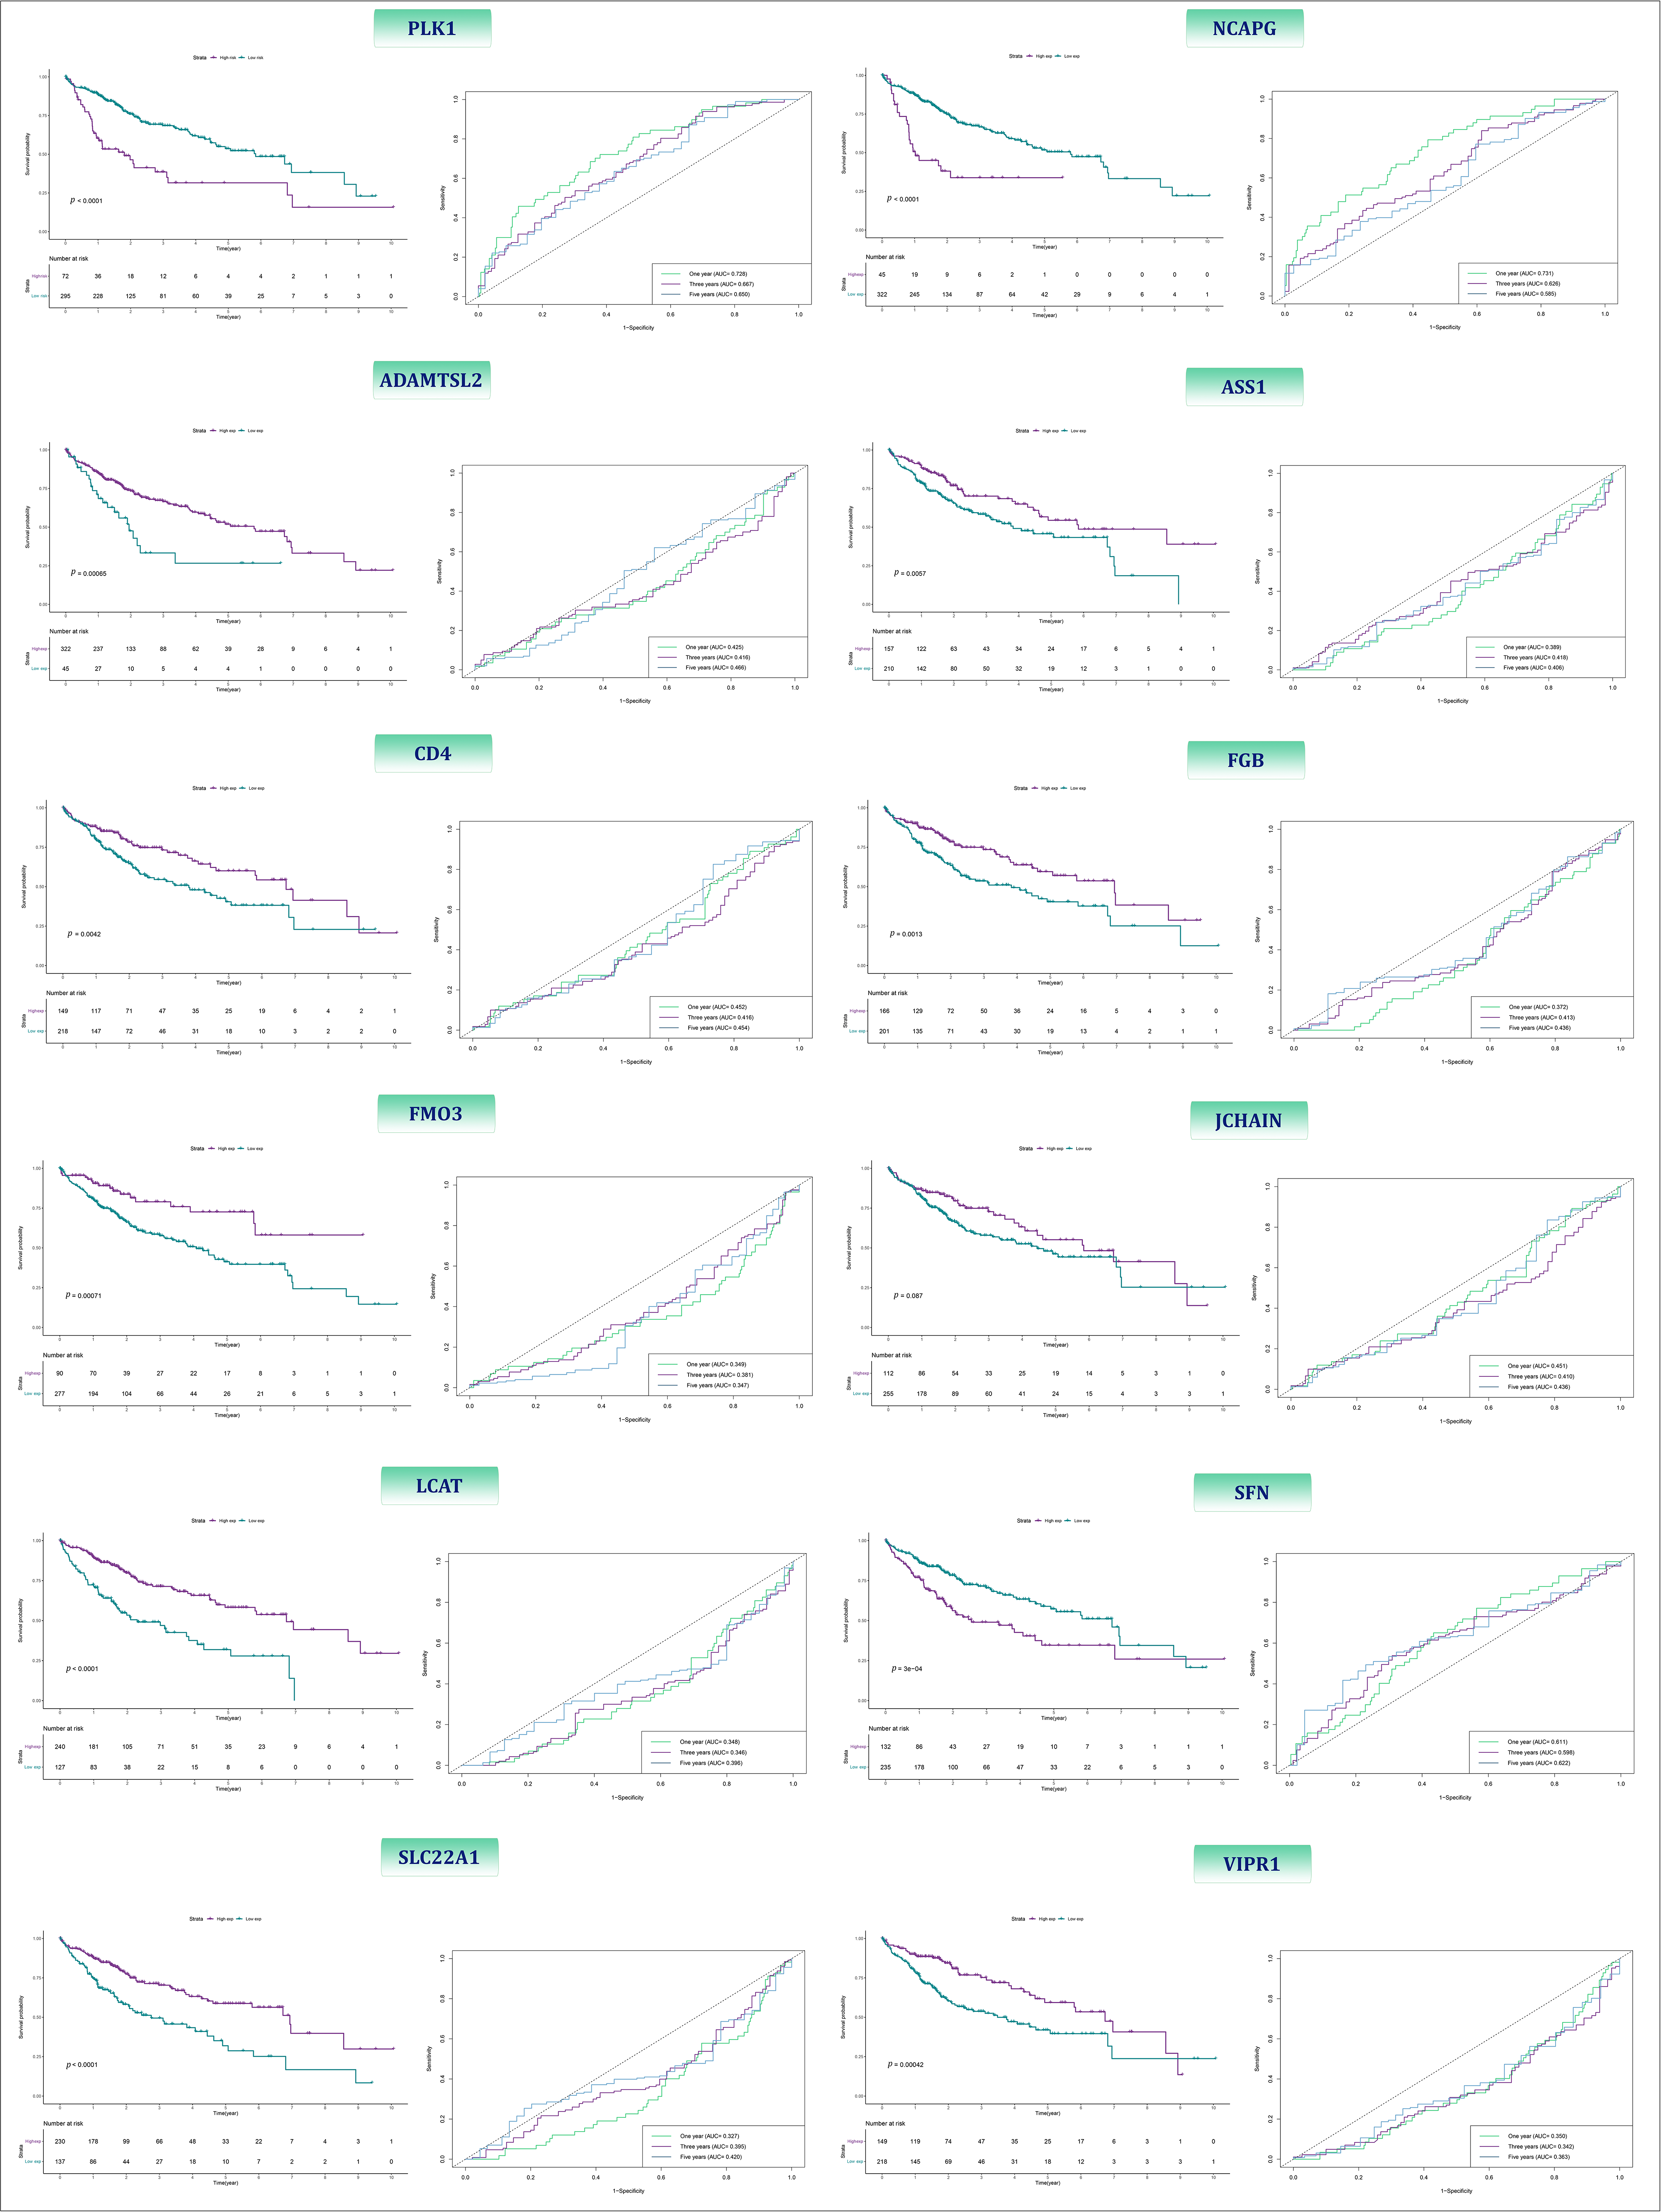
Figure 13: The Kaplan-Meier and ROC curves of 12-BRGs between high- and low-expression category.
Construction of the lncRNA-miRNA-mRNA regulatory axis
Based on our results showing that PLK1 had the best p-value and accuracy, we then constructed a lncRNA-miRNA-mRNA regulatory axis to further elucidate the probable molecular mechanism of this molecule. According to the results predicted by miRTargetLink, and miRTarBase 19 miRNAs were identified as the potential miRNA targets of PLK1 (Fig. 14A). Among these miRNAs, hsa-miR-10b, hsa-miR-92a-1, hsa-miR-877, and hsa-miR-1301 were up-regulated in LIHC tissues vs. normal liver tissues. On the other hand, has-let-7b, has-mir-100, has-mir-874, and has-mir-16-1 were down-regulated in LIHC tissues vs. normal liver tissues (Fig. 14B). Univariate Cox regression coefficient showed that among these eight different-expressed miRNAs, only has-mir-100 has prognostic value (p-value = 0.000891) (Fig. 14C). Of note, the OS in the patients with high expression of this miR was higher than those with lower expression (p-value < 0.0001) (Fig. 14D). To explore the upstream lncRNA targets of hsa-miR-100, we submitted hsa-miR-100 to DIANA-LncBase and RNAInter whose results suggested DLEU1 as the lncRNA target of this miRNA (Fig. 14E). We also found that DLEU1 not only was up-regulated in LIHC tissues vs. liver tissues (p-value = 0.0006) (Fig. 14F), but also its expression was superior in high-risk group (p-value = 0.0029) (Fig. 14G).
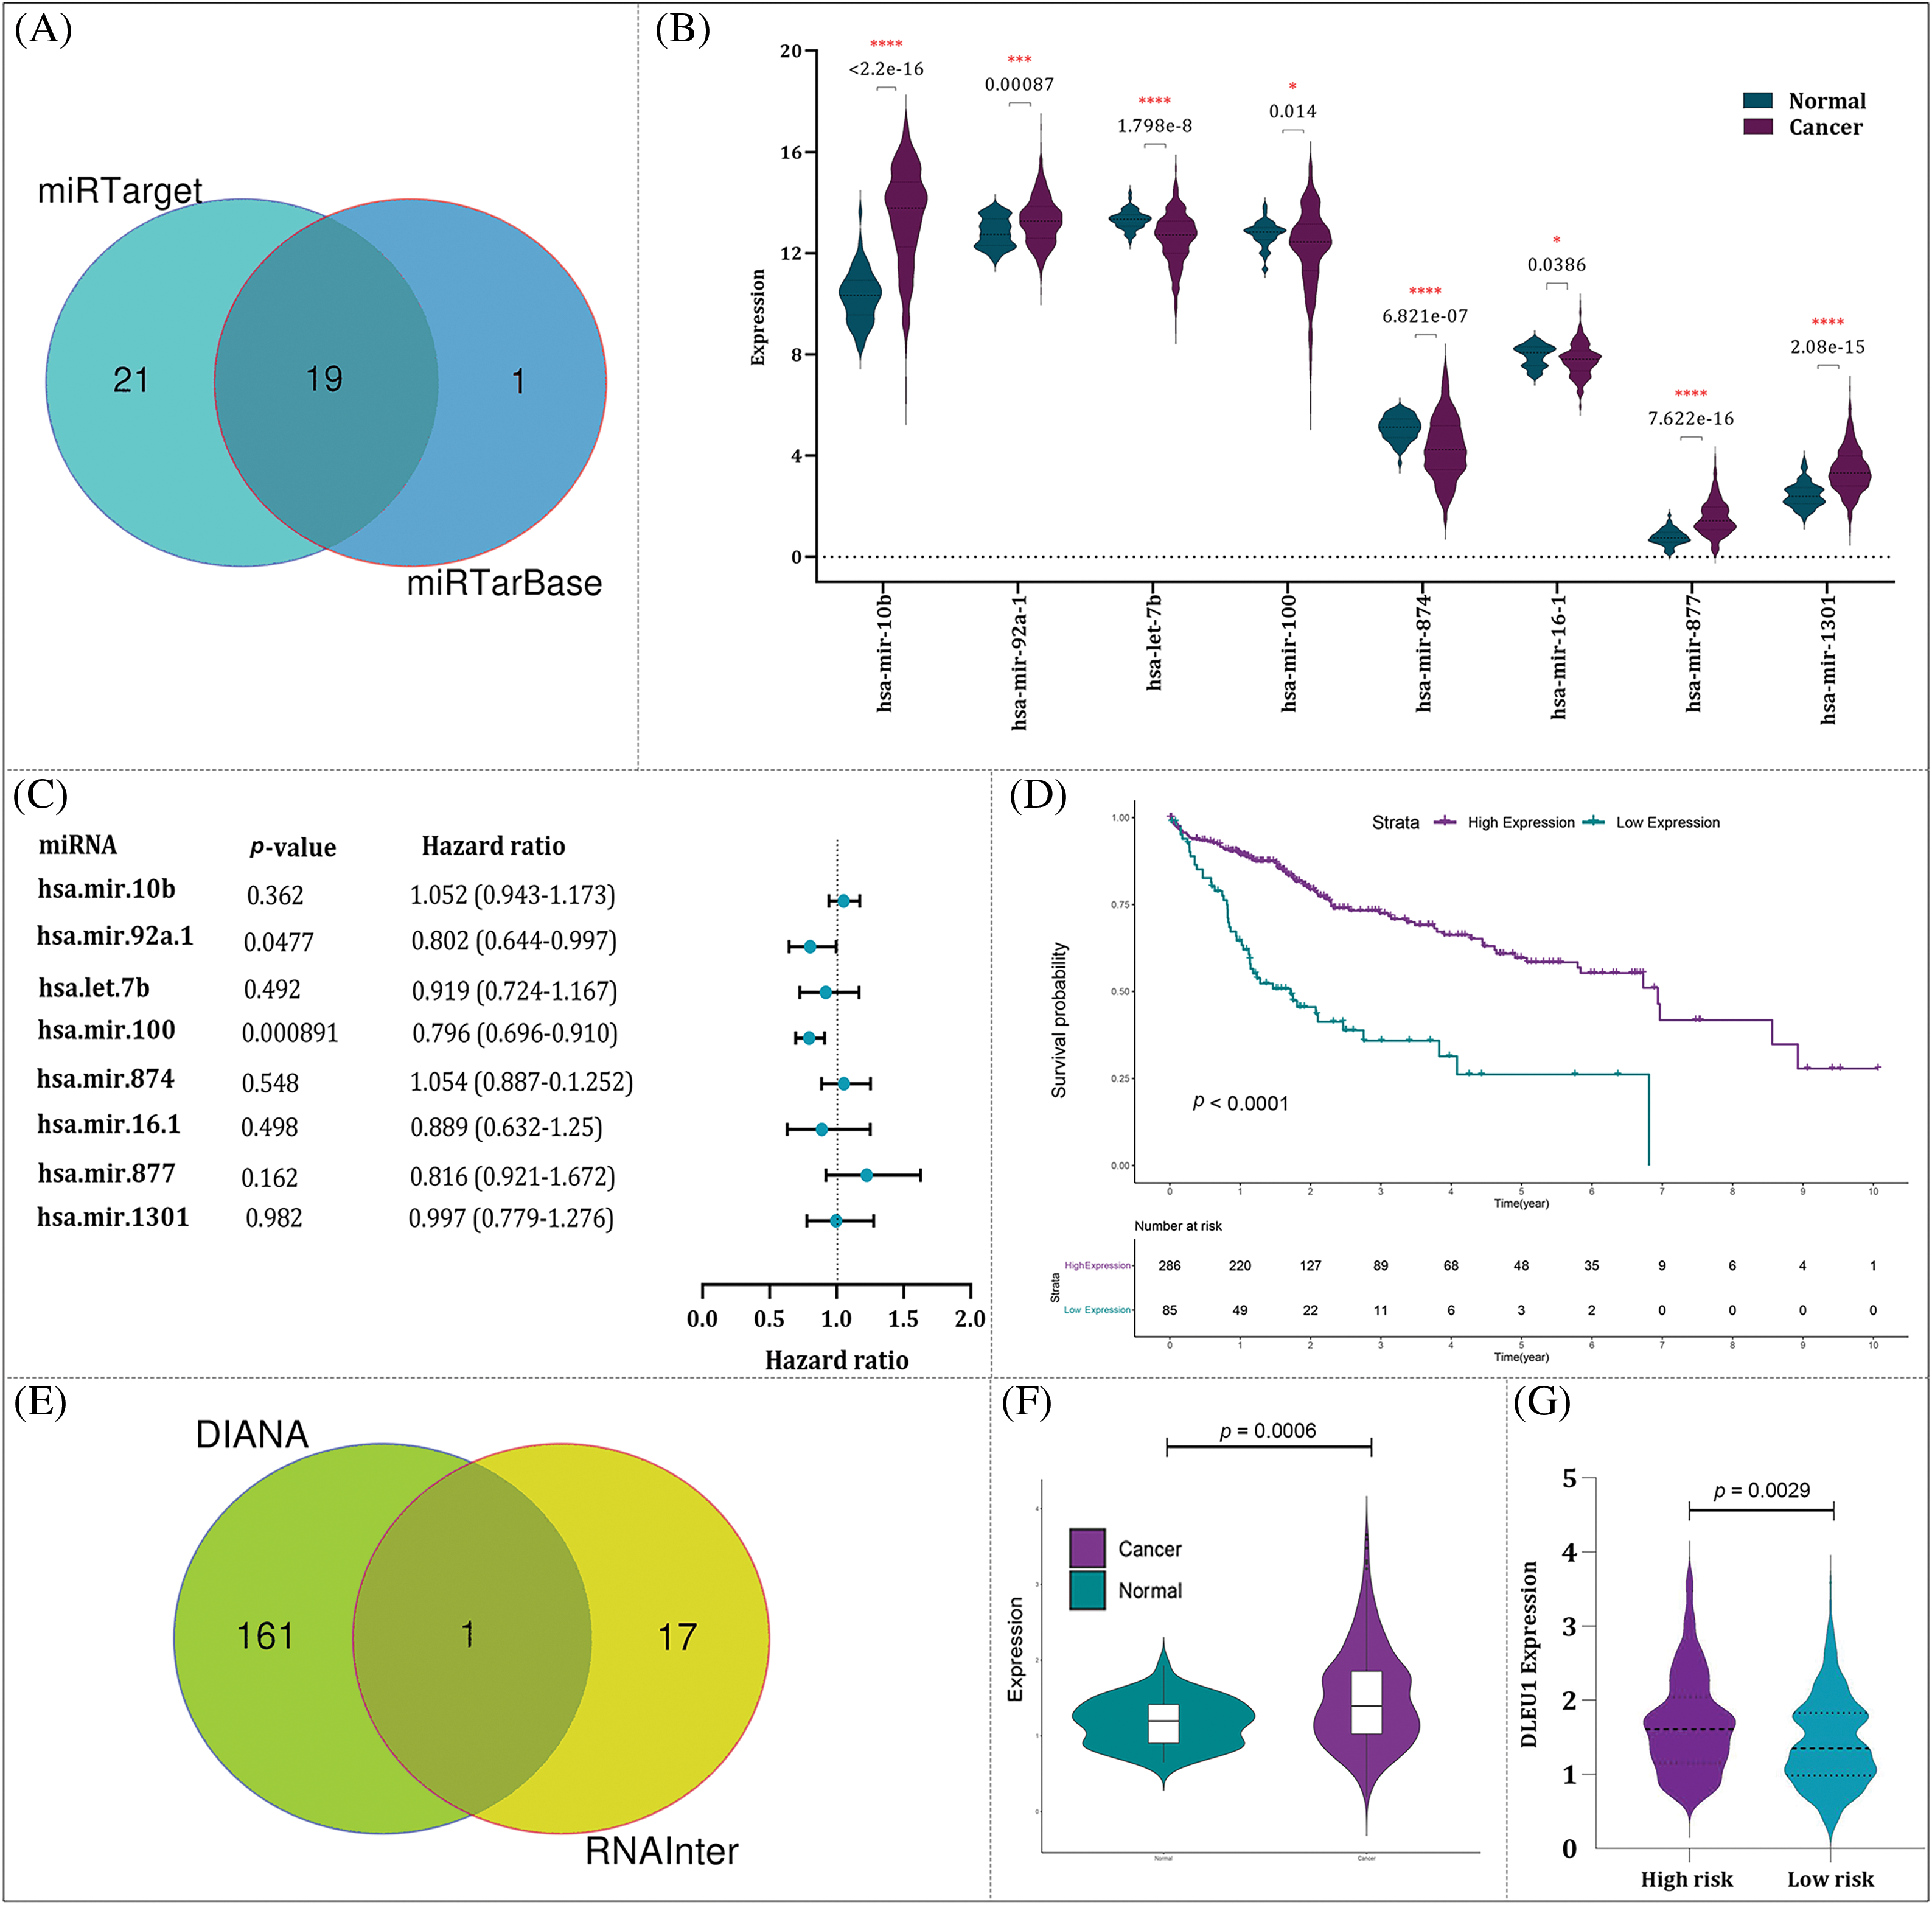
Figure 14: Construction of lncRNA-miRNA-mRNA regulatory. (A) The result of miRTarget and miRTarBase identified 19 miRNAs as the potential miRNA targets of PLK1. (B) The expression of eight miRNAs with the significance difference in their transcriptional activity in HCC tissues vs. normal liver tissues. (C) The univariable COX regression analysis of eight miRNAs. (D) The relationship between miR-100-5p expression and OS of HCC patients. (E) The result of DIANA and RNAInter suggested DLEU1 as the lncRNA target of miR-100-5p. (F) The expression of DLEU1 in HCC tissues vs. normal liver tissues. (G) DLEU1 expression in high- and low-risk groups.
Validating PLK1 inhibition and combination therapy via siRNA knockdown
Number of pre-clinical surveys have stated that high expression of PLK1 is responsible for HCC development [25,26]. Given this and based on the findings obtained from our analyses, it was tempting to investigate the effect of volasertib, a PLK1 inhibitor, on HCC cell lines. Of note, treatment of Huh7 and SNU449 cells with volasertib resulted in a concentration-dependent decrease in metabolic activity of the both cell lines (Fig. 15A,B). Next, and to confirm the specificity of volasertib, the effects of PLK1 inhibition were further evaluated upon the knockdown of the PLK1 gene using PLK1 siRNA (siPLK1). As expected, our results showed that knockdown of the PLK1 gene has resulted in a mildly reduction in HCC cell viability; further supporting our results regarding the pro-survival role of PLK1 in HCC cells. As a supplementary investigation, we also aimed to evaluate whether PLK1 inhibition can boost the efficacy of traditional chemotherapy in a combined modality strategy. Noteworthy, combining siPLK1 with cisplatin as well as its combination with sorafenib both demonstrated a superior cytotoxicity as compared to either agent alone (Fig. 15C). Notably, both cisplatin and sorafenib were used at low concentrations, signifying that the combination with siPLK1 had a pronounced impact on reducing cell viability even at lower doses. Taken together, these results highlight the potential of PLK1 inhibition as a therapeutic strategy, either alone or in combination with chemotherapy drugs, for targeting HCC cells.
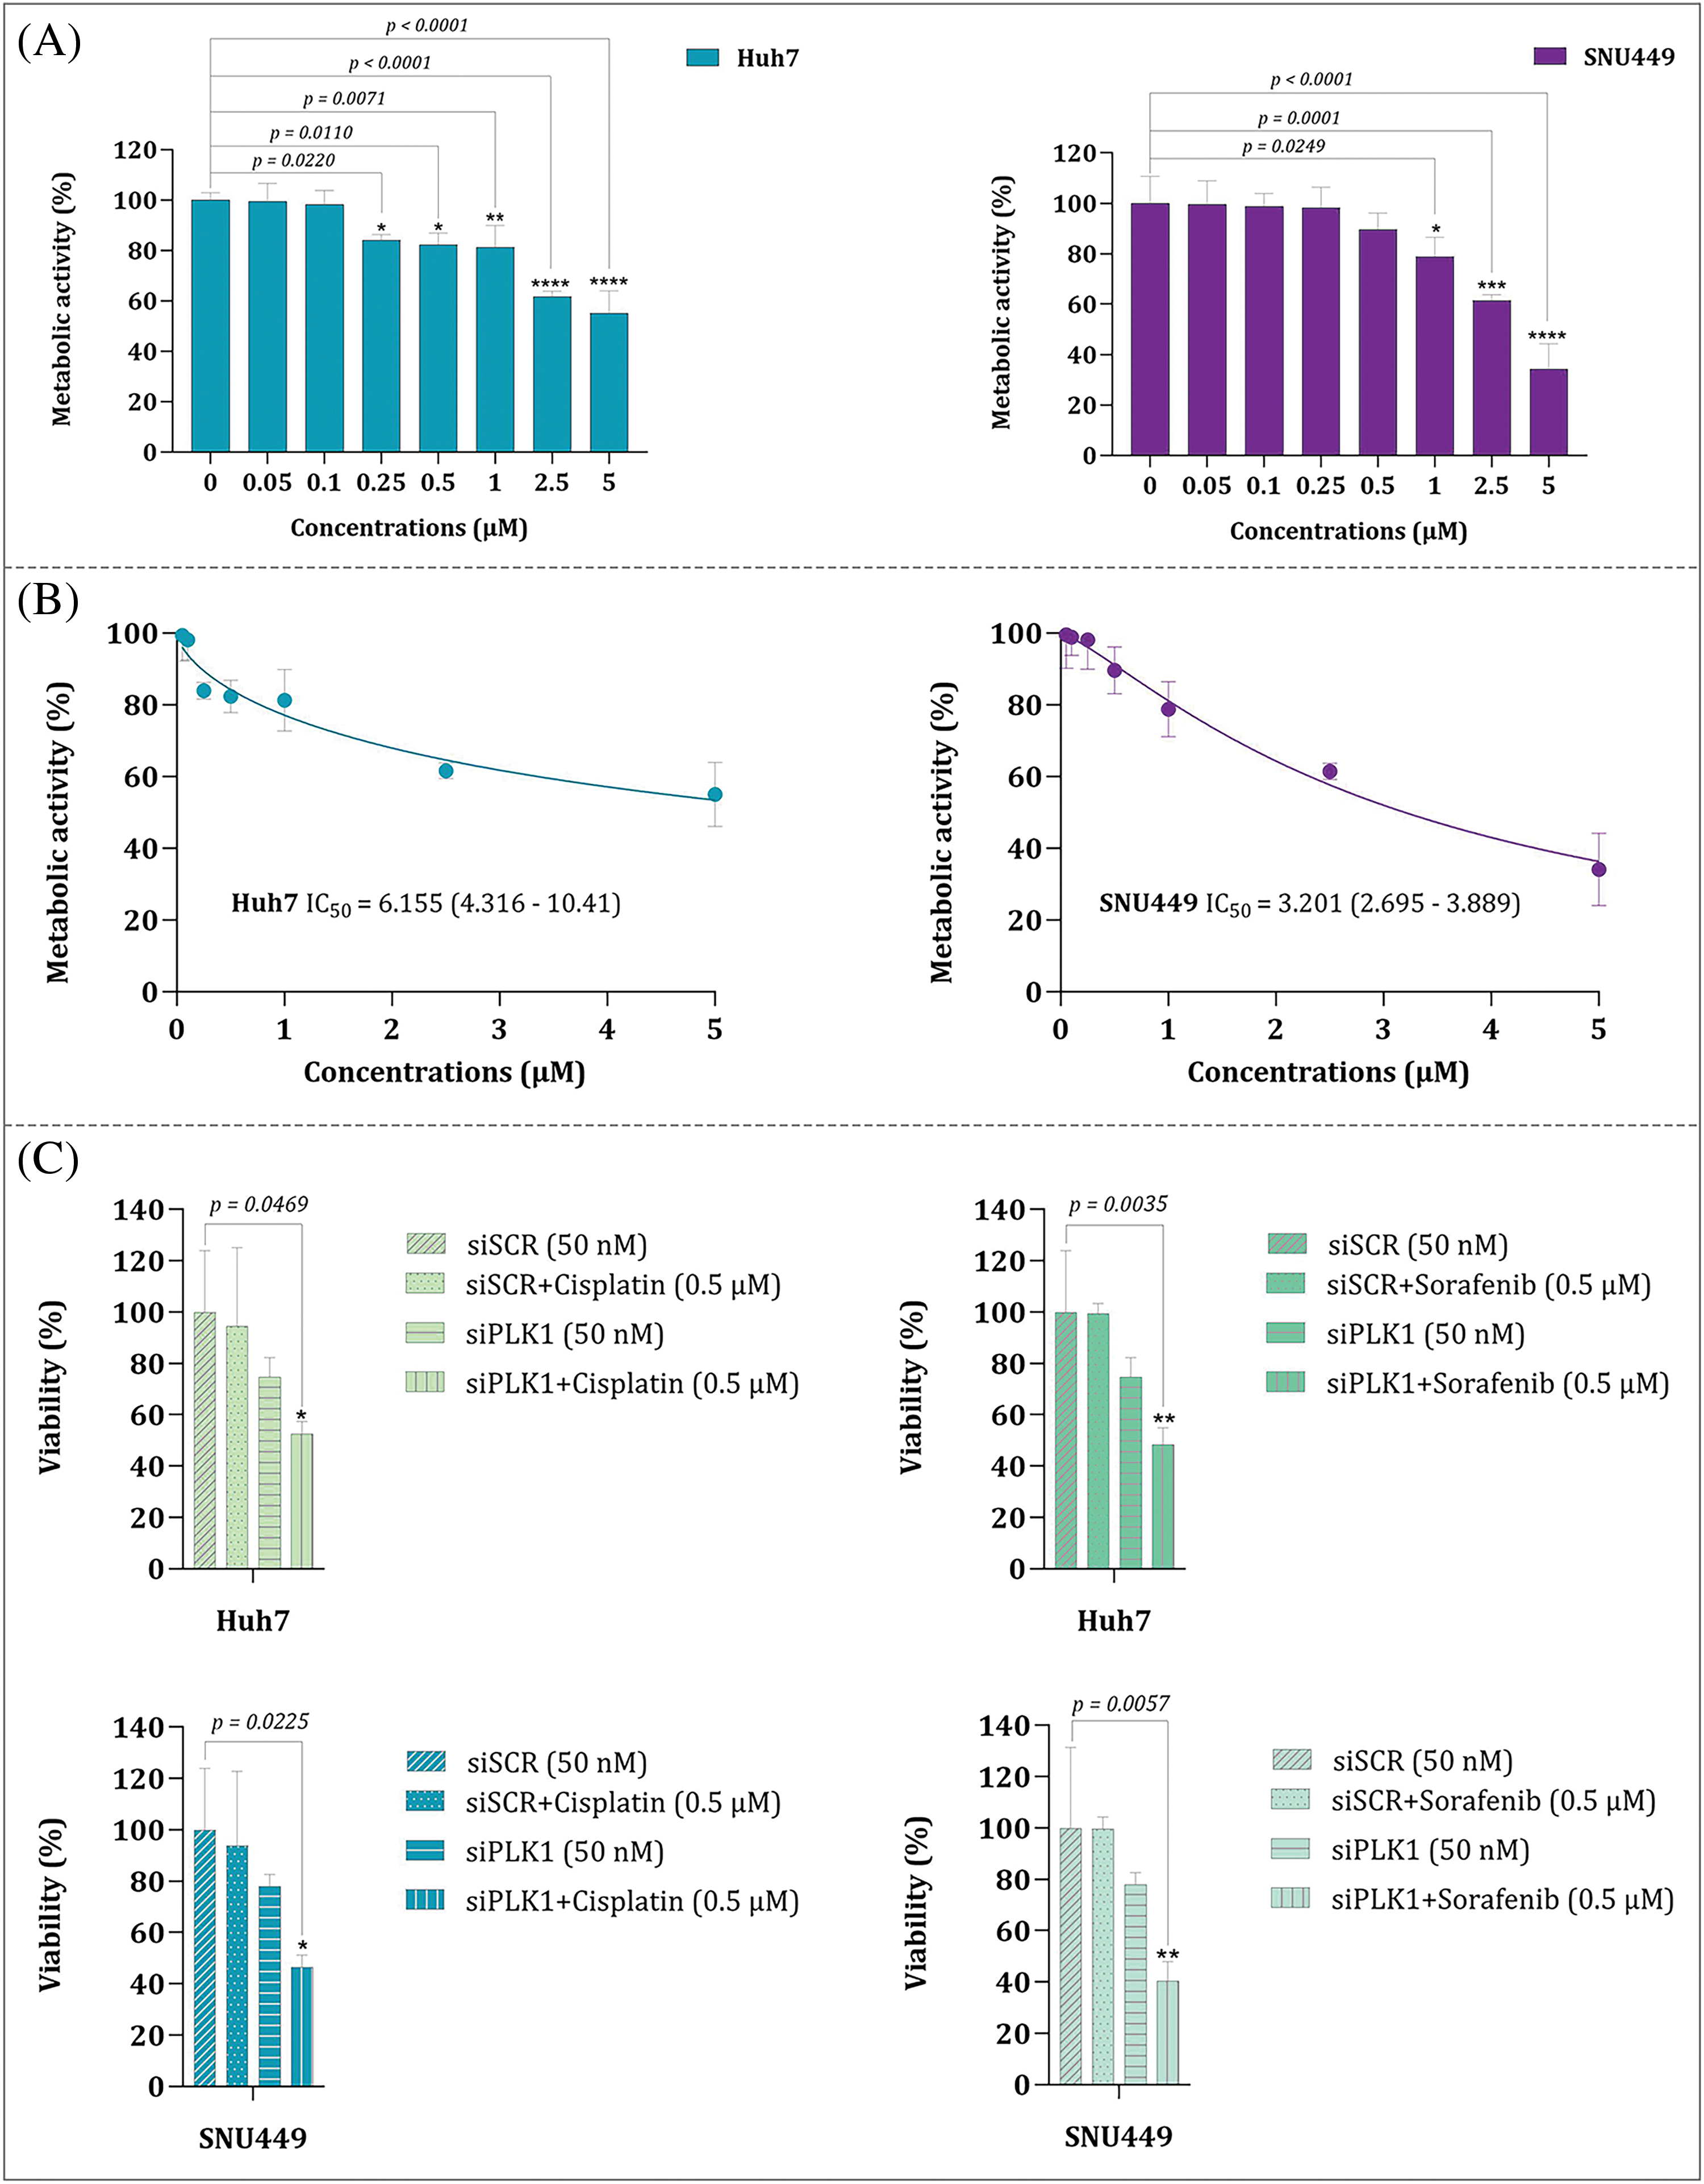
Figure 15: (A) Metabolic activity of Huh7 and SNU449 cell lines upon treatment with volasertib. (B) Comparison of the IC50 values for Huh7 and SNU449 cell lines treated with volasertib. (C) Cell viability analysis of Huh7 and SNU449 cell lines treated with siPLK1 alone and in combination with cisplatin or sorafenib. Values are reported as the mean ± standard deviation (S.D.) derived from three distinct experiments. Statistical significance is indicated as: * for p < 0.05, ** for p < 0.01, *** for p < 0.001, and **** for p < 0.0001.
In the past decade, the attention of many scientists who study in the field of cancer turned toward microbiome as it became evident that the living microorganisms of the body play a serious role both in cancer initiation or prevention. Publication of a remarkable amount of research with direct attention to the relationship between cancer development and human microbiome has set the stage to widen cancer research interest, particularly in human malignancies with gastrointestinal origin [27]. Noteworthy, the interest in the contributory role of bacteria in HCC has emerged from the recent disclosures indicating a bidirectional communication between the gut and the liver [28,29]. In cases where the gut becomes leaky as a result of injury or inflammation, it can lead to the migration of microbial flora to the liver. Of note, this translocation is mediated by metabolites and constituents associated with the microbiota, which in turn, triggers the activation of a cascade of signaling pathways that play a crucial role in the development of HCC [16]. Taken altogether, although previous studies have highlighted the contributory roles of bacteria in HCC [30–32], it is early to hazard a conjecture for the mechanisms through which they may either trigger or affect HCC prognosis.
As far we are aware, to date, there have been no reports of bacterial response-related biomarkers in HCC, and this study represents for the first time that a 12-BRGs prognostic signature has the potential to predict the survival of this malignancy. Our signature consists of 12 DE-BRGs: PLK1, NCAPG, VIPR1, SLC22A1, LCAT, SFN, FMO3, ASS1, FGB, ADAMTSL2, CD4, and JCHAIN—among which PLK1, NCAPG, and SFN were up-regulated while the remaining genes were downregulated. In order to present a thorough overview, we have summarized the information about the components of this model and their functions in HCC and other types of cancer into Table 5. Additionally, Fig. 16A–H visualizes the interplay among certain contributors to our prognostic model in HCC through a schematic representation.
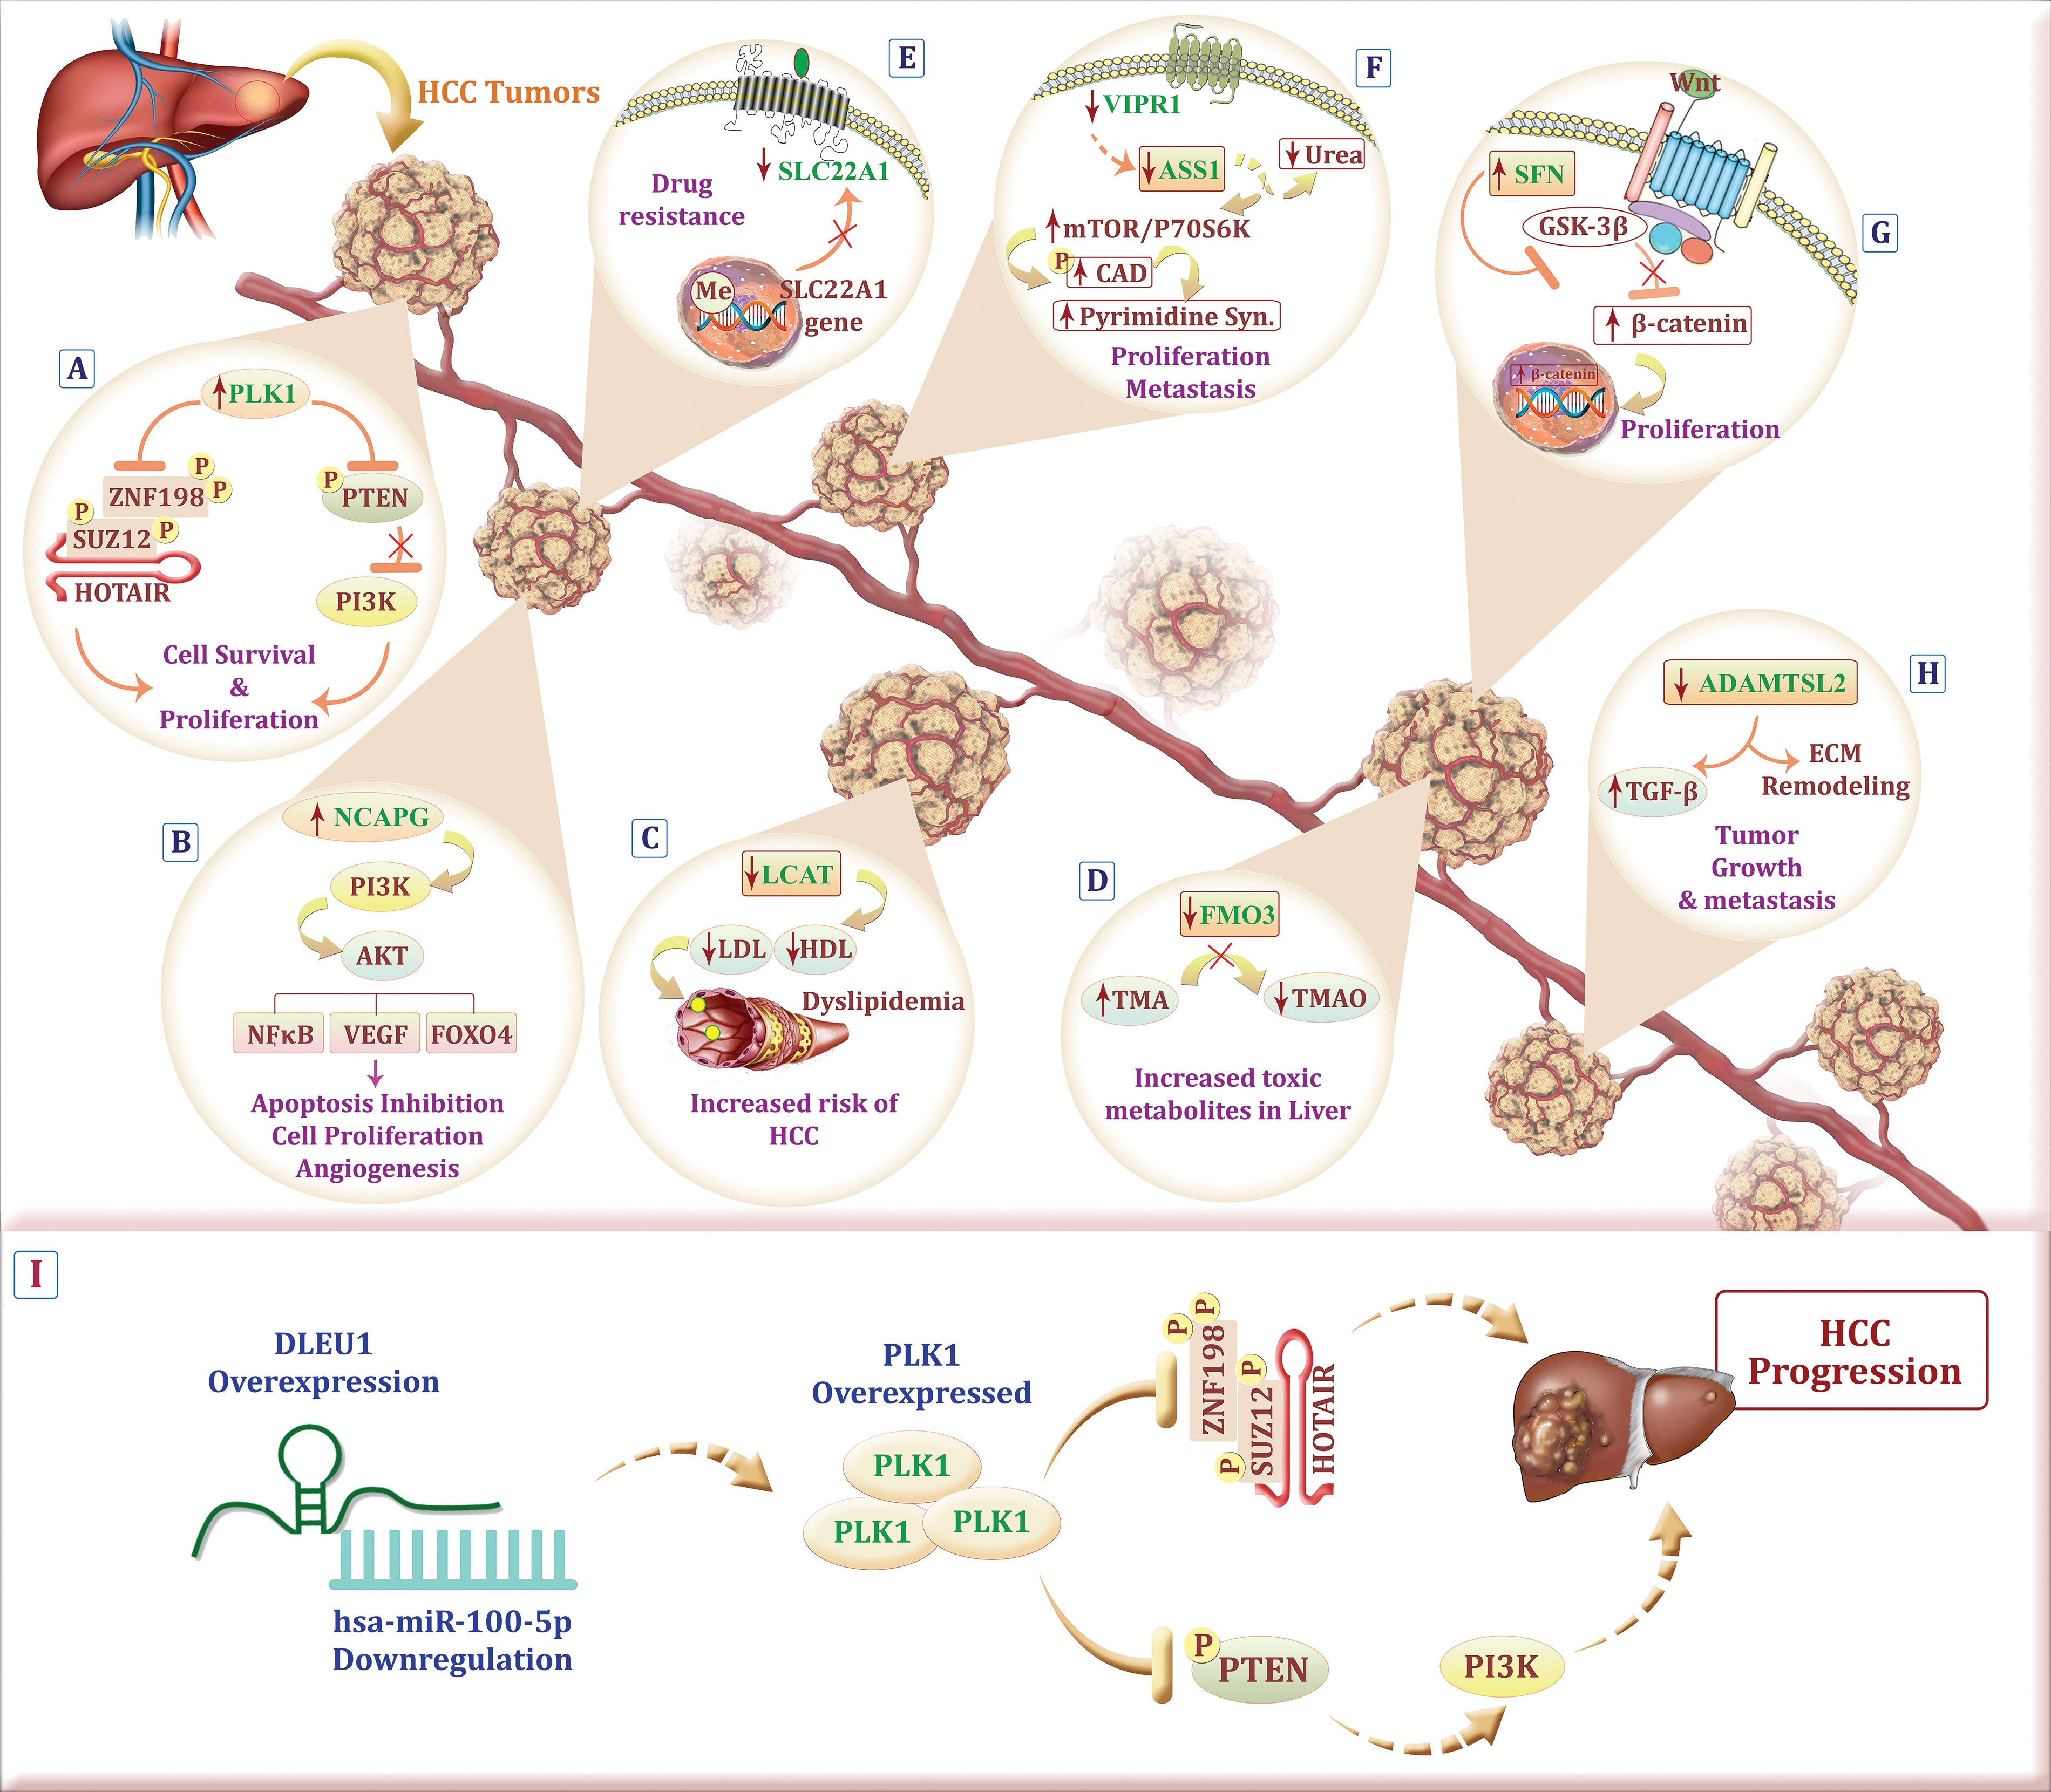
Figure 16: Schematic representation illustrating the possible role of model components in HCC. (A) PLK1 overexpression on one hand, results in degradation of the transcription repression factors SUZ12 and ZNF198, both related to the lncRNA HOTAIR, on the other hand, leads to PTEN inhibition and PI3K overactivation which hand in hand cause HCC cell proliferation. (B) Up-regulation of NCAPG touches the biological actions of HCC via the PI3K/AKT cascade. (C) Dyslipidemia caused by low expression of LCAT rises the risk of HCC. (D) Accumulation of a toxic metabolite, trimethylamine, due to the down-regulation of FMO3 could increase the risk of HCC development. (E) hypermethylation of the SLC22A1 promoter region and its downregulation is linked to decreased drug uptake in the tumor. (F) Down-regulation of VIPR1 and consequently ASS1 down-regulation, increase carbamoyl-phosphate synthetase 2, aspartate transcarbamylase, and dihydroorotase (CAD) phosphorylation in an mTOR/p70S6K signaling dependent manner, which all in all result in HCC proliferation and metastasis. (G) SFN activates the Wnt/β-catenin pathway by preventing glycogen synthase kinase-3 beta (GSK-3β) activation which leads to HCC cell proliferation. (H) Tumor growth and metastasis are the consensuses of down-regulated ADAMTSL2 which exerts its effect through extracellular matrix (ECM) remodeling and overactivation of transforming growth factor-beta (TGF- β). (I) Abnormal expression of DLEU1 may result in miR-100-5p downregulation which leads to PLK1 overexpression and subsequently HCC cell survival and progression (The figure was created using photoshop CS6).
The findings from our study indicated that this signature has a moderate level of accuracy in predicting the OS of HCC patients, as evidenced by the results of KM and ROC curve analysis. Importantly, the results of both univariate and multivariate Cox proportional regression analysis demonstrate that this signature independently serves as a prognostic factor for predicting OS. Notably, it has the ability to predict survival outcomes across various patient groups, including different sex (male and female), age groups (<65 or >65 years old), different tumor stages (T1, T2, T3, or T4), lymph node involvement (N0 or N1 staging), and distant metastasis (M0 or M1 staging). In simpler terms, even after taking into account these traditional clinicopathological factors, the risk score derived from this signature remains a significant predictor of patient survival.
Recently, there have been a growing disclosure highlighting the significant impact of the crosstalk between cancer cells and TME on the progression of cancer [76]. This intricate interplay has been found to stimulate cell proliferation, enhance cell survival, and promote the migration and evasiveness of cancer cells [77]. Concerning HCC, the TME presents a particular challenge for effective therapies as it is intricately involved in metastasis and the development of treatment resistance [78]. However, researchers are actively exploring new avenues of immune-based therapies that specifically target the TME in this malignancy [79,80]. With that in mind, our findings revealed that a higher risk score was associated with a decreased infiltration of specific immune cell subsets that play a crucial role in immune surveillance and anti-tumor responses; these subsets include CD4+ memory T cells, γδ-T cells, resting mast cells, and M1 macrophages. CD4+ memory T cells possess the capacity to recognize specific antigens, activate other immune cells, regulate immune responses, and provide long-term immune surveillance, thereby aiding in the control and elimination of cancer cells [81,82]. Similarly, M1 macrophages are essential components of the immune system, exhibiting potent anti-tumor properties; they can engulf and destroy cancer cells, yield pro-inflammatory cytokines, and stimulate other immune cells [82]. Indeed, decreased proportion of M1 macrophages in high-risk HCC patients may impair host’s immune system to effectively eliminate cancer cells. In line with our findings, Huang et al. reported that the high-risk group was primarily enriched in M0 macrophages, Tregs, and follicular helper T cells (Tfh), while the low-risk group exhibited a higher abundance of M1 macrophages and resting mast cells [83].
TMB has been suggested to be associated with the prognosis of various cancers [84–86]. Mutational signatures represent distinct patterns of genetic alterations that result from both internal and external factors contributing to the development of tumors; these signatures serve as unique indicators of the mutational processes occurring during tumorigenesis [87]. Although numerous lines of evidence highlighted cancer patients with high TMB have a poorer prognosis in comparison with those with low TMB [88,89], ongoing research is currently being conducted to more accurately describe the contributory significance of TMB in different cancer types. To be detailed, the correlation between TMB status and cancer prognosis has been studied in various types of cancer cell; however, in several cases, there are contradictory results. In a study performed by Wu et al., while HCC was classified as the TMB-worse group where patients with high TMB had a poorer prognosis in contrast to those with low TMB, elevated TMB was a prognostic indicator that showed a statistically significant association with diminished mortality in some other cancers such as bladder urothelial carcinoma, kidney renal clear cell carcinoma, and stomach adenocarcinoma [85]. Of note, and in harmony with the results of Wu et al, we observed that TMB was meaningfully greater in the high-risk group; further indicating that increased mutational processes occurring during HCC tumorigenesis is associated with poor prognosis and serves—at least partly—as a prognostic indicator of increased mortality. Moreover, Cai et al. demonstrated that higher TMB was positively associated with the recurrence risk of HCC after radical hepatectomy [90].
Of note, among our genes signature, PLK1 exhibited the most significant role. PLK1 has been previously associated with the progression of several cancers such as triple negative breast cancer (TNBC) [91], anaplastic thyroid carcinoma (ATC) [92], non-small cell lung cancer (NSCLC) [93], and acute myeloid leukemia (AML) [94]. Of note, it has been reported that PLK1 is overexpressed in HCC [95]. In agreement, our experimental results showed that inhibition of PLK1, either with a potent PLK1 inhibitor Volasertib or specific PLK1 siRNA, could diminish HCC cell viability in a concentration-dependent manner. Of note, PLK1 inhibition in combination with chemotherapy led to superior cytotoxicity, further highlighting the potential of targeting this molecule as an adjunct therapy to improve the outcomes of traditional chemotherapy approaches.
Next, it was tempting to shed more light on the molecular mechanisms by which PLK1 may contribute to HCC survival. Given this, we explored the regulatory network associated with PLK1 and identified miR-100-5p as a potential miRNA to be involved in the regulation of PLK1 expression in HCC. In agreement, Liao et al. showed that abnormal decreased in hsa-miR-100-5p leads to excessively high PLK1 expression, associated with poor prognosis for HCC patients [96]. Apart from miR-100-5p, we also discovered that DLEU1 lncRNA probably serve as a key molecule participating important roles in the regulatory network associated with PLK1 in HCC. Consistently, it has been reported that suppressing DLEU1 could inhibit HCC cell growth, colony formation and disrupt cell cycle progression [97]. To sum up with, these findings suggest the “DLEU1/hsa-miR-100-5p/PLK1” regulatory network as a feasible putative target in HCC patients. Increased PLK1 expression, alongside the downregulation of miR-100-5p and the upregulation of DLEU1, may play a role in HCC development and progression. For a concise visual representation, the probable regulatory network involving PLK1, miR-100-5p, and DLEU1 is depicted in Fig. 16I.
In conclusion, as far we are aware, to date, there have been no reports of bacterial response-related biomarkers in HCC, and this is the first time that a novel 12-BRGs prognostic signature has been developed and verified for assessing the prognosis of HCC patients. Our model demonstrates effective prognostic capabilities when utilized either independently or in conjunction with other clinical factors. We hope that this signature could offer valuable assistance not only for better stratification of HCC patients but also can pave the way for more effective treatment strategies in the high-risk patients. Nevertheless, it is important to note that this study was retrospective in nature, and additional prospective trials is necessary to validate our findings.
This study investigates the role of bacterial response-related genes (BRGs) as potential predictive biomarkers for hepatocellular carcinoma (HCC) prognosis, a topic that has seen limited exploration despite increasing evidence of bacterial significance in HCC development. We present a novel 12-BRG prognostic signature capable of accurately predicting survival outcomes in HCC patients. Additionally, we identify the “DLEU1/hsa-miR-100-5p/PLK1” regulatory network as a probable target for therapeutic intervention. Our findings demonstrate that inhibiting PLK1, either alone or in combination with other strategies, effectively reduces HCC cell viability. This research aims to enhance patient stratification and advance personalized medicine for high-risk HCC patients through more effective treatment approaches.
Acknowledgement: The authors would like to express their gratitude to Pediatric Infections Research Center, Research Institute for Children’s Health, Shahid Beheshti University of Medical Sciences (Tehran, Iran) for supporting this study.
Funding Statement: The authors received no specific funding for this study.
Author Contributions: The authors confirm contribution to the paper as follows: Research, Data Gathering, Data Analysis, Graphical Design, Manuscript Preparation, Experimental Analysis: Atieh Pourbagheri-Sigaroodi; Data Analysis, Manuscript Editing: Fatemeh Fallah; Experimental Analysis: Majid Momeny; Study Design, Manuscript Editing: Nima Rezaei; Study Design, Methodology, Supervision, Manuscript Editing: Davood Bashash. All authors reviewed the results and approved the final version of the manuscript.
Availability of Data and Materials: The datasets generated during and/or analyzed during the current study are available from the corresponding author on reasonable request.
Ethics Approval: Not applicable.
Conflicts of Interest: The authors declare no conflicts of interest to report regarding the present study.
Supplementary Materials: The supplementary material is available online at https://doi.org/10.32604/biocell.055848.
References
1. Chidambaranathan-Reghupaty S, Fisher PB, Sarkar D. Hepatocellular carcinoma (HCCepidemiology, etiology and molecular classification. ADV Cancer Res. 2021;149:1–61. doi:10.1016/bs.acr.2020.10.001. [Google Scholar] [PubMed] [CrossRef]
2. Samant H, Amiri HS, Zibari GB. Addressing the worldwide hepatocellular carcinoma: epidemiology, prevention and management. J Gastrointest Oncol. 2021;12(Suppl 2):S361. [Google Scholar] [PubMed]
3. Chen Z, Xie H, Hu M, Huang T, Hu Y, Sang N, et al. Recent progress in treatment of hepatocellular carcinoma. Am J Cancer Res. 2020;10(9):2993. [Google Scholar] [PubMed]
4. Marin JJ, Macias RI, Monte MJ, Romero MR, Asensio M, Sanchez-Martin A, et al. Molecular bases of drug resistance in hepatocellular carcinoma. Cancers. 2020;12(6):1663. doi:10.3390/cancers12061663. [Google Scholar] [PubMed] [CrossRef]
5. Papaconstantinou D, Tsilimigras DI, Pawlik TM. Recurrent hepatocellular carcinoma: patterns, detection, staging and treatment. J Hepatocell Carcinoma. 2022;9:947–57. doi:10.2147/JHC.S342266. [Google Scholar] [PubMed] [CrossRef]
6. Doocey CM, Finn K, Murphy C, Guinane CM. The impact of the human microbiome in tumorigenesis, cancer progression, and biotherapeutic development. BMC Microbiol. 2022;22(1):1–17. [Google Scholar]
7. El Tekle G, Garrett WS. Bacteria in cancer initiation, promotion and progression. Nat Rev Cancer. 2023;23(9):600–18. doi:10.1038/s41568-023-00594-2. [Google Scholar] [PubMed] [CrossRef]
8. Urbaniak C, Gloor GB, Brackstone M, Scott L, Tangney M, Reid G. The microbiota of breast tissue and its association with breast cancer. Appl Environ Microbiol. 2016;82(16):5039–48. doi:10.1128/AEM.01235-16. [Google Scholar] [PubMed] [CrossRef]
9. Bou Zerdan M, Kassab J, Meouchy P, Haroun E, Nehme R, Bou Zerdan M, et al. The lung microbiota and lung cancer: a growing relationship. Cancers. 2022;14(19):4813. doi:10.3390/cancers14194813. [Google Scholar] [PubMed] [CrossRef]
10. Sipos A, Ujlaki G, Mikó E, Maka E, Szabó J, Uray K, et al. The role of the microbiome in ovarian cancer: mechanistic insights into oncobiosis and to bacterial metabolite signaling. Mol Med. 2021;27(1):1–20. [Google Scholar]
11. Li P, Shu Y, Gu Y. The potential role of bacteria in pancreatic cancer: a systematic review. Carcinogenesis. 2020;41(4):397–404. doi:10.1093/carcin/bgaa013. [Google Scholar] [PubMed] [CrossRef]
12. Li Q, Hu Y, Zhou X, Liu S, Han Q, Cheng L. Role of oral bacteria in the development of oral squamous cell carcinoma. Cancers. 2020;12(10):2797. doi:10.3390/cancers12102797. [Google Scholar] [PubMed] [CrossRef]
13. Zhang W, Yang F, Mao S, Wang R, Chen H, Ran Y, et al. Bladder cancer-associated microbiota: recent advances and future perspectives. Heliyon. 2023;9(1):e13012. doi:10.1016/j.heliyon.2023.e13012. [Google Scholar] [PubMed] [CrossRef]
14. Luo W, Guo S, Zhou Y, Zhao J, Wang M, Sang L, et al. Hepatocellular carcinoma: how the gut microbiota contributes to pathogenesis, diagnosis, and therapy. Front Microbiol. 2022;13:873160. doi:10.3389/fmicb.2022.873160. [Google Scholar] [PubMed] [CrossRef]
15. Schneider KM, Mohs A, Gui W, Galvez EJ, Candels LS, Hoenicke L, et al. Imbalanced gut microbiota fuels hepatocellular carcinoma development by shaping the hepatic inflammatory microenvironment. Nat Commun. 2022;13(1):3964. doi:10.1038/s41467-022-31312-5. [Google Scholar] [PubMed] [CrossRef]
16. Zhou A, Tang L, Zeng S, Lei Y, Yang S, Tang B. Gut microbiota: a new piece in understanding hepatocarcinogenesis. Cancer Lett. 2020;474(Suppl 1):15–22. doi:10.1016/j.canlet.2020.01.002. [Google Scholar] [PubMed] [CrossRef]
17. Liu S, Wang Z, Zhu R, Wang F, Cheng Y, Liu Y. Three differential expression analysis methods for RNA sequencing: limma, EdgeR, DESeq2. J Vis Exp. 2021;(175):e62528. [Google Scholar]
18. Scrucca L, Saqr M, López-Pernas S, Murphy K. An introduction and r tutorial to model-based clustering in education via latent profile analysis. In: Learning analytics methods and tutorials: a practical guide using R. Cham, Switzerland: Springer Nature; 2024. p. 285–317. [Google Scholar]
19. Wang H, Lengerich BJ, Aragam B, Xing EP. Precision lasso: accounting for correlations and linear dependencies in high-dimensional genomic data. Bioinformatics. 2019;35(7):1181–7. doi:10.1093/bioinformatics/bty750. [Google Scholar] [PubMed] [CrossRef]
20. Friedman J, Hastie T, Tibshirani R, Narasimhan B, Tay K, Simon N, et al. Package ‘glmnet’. CRAN R Repositary; 2021. Available from: https://glmnet.stanford.edu. [Accessed 2024] [Google Scholar]
21. Heagerty PJ, Saha-Chaudhuri P, Saha-Chaudhuri MP. Package ‘survivalROC’. San Francisco: GitHub; 2013. [Google Scholar]
22. Mayakonda A, Lin D-C, Assenov Y, Plass C, Koeffler HP. Maftools: efficient and comprehensive analysis of somatic variants in cancer. Genome Res. 2018;28(11):1747–56. doi:10.1101/gr.239244.118. [Google Scholar] [PubMed] [CrossRef]
23. Kolde R, Kolde MR. Package ‘pheatmap’. R package. 2015;1(7):790. [Google Scholar]
24. Villanueva RAM, Chen ZJ. ggplot2: elegant graphics for data analysis. Meas: Interdiscip Res Perspect; 2019;17(3):160–7. doi:10.1080/15366367.2019.1565254. [Google Scholar] [CrossRef]
25. Sun W, Su Q, Cao X, Shang B, Chen A, Yin H, et al. High expression of polo-like kinase 1 is associated with early development of hepatocellular carcinoma. Int J Genomics. 2014;2014(8):1–9. doi:10.1155/2014/312130. [Google Scholar] [PubMed] [CrossRef]
26. Li L, Huang K, Zhao H, Chen B, Ye Q, Yue J. CDK1-PLK1/SGOL2/ANLN pathway mediating abnormal cell division in cell cycle may be a critical process in hepatocellular carcinoma. Cell Cycle. 2020;19(10):1236–52. doi:10.1080/15384101.2020.1749471. [Google Scholar] [PubMed] [CrossRef]
27. Goodman B, Gardner H. The microbiome and cancer. J Pathol. 2018;244(5):667–76. doi:10.1002/path.5047. [Google Scholar] [PubMed] [CrossRef]
28. Jiang J-W, Chen X-H, Ren Z, Zheng S-S. Gut microbial dysbiosis associates hepatocellular carcinoma via the gut-liver axis. HBPD Int. 2019;18(1):19–27. doi:10.1016/j.hbpd.2018.11.002. [Google Scholar] [PubMed] [CrossRef]
29. Song Q, Zhang X. The role of gut-liver axis in gut microbiome dysbiosis associated NAFLD and NAFLD-HCC. Biomedicines. 2022;10(3):524. doi:10.3390/biomedicines10030524. [Google Scholar] [PubMed] [CrossRef]
30. Schwabe RF, Greten TF. Gut microbiome in HCC-mechanisms, diagnosis and therapy. J Hepatol. 2020;72(2):230–8. doi:10.1016/j.jhep.2019.08.016. [Google Scholar] [PubMed] [CrossRef]
31. Kumar M, Kaur R, Kanthaje S, Dhiman RK, Chakraborti A. Bacterial metabolite butyrate in modulating sorafenib-targeted microRNAs to curtail its resistance in hepatocellular carcinoma. J Cancer Res Clin Oncol. 2023;149(9):5823–39. doi:10.1007/s00432-022-04544-7. [Google Scholar] [PubMed] [CrossRef]
32. Mosesson MW. Fibrinogen and fibrin structure and functions. J Thromb Haemost. 2005;3(8):1894–904. doi:10.1111/j.1538-7836.2005.01365.x. [Google Scholar] [PubMed] [CrossRef]
33. Lashen AG, Toss MS, Wootton L, Green AR, Mongan NP, Madhusudan S, et al. Characteristics and prognostic significance of polo-like kinase-1 (PLK1) expression in breast cancer. Histopathology. 2023;83(3):414–25. doi:10.1111/his.14960. [Google Scholar] [PubMed] [CrossRef]
34. Han DP, Zhu QL, Cui JT, Wang PX, Qu S, Cao QF, et al. Polo-like kinase 1 is overexpressed in colorectal cancer and participates in the migration and invasion of colorectal cancer cells. Med Sci Monit. 2012;18(6):BR237–46. doi:10.12659/MSM.882900. [Google Scholar] [PubMed] [CrossRef]
35. Shi W, Zhang G, Ma Z, Li L, Liu M, Qin L, et al. Hyperactivation of HER2-SHCBP1-PLK1 axis promotes tumor cell mitosis and impairs trastuzumab sensitivity to gastric cancer. Nat Commun. 2021;12(1):2812. doi:10.1038/s41467-021-23053-8. [Google Scholar] [PubMed] [CrossRef]
36. Fan W, Ma H, Jin B. Expression of FOXM1 and PLK1 predicts prognosis of patients with hepatocellular carcinoma. Oncol Lett. 2022;23(5):1–12. doi:10.3892/ol.2022.13266. [Google Scholar] [PubMed] [CrossRef]
37. Ruf S, Heberle AM, Langelaar-Makkinje M, Gelino S, Wilkinson D, Gerbeth C, et al. PLK1 (polo like kinase 1) inhibits MTOR complex 1 and promotes autophagy. Autophagy. 2017;13(3):486–505. doi:10.1080/15548627.2016.1263781. [Google Scholar] [PubMed] [CrossRef]
38. Liu Z, Sun Q, Wang X. PLK1, a potential target for cancer therapy. Transl Oncol. 2017;10(1):22–32. doi:10.1016/j.tranon.2016.10.003. [Google Scholar] [PubMed] [CrossRef]
39. Wolf G, Elez R, Doermer A, Holtrich U, Ackermann H, Stutte HJ, et al. Prognostic significance of polo-like kinase (PLK) expression in non-small cell lung cancer. Oncogene. 1997;14(5):543–9. doi:10.1038/sj.onc.1200862. [Google Scholar] [PubMed] [CrossRef]
40. Chiappa M, Petrella S, Damia G, Broggini M, Guffanti F, Ricci F. Present and future perspective on PLK1 inhibition in cancer treatment. Front Oncol. 2022;12:903016. doi:10.3389/fonc.2022.903016. [Google Scholar] [PubMed] [CrossRef]
41. Luo J, Emanuele MJ, Li D, Creighton CJ, Schlabach MR, Westbrook TF, et al. A genome-wide RNAi screen identifies multiple synthetic lethal interactions with the Ras oncogene. Cell. 2009;137(5):835–48. doi:10.1016/j.cell.2009.05.006. [Google Scholar] [PubMed] [CrossRef]
42. Zhang H, Diab A, Fan H, Mani SKK, Hullinger R, Merle P, et al. PLK1 and HOTAIR accelerate proteasomal degradation of SUZ12 and ZNF198 during Hepatitis B virus-induced liver carcinogenesis. Cancer Res. 2015;75(11):2363–74. doi:10.1158/0008-5472.CAN-14-2928. [Google Scholar] [PubMed] [CrossRef]
43. Li Z, Li J, Bi P, Lu Y, Burcham G, Elzey BD, et al. Plk1 phosphorylation of PTEN causes a tumor-promoting metabolic state. Mol Cell Biol. 2014;34(19):3642–61. doi:10.1128/MCB.00814-14. [Google Scholar] [PubMed] [CrossRef]
44. Zhang R, Ai J, Wang J, Lu H, He A, Li M, et al. NCAPG promotes the proliferation of hepatocellular carcinoma through the CKII-dependent regulation of PTEN. J Transl Med. 2022;20(1):1–16. doi:10.1186/s12967-022-03519-z. [Google Scholar] [PubMed] [CrossRef]
45. Li J, Sun S, Li J, Zhao X, Li Z, Sha T, et al. NCAPG, mediated by miR-378a-3p, regulates cell proliferation, cell cycle progression, and apoptosis of oral squamous cell carcinoma through the GSK-3β/β-catenin signaling. Neoplasma. 2021;68(6):1201–11. doi:10.4149/neo_2021_210421N544. [Google Scholar] [PubMed] [CrossRef]
46. Zhang Z, Qi D, Liu X, Kang P. NCAPG stimulates lung adenocarcinoma cell stemness through aerobic glycolysis. Clin Respir J. 2023;17(9):884–92. doi:10.1111/crj.13676. [Google Scholar] [PubMed] [CrossRef]
47. Cai X, Gao J, Shi C, Guo WZ, Guo D, Zhang S. The role of NCAPG in various of tumors. Biomed Pharmacother. 2022;155(3):113635. doi:10.1016/j.biopha.2022.113635. [Google Scholar] [PubMed] [CrossRef]
48. Gong C, Ai J, Fan Y, Gao J, Liu W, Feng Q, et al. NCAPG promotes the proliferation of hepatocellular carcinoma through PI3K/AKT signaling. Onco Targets Ther. 2019;16(12):8537–52. [Google Scholar]
49. Fu Y, Liu S, Rodrigues RM, Han Y, Guo C, Zhu Z, et al. Activation of VIPR1 suppresses hepatocellular carcinoma progression by regulating arginine and pyrimidine metabolism. Int J Biol Sci. 2022;18(11):4341–56. doi:10.7150/ijbs.71134. [Google Scholar] [PubMed] [CrossRef]
50. Aliyu M, Saboor-Yaraghi AA, Nejati S, Robat-Jazi B. Urinary VPAC1: a potential biomarker in prostate cancer. AIMS Allergy Immunol. 2022;6(2):42–63. doi:10.3934/Allergy.2022006. [Google Scholar] [CrossRef]
51. Herraez E, Lozano E, Macias RIR, Vaquero J, Bujanda L, Banales JM, et al. Expression of SLC22A1 variants may affect the response of hepatocellular carcinoma and cholangiocarcinoma to sorafenib. Hepatology. 2013;58(3):1065–73. doi:10.1002/hep.v58.3. [Google Scholar] [CrossRef]
52. Lautem A, Heise M, Gräsel A, Hoppe-Lotichius M, Weiler N, Foltys D, et al. Downregulation of organic cation transporter 1 (SLC22A1) is associated with tumor progression and reduced patient survival in human cholangiocellular carcinoma. Int J Oncol. 2013;42:1297–304. doi:10.3892/ijo.2013.1840. [Google Scholar] [PubMed] [CrossRef]
53. Soto M, Reviejo M, Al-Abdulla R, Romero MR, Macias RIR, Boix L, et al. Relationship between changes in the exon-recognition machinery and SLC22A1 alternative splicing in hepatocellular carcinoma. BBA–Mol Basis Dis. 2020;1866(5):165687. doi:10.1016/j.bbadis.2020.165687. [Google Scholar] [PubMed] [CrossRef]
54. Schaeffeler E, Hellerbrand C, Nies AT, Winter S, Kruck S, Hofmann U, et al. DNA methylation is associated with downregulation of the organic cation transporter OCT1 (SLC22A1) in human hepatocellular carcinoma. Genome Med. 2011;3:1–12. [Google Scholar]
55. Park HM, Kim H, Kim DW, Yoon JH, Kim BG, Cho JY. Common plasma protein marker LCAT in aggressive human breast cancer and canine mammary tumor. BMB Rep. 2020;53(12):664–9. doi:10.5483/BMBRep.2020.53.12.238. [Google Scholar] [PubMed] [CrossRef]
56. Chen S, Yin P, Zhao X, Xing W, Hu C, Zhou L, et al. Serum lipid profiling of patients with chronic hepatitis B, cirrhosis, and hepatocellular carcinoma by ultra fast LC/IT-TOF MS. Electrophoresis. 2013;34(19):2848–56. doi:10.1002/elps.v34.19. [Google Scholar] [CrossRef]
57. Yang K, Wang J, Xiang H, Ding P, Wu T, Ji G. LCAT-targeted therapies: progress, failures and future. Biomed Pharmacother. 2022;147:112677. doi:10.1016/j.biopha.2022.112677. [Google Scholar] [PubMed] [CrossRef]
58. Kim JY, Kim M-J, Lee JS, Son J, Kim D-H, Lee JS, et al. Stratifin (SFN) regulates lung cancer progression via nucleating the Vps34-BECN1-TRAF6 complex for autophagy induction. Clin Trans Med. 2022;12(6):e896. doi:10.1002/ctm2.v12.6. [Google Scholar] [CrossRef]
59. Ren H-Z, Pan G-q, Wang J-S, Wen J-F, Wang K-S, Luo G-Q, et al. Reduced stratifin expression can serve as an independent prognostic factor for poor survival in patients with esophageal squamous cell carcinoma. Dig Dis Sci. 2010;55(9):2552–60. doi:10.1007/s10620-009-1065-0. [Google Scholar] [PubMed] [CrossRef]
60. Ye S-P, Yu H-X, Lu W-J, Wang J-F, Li T-Y, Shi J, et al. Stratifin promotes hepatocellular carcinoma progression by modulating the Wnt/β-catenin pathway. Int J Genomics. 2023;2023:9731675. [Google Scholar] [PubMed]
61. Yang L, Zhang Z, Sun Y, Pang S, Yao Q, Lin P, et al. Integrative analysis reveals novel driver genes and molecular subclasses of hepatocellular carcinoma. Aging. 2020;12(23):23849–71. doi:10.18632/aging.v12i23. [Google Scholar] [CrossRef]
62. Wojcieszyńska D, Hupert-Kocurek K, Guzik U. Flavin-dependent enzymes in cancer prevention. Int J Mol Sci. 2012;13(12):16751–68. doi:10.3390/ijms131216751. [Google Scholar] [PubMed] [CrossRef]
63. Hlady RA, Sathyanarayan A, Thompson JJ, Zhou D, Wu Q, Pham K, et al. Integrating the epigenome to identify drivers of hepatocellular carcinoma. Hepatology. 2019;69(2):639–52. doi:10.1002/hep.30211. [Google Scholar] [PubMed] [CrossRef]
64. Silberman A, Goldman O, Boukobza Assayag O, Jacob A, Rabinovich S, Adler L, et al. Acid-induced downregulation of ASS1 contributes to the maintenance of intracellular pH in cancer. Cancer Res. 2019;79(3):518–33. doi:10.1158/0008-5472.CAN-18-1062. [Google Scholar] [PubMed] [CrossRef]
65. Kim S, Lee M, Song Y, Lee S-Y, Choi I, Park IS, et al. Argininosuccinate synthase 1 suppresses tumor progression through activation of PERK/eIF2α/ATF4/CHOP axis in hepatocellular carcinoma. J Exp Clin Cancer Res. 2021;40(1):127. doi:10.1186/s13046-021-01912-y. [Google Scholar] [PubMed] [CrossRef]
66. Zhang Y, Chen X, Cao Y, Yang Z. C8B in complement and coagulation cascades signaling pathway is a predictor for survival in HBV-related hepatocellular carcinoma patients. Cancer Manag Res. 2021;13:3503–15. doi:10.2147/CMAR.S302917. [Google Scholar] [PubMed] [CrossRef]
67. Wang X, Tang N, Shen N, Lu Y, Li D. Congenital fibrinogen disorder caused by digenic mutations of the FGA and FGB genes. Hematology. 2020;25(1):145–8. doi:10.1080/16078454.2020.1746109. [Google Scholar] [PubMed] [CrossRef]
68. Théret N, Bouezzedine F, Azar F, Diab-Assaf M, Legagneux V. ADAM and ADAMTS proteins, new players in the regulation of hepatocellular carcinoma microenvironment. Cancers. 2021;13(7):1563. doi:10.3390/cancers13071563. [Google Scholar] [PubMed] [CrossRef]
69. Thomas H. Loss of CD4+ T cells in HCC. Nat Rev Gastroenterol Hepatol. 2016;13(4):190. doi:10.1038/nrgastro.2016.47. [Google Scholar] [PubMed] [CrossRef]
70. Speiser DE, Chijioke O, Schaeuble K, Münz C. CD4+ T cells in cancer. Nat Cancer. 2023;4(3):317–29. doi:10.1038/s43018-023-00521-2. [Google Scholar] [PubMed] [CrossRef]
71. Crispe IN. The liver as a lymphoid organ. Annu Rev Immunol. 2009;27(1):147–63. doi:10.1146/annurev.immunol.021908.132629. [Google Scholar] [PubMed] [CrossRef]
72. Sun J, Althoff KN, Jing Y, Horberg MA, Buchacz K, Gill MJ, et al. Trends in hepatocellular carcinoma incidence and risk among persons with HIV in the US and Canada, 1996-2015. JAMA Netw Open. 2021;4(2):e2037512. doi:10.1001/jamanetworkopen.2020.37512. [Google Scholar] [PubMed] [CrossRef]
73. Slizhikova DK, Zinovyeva MV, Kuzmin DV, Snezhkov EV, Shakhparonov MI, Dmitriev RI, et al. Decreased expression of the human immunoglobulin J-chain gene in squamous cell cancer and adenocarcinoma of the lungs. Mol Biol. 2007;41(4):594–600. doi:10.1134/S0026893307040115. [Google Scholar] [CrossRef]
74. Kim H, Yu SJ, Yeo I, Cho YY, Lee DH, Cho Y, et al. Prediction of response to sorafenib in hepatocellular carcinoma: a putative marker panel by multiple reaction monitoring-mass spectrometry (MRM-MS). Mol Cell Proteomics. 2017;16(7):1312–23. doi:10.1074/mcp.M116.066704. [Google Scholar] [PubMed] [CrossRef]
75. Mantis NJ, Rol N, Corthésy B. Secretory IgA’s complex roles in immunity and mucosal homeostasis in the gut. Mucosal Immunol. 2011;4(6):603–11. doi:10.1038/mi.2011.41. [Google Scholar] [PubMed] [CrossRef]
76. Wang Q, Shao X, Zhang Y, Zhu M, Wang FXC, Mu J, et al. Role of tumor microenvironment in cancer progression and therapeutic strategy. Cancer Med. 2023;12(10):11149–65. doi:10.1002/cam4.v12.10. [Google Scholar] [CrossRef]
77. Neophytou CM, Panagi M, Stylianopoulos T, Papageorgis P. The role of tumor microenvironment in cancer metastasis: molecular mechanisms and therapeutic opportunities. Cancers. 2021;13(9):2053. doi:10.3390/cancers13092053. [Google Scholar] [PubMed] [CrossRef]
78. Zhang J, Han H, Wang L, Wang W, Yang M, Qin Y. Overcoming the therapeutic resistance of hepatomas by targeting the tumor microenvironment. Front Oncol. 2022;12:988956. doi:10.3389/fonc.2022.988956. [Google Scholar] [PubMed] [CrossRef]
79. Sangro B, Gomez-Martin C, de la Mata M, Iñarrairaegui M, Garralda E, Barrera P, et al. A clinical trial of CTLA-4 blockade with tremelimumab in patients with hepatocellular carcinoma and chronic hepatitis C. J Hepatol. 2013;59(1):81–8. doi:10.1016/j.jhep.2013.02.022. [Google Scholar] [PubMed] [CrossRef]
80. El-Khoueiry AB, Sangro B, Yau T, Crocenzi TS, Kudo M, Hsu C, et al. Nivolumab in patients with advanced hepatocellular carcinoma (CheckMate 040an open-label, non-comparative, phase 1/2 dose escalation and expansion trial. The Lancet. 2017;389(10088):2492–502. doi:10.1016/S0140-6736(17)31046-2. [Google Scholar] [PubMed] [CrossRef]
81. Hao X, Sun G, Zhang Y, Kong X, Rong D, Song J, et al. Targeting immune cells in the tumor microenvironment of HCC: new opportunities and challenges. Front Cell Dev Biol. 2021;9:775462. doi:10.3389/fcell.2021.775462. [Google Scholar] [PubMed] [CrossRef]
82. Abbas AK, Lichtman AH, Pillai S. Basic immunology e-book: functions and disorders of the immune system. India: Elsevier Health Sciences; 2019. [Google Scholar]
83. Huang C, Zhang C, Sheng J, Wang D, Zhao Y, Qian L, et al. Identification and validation of a tumor microenvironment-related gene signature in hepatocellular carcinoma prognosis. Front Genet. 2021;12:717319. doi:10.3389/fgene.2021.717319. [Google Scholar] [PubMed] [CrossRef]
84. Addeo A, Friedlaender A, Banna GL, Weiss GJ. TMB or not TMB as a biomarker: that is the question. Crit Rev Oncol Hematol. 2021;163:103374. doi:10.1016/j.critrevonc.2021.103374. [Google Scholar] [PubMed] [CrossRef]
85. Wu HX, Wang ZX, Zhao Q, Chen DL, He MM, Yang LP, et al. Tumor mutational and indel burden: a systematic pan-cancer evaluation as prognostic biomarkers. Ann Transl Med. 2019;7(22):640. doi:10.21037/atm. [Google Scholar] [CrossRef]
86. Zhang L, Li B, Peng Y, Wu F, Li Q, Lin Z, et al. The prognostic value of TMB and the relationship between TMB and immune infiltration in head and neck squamous cell carcinoma: a gene expression-based study. Oral Oncol. 2020;110:104943. doi:10.1016/j.oraloncology.2020.104943. [Google Scholar] [PubMed] [CrossRef]
87. Harris RS. Cancer mutation signatures, DNA damage mechanisms, and potential clinical implications. Genome Med. 2013;5(9):87. doi:10.1186/gm490. [Google Scholar] [PubMed] [CrossRef]
88. Song JP, Liu XZ, Chen Q, Liu YF. High tumor mutation burden indicates a poor prognosis in patients with intrahepatic cholangiocarcinoma. World J Clin Cases. 2022;10(3):790–801. doi:10.12998/wjcc.v10.i3.790. [Google Scholar] [PubMed] [CrossRef]
89. Cheng ML, Oxnard GR. Does TMB impact the effectiveness of TKIs in EGFR-Mutant NSCLC? Clin Cancer Res. 2019;25(3):899–900. doi:10.1158/1078-0432.CCR-18-2368. [Google Scholar] [PubMed] [CrossRef]
90. Cai H, Zhang Y, Zhang H, Cui C, Li C, Lu S. Prognostic role of tumor mutation burden in hepatocellular carcinoma after radical hepatectomy. J Surg Oncol. 2020;121(6):1007–14. doi:10.1002/jso.v121.6. [Google Scholar] [CrossRef]
91. Ueda A, Oikawa K, Fujita K, Ishikawa A, Sato E, Ishikawa T, et al. Therapeutic potential of PLK1 inhibition in triple-negative breast cancer. Lab Invest. 2019;99(9):1275–86. doi:10.1038/s41374-019-0247-4. [Google Scholar] [PubMed] [CrossRef]
92. Russo MA, Kang KS, Di Cristofano A. The PLK1 inhibitor GSK461364A is effective in poorly differentiated and anaplastic thyroid carcinoma cells, independent of the nature of their driver mutations. Thyroid. 2013;23(10):1284–93. doi:10.1089/thy.2013.0037. [Google Scholar] [PubMed] [CrossRef]
93. Zhou J, Yang Q, Lu L, Tuo Z, Shou Z, Cheng J. PLK1 inhibition induces immunogenic cell death and enhances immunity against NSCLC. Int J Med Sci. 2021;18(15):3516. doi:10.7150/ijms.60135. [Google Scholar] [PubMed] [CrossRef]
94. Chen M, Shen C, Chen Y, Zhou K, Li W, Chen Z, et al. Metformin potentiates gilteritinib sensitivity Via targeting PLK1 signaling: a strategy to improve outcomes and reduce costs in treating FLT3-mutated acute myeloid leukemia. Blood. 2023;142:1427. doi:10.1182/blood-2023-187751. [Google Scholar] [CrossRef]
95. He Z, Deng W, Jiang B, Liu S, Tang M, Liu Y, et al. Hsa-let-7b inhibits cell proliferation by targeting PLK1 in HCC. Gene. 2018;673:46–55. doi:10.1016/j.gene.2018.06.047. [Google Scholar] [PubMed] [CrossRef]
96. Liao Z, Zhang Q, Yang L, Li H, Mo W, Song Z, et al. Increased hsa-miR-100-5p expression improves hepatocellular carcinoma prognosis in the asian population with PLK1 variant rs27770A>G. Cancers. 2024;16(1):129. doi:10.3390/cancers16010129. [Google Scholar] [PubMed] [CrossRef]
97. Zhang W, Liu S, Liu K, Liu Y. Long non-coding RNA deleted in lymphocytic leukaemia 1 promotes hepatocellular carcinoma progression by sponging miR-133a to regulate IGF-1R expression. J Cell Mol Med. 2019;23(8):5154–64. doi:10.1111/jcmm.14384. [Google Scholar] [PubMed] [CrossRef]
Cite This Article
 Copyright © 2024 The Author(s). Published by Tech Science Press.
This work is licensed under a Creative Commons Attribution 4.0 International License , which permits unrestricted use, distribution, and reproduction in any medium, provided the original work is properly cited.


 Submit a Paper
 Propose a Special lssue
 View Full Text
 Download PDF
 Downloads
 Citation Tools