
 Submit a Paper
 Propose a Special lssue
 Open Access
ARTICLE

Analysis of the mechanism of aldo-keto reductase dependent cis-platin resistance in HepG2 cells based on transcriptomic and NADH metabolic state
Changchun University of Science and Technology, Changchun, 130022, China
* Corresponding Authors: YUANHUA YU. Email: ; LE GAO. Email:
(This article belongs to the Special Issue: Bioinformatics Study of Diseases)
BIOCELL 2023, 47(4), 879-889. https://doi.org/10.32604/biocell.2023.026229
Received 25 August 2022; Accepted 17 November 2022; Issue published 08 March 2023
 View Full Text
 Download PDF
Abstract
Background: Aldo-keto oxidoreductase (AKR) inhibitors could reverse the resistance of several cancer cells to cis-platin, but their role in resistance remains unclear.Methods: We verified the difference of AKR1Cs expression by Western blot, RNA sequencing and qRT-PCR. The differences of AKR1Cs expression were analyzed and inferred. Use Assay of NADH and NAD+ content to verify the inference. The Docking experience was used to verify the affinity between MPA, MCFLA, MLS and AKR1C3.Results: Our RNA-seq results showed de novo NAD biosynthesis-related genes and NAD(P)H-dependent oxidoreductases were significantly upregulated in cis-platin-resistant HepG2 hepatic cancer cells (HepG2-RC cells) compared with HepG2 cells. At least 63 NAD(P)H-dependent reductase/oxidases were upregulated in HepG2-RC cells at least twofold. Knockdown of AKR1Cs could increase cis-platin sensitivity in HepG2-RC cells about two-fold. Interestingly, the AKR1C inhibitor meclofenamic acid could increase the cis-platin sensitivity of HepG2-RC cells about eight-fold, indicating that the knockdown of AKR1Cs only partially reversed the resistance. Meanwhile, the amount of total NAD and the ratio of NADH/NAD+ were increased in HepG2-RC cells compared with HepG2 cells. The ratio of NADH/NAD+ in HepG2-RC cells was almost seven-fold higher than in HepG2 or HL-7702 cells. Increased NADH expression could be explained as a directly operating antioxidant to scavenge cis-platin-induced radicals.Conclusion: We report here that NADH, which is produced by NAD(P)H-dependent oxidoreductases, plays a key role in the AKR-associated cis-platin resistance of HepG2 hepatic cancer cells.Keywords
Aldo-keto reductases (AKRs) are nicotinamide adenine dinucleotide phosphate (NAD(P)H)-dependent oxidoreductases that reduce carbonyl substrates with NAD(P)H and are present in all three domains of life. Human AKRs are important in metabolic pathways such as steroid biosynthesis, alcohol oxidation, and xenobiotic elimination (Penning, 2014). The expression level of AKRs is closely related to malignant transformation and drug resistance (Penning et al., 2021). Some AKRs, such as AKR1B10 (Fukumoto et al., 2005) and AKR1Cs (Rižner et al., 2006; Byrns et al., 2012), are correlated with carcinogenesis.
AKR1Cs (including AKR1C1, AKR1C2, AKR1C3, and AKR1C4) are located on P15-P14 of chromosome 10. AKR1Cs are composed of 12 exons with a molecular weight of about 37 kDa. AKR1Cs are enzymes that interconvert steroids between their active and inactive forms. In this way, they can regulate the production, inactivation and metabolism of various hormones. Therefore, they represent the target of important emerging drugs, which can be used to develop drugs to treat hormone-dependent cancers, such as breast cancer, prostate cancer, endometrial cancer, lymphoblastic leukemia/lymphoma, etc. (Rizner et al., 2003; Brožič et al., 2011; Qi et al., 2013; Reddi et al., 2022).
The development of cancer is fast, particularly when the cells develop drug resistance, and the human body cannot bear the side effects of chemotherapy drugs; the cancer cells develop uncontrollably. Therefore, the role of AKR in cancer tolerance has become an emerging field of research. AKR family is closely related to the occurrence and development of cancer, which has received increasing attention from researchers in recent years. After using cis-platin, the platinum in the blood and urine samples of cancer patients was determined by HPLC (Lanjwani et al., 2006).
Resistance studies have found that the inactivation of reduced metabolism by carbonyl groups is the cause of failure of applicable pharmacotherapy targeting carbonyl groups. AKR1C1, AKR1C2, and AKR1C4 were found to mediate the conversion of the novel anticancer drug Olacin into the inactive metabolite L-Dihydroorotic acid (DHO) (Wsol et al., 2007; Novotna et al., 2008). AKR1C1 is effectively inhibited by ruthenium complexes, and AKR1C2 and AKR1C3 have ant-proliferation and anti-chemotherapy effects (Kljun et al., 2022). AKR1C1 and AKR1C3 can effectively eliminate daunorubicin in chemotherapeutic leukemia U937 cells by inducing the metabolism of DNR and cytotoxic aldehydes from ROS-linked lipid peroxidation (Matsunaga et al., 2014). AKR1C3 is associated with doxorubicin resistance in breast cancer, which is caused by the activation of anti-apoptotic PTEN/Akt pathways through PTEN loss (Zhong et al., 2015). The reduction response of daunorubicin and idarubicin, catalyzed by AKR1C3, also contributes to the therapeutic effect of cancer cells on anthracycline antibiotics (Hofman et al., 2014). The hyperexpression of AKR1C2 leads to an increase in the activity of dihydrodiol dehydrogenase, which may play a detoxifying effect on the free radicals produced by cis-platin, and with the increase in the activity of dihydrodiol dehydrogenase, the reaction will effectively repair the damage caused by platinum drugs such as cis-platin and induce drug resistance in cancer cells (Deng et al., 2004). In human ovarian cancer cell lines, cis-platin resistance is due to overexpression of AKR1C1, but the underlying mechanism of action is unclear (Deng et al., 2002). Studies have shown that knocking out the AKR1C1 and AKR1C3 genes in drug-resistant cells or using specific AKRs inhibitors can increase cell sensitivity to cis-platin toxicity (Matsunaga et al., 2013; He et al., 2022). AKR1C1 and AKR1C3 mediate the resistance of gastric cancer cells to cis-platin through autophagic cell death (Phoo et al., 2021). AKR1Cs have also been related to cis-platin resistance in gastric carcinoma TSGH-S3 cells (Chen et al., 2013) and metastatic bladder cancer cells (Matsumoto et al., 2016).
Cisplatin is a front-line chemotherapeutic agent for cancer treatment (Bellmunt et al., 2009). The AKR1C inhibitor flufenamic acid was found useful in reversing cis-platin resistance of bladder cancer (Matsumoto et al., 2016). It was speculated that AKR1Cs could reduce some cytotoxic lipid peroxidative products from aldehydes (Chen et al., 2013). Hepatic cancer cells with high expression levels of AKRs usually show a rather high tolerance to Cis-platin treatment. The cell activity of cis-platin, carboplatin, and oxaliplatin in A498 kidney cancer cells shows that the action mode of cis-platin and carboplatin is similar (Schoch et al., 2020). However, the target molecule of AKRs remains unknown. Here we report that NADH, a product of Aldo-keto oxidation-reduction, plays a key role in the Cis-platin resistance of HepG2 hepatic cancer cells.
Human hepatic HL-7702 cells, as well as the hepatic cancer cell lines HepG2 and its Cis-platin-resistant strain HepG2-RC, were purchased from Fusheng Biotechnology (Shanghai, China). HL-7702 cells were cultured at 5% CO2 in Roswell Park Memorial Institute-1640 medium. HepG2 cells were cultured at 5% CO2 in Dulbecco’s Modified Eagle medium. HepG2-RC cells were cultured at 5% CO2 in Minimum Essential Medium Eagle’s medium with increasing Cis-platin concentration until 50% of cells died.
Quantitative real-time polymerase chain reaction (qRT-PCR)
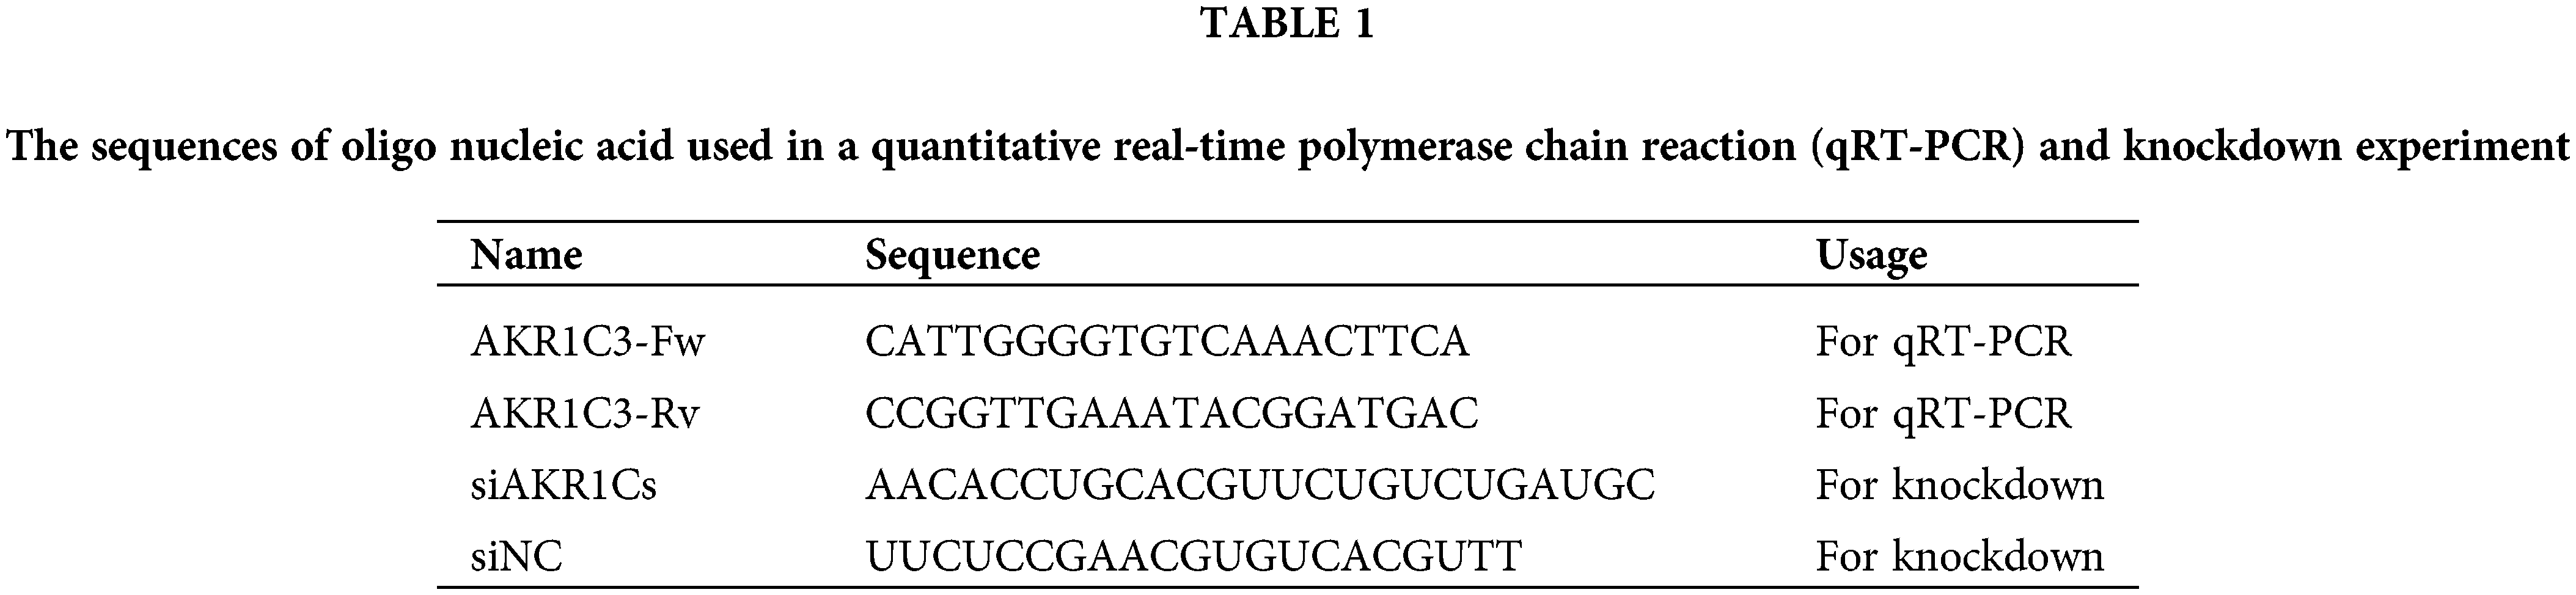
Total RNA isolation and first-strand cDNA synthesis from HL-7702, HepG2, and HepG2-RC cells were performed using a SuperReal Kit (Tiangen, Beijing, China). The primer sequences are listed in Table 1. qRT-PCR was performed using ABI7900HTFast (Thermofisher, Waltham, MA, USA). The data were normalized to the β-actin expression level and were expressed as the fold change relative to the control (2−ΔΔCt).
Cells were washed twice with cold phosphate buffered saline and then lysed in the lysis buffer (0.5% NP-40, 10 mM Tris-HCl [pH 7.4], 150 mM NaCl, 1 mM ethylenediamine tetraacetate, 50 mM NaF, 1 mM phenylmethylsulfonyl fluoride, and 1 mM Na3VO4), the lysis process is 9,000 × g for 10 min to clarify. Then proteins in the supernatant were resolved by sodium dodecyl sulfate-polyacrylamide gel electrophoresis (8%–12%). The separated protein was transferred to a polyvinylidene fluoride membrane and blocked with a blocking solution (Tween-20 [TBS-T] and 5% skimmed milk in Tris-buffered saline) for 1 h at room temperature. Membranes were incubated overnight with the following primary antibodies: anti-AKR1C1 (Abnova, Taiwan), anti-AKR1C2 (Abcam, Cambridge, UK), anti-AKR1C3 (Abcam, Cambridge, UK), and AKR1C4 (Abnova, Taiwan) at 4°C. Membranes were washed with TBS-T before incubating them with the responding secondary antibody. After incubation, membranes were washed three times. Enhanced chemiluminescent (ECL) reagent (GE Healthcare, Little Chalfont, UK) was added to generate a signal, and the Azure C600 detection system (Azure Biosystems, Dublin, USA) was used for detection.
Measuring IC50 of aldo-keto reductase1C inhibitors
The activity of AKR1C3 was estimated by measuring the OD340 (NADH) during the conversion of glyceraldehyde to glycerol by the Vallee–Hoch method. Three inhibitors—medroxyprogesterone acetate (MPA), meclofenamic acid (MCFLA), and methyliasmonate (MLS)—were applied to inhibit AKR1C3 activity. The IC50 of the inhibitors was calculated from the plots of AKR1C3 activity vs. the concentration of inhibitors. Each sample was measured in triplicate.
MPA, MCFLA, and MLS were applied to reverse cis-platin resistance of HepG2-RC. The inhibitors at given concentrations (MPA: 0.31 mM, MCFLA: 0.12 mM, MLS: 0.13 mM) were co-incubated with HepG2-RC cells under a gradient concentration of Cis-platin. The cis-platin IC50 of each inhibitor-treated HepG2-RC sample was then calculated from the 2,5-diphenyl-2H-tetrazolium bromide (MTT) assay.
For the knockdown of AKR1Cs in HepG2-RC cells, small interfering RNAs (siRNAs) targeting human AKR1C1-4 were synthesized by Qiagen (Valencia, USA). HepG2-RC cells (5 × 10⁶ cells/well) were transfected with 50 nM of si-AKR1Cs or si-scramble as control (sequences are provided in Table 1) using HiPerfect transfection reagent (Qiagen, Valencia, USA). After 24 or 48 h of transfection, cells were subjected to RT-PCR and immunoblotting to identify whether AKR1Cs were knocked down. The HepG2-RC cells in which knockdown of AKR1Cs was successful then underwent a Cis-platin IC50 test as described above.
RNA-sequencing and data analysis
Approximately 106 HepG2 and HepG2-RC cells were frozen on dry ice. RNA extraction, library preparation, RNA-seq, and bioinformatics analysis were performed at BGI (Shenzhen, China). Each set of cell samples was sequenced in three independent experiments. Image analysis, base-calling, and filtering based on fluorescence purity and output of filtered sequencing files were performed through the Illumina analysis pipeline.
The obtained raw reads of HepG2 and HepG2-RC cells were preprocessed by removing reads containing adapter sequences, reads containing poly-N, and low-quality reads. Quality score (Q)20 and Q30 were calculated. All six runs of HepG2 and HepG2-RC samples showed that at least 96% of reads were Q20, and at least 87% were Q30. All downstream analyses were based on high-quality clean reads. Gene function was annotated based on Gene Ontology (GO) and the Kyoto Encyclopedia of Genes and Genomes (KEGG). Genes with log2(fold change) >1 and fragments per kilobase of transcript per million mapped (FPKM) >0.1 were selected as upregulated genes. Genes with log2(fold change) <−1 and FPKM >0.1 were selected as downregulated genes. Finally, 1486 upregulated genes and 270 downregulated genes were identified.
Assay of NADH and NAD+ content
The amounts of NADH and NAD+ were measured by NAD+/NADH Assay Kit with WST-8 (Beyotime, Shanghai, China). Approximately 106 HL-7702, HepG2, and HepG2-RC cells were collected for NAD+ or NADH extraction. Each sample was divided into two equal parts. One part was used for measuring the total amount of NAD (NAD+ + NADH), and the other part was used for measuring the amount of NADH after 60°C heat treatment. In the assay, NAD+ was first converted to NADH by adding alcohol dehydrogenase and ethanol. NADH then reduced WST-8 to formazan, and the amount of NADH could be measured by monitoring the OD450 value. The ratio of NAD+/NADH was calculated by the formula
AutoDock 4.2.6 (Scripps Research Institute, San Diego, USA) was used to design the docking model of AKR1C3 and the inhibitor protein. ChemBioDraw Ultra 13.0 (PerkinElmer, Waltham, USA) was used to draw the ligands, MPA, MCFLA, and MLS. ChemBio3D Ultra 13.0 uses MMFF94 force field (PerkinElmer, Waltham, USA) for energy minimization. The optimized ligand candidates were saved in PDBQT format. The crystal structure of AKR1C3 was derived from the RCSB protein data bank (ID: 4DBW). The size of the grid box was set to 110, 110, 85 (x, y, z), and the center of the box was placed on Tyr-55 in the A chain. The MPA, MCFLA, and MLS models were docked to the AKR1C3 model (with or without NADP+). The lowest energy of each docking result was selected to reflect the affinities between MPA, MCFLA, MLS, and AKR1C3. Additional validation was provided by the IC50 measurement of each inhibitor.
The statistical analysis was performed using SPSS 22.0 and data were visualized using Origin 2018. Data are presented as the number of categorical variables, and continuous data were expressed as mean ± SD, unless otherwise specified. Then, one-way ANOVA was employed for comparison between multiple groups. The Bonferroni test and LSD-t test were used for the post-hoc test. Only if the ANOVA test was significant, the p-value for pairwise comparisons was computed with the student’s-t test with Bonferroni correction. We considered significant all statistical tests with p value < 0.05 (Dhadve and Ray, 2022; Wang et al., 2022).
Aldo-keto reductase-1C3 was upregulated in HepG2-RC cells compared with HepG2 cells
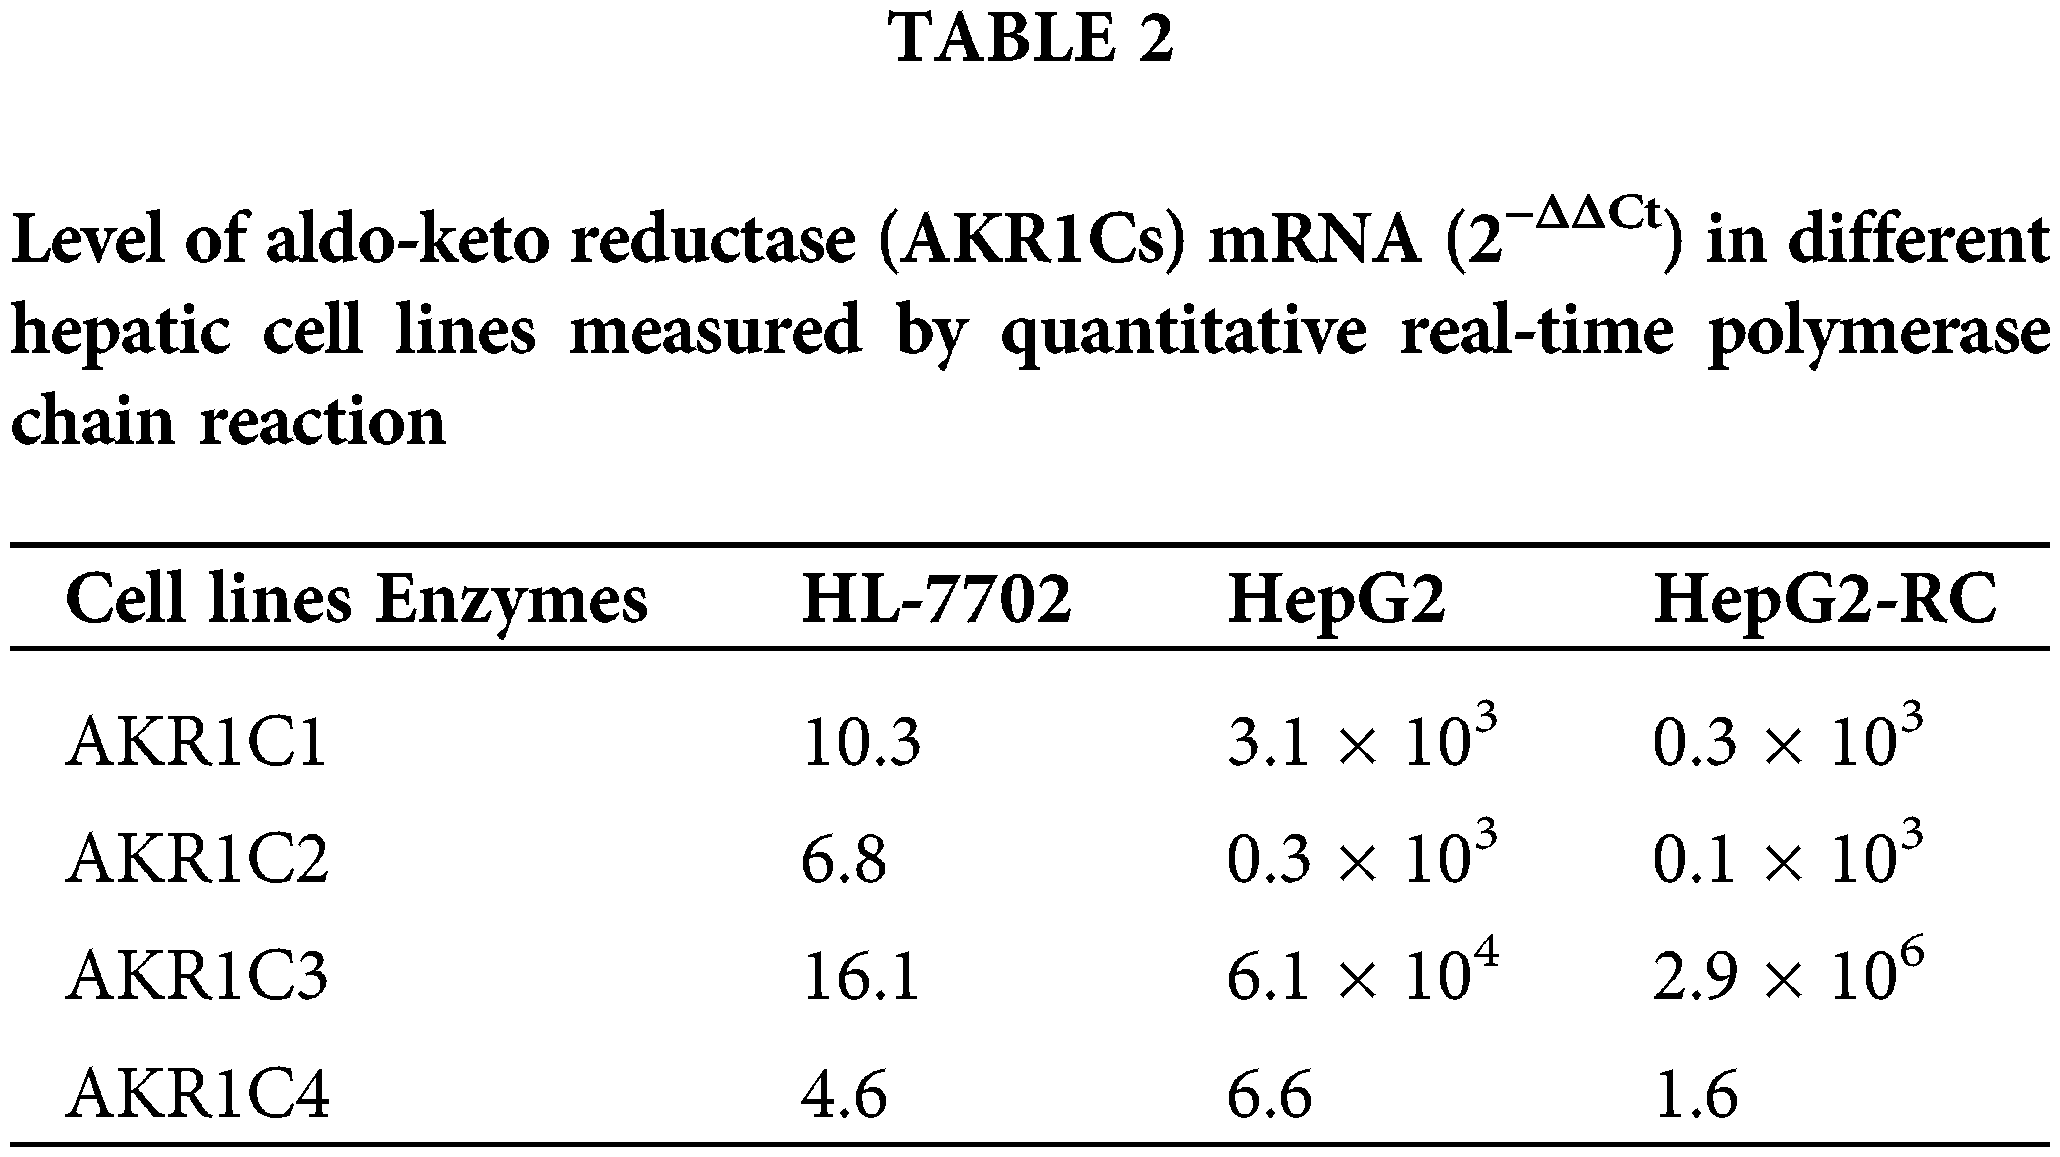
To investigate the differential expression of AKR1Cs in HepG2 and HepG2-RC cells, we evaluated their mRNA and protein levels. According to the qRT-PCR results (Table 2), the mRNA levels of all AKR1C isoenzymes were higher in HepG2 cells compared with human hepatic HL-7702 cells. However, only AKR1C3 was upregulated in HepG2-RC cells compared with HepG2 cells (~50-fold), while the other isoenzymes showed decreased levels in HepG2-RC cells.
According to our western blotting results (Fig. 1), AKR1C1, AKR1C2, and AKR1C4 levels were almost equal between HepG2 and HepG2-RC cells (1.2-fold differences). AKR1C3 (F = 24.264; p = 0.001; HL-7702 vs. HepG2-RC p = 0.010; HL-7702 vs. HepG2 p=0.244; HepG2-RC vs. HepG2 p = 0.001) levels in HepG2-RC cells were as much as 1.5-fold higher than in HepG2 cells, consistent with our qRT-PCR results.
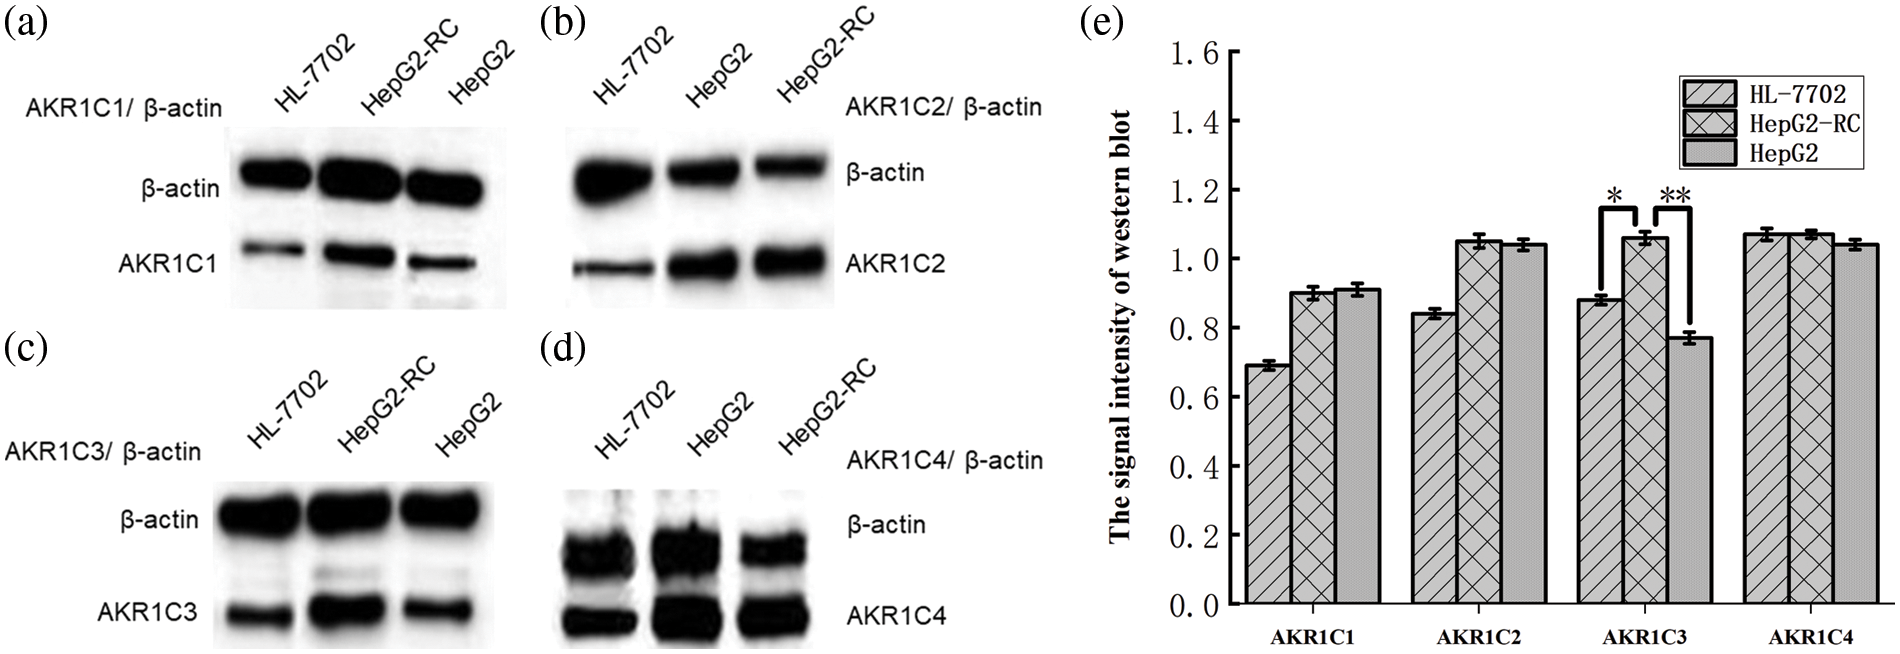
Figure 1: Differential expression of aldo-keto reductase (AKR)1Cs in hepatic cell lines HL-7702, HepG2, and HepG2-RC, as measured with western blot. (a) Differential expression of AKR1C1 in hepatic cell lines; (b) Differential expression of AKR1C2 in hepatic cell lines; (c) Differential expression of AKR1C3 in hepatic cell lines; (d) Differential expression of AKR1C4 in hepatic cell lines. β-actin was selected as an internal reference. The signal intensity of each band was assessed with ImageJ software and divided by the value of β-actin. The ratios of AKR1Cs and β-actin are shown at the top of the figure. (e) The signal intensity of western blot. Bars with different characters were statistically different at *p < 0.05 or **p < 0.01 (n = 3).
Inhibitors of aldo-keto reductase-1C could reverse the cis-platin resistance of HepG2-RC cells
Three AKR1C inhibitors, MPA, MCFLA, and MLS, were applied to reverse cis-platin resistance in HepG2-RC cells. First, the IC50 value of each AKR1C3 inhibitor was determined (Fig. 2a). MPA showed the lowest IC50 value (2.1 µM). The IC50 values of the other inhibitors were 3.3 µM (MCFLA) and 16.3 µM (MLS). However, MCFLA caused the strongest increase in cis-platin sensitivity (~8-fold). MPA and MLS increased cis-platin sensitivity almost 2.5-fold and approximately 1.5-fold, respectively (Fig. 2b).
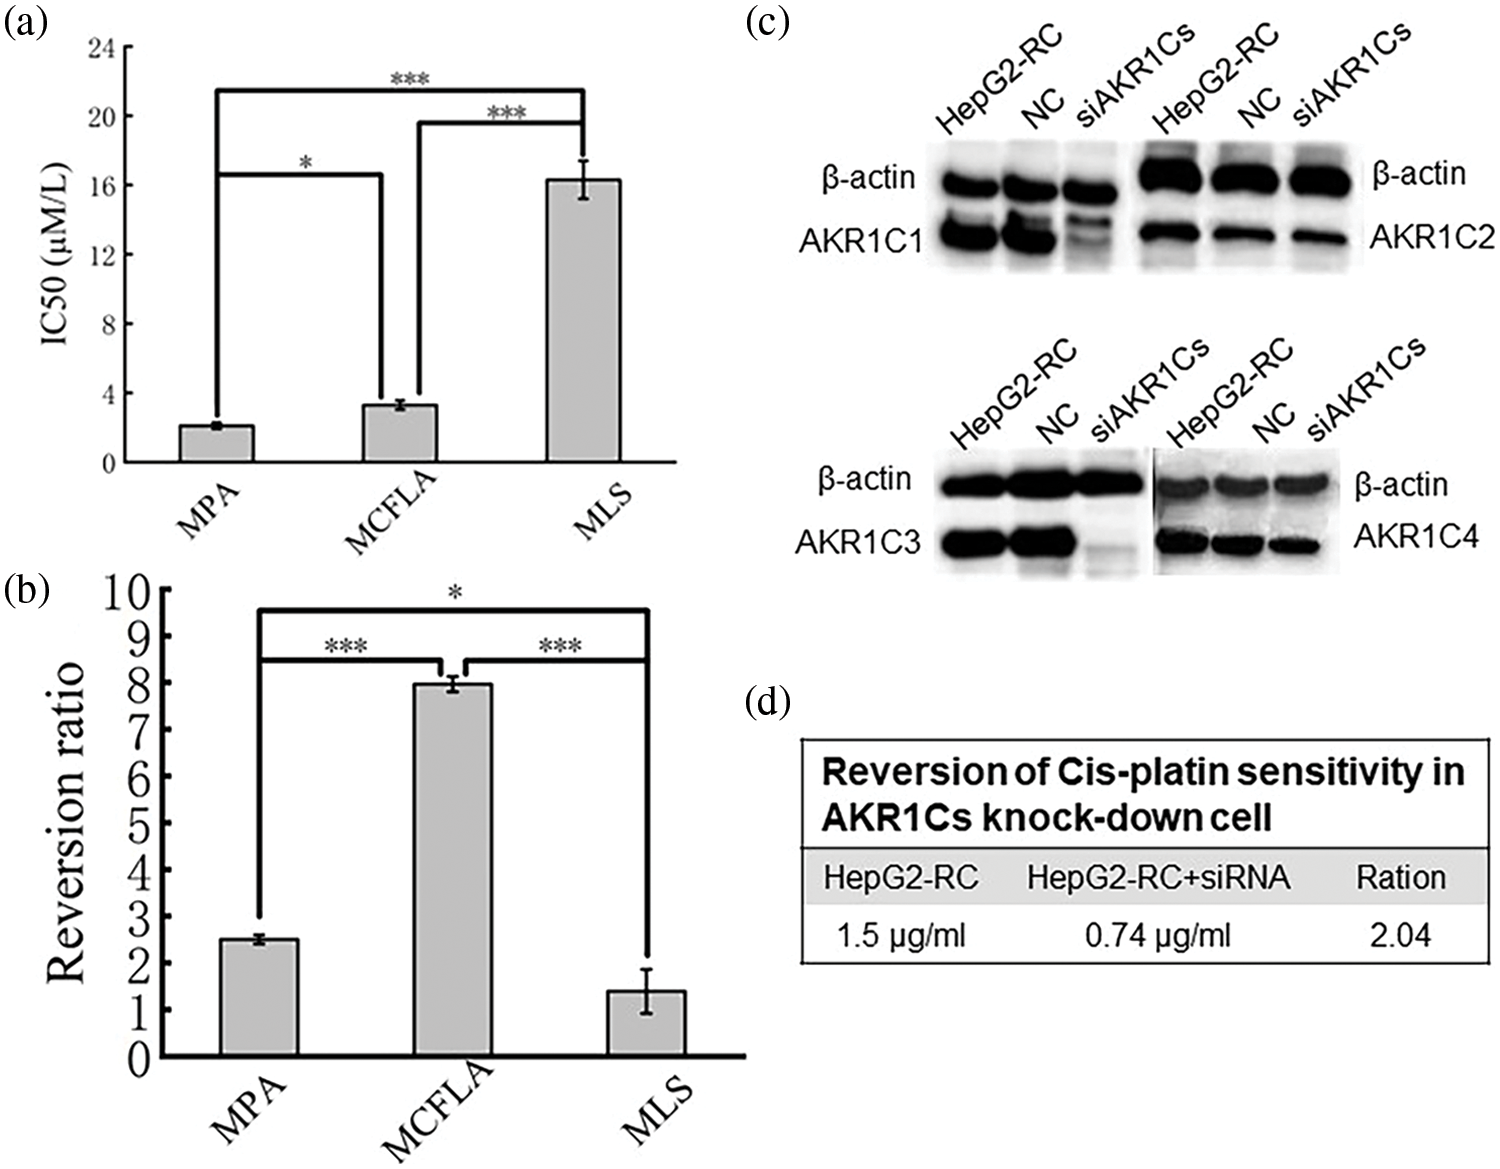
Figure 2: Reversion of cis-platin sensitivity in HepG2-RC. (a) IC50 value of three inhibitors acting on aldo-keto reductase (AKR)1C3. MPA, medroxyprogesterone acetate; MCFLA, meclofenamic acid; MLS, methyliasmonate. (b) Reversion ratio of cis-platin sensitivity in HepG2-RC cells caused by three inhibitors. (c) Knockdown of AKR1Cs by siRNA. Successful knockdown was confirmed with western blot. (d) Reversion of cis-platin sensitivity in AKR1C knockdown cells. Bars with different characters were statistically different at *p < 0.05 or ***p < 0.001 (n = 3).
The one-way ANOVA was employed for comparison between multiple groups (Fig. 2a: F = 3889.489, p < 0.001; Fig. 2b: F = 433.611, p < 0.001). The Bonferroni test was used for the post-hoc test (Fig. 2a: MPA vs. MCFLA p = 0.004; MPA vs. MLS p < 0.001; MCFLA vs. MLS p < 0.001; Fig. 2b: MPA vs. MCFLA p < 0.001; MPA vs. MLS p = 0.011; MCFLA vs. MLS p < 0.001).
SiRNA of aldo-keto reductase-1Cs could partially reverse resistance of HepG2-RC cells
Since AKR1C inhibitors could reverse Cis-platin resistance of HepG2-RC cells, RNAi-mediated knockdown experiments of all AKR1Cs were performed. Western blot results showed that AKR1C1 and AKR1C3 protein levels were strongly reduced, while these remained unchanged in control-siRNA HepG2-RC cells (Fig. 2c). These observations confirmed that AKR1C1 and AKR1C3 were successfully knocked down in HepG2-RC cells.
Cis-platin resistance reversal experiments showed that the AKR1C knockdown HepG2-RC cells could tolerate about twice as low concentrations of cis-platin than the control HepG2-RC cells (Fig. 2d). The effects of AKR1C knockdown on cis-platin resistance were equivalent to the effects of MPA (~2.5-fold reversal) but were much weaker than the effects of MCFLA (~8-fold reversal), indicating that the knockdown of AKR1Cs could partially reverse cis-platin resistance of HepG2-RC cells.
Most NAD(P)H-dependent reductase/oxidases were upregulated in HepG2-RC cells
According to our RNA-seq results, AKR1C levels were not greatly changed in HepG2-RC cells (log2(HEPG2-RC/HEPG2) <2; Table 3), and only AKR1C3 showed a slight increase, while the other three showed a slight decrease. This tendency was consistent with the results of the qRT-PCR assay. Among the 16 human AKR enzymes, four (AKR1B10, AKR1B15, AKR1D1, and AKR1B1) were upregulated about four-fold, while two (AKR1E2 and AKR1C4) were downregulated about twofold; the remaining nine enzymes showed almost no change.
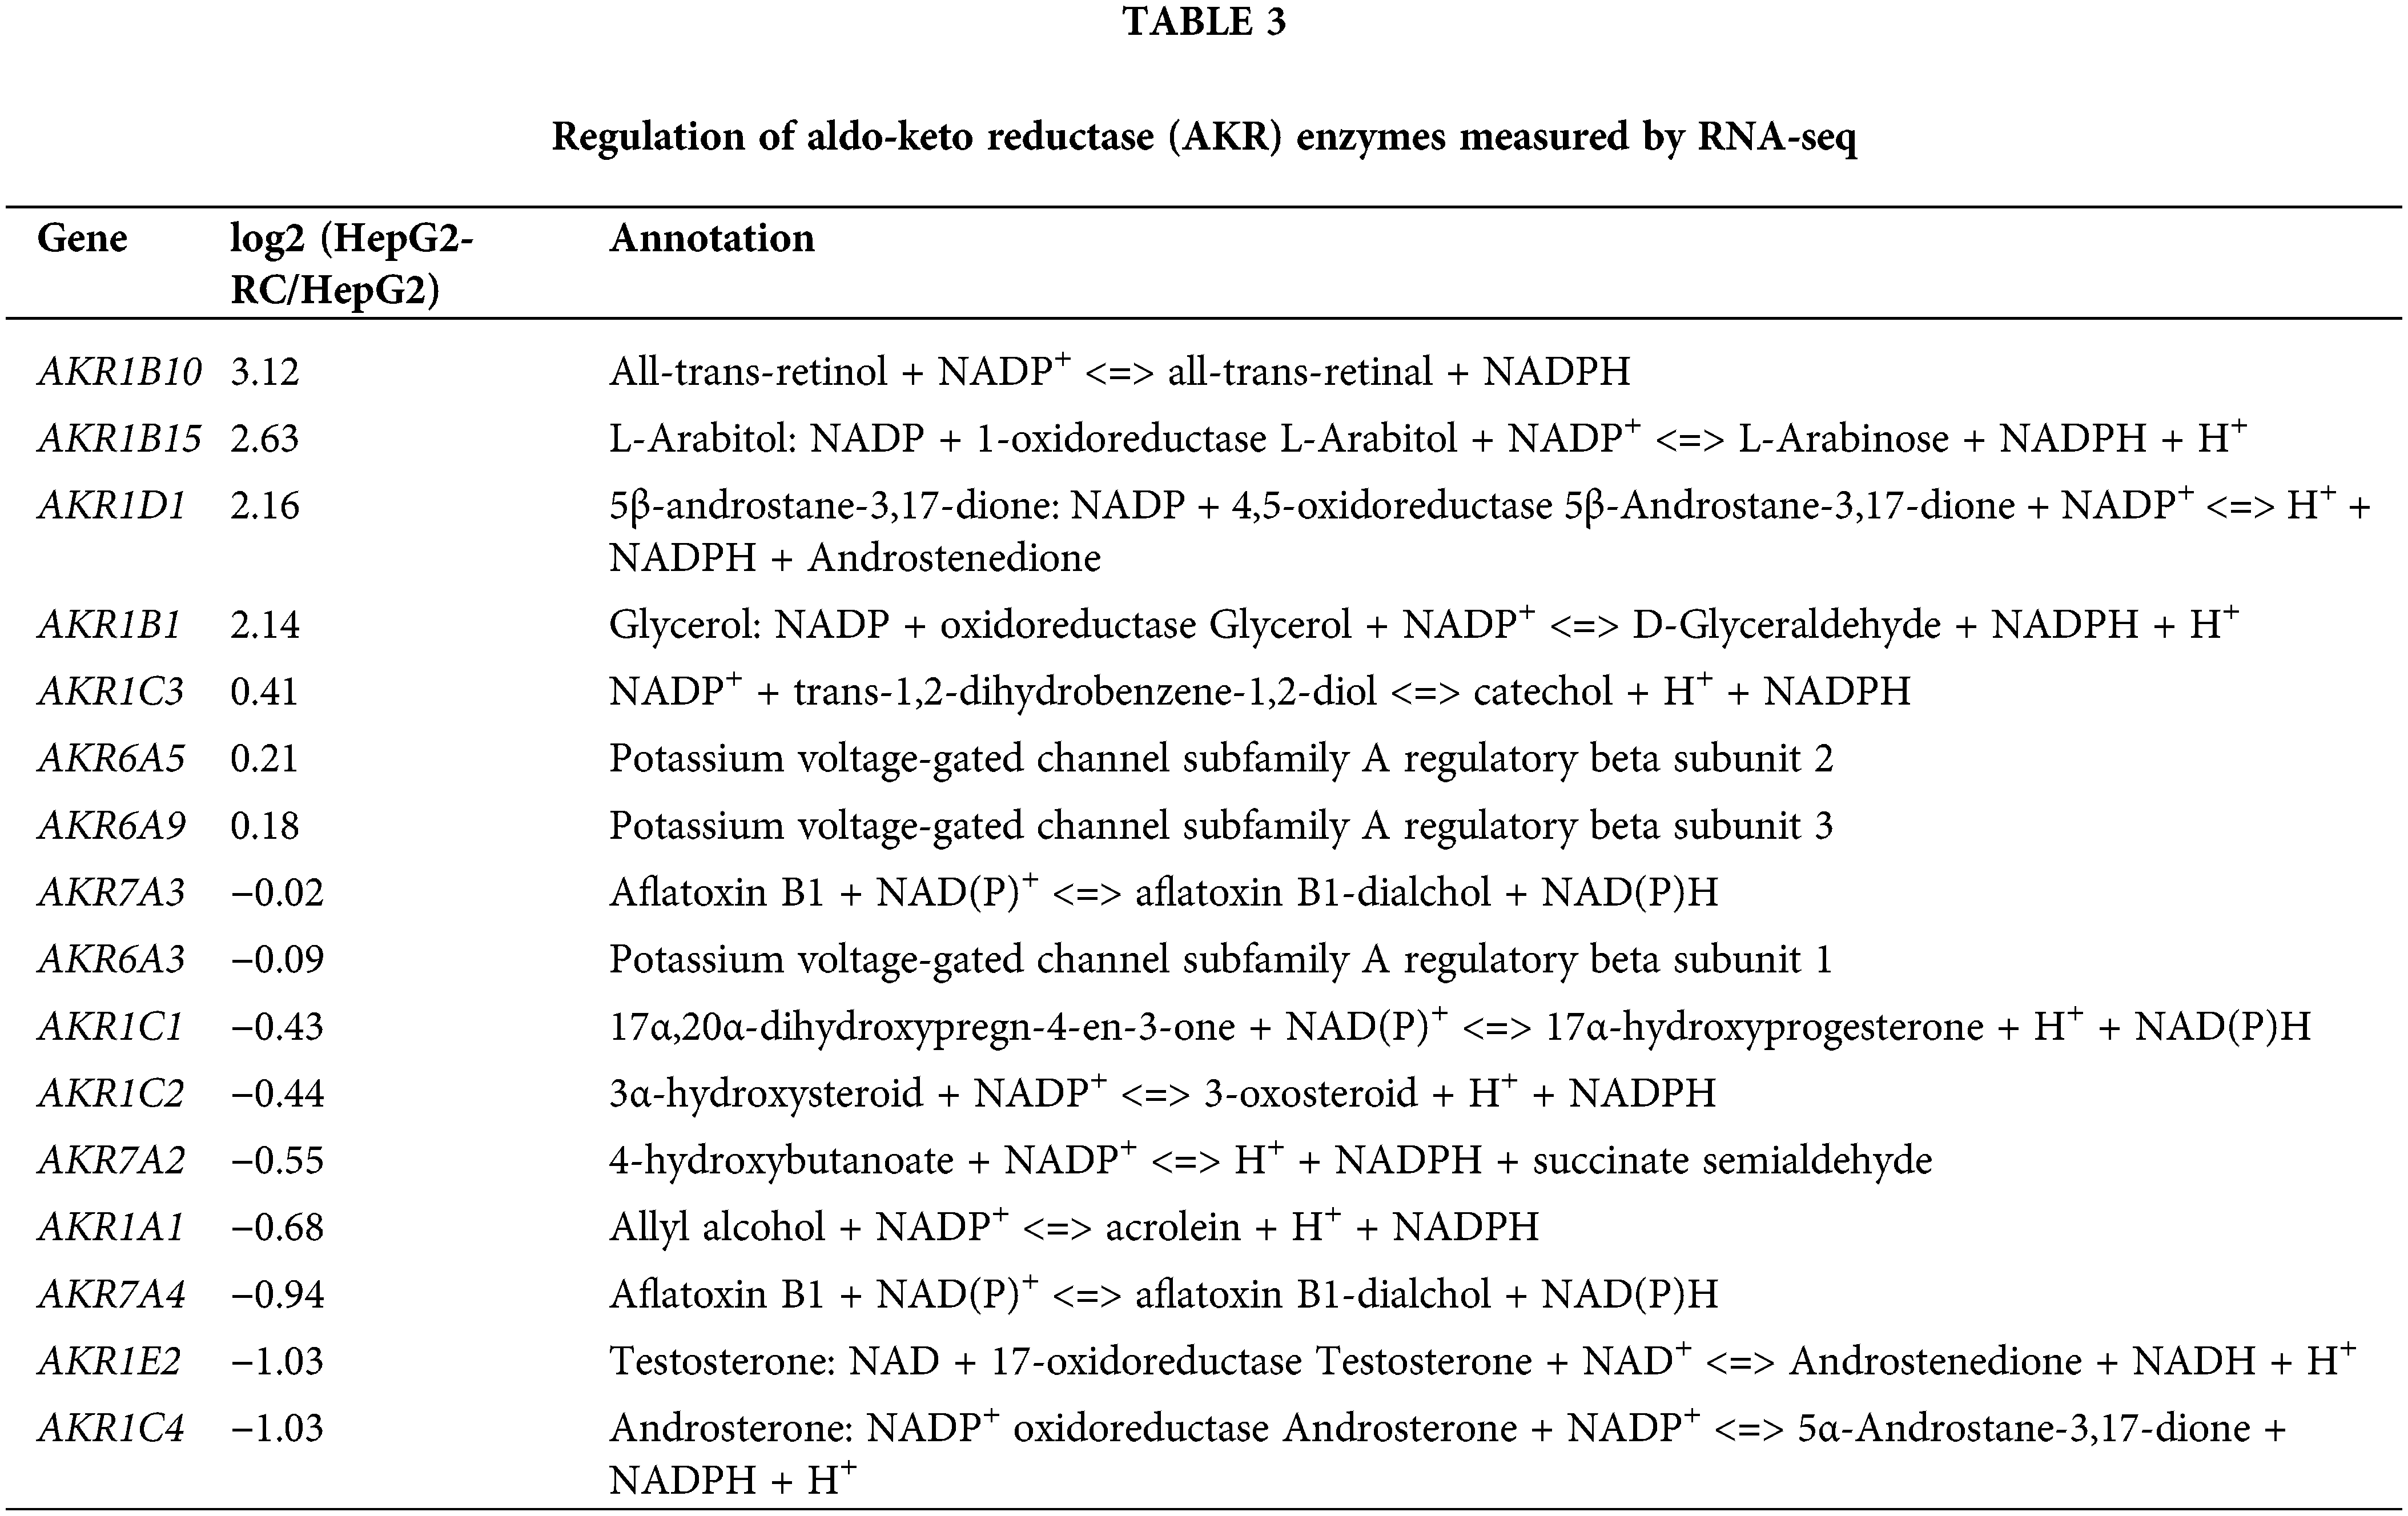
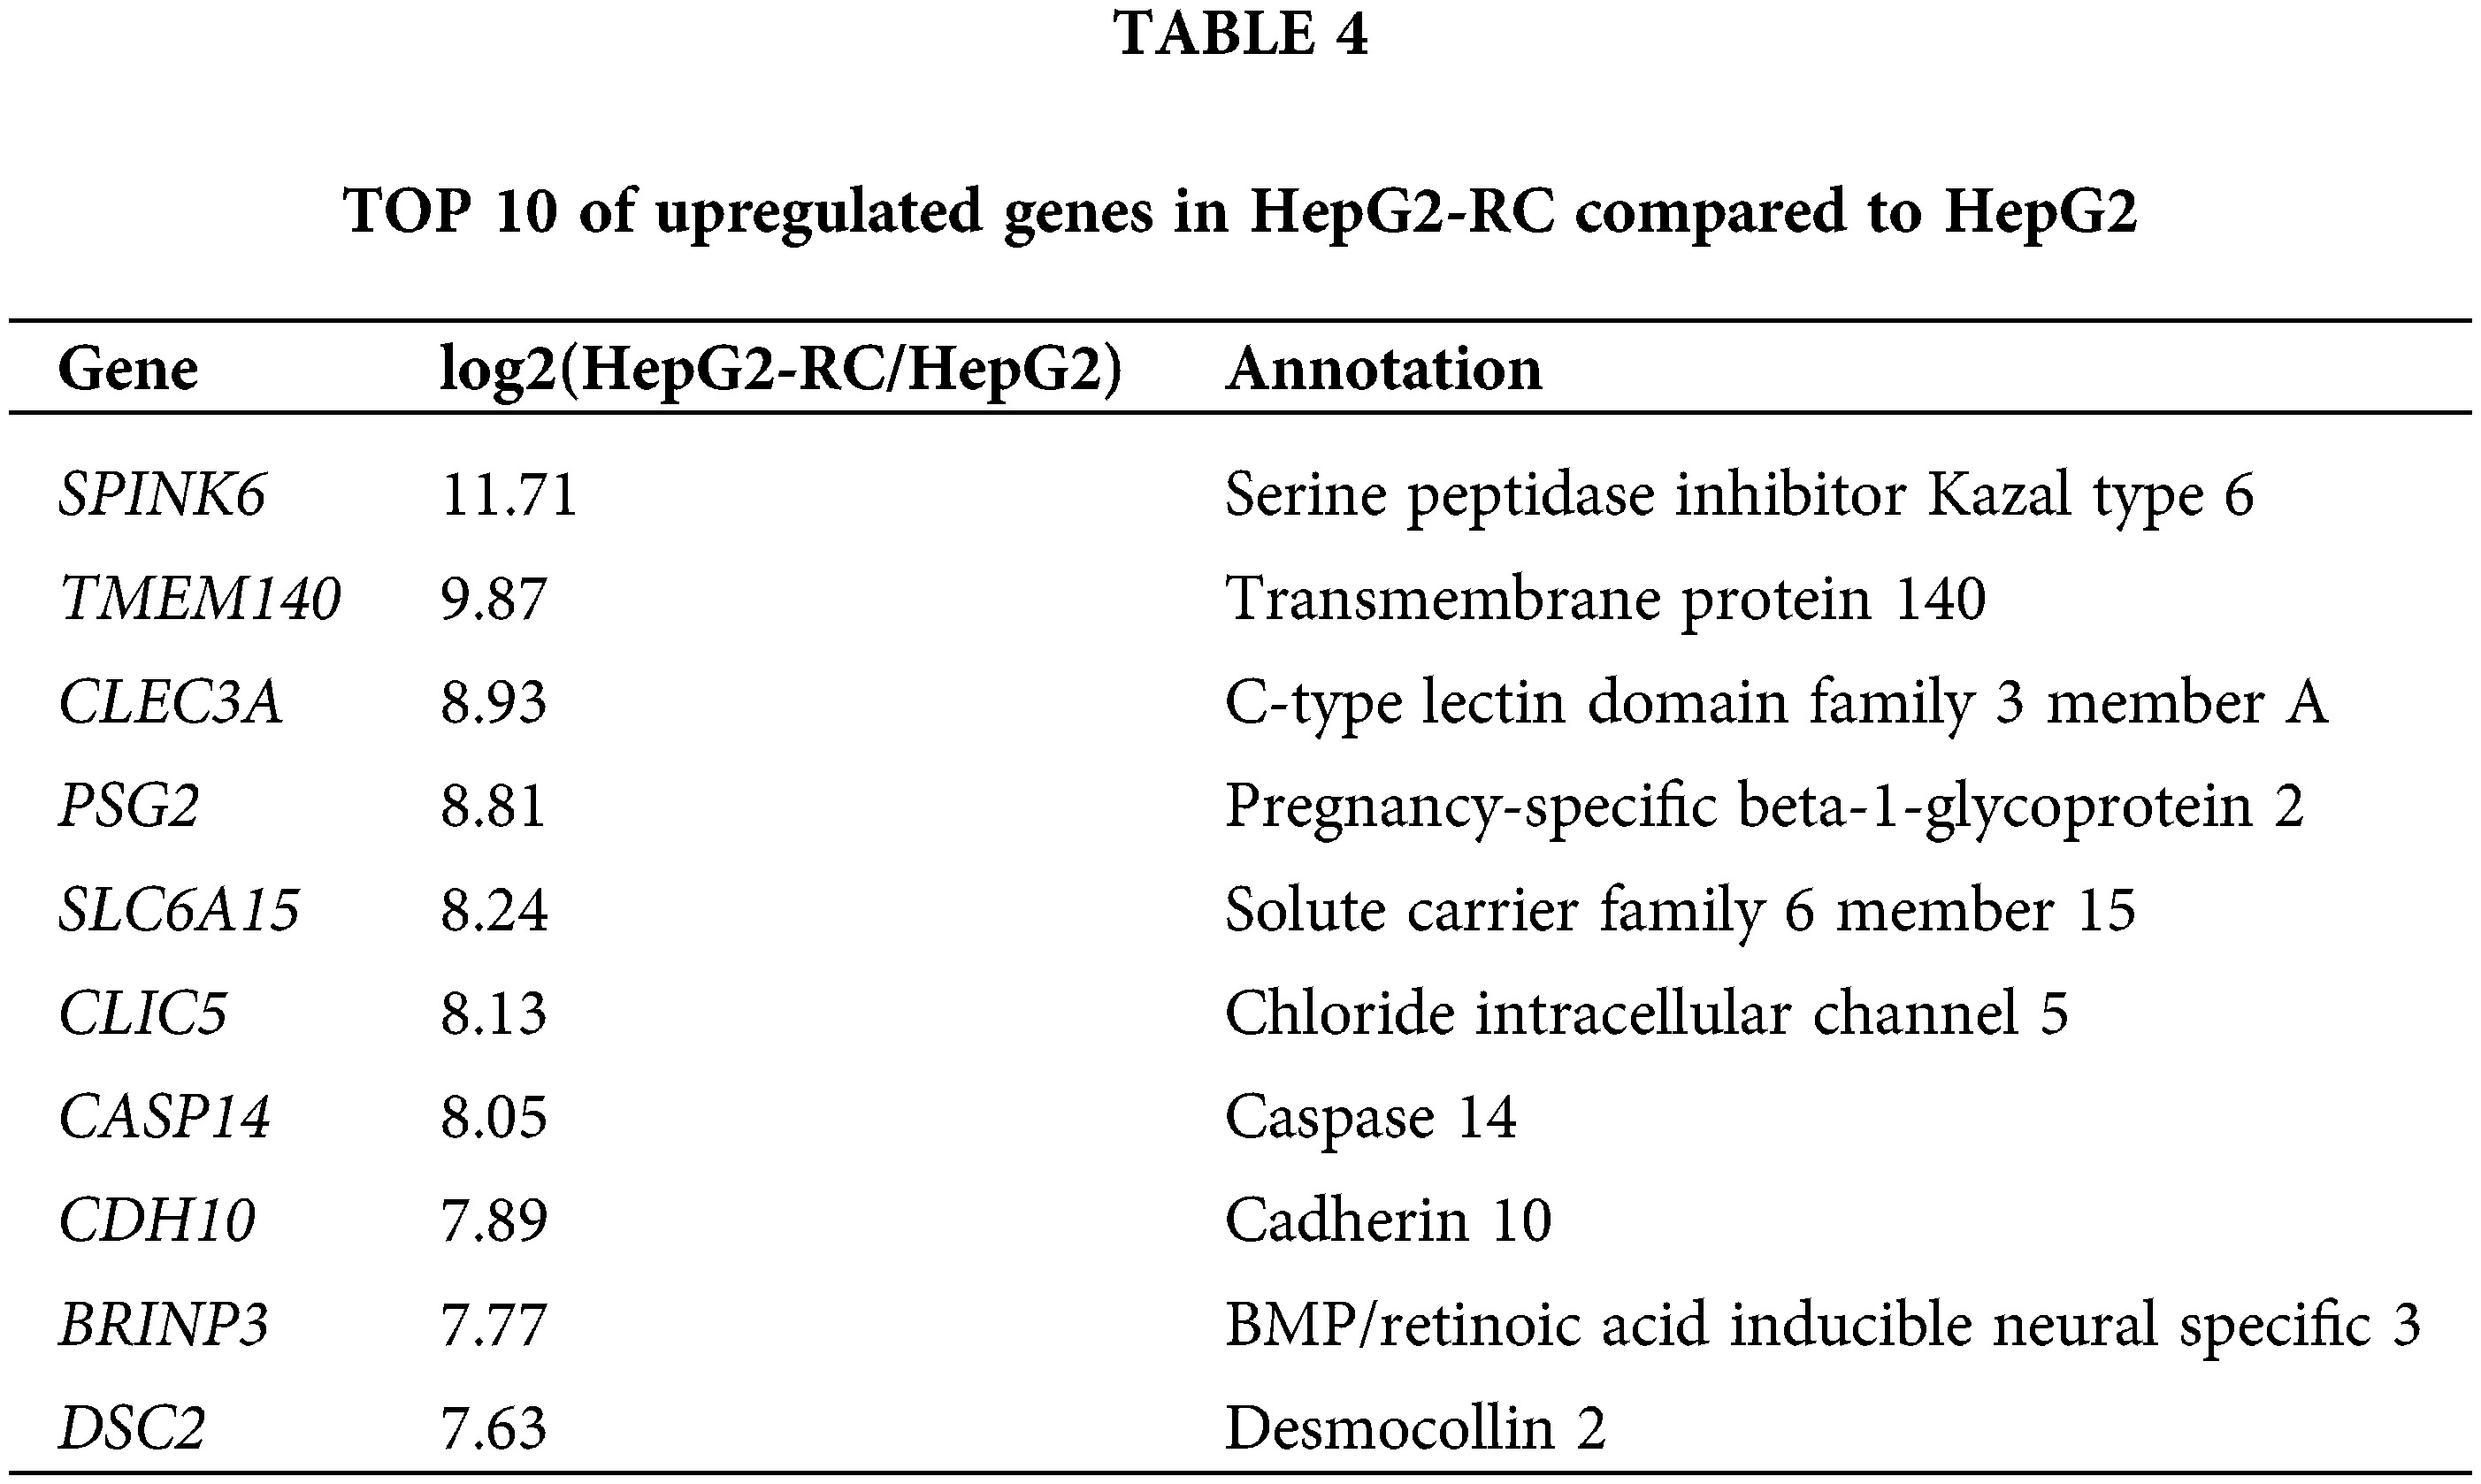
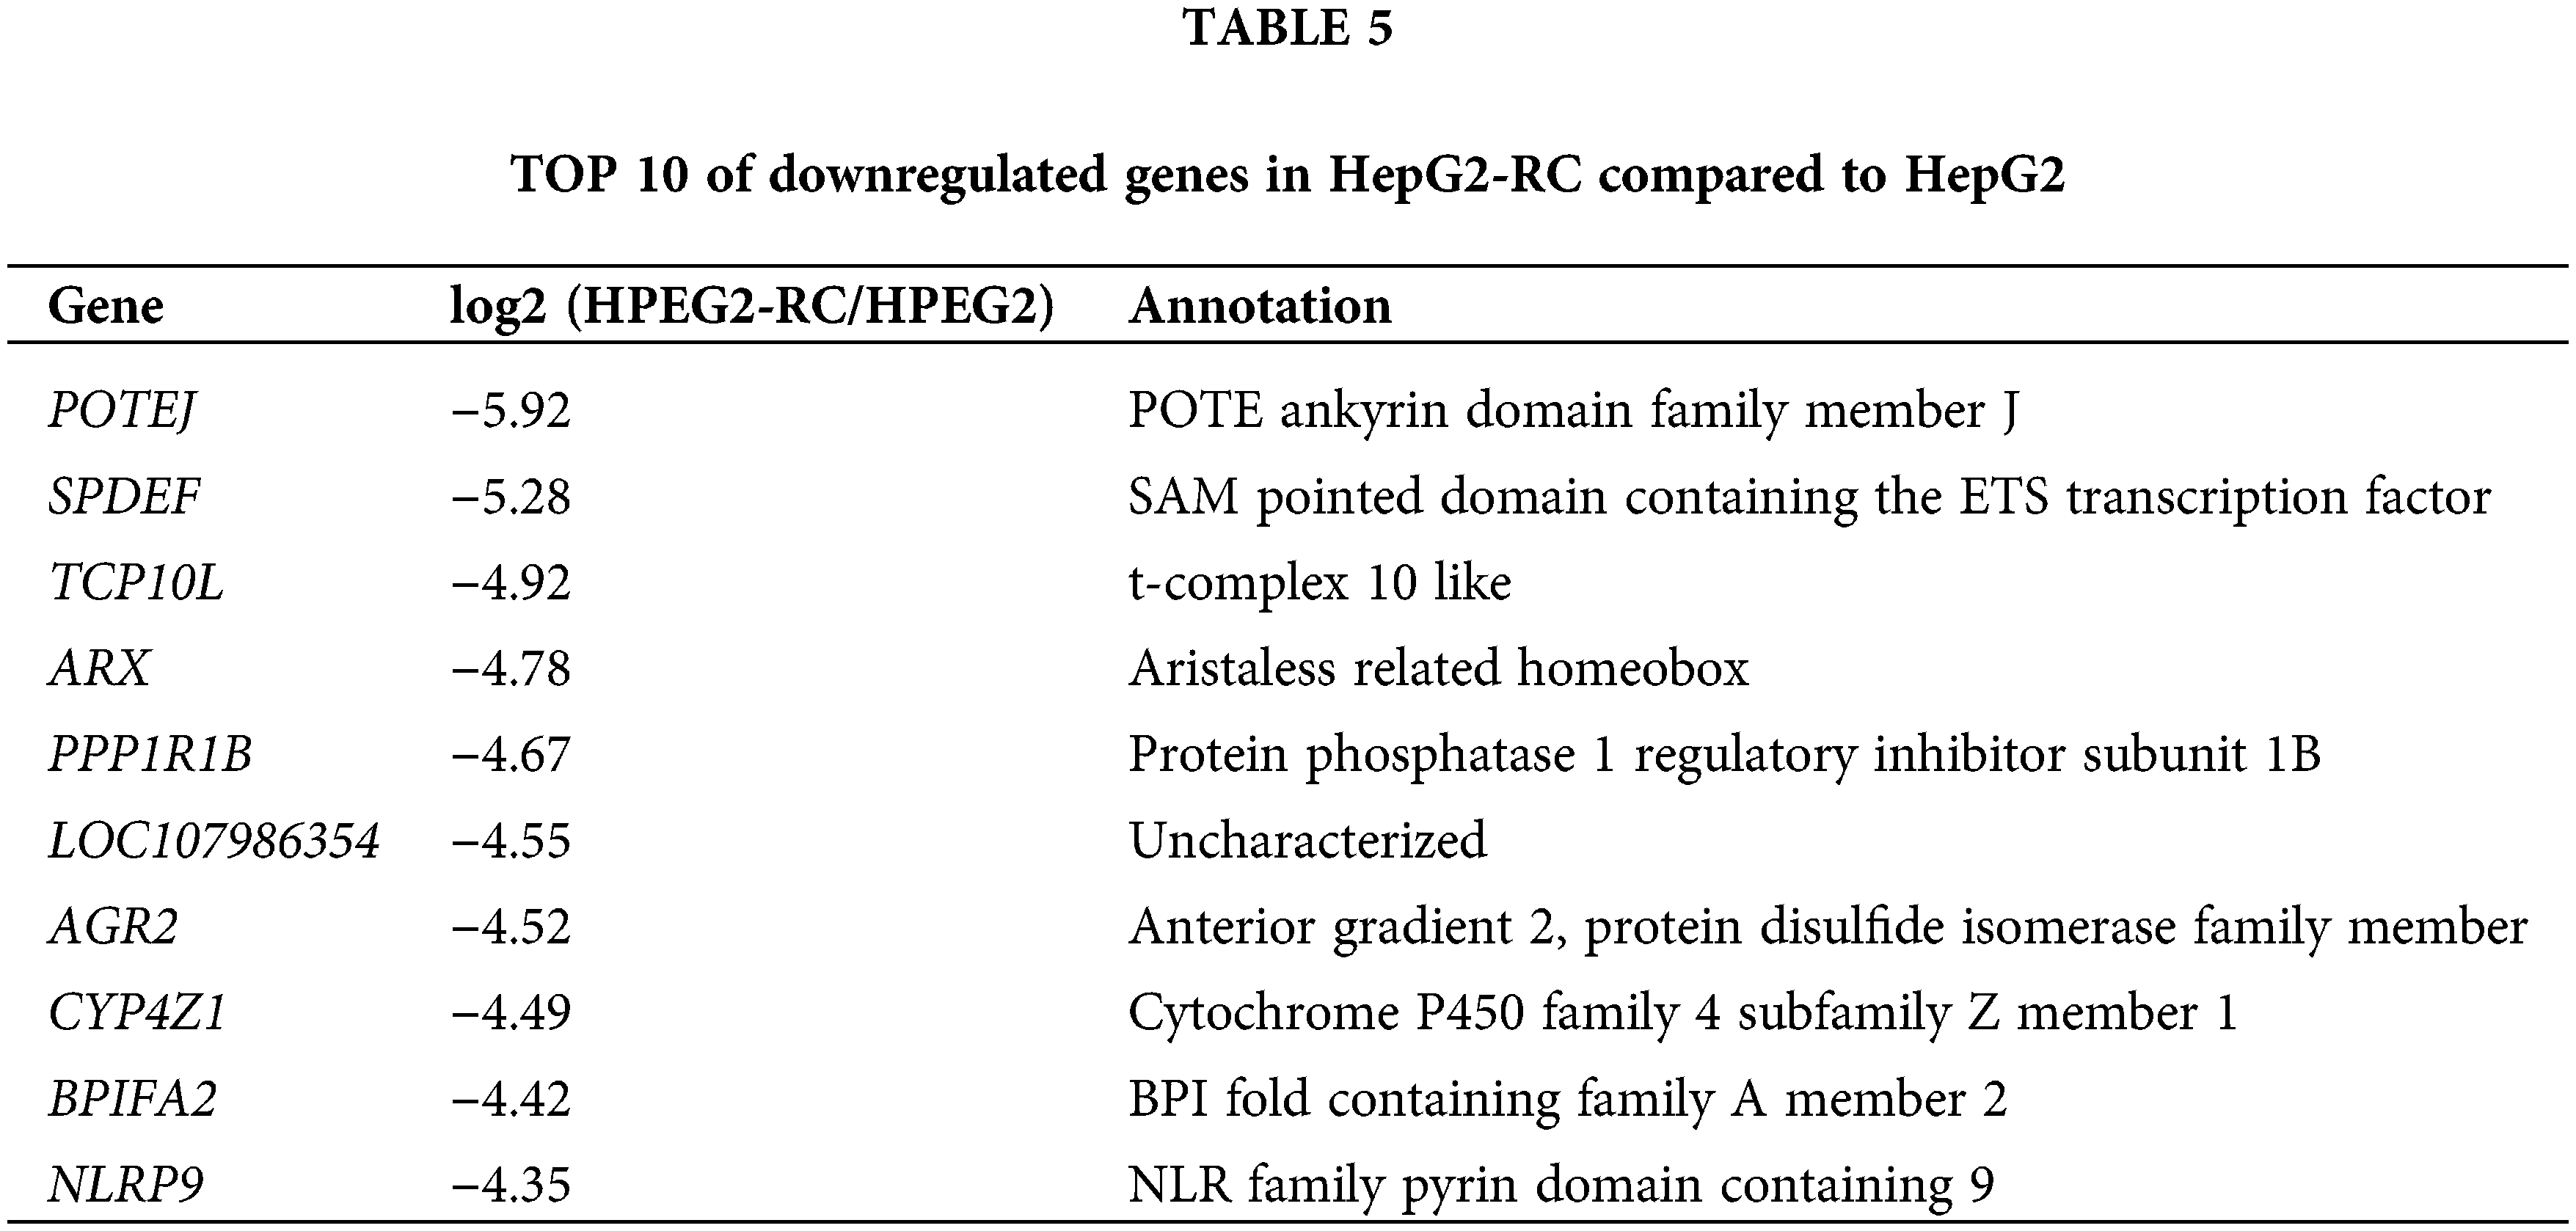
Moreover, many other NAD(P)H-dependent reductase/oxidases were upregulated four- to eight-fold (Table 3). The strongest upregulation was observed for RFTN1 (log2(HEPG2-RC/HEPG2) = 6.55), which encodes raftlin, and bears NAD(P)H cytochrome-b5 reductase activity. Comparing RNA-seq results from HepG2 and HepG2-RC cells, 63 NAD(P)H-dependent reductase/oxidases were upregulated in HepG2-RC cells at least twofold, while only 23 were downregulated at least/approximately twofold. Moreover, 23 of those 63 upregulated genes had at least four-fold higher transcription in HepG2-RC cells compared with HepG2 cells, while only two of those 23 downregulated genes showed a reduction to less than 25% of HepG2 levels. In other words, even though no NAD(P)H-dependent reductase/oxidases were present in the top 10 upregulated genes (Tables 4 and 5), they were generally upregulated.
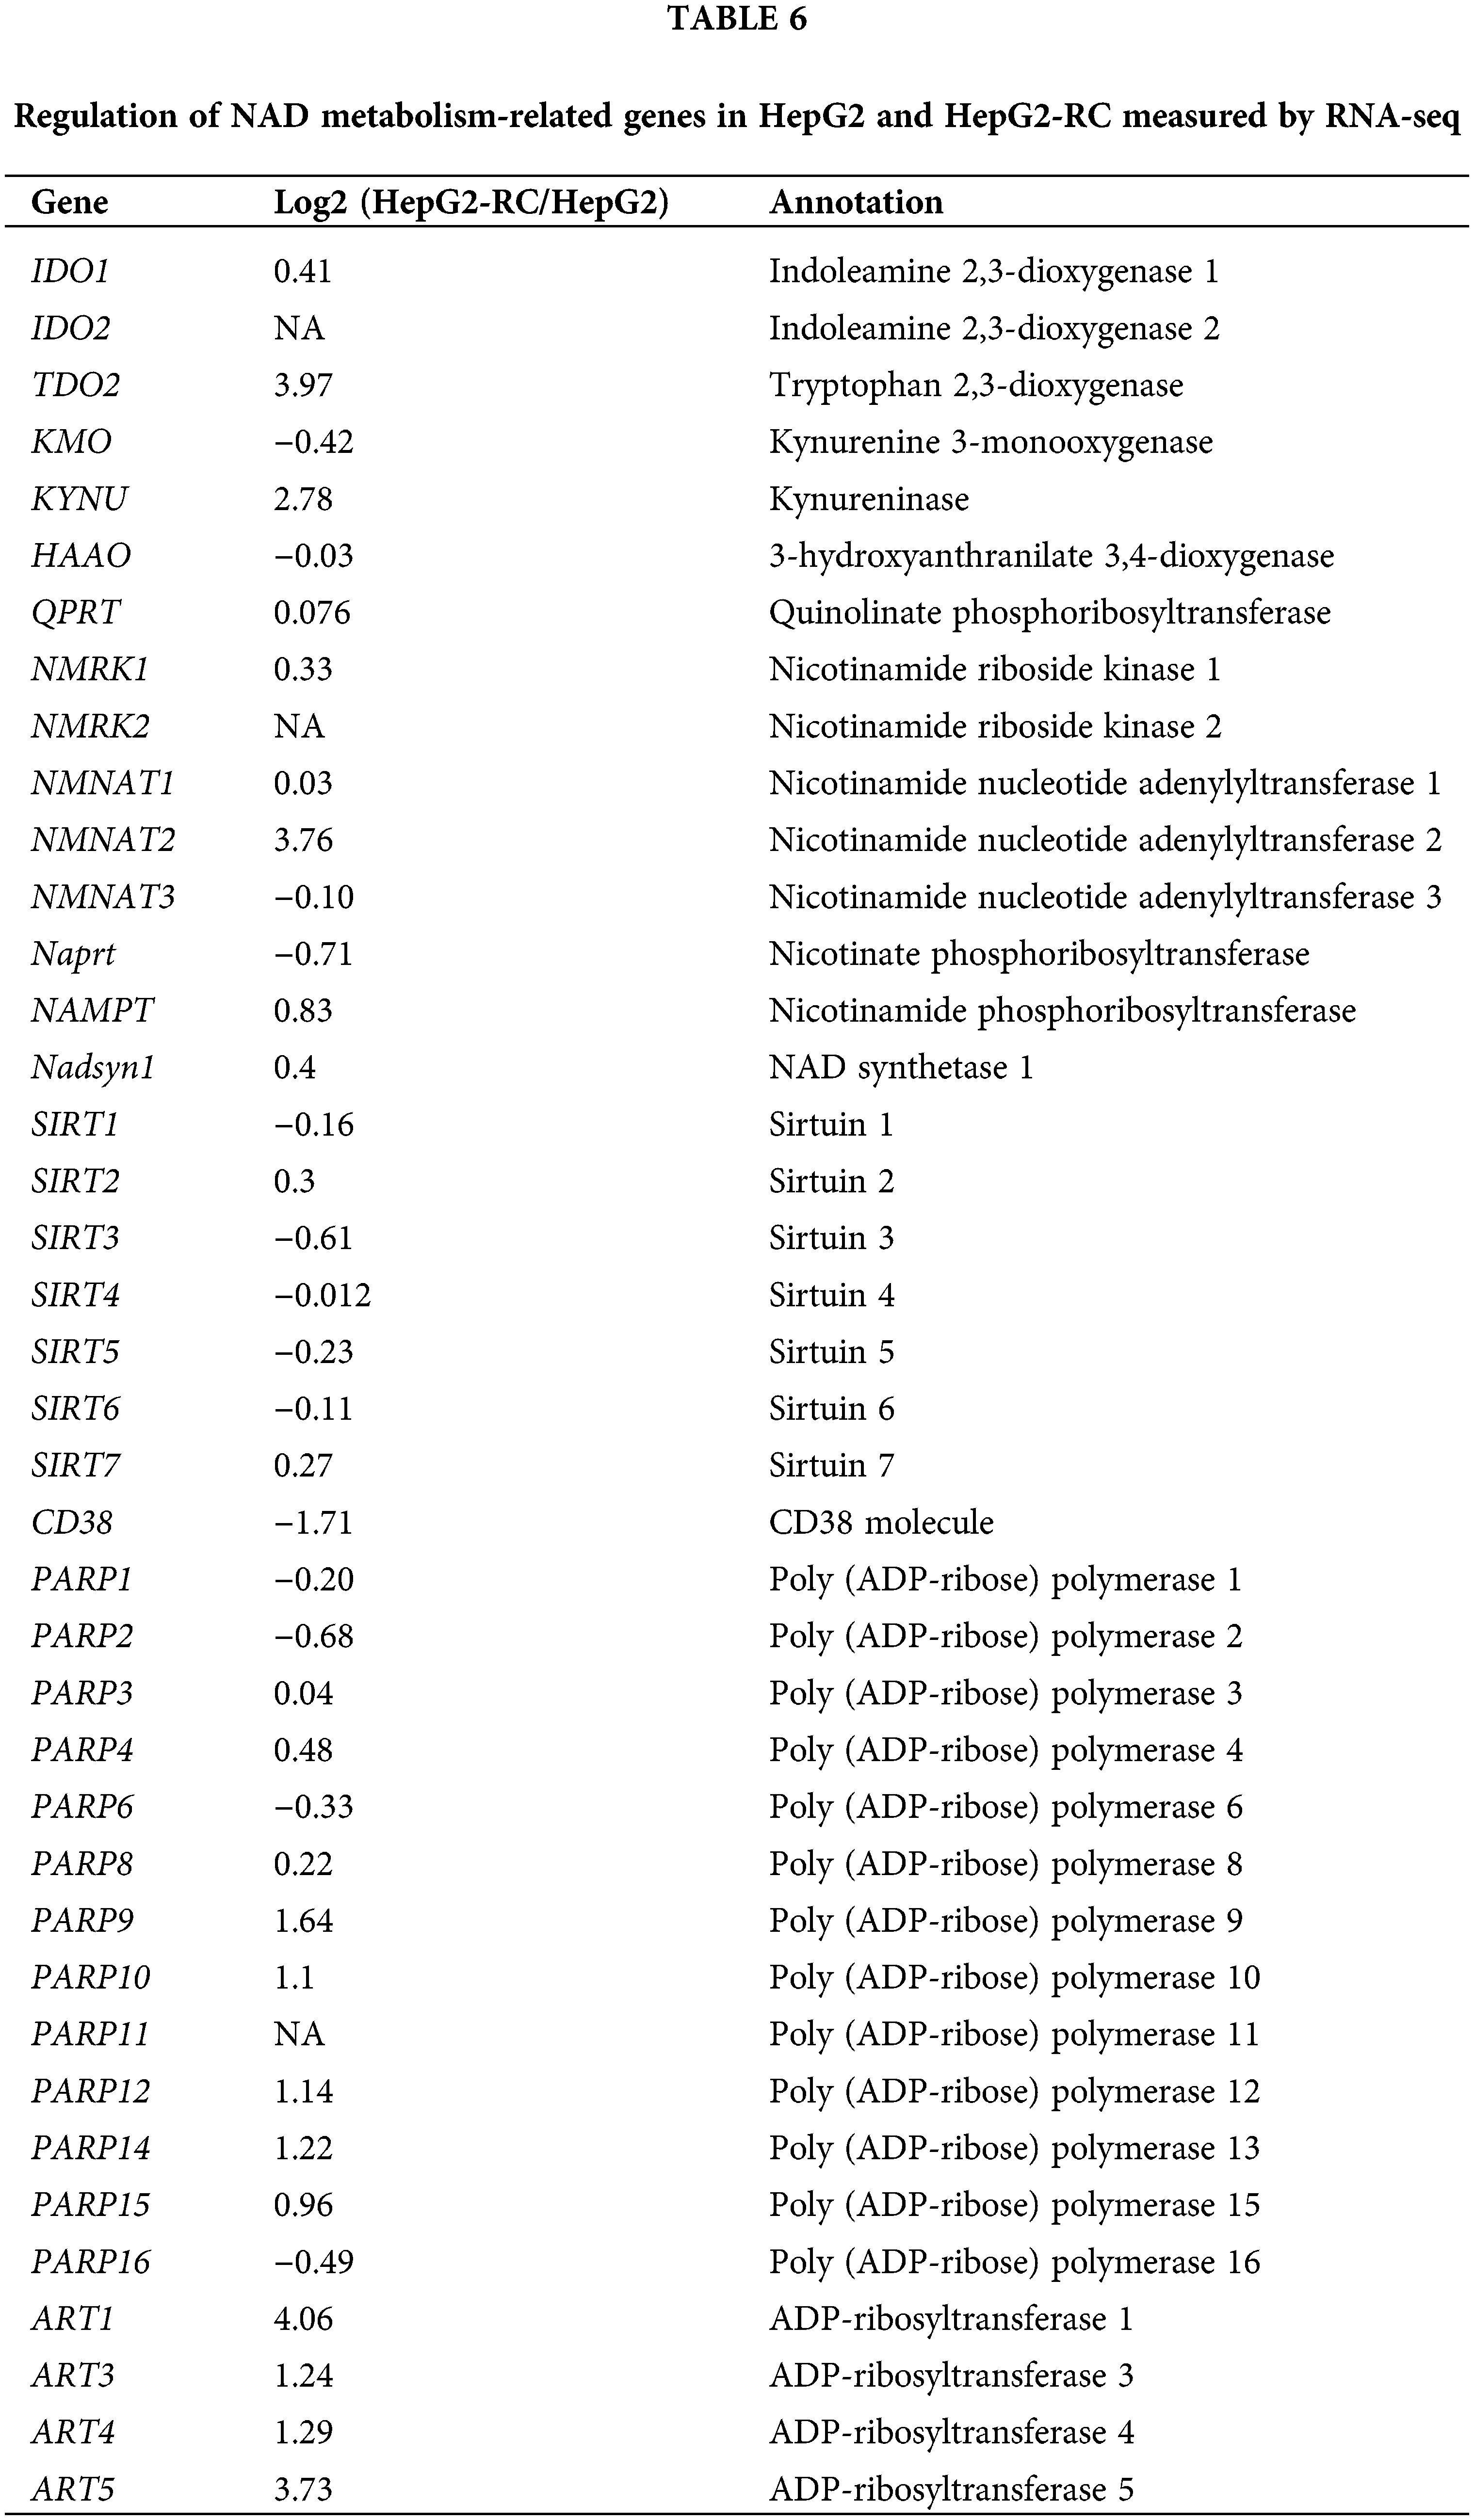
The ratio of NADH/NAD+ in HepG2-RC cells was higher than in HepG2 cells
As shown in Fig. 3, the one-way ANOVA was employed for comparison between multiple groups (F = 963.831; p < 0.001). The Bonferroni test was used for the post-hoc test (HL-7702 vs. HepG2 p = 1.000; HepG2 vs. HepG2-RC p < 0.001; HL-7702 vs. HepG2-RC p < 0.001). The amount of total NAD in HepG2 and HepG2-RC cells was approximately four-fold higher than in HL-7702 cells. Interestingly, the ratio of NADH/NAD+ in HepG2-RC cells was almost seven-fold higher than in HepG2 or HL-7702 cells. These results could be explained by the RNA-seq results that de novo NAD biosynthesis-related genes were upregulated in HepG2-RC cells (Table 6). Especially, TDO2, encoding tryptophan dioxygenase; KYNU, encoding kynureninase; and NMNAT2, encoding nicotinamide nucleotide adenylyl transferase, showed at least four-fold and at most 32-fold higher mRNA levels in HepG2-RC than in HepG2 cells. Moreover, almost all genes involved in NAD degradation did not show altered mRNA levels, except the ART family. All ART family genes were upregulated in HepG2-RC compared with HepG2; in particular, ART1 mRNA levels in HepG2-RC cells increased 32-fold compared with HepG2 cells. It has been reported that ART1 overexpression is closely related to some kinds of cancer (Li et al., 2016; Song et al., 2016; Yang et al., 2016). In summary, the de novo NAD biosynthesis pathway was upregulated in HepG2-RC, and total NAD levels were increased in HepG2 and HepG2-RC cells compared with HL-7702 cells.
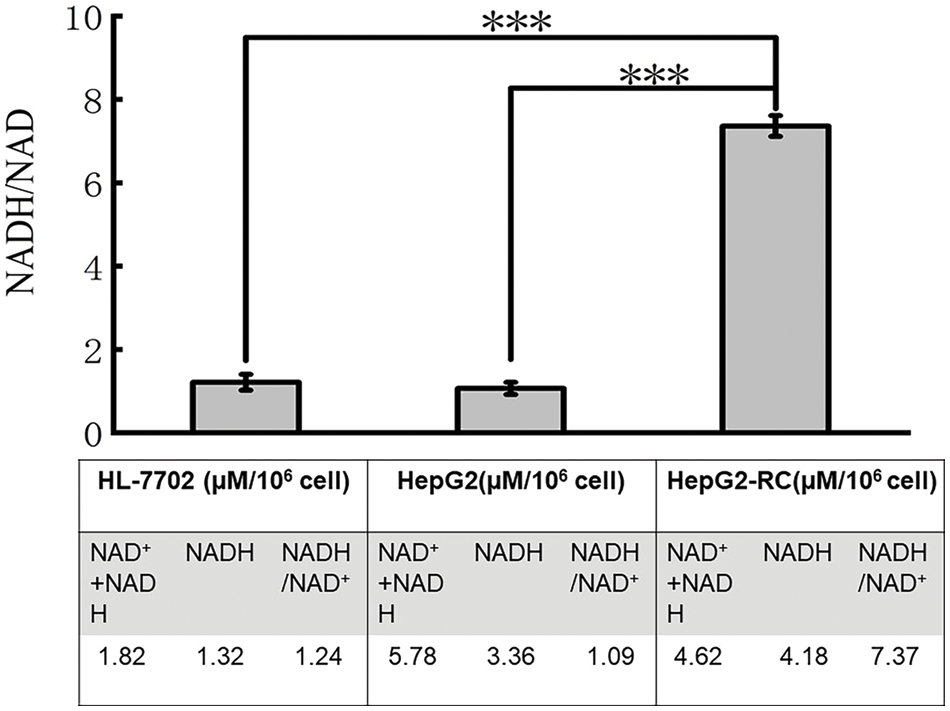
Figure 3: Ratio of NADH/NAD+ in HL-7702, HepG2, and HepG2-RC cells.
The amounts of total (NAD++NADH) and NADH were measured with a NAD/NADH quantitation kit. The amount of NAD was calculated from these two values. Finally, a ratio of NADH vs. NAD was obtained. The results are presented as mean ± SD (n = 3, ***p < 0.001).
Molecular docking simulations reveal the binding of aldo-keto reductase (AKR)1C inhibitors with AKR1C3 at different locations
Docking simulations with an NADP+-bound AKR1C3 model (Figs. 4a–4c) showed that the highest affinity docking inhibitor was MPA, with the lowest binding free energy (ΔG = −11.54 kcal/mol). MPA formed two hydrogen bonds with Y55 and H117. Moreover, MPA had hydrophobic interactions with Y24, L54, M120, W227, S308, and F311, which formed a classic steroid pocket (SP) for MPA binding (Fig. 4c, right frame). MCFLA showed the second highest affinity, with ΔG = −7.06 kcal/mol. MCFLA interacted with K84 with a hydrogen bond. Only a few residues (Y24, L54, and W86) interacted with MCFLA through hydrophobic interactions indicating that MCFLA was not in the SP but at the edge of the oxygen site composed by Y55, H117, and NADP+ (Fig. 4b, right frame). MLS showed the lowest affinity (−6.47 kcal/mol). MLS shared two hydrogen bonds with Q167 and H117. S87, S118, L122, L128, and S129 had hydrophobic interactions with MLS, which were not classic SP consisting of residues (Fig. 4a, right frame). These docking results were consistent with the IC50 values of the inhibitors on AKR1C3, with MPA having the lowest and MLS having the highest IC50 value (Fig. 2a).
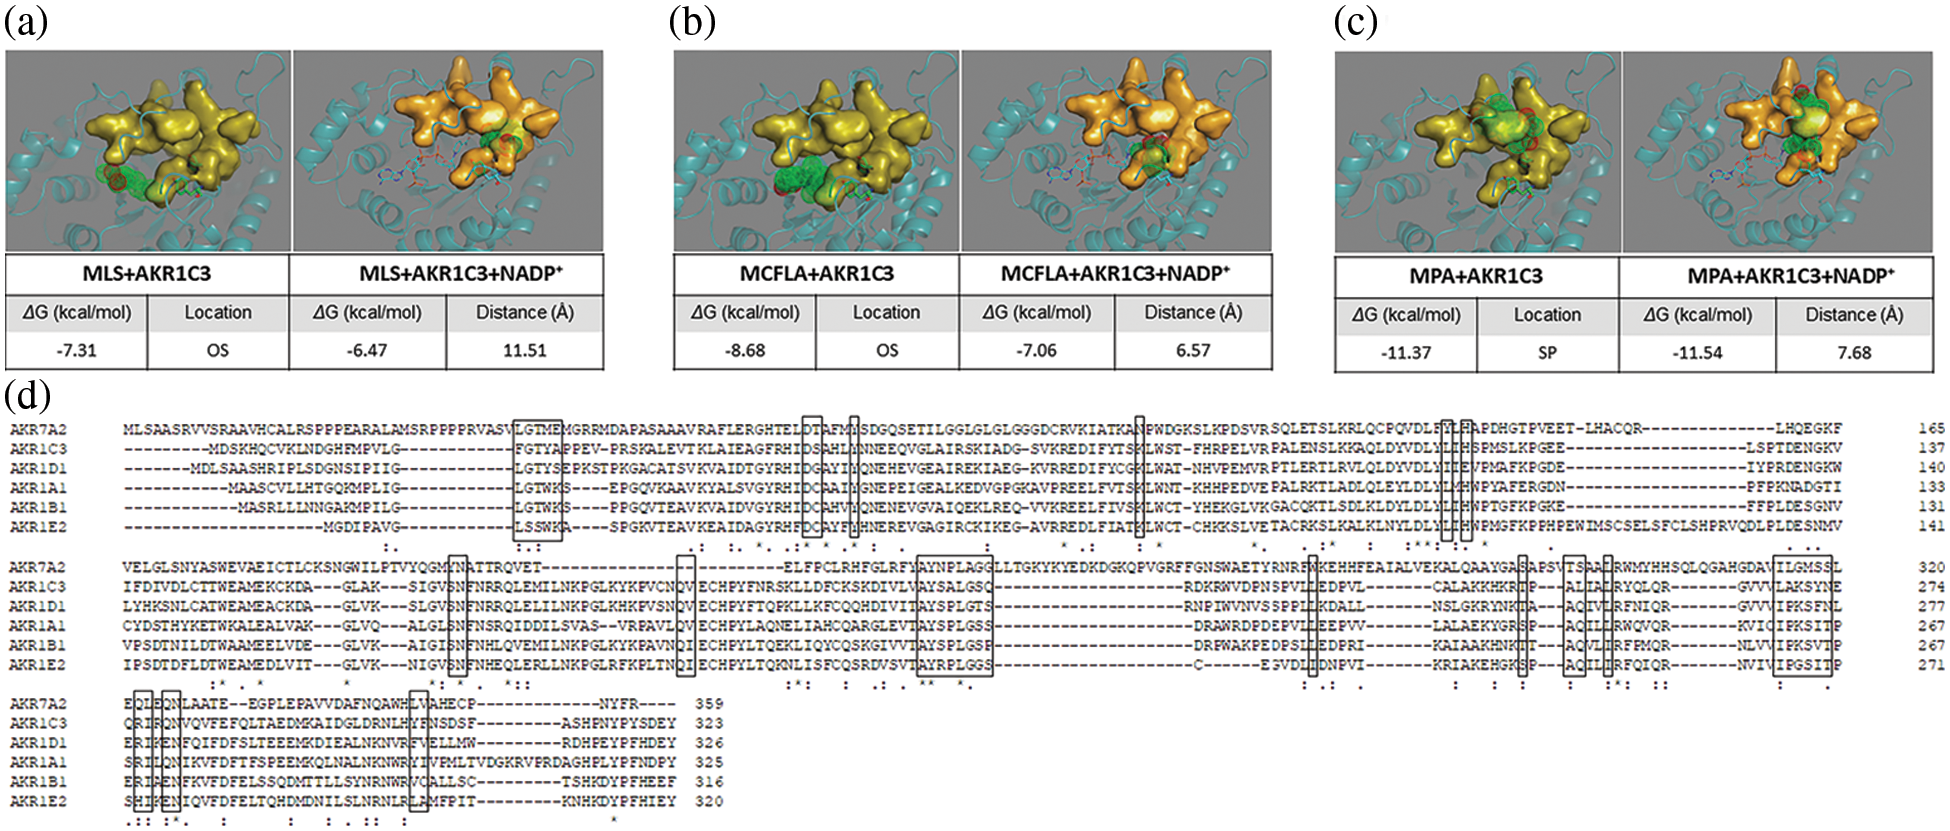
Figure 4: Molecular docking simulation results of aldo-keto reductase (AKR)1C3 and three inhibitors. (a) Meclofenamic acid (MLS) with AKR1C3 alone or AKR1C3 and NADP+. (b) Methyliasmonate (MCFLA) with AKR1C3 alone or AKR1C3 and NADP+. (c) Medroxyprogesterone acetate (MPA) with AKR1C3 alone or AKR1C3 and NADP+. OS, oxygen site; SP, steroid-binding pocket. The distance was measured between the nitrogen atom of the nicotinamide ring and the carbonyl oxygen of the inhibitor. AKR1C3 is represented in cartoon style. NADP+ is shown as a stick model, and Tyr-55 and His-117 are shown as a stick-ball model. NADP+, Tyr-55, and His-117 contain an OS. The SPs are displayed in surface style. (d) The alignment of representative members of the AKR enzyme family (AKR1A1, AKR1B1, AKR1C3, AKR1D1, AKR1E2, and AKR7A2) (Mindnich and Penning, 2009; Penning, 2014; Zhao et al., 2015; Stomberski et al., 2019). The residues involved in the NADP+ binding are placed in the box.
When NADP+ was removed from the AKR1C3 structure, and only inhibitors were docked with AKR1C3 apoenzyme, the order did not change, and we could see some considerable differences in the binding location of their inhibitors (Figs. 4a–4c). MPA was still tightly bound in the steroid pocket (L54, W86, A167, E192, F306, F311, Y317). While MCFLA shifted to the SP (G22, Y24, Y55, A218, L219, S221, E222, L268, A269, F306) from oxygen site and formed a hydrogen bond with S217. MLS partially occupied SP (S217, A218, L219, A269) and formed two hydrogen bonds with L268 and K270.
Comparison of the NADP+-bound and NADP+-releasing AKR1C3 models clearly showed that MCFLA moved from SP to the oxygen site when NADP was present. The distance between MCFLA and NADP+ was around 6.57 Å, which was closer than that between MPA and NADP+ (~7.68 Å). It indicated that MPA was the best selective inhibitor of AKR1C3, while MCFLA partially interacts with the NADP+ binding site, showing a potential competitiveness with NADP+ and a relatively poor selectivity for specific AKRs.
AKR1C enzymes are overexpressed in several cancer cell types, such as bladder cancer cells and gastric cancer cells, contributing to the resistance to Cis-platin treatment (Fukumoto et al., 2005; Rižner et al., 2006; Byrns et al., 2012; Chen et al., 2013; Shirato et al., 2014; Matsumoto et al., 2016). Some cytotoxic lipid peroxidative products have been mentioned as targets of AKR1Cs that are involved in cis-platin resistance (Matsumoto et al., 2016). However, the role of AKR1Cs in the mechanism underlying cis-platin resistance remains unclear. We found that AKR1C inhibitors could reverse the resistance of HepG2-RC cells, even though AKR1Cs were not significantly upregulated in HepG2-RC cells. The effects of siAKR1Cs on HepG2-RC cells were comparable to those of the inhibitor MPA but could only partially explain the effects of MCFLA. This could be explained by the fact that MPA is a steroid analog, which shows a high selectivity, while MCFLA inhibits not only AKR1C enzymes but also other AKR enzymes. MCFLA belongs to the class of non-steroid anti-inflammatory inhibitors, which have been reported to also inhibit cyclooxygenases besides AKR1Cs, indicating its poor selectivity (Brozic et al., 2011). As shown in Fig. 4d, all AKR enzymes share a common set of residues to bind NADP(H). As shown in Fig. 4b, MCFLA preferred the oxygen site rather than the steroid pocket, indicating that MCFLA inhibits AKR1C3 by disturbing NAD(P)(H) binding.
These results indicate that MCFLA could inhibit some other AKR enzymes besides AKR1Cs. This could explain why MCFLA causes a stronger reversal of cis-platin resistance of HepG2-RC cells than MPA. It is likely that NAD(P)H plays a key role here because it is a reducing force and a product of NAD(P)H-dependent oxidoreductases. Reprogramming energy metabolism is considered a hallmark of cancer cells in which NAD(P) or NAD(P)H levels are increased (Mayevsky, 2009; Gao and Wei, 2017). Some NAD(P)H-dependent oxidoreductases, such as ALDHs, increase NAD(P)H levels in the cytosol of cancer cells, which then serves as an electron source (Kim, 2018).
We also found that the amount of total NAD (NAD++NADH) in both HepG2 and HepG2-RC cells was approximately four-fold higher than in HL-7702 cells. Moreover, the ratio of NADH/NAD+ in HepG2-RC cells was increased as much as seven-fold compared to HepG2 cells. The increased ratio could be explained by two steps (Fig. 5). First, NADH is produced continuously in hepatic cancer cells. This is in contrast to the situation in normal cells, where AKRs function as reductases (Penning, 2015). However, the continuously biosynthesized NAD in hepatic cancer cells would make NAD(P)H-dependent enzymes catalyzing reactions in one direction, from NAD(P) to NAD(P)H. Second, the produced NAD(P)H would deal with cis-platin-induced peroxidative products directly or indirectly. Usually, NADPH maintains glutathione at the reduced state, which could detoxify reactive oxygen species. However, this could not alter the NAD(P)H/NAD(P) ratio significantly, because each reaction is reversible. Moreover, no alteration of resistance to cis-platin or oxaliplatin occurred after GSH depletion in oxaliplatin-resistant human gastric adenocarcinoma TSGH cells (Chen et al., 2007), indicating that GSH is not involved in the cis-platin resistance.
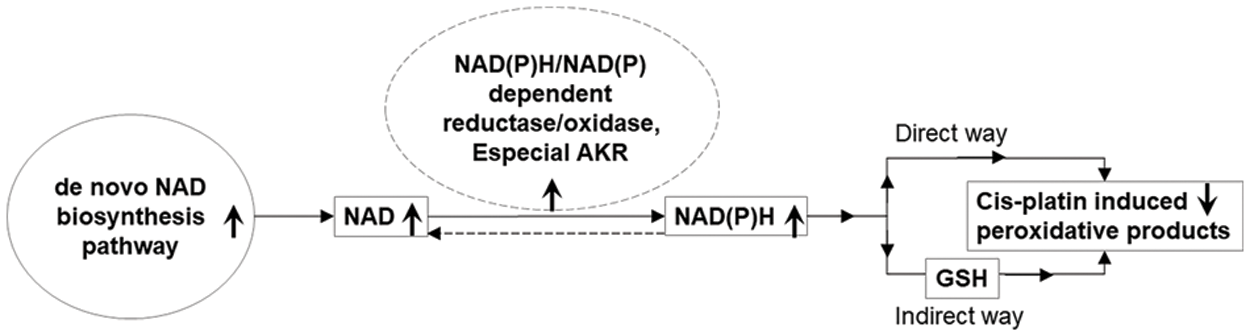
Figure 5: A possible role of NAD(P)H/NAD(P)-dependent reductase/oxidase in the mechanism underlying cis-platin resistance.
Arrows pointing upwards indicate upregulation in HepG2-RC cells; arrows pointing downwards indicate downregulation in HepG2-RC cells.
Besides GSH, NAD(P)H could also react rapidly with moderately oxidizing radicals to repair biomolecules (Kirsch and Groot, 2001). So, NAD(P)H could also work as a directly operating antioxidant that scavenges radicals as NAD(P)H* forms. These forms would exist in the cell for a relatively long time and keep the intracellular concentration of free NAD(P)H very low. Therefore, NAD(P)H-dependent enzymes could catalyze NAD(P) to NAD(P)H continuously, resulting in a high ratio of NAD(P)H/NAD(P). If these enzymes were widely inhibited by a poor selective inhibitor, such as MCFLA, NADH would not accumulate any more, and cis-platin resistance would be suppressed as well.
In summary, it is believed that NAD(P)H-dependent oxidoreductases, especially AKRs, produce NADH in HepG2 cells to overcome cis-platin-induced cytotoxicity. According to this notion, chemotherapy with inhibitors, which could compete with NAD(P) in most oxidoreductases, could lead to a better reversal of cis-platin resistance in cis-platin-resistant cancer cells. The transcriptome information of HL-7702, HepG2, and HepG2-RC is very valuable. In the future, we can study the changes in other AKRs in cancer cells of different tissues and drug-resistant cells according to transcriptome information and explore the reversal of drug resistance of other tumor chemotherapeutic drugs.
Acknowledgement: We thank LetPub (www.letpub.com) for its linguistic assistance during the preparation of this manuscript.
Funding Statement: This work was supported by the Science and Technology Development Plan Project of Jilin Province, China [20200708101YY]; The Foundation of Jilin Province Science and Technology Department [20200801062GH].
Author Contributions: Yuanhua Yu conceived and designed the experiments. Tingting Sun and Le Gao analyzed data and wrote and edited the main manuscript text. Xin Wang, Xue Sun, and Rui Guo performed in vitro experiments. All authors read and approved the manuscript.
Availability of Data and Materials: The datasets generated during and/or analysed during the current study are available from the corresponding author on reasonable request.
Ethics Approval: Not applicable.
Conflicts of Interest: The authors declare that the research was conducted in the absence of any commercial or financial relationships that could be construed as a potential conflict of interest.
References
Bellmunt J, Albiol S, Suárez C, Albanell J (2009). Optimizing therapeutic strategies in advanced bladder cancer: Update on chemotherapy and the role of targeted agents. Critical Reviews in Oncology Hematology 69: 211–222. https://doi.org/10.1016/j.critrevonc.2008.06.002 [Google Scholar] [PubMed] [CrossRef]
Brozic P, Turk S, LanišnikRižner T, Gobec S (2011). Inhibitors of aldo-keto reductases AKR1C1-AKR1C4. Current Medicinal Chemistry 18: 2554–2565. https://doi.org/10.2174/092986711795933713 [Google Scholar] [PubMed] [CrossRef]
Brožič P, Turk S, Rižner TL, Gobec S (2011). Inhibitors of aldo-keto reductases AKR1C1-AKR1C4. Current Medicinal Chemistry 18: 2554–2565. https://doi.org/10.2174/092986711795933713 [Google Scholar] [PubMed] [CrossRef]
Byrns MC, Mindnich R, Duan L, Penning TM (2012). Overexpression of aldo-keto reductase 1C3 (AKR1C3) in LNCaP cells diverts androgen metabolism towards testosterone resulting in resistance to the 5α-reductase inhibitor finasteride. Journal of Steroid Biochemistry and Molecular Biology 130: 7–15. https://doi.org/10.1016/j.jsbmb.2011.12.012 [Google Scholar] [PubMed] [CrossRef]
Chen CC, Chen LT, Tsou TC, Pan WY, Kuo CC, Liu JF, Yeh SC, Tsai FY, Hsieh HP, Chang JY (2007). Combined modalities of resistance in an oxaliplatin-resistant human gastric cancer cell line with enhanced sensitivity to 5-fluorouracil. British Journal of Cancer 97: 334–344. https://doi.org/10.1038/sj.bjc.6603866 [Google Scholar] [PubMed] [CrossRef]
Chen CC, Chu CB, Liu KJ, Huang CYF, Chang JY et al. (2013). Gene expression profiling for analysis acquired oxaliplatin resistant factors in human gastric carcinoma TSGH-S3 cells: The role of IL-6 signaling and Nrf2/AKR1C axis identification. Biochemical Pharmacology 86: 872–887. https://doi.org/10.1016/j.bcp.2013.07.025 [Google Scholar] [PubMed] [CrossRef]
Deng HB, Adikari M, Parekh HK, Simpkins H (2004). Ubiquitous induction of resistance to platinum drugs in human ovarian, cervical, germ-cell and lung carcinoma tumor cells overexpressing isoforms 1 and 2 of dihydrodiol dehydrogenase. Cancer Chemotherapy and Pharmacology 54: 301–307. https://doi.org/10.1007/s00280-004-0815-0 [Google Scholar] [PubMed] [CrossRef]
Deng HB, Parekh HK, Chow KC, Simpkins H (2002). Increased expression of dihydrodiol dehydrogenase induces resistance to cisplatin in human ovarian carcinoma cells. Journal of Biological Chemistry 277: 15035–15043. https://doi.org/10.1074/jbc.M112028200 [Google Scholar] [PubMed] [CrossRef]
Dhadve AC, Ray P (2022). An active RUNX1-ID1/ID3 axis governs differentiation and chemoresistance of cancer stem cell population in epithelial ovarian cancer cells. BIOCELL 46: 75–86. https://doi.org/10.32604/biocell.2022.016346 [Google Scholar] [CrossRef]
Fukumoto SI, Yamauchi N, Moriguchi H, Hippo Y, Watanabe A et al. (2005). Overexpression of the aldo-keto reductase family protein AKR1B10 is highly correlated with smokers’ non-small cell lung carcinomas. Clinical Cancer Research 11: 1776–1785. https://doi.org/10.1158/1078-0432.CCR-04-1238 [Google Scholar] [PubMed] [CrossRef]
Gao P, Wei H (2017). Regulation of cancer cell metabolism. SCIENTIA SINICA Vitae 47: 132–139. https://doi.org/10.1360/N052016-00334 [Google Scholar] [CrossRef]
He S, Liu Y, Chu X, Li Q, Lyu W et al. (2022). Discovery of novel aldo-keto reductase 1C3 inhibitors as chemotherapeutic potentiators for cancer drug resistance. ACS Medicinal Chemistry Letters 13: 1286–1294. https://doi.org/10.1021/acsmedchemlett.2c00175 [Google Scholar] [PubMed] [CrossRef]
Hofman J, Malcekova B, Skarka A, Novotna E, Wsol V (2014). Anthracycline resistance mediated by reductive metabolism in cancer cells: The role of aldo-keto reductase 1C3. Toxicology and Applied Pharmacology 278: 238–248. https://doi.org/10.1016/j.taap.2014.04.027 [Google Scholar] [PubMed] [CrossRef]
Kim SY (2018). Cancer energy metabolism: Shutting power off cancer factory. Biomolecules and Therapeutics 26: 39–44. https://doi.org/10.4062/biomolther.2017.184 [Google Scholar] [PubMed] [CrossRef]
Kirsch M, Groot H (2001). NAD(P)H, a directly operating antioxidant? FASEB Journal 15: 1569–1574. https://doi.org/10.1096/fj.00-0823hyp [Google Scholar] [PubMed] [CrossRef]
Kljun J, Pavlič R, Hafner E, Lipec T, Moreno-Da Silva S, Tič Pž, Turel I, Büdefeld Tž, Stojan J, Rižner TL (2022). Ruthenium complexes show potent inhibition of AKR1C1, AKR1C2, and AKR1C3 enzymes and anti-proliferative action against chemoresistant ovarian cancer cell line. Frontiers In Pharmacology 13: 920379. https://doi.org/10.3389/fphar.2022.920379 [Google Scholar] [PubMed] [CrossRef]
Lanjwani SN, Zhu R, Khuhawar MY, Ding Z (2006). High performance liquid chromatographic determination of platinum in blood and urine samples of cancer patients after administration of cisplatin drug using solvent extraction and N, N’-bis(salicylidene)-1,2-propanediamine as complexation reagent. Journal of Pharmaceutical and Biomedical Analysis 40: 833–839. https://doi.org/10.1016/j.jpba.2005.07.040 [Google Scholar] [PubMed] [CrossRef]
Li Z, Yan X, Sun Y, Yang X (2016). Expression of ADP-ribosyltransferase 1 is associated with poor prognosis of glioma patients. Tohoku Journal of Experimental Medicine 239: 269–278. https://doi.org/10.1620/tjem.239.269 [Google Scholar] [PubMed] [CrossRef]
Matsumoto R, Tsuda M, Yoshida K, Tanino M, Kimura T, Nishihara H, Abe T, Shinohara N, Nonomura K, Tanaka S (2016). Aldo-keto reductase 1C1 induced by interleukin-1β mediates the invasive potential and drug resistance of metastatic bladder cancer cells. Scientific Reports 6: 34625. https://doi.org/10.1038/srep34625 [Google Scholar] [PubMed] [CrossRef]
Matsunaga T, Hojo A, Yamane Y, Endo S, El-Kabbani O, Hara A (2013). Pathophysiological roles of aldo-keto reductases (AKR1C1 and AKR1C3) in development of cisplatin resistance in human colon cancers. Chemico-Biological Interactions 202: 234–242. https://doi.org/10.1016/j.cbi.2012.09.024 [Google Scholar] [PubMed] [CrossRef]
Matsunaga T, Yamaguchi A, Morikawa Y, Kezuka C, Takazawa H, Endo S, El-Kabbani O, Tajima K, Ikari A, Hara A (2014). Induction of aldo-keto reductases (AKR1C1 and AKR1C3) abolishes the efficacy of daunorubicin chemotherapy for leukemic U937 cells. Anti-Cancer Drugs 25: 868–877. https://doi.org/10.1097/CAD.0000000000000112 [Google Scholar] [PubMed] [CrossRef]
Mayevsky A (2009). Mitochondrial function and energy metabolism in cancer cells: Past overview and future perspectives. Mitochondrion 9: 165–179. https://doi.org/10.1016/j.mito.2009.01.009 [Google Scholar] [PubMed] [CrossRef]
Mindnich RD, Penning TM (2009). Aldo-keto reductase (AKR) superfamily: Genomics and annotation. Human Genomics 3: 362–370. https://doi.org/10.1186/1479-7364-3-4-362 [Google Scholar] [PubMed] [CrossRef]
Novotna R, Wsol V, Xiong G, Maser E (2008). Inactivation of the anticancer drugs doxorubicin and oracin by aldo-keto: Reductase (AKR) 1C3. Toxicology Letters 181: 1–6. https://doi.org/10.1016/j.toxlet.2008.06.858 [Google Scholar] [PubMed] [CrossRef]
Penning TM (2014). Human aldo-keto reductases and the metabolic activation of polycyclic aromatic hydrocarbons. Chemical Research In Toxicology 27: 1901–1917. https://doi.org/10.1021/tx500298n [Google Scholar] [PubMed] [CrossRef]
Penning TM (2015). The aldo-keto reductases (AKRsOverview. Chemico-Biological Interactions 234: 236–246. https://doi.org/10.1016/j.cbi.2014.09.024 [Google Scholar] [PubMed] [CrossRef]
Penning TM, Jonnalagadda S, Trippier PC, Rižner TL (2021). Aldo-keto reductases and cancer drug resistance. Pharmacological Reviews 73: 1150–1171. https://doi.org/10.1124/pharmrev.120.000122 [Google Scholar] [PubMed] [CrossRef]
Phoo NLL, Dejkriengkraikul P, Khaw-On P, Yodkeeree S (2021). Transcriptomic profiling reveals AKR1C1 and AKR1C3 mediate cisplatin resistance in signet ring cell gastric carcinoma via autophagic cell death. International Journal of Molecular Sciences 22: 12512. https://doi.org/10.3390/ijms222212512 [Google Scholar] [PubMed] [CrossRef]
Qi J, Tripathi M, Mishra R, Sahgal N, Fazli L et al. (2013). The E3 ubiquitin ligase Siah2 contributes to castration-resistant prostate cancer by regulation of androgen receptor transcriptional activity. Cancer Cell 23: 332–346. https://doi.org/10.1016/j.ccr.2013.02.016 [Google Scholar] [PubMed] [CrossRef]
Reddi D, Seaton BW, Woolston D, Aicher L, Monroe LD et al. (2022). AKR1C3 expression in T acute lymphoblastic leukemia/lymphoma for clinical use as a biomarker. Scientific Reports 12: 5809. https://doi.org/10.1038/s41598-022-09697-6 [Google Scholar] [PubMed] [CrossRef]
Rizner TL, Lin HK, Peehl DM, Steckelbroeck S, Bauman DR, Penning TM (2003). Human type 3 3alpha-hydroxysteroid dehydrogenase (aldo-keto reductase 1C2) and androgen metabolism in prostate cells. Endocrinology 144: 2922–2932. https://doi.org/10.1210/en.2002-0032 [Google Scholar] [PubMed] [CrossRef]
Rižner TL, Šmuc T, Rupreht R, Sinkovec J, Penning TM (2006). AKR1C1 and AKR1C3 may determine progesterone and estrogen ratios in endometrial cancer. Molecular and Cellular Endocrinology 248: 126–135. https://doi.org/10.1016/j.mce.2005.10.009 [Google Scholar] [PubMed] [CrossRef]
Schoch S, Gajewski S, Rothfuß J, Hartwig A, Köberle B (2020). Comparative study of the mode of action of clinically approved platinum-based chemotherapeutics. International Journal of Molecular Sciences 21: 6928. https://doi.org/10.3390/ijms21186928 [Google Scholar] [PubMed] [CrossRef]
Shirato A, Kikugawa T, Miura N, Tanji N, Takemori N, Higashiyama S, Yokoyama M (2014). Cisplatin resistance by induction of aldo-keto reductase family 1 member C2 in human bladder cancer cells. Oncology Letters 7: 674–678. https://doi.org/10.3892/ol.2013.1768 [Google Scholar] [PubMed] [CrossRef]
Song GL, Jin CC, Zhao W, Tang Y, Wang YL et al. (2016). Regulation of the RhoA/ROCK/AKT/catenin pathway by arginine-specific ADP-ribosytransferases 1 promotes migration and epithelial-mesenchymal transition in colon carcinoma. International Journal of Oncology 49: 646–656. https://doi.org/10.3892/ijo.2016.3539 [Google Scholar] [PubMed] [CrossRef]
Stomberski CT, Anand P, Venetos NM, Hausladen A, Zhou HL, Premont RT, Stamler JS (2019). AKR1A1 is a novel mammalian S-nitroso-glutathione reductase. Journal of Biological Chemistry 294: 18285–18293. https://doi.org/10.1074/jbc.RA119.011067 [Google Scholar] [PubMed] [CrossRef]
Wang S, Liu R, Han Q, Yu K (2022). HSA-MIR-203/MyD88 axis mediates the protective effect of hispidulin on LPS-induced apoptosis in a human renal tubular epithelial line, HK-2. BIOCELL 46: 149–158. https://doi.org/10.32604/biocell.2021.013027 [Google Scholar] [CrossRef]
Wsol V, Szotakova B, Martin HJ, Maser E (2007). Aldo-keto reductases (AKR) from the AKR1C subfamily catalyze the carbonyl reduction of the novel anticancer drug oracin in man. Toxicology 238: 111–118. https://doi.org/10.1016/j.tox.2007.05.021 [Google Scholar] [PubMed] [CrossRef]
Yang L, Xiao M, Li X, Tang Y, Wang YL (2016). Arginine ADP-ribosyltransferase 1 promotes angiogenesis in colorectal cancer via the PI3K/Akt pathway. International Journal of Molecular Medicine 37: 734–742. https://doi.org/10.3892/ijmm.2016.2473 [Google Scholar] [PubMed] [CrossRef]
Zhao Y, Zheng X, Zhang H, Zhai J, Zhang L, Li C, Zeng K, Chen Y, Li Q, Hu X (2015). In vitro inhibition of AKR1Cs by sulphonylureas and the structural basis. Chemico-Biological Interactions 240: 310–315. https://doi.org/10.1016/j.cbi.2015.09.006 [Google Scholar] [PubMed] [CrossRef]
Zhong T, Xu F, Xu J, Liu L, Chen Y (2015). Aldo-keto reductase 1C3 (AKR1C3) is associated with the doxorubicin resistance in human breast cancer via PTEN Loss. Biomedicine & Pharmacotherapy 69: 317–325. https://doi.org/10.1016/j.biopha.2014.12.022 [Google Scholar] [PubMed] [CrossRef]
Cite This Article
 Copyright © 2023 The Author(s). Published by Tech Science Press.
This work is licensed under a Creative Commons Attribution 4.0 International License , which permits unrestricted use, distribution, and reproduction in any medium, provided the original work is properly cited.
 Downloads
 Citation Tools