
 Submit a Paper
 Propose a Special lssue
 Open Access
ARTICLE

A model based on eight iron metabolism-related genes accurately predicts acute myeloid leukemia prognosis
1 Department of Hematology, Yongchuan Hospital of Chongqing Medical University, Chongqing, 402160, China
2 Department of Hematology, The Second Affiliated Hospital of Chongqing Medical University, Chongqing, 400010, China
* Corresponding Author: XI HUANG. Email:
(This article belongs to the Special Issue: Bioinformatics Study of Diseases)
BIOCELL 2023, 47(3), 593-605. https://doi.org/10.32604/biocell.2023.024148
Received 26 May 2022; Accepted 29 August 2022; Issue published 03 January 2023
 View Full Text
 Download PDF
Abstract
Purpose: Iron metabolism maintains the balance between iron absorption and excretion. Abnormal iron metabolism can cause numerous diseases, including tumor. This study determined the iron metabolism-related genes (IMRGs) signature that can predict the prognosis of acute myeloid leukemia (AML). The roles of these genes in the immune microenvironment were also explored. Methods: A total of 514 IMRGs were downloaded from the Molecular Characteristics Database (MSigDB). IMRGs related to AML prognosis were identified using Cox regression and LASSO analyses and were used to construct the risk score model. AML patients were stratified into high-risk groups (cluster 1) and low-risk groups (cluster 2) based on the mean value of the risk score. The accuracy and prognosis prediction potential of the risk-score model was evaluated using Kaplan-Meier and receiver operating characteristics analysis. The stromal score, immune scores, and immune cells infiltrated in AML samples were estimated using CIBERSORT, MCPcountre, and Xcell algorithms. The role of immune checkpoint genes in the AML microenvironment and the prognostic value of the IMRGs were also evaluated. Results: An AML prognosis prediction model was established based on the eight most critical IMRGs. Further analyses revealed that the model could accurately predict AML prognosis. The expression of IMRGs correlated with the infiltration of several immune cells and could influence response to certain chemotherapy drugs and immunotherapy. Conclusion: A model based on IMRGs can accurately predict the overall survival and disease-free survival of AML patients.Keywords
Leukemia is a common malignant tumor of the hematopoietic system classified into chronic and acute leukemia. Acute myeloid leukemia (AML) is a heterogeneous and highly fatal hematologic malignancy (Medeiros et al., 2019). AML is sometimes cured, and life can often be extended with treatment, but for most patients, the outcomes are dire or poor (Meyers et al., 2013). Despite advances in diagnostic and treatment methods, the prognosis of AML patients is unsatisfactory due to tumor cell heterogeneity and drug resistance (de Kouchkovsky and Abdul-Hay, 2016). Therefore, it is critical to identify factors that influence AML prognosis to improve the survival outcome of AML patients.
Iron is an essential dietary element that participates in maintaining normal physiological function and metabolic homeostasis (Bogdan et al., 2016). Iron metabolism is tightly regulated by the body but multiple factors, including genetics changes and the environment, can cause iron metabolic disorders (Nemeth and Ganz, 2021). Iron metabolism disorder participates in numerous pathological processes, including tumorigenesis, development, metastasis, and angiogenesis. Iron deficiency is common in patients with tumors (Torti and Torti, 2013). Increasing evidence shows that the DNA synthesis and repair induced by iron metabolism disorder and higher proliferation rate are related to the pathological cancer processes (Evstatiev and Gasche, 2012; Torti et al., 2018). Iron accumulation, as well as iron-catalytic reactive oxygen/nitrogen species and aldehydes, can cause DNA-strand breaks and tumorigenesis (Legendre and Garcion, 2015; Jung et al., 2019). Iron also participates in several types of cell death (Dixon and Stockwell, 2014), especially ferroptosis. Schonberg et al. (2015) showed that glioblastoma cancer stem-like cells can absorb iron from the microenvironment more effectively by upregulating their expression levels of ferritin and transferrin receptor 1. Iron inhibition induces DNA-strand breaks in cancer cells, underlining the relationship between iron metabolism disorder and the proliferation of cancer cells (Wang et al., 2018). Thus, there is a need to uncover the diagnosis potential and the relationship between iron metabolism-related genes in cancer prognosis and treatment response.
In the clinical setting, determining the cancer type and different stages is critical to deciding the appropriate treatment. However, conventional diagnosis methods suffer numerous intrinsic limitations. The development, progression, and treatment experimental outcome of malignant tumors are regulated by complex gene networks. Therefore, widely used machine learning algorithms are useful in identifying novel biomarkers related to cancer prognosis and immune cell infiltration, including in AML. Machine learning algorithms override the risk of overfitting presented by traditional methods.
Herein, we conducted in-depth bioinformatics analyses based on expression levels of genes and clinical data from The Cancer Genome Atlas (TCGA) and the Gene Expression Omnibus (GEO) database. Information on IMRGs were obtained from the Molecular Characteristics Database (MSigDB). The risk-score system of AML was constructed and validated by identifying dysregulated iIMRGs. Moreover, the CIBERSORT deconvolution algorithm was applied between the high-risk and low-risk groups to determine immune cell infiltration. We found that subtype stratification and prognostic models based on genes related to iron metabolism could efficiently predict the prognosis and immunotherapy response in patients with AML.
A total of 514 genes related to iron metabolism were downloaded from MSigDB. The gene-expressed data set (187 tumor samples, workflow type: HTseq-FPKM, disease type: acute myeloid leukemia) was obtained from the TCGA database. The corresponding clinical information, such as tumor pathological grade and survival rate, was gained from the GEO database.
The support vector machine (SVM) based CIBERSORT deconvolution algorithm, MCPcountre, and Xcell were utilized to investigate the heterogeneity of the immune microenvironment in tumors from tumor RNA sequencing data. The CIBERSORT algorithm uses linear Support vector regression to deconvolution the tumor tissue expression matrix and analyzes the cell content of each type in the tissue. Based on a known reference data set, CIBERSORT provides a default set of gene expression characteristics for 22 immune cell subtypes: LM22. MCPcounter, an R-package, calculates the absolute abundance of 8 immune cells and 2 stromal cells based on the transcriptome data. It is important to note that transcriptome data must be normalized. xCell is a powerful computational method for converting gene expression profiles into a rich fraction of 64 immune and stromal cell types across samples.
The risk score system construction and validation
Univariate Cox regression analysis was performed for the genes selected and data dimension reduction. P < 0.05 was considered to reflect a statistically significant difference. The multivariate COX analysis was used to construct risk models. The LASSO-regression model was carried out by the “glmnet” package to punish the model for implementing constraints on the objective function. Subsequently, a risk-score system was established based on normalized gene expression values of the identified genes and their coefficients.
The K-means algorithm was performed to judge the close relationship between different samples by calculating the distance between them, and the similar samples were put into the same category. For a given sample set, the K-Means algorithm divides the sample set into K clusters according to the distance between the samples.
Kaplan-Meier survival analysis
KM survival analysis is the most commonly used method for survival analysis and gives results based on the statistical values of observed samples. First, the probability of patients surviving a certain period and surviving the next period (i.e., survival probability) was calculated, and then the survival probability was multiplied one at-a-time, which is the survival rate of the corresponding period.
The ESTIMATE algorithm, which can estimate the stromal and immune fractions of tumor samples from expression data, was used to represent the presence of stromal and immune cells. The stromal scores and immune scores of tumor samples were added to estimate the score, which was used to estimate tumor purity.
A nomogram is a quantitative analysis diagram that uses a cluster of disjoint line segments in plane coordinates to represent the functional relationship between multiple variables or survival probability, etc.
The Wilcoxon test, also known as the Mann-Withney-Wilcoxon test, is a nonparametric test, suggesting it does not rely on data belonging to a family of probability distributions for any particular parameter. Wilcoxon test was chosen to compare two independent groups of samples when the data was not normally distributed. The bioinformatics analysis was carried out by R v3.6.1 environment. P < 0.05 was considered statistically significant. The “survival v3.2-3” package was employed for drawing the K-M curve and COX regression analysis. The time-dependent receiver operating characteristic (tROC) and LASSO algorithms were implemented through “timeROC v 0.4” and “glmnet v4.0-2,” respectively.
Identification of iron metabolism-related genes in acute myeloid leukemia
The data set for the expression of 13513 genes were acquired from the GEO database. A total of 514 IMRGs were obtained from MSigDB. According to the Venn intersection of GSE37642 and MSigDB iron metabolism genes, 427 IMRGs were identified and selected for further analysis (Fig. 1).

Figure 1: Venn diagram of intersection of GSE37642 and MSigDB iron metabolism genes.
Identification of iron metabolism-related genes associated with prognostic
The univariate Cox regression analysis was chosen to identify iron metabolism genes significantly associated with AML prognosis. The clinical information (age, gender, and stage) and 514 IMRGs were included in the Cox regression to assess the prognostic value of IMRGs. P < 0.05 was used to the cut-off threshold, these 62 IMRGs were identified as the most valuable predictive genes for AML based on univariate cox regression analysis. The forest plot displayed the hazard ratios of IMRGs in AML patients (Fig. 2).

Figure 2: Univariate regression forest plot of 62 prognosis-related iron metabolism genes.
Predictive analysis of prognostic subtypes
For an in-depth understanding of the molecular heterogeneity of iron metabolism genes and to examine its presented discernible patterns in AML, we enforced unsupervised consensus analysis of GSE37642 leukemia samples by setting the K-value range from 2 to 6. The k = 2 seemed to be truer, which divided AML samples into clusters 1 and 2, containing 330 and 223 leukemia samples, respectively. Next, PCA was performed to further verify the stability of clustering results. The minimum value of PAC, which is also the best K, was still 2. To evaluate the association between clustering results and clinical outcomes, we compared the IMRGs between the clusters 1 and 2 in AML patients via the K-M analysis. The K-M curve showed that the survival and prognosis information of different subtypes was significantly different. Patients in cluster 1 with higher iron metabolism-related genes had a worse prognosis than those in clusters 2 (Fig. 3). The heatmap of 62 iron metabolism genes expressed in different isoforms are shown in the Fig. 4.

Figure 3: Predictive analysis of prognostic subtypes in leukemia. (A) Cumulative distribution function (CDF) plot. (B) K = 2 Consensus Matrix (CM) plot. (C) PAC validation plot. (D) Survival curves of different subtypes of KM.

Figure 4: The heatmap of 62 iron metabolism genes expressed in different isoforms.
Iron metabolism genes-based clusters related to immune function
To assess the correlation between iron metabolism genes-based clusters and additional immune infiltration features, the MCPcount, CIBERSORT, and Xcell algorithms were chosen to characterize the immune status between the clusters 1 and 2. Setting a threshold of P < 0.05, we discerned 22 types of differential immune cells (DICs) among the two clusters by CIBERSORT, nine types DICs by MCPcount, and 24 DICs by Xcell (Fig. 5). The current mainstream immune infiltration calculation method is MCPcount, CIBERSORT, and Xcell. The CIBERSORT algorithm uses linear Support vector regression to deconvolution the tumor tissue expression matrix and analyzes the cell content of each type in the tissue. MCPcounter, an R-package, calculates the absolute abundance of eight immune cells and two stromal cells based on the transcriptome data. Importantly, transcriptome data must be normalized. xCell is a powerful computational method for converting gene expression profiles into a rich fraction of 64 immune and stromal cell types across samples. Figs. 5A and 5B show the significant differences in different immune cell infiltration results in cluster 1 and cluster 2. Most of the immune cells had different levels of infiltration in the two different clusters, which provided an infiltration basis for the construction of the iron metabolism risk model in this paper. The results indicated that the expression levels of immune cells were significantly different between the clusters 1 and 2.

Figure 5: Analysis of differential immune cells between cluster 1 and cluster 2. (A) Violin diagram for comparison of the differences of 22 types of immune cells among different subtypes based on CIBERSORT algorithm. (B) MCPcountre algorithm: box chart of 9 immune cells in different subtypes. (C) Heat maps of 24 kinds of immune cells in different subtypes based on Xcell algorithm. Where, * represents p < 0.05; ** indicates that P < 0.01, *** indicates that P < 0.001, and **** indicates that P < 0.0001.
Construction and validation of iron metabolism risk score
We used LASSO regression analysis and identified a total of 35 prognostic iron metabolism genes based on 62 prognostic iron metabolism genes. Then, using P < 0.05 as the threshold, 24 iron metabolism genes were selected to perform stepwise COX regression, and eight iron metabolism model genes were identified by KM analysis. The iron metabolism risk score (IMRS) generated by the stepwise multivariate Cox regression analysis was used to calculate the regression coefficient and gene expression level of each gene (Fig. 5).
Construction prognostic model of iron metabolism-related genes
To clarify the role and clinical value of IMRGs in the prognosis of AML patients, 187 AML patients were used as a training set. Simultaneously, univariate COX regression analysis and LASSO optimization were used to estimate the risk of the prognostic model. Univariate COX regression analysis showed that 62 genes significantly associated with overall survival were identified in the training set (P < 0.05) (Figs. 6A and 6B). To determine the independent prognostic genes, multivariate Cox regression analysis for overall survival (OS) was performed among the 8-iron metabolism-related hub genes. As shown in Fig. 6C, three gene signatures (CYP2E1, SLC22A4, and HMOX2) significantly affected the OS of patients with AML.

Figure 6: Construction of a prognostic model of iron metabolism. (A) The abscissa is the L1 penalty ratio, and the ordinate is the coefficient of the gene. (B) The abscissa is log(Lambda), the ordinate represents the cross-validation error, and the position of the dotted line on the left is the position with the smallest cross-validation error. According to this position (lambda.min), the corresponding abscissa log(Lambda) is determined, and the features are shown above. The number of genes to find the optimal log(Lambda) value. (C) Multivariate COX regression forest plot of 8 iron metabolism model genes identified by stepwise regression (8 genes establish a score, the purpose is to say that these 8 genes can be used to predict the prognosis of leukemia).
Survival outcomes of iron metabolism-related genes in different risk groups
To further analyze the estimated risk of clinical prognosis of eight iron metabolism-related genes (ATP6V1G2, ATP6VOE2, STEAP4, CYP2E1, ATP13A2, SLC22A4, ATP6VIH, and HMOX2), we calculated the risk scores of these eight target genes based on LASSO coefficient and used the median value as the critical value for survival analysis. The expression of eight iron metabolism-related genes correlated closely with HNSCC patient OS determined by Kaplan-Meier (K-M) analysis, as shown in Fig. 7 (P < 0.05; log-rank test).
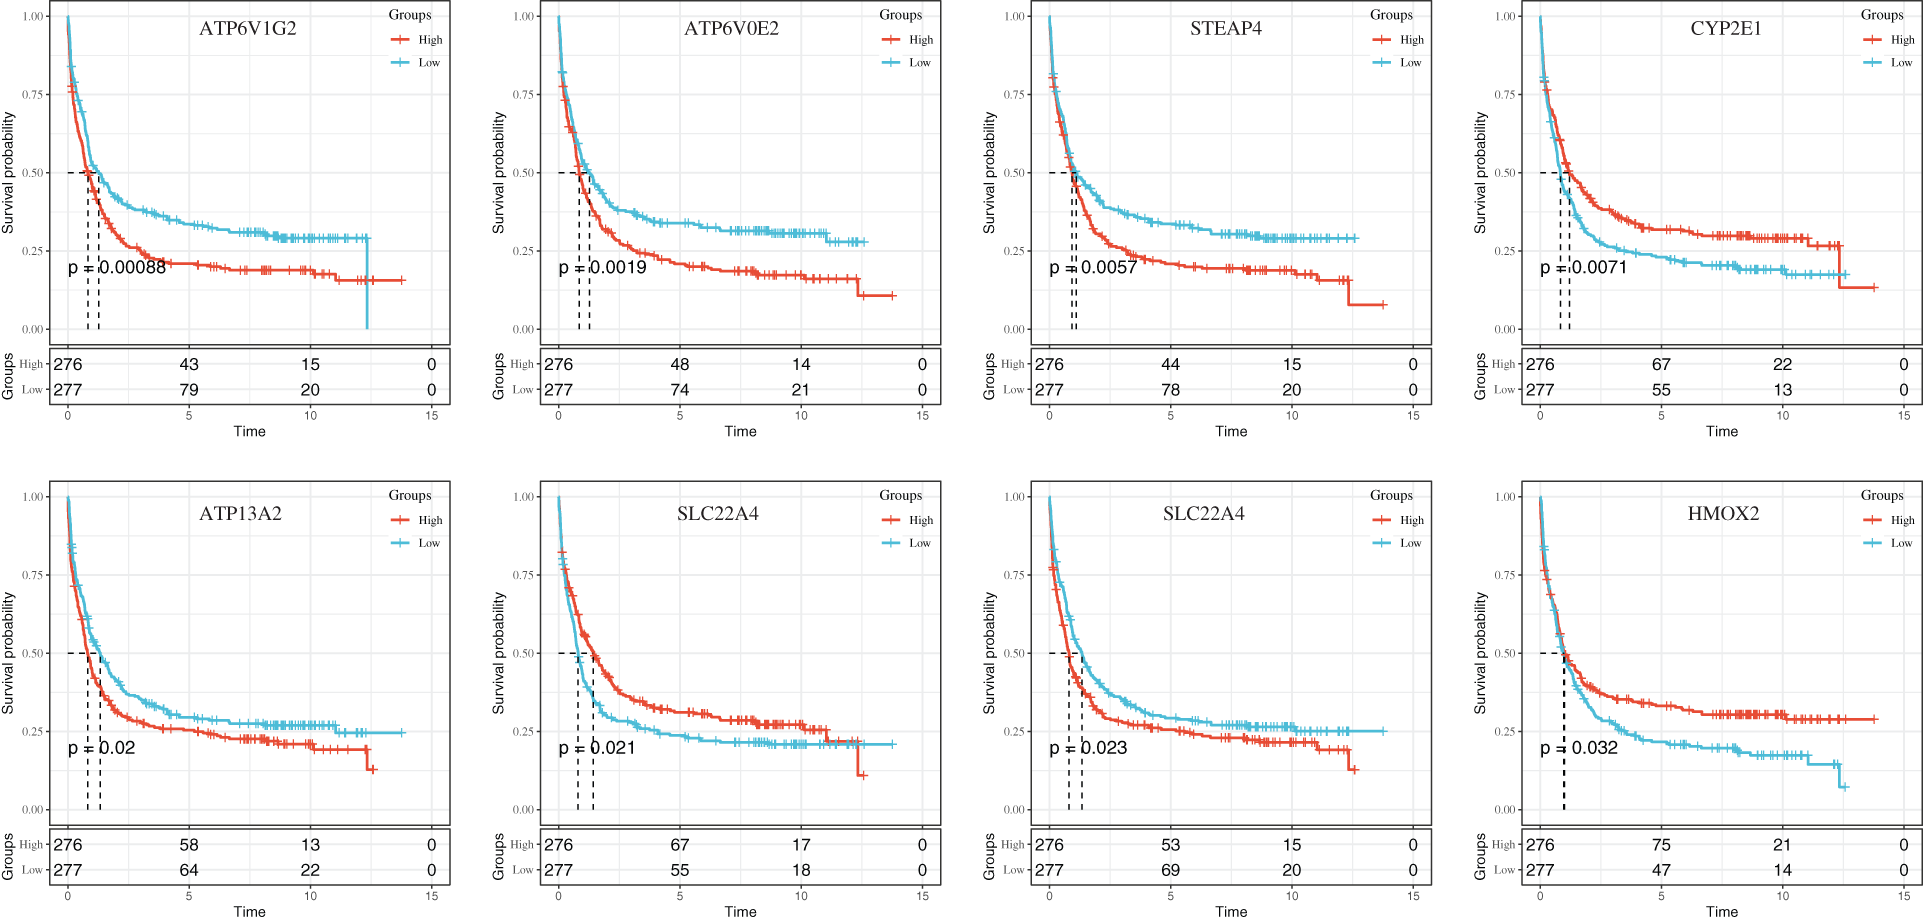
Figure 7: The KM curves of gene expression in 8 iron metabolism models.
Assessment of the risk score system in a prognostic model of iron metabolism
The IMRGs distribution in the training and test sets was quantified based on the expression levels of these genes and the regression coefficients. The IMRS distribution in GSE37642 and TCGA-LAML are respectively shown in Figs. 8A and 8D. K-M survival curves for both trial cohorts showed that the survival probability of AML patients with high-risk scores was significantly lower than that of AML patients with low-risk score (Fig. 8B and 8E). To evaluate the reliability of the prognostic model, ROC curves were drawn in GSE37642 and TCGA-LAML. The areas under the curve (AUCs) of an iron death risk score for GSE37642 were 0.73, 0.77, and 0.76, corresponding to 1, 3, and 5 years, respectively, while AUCs for the TCGA-LAML were 0.74, 0.72, and 0.71, corresponding to 1, 3, and 5 years, respectively (Figs. 8C and 8F). These results suggest that this model is a valid predictor of outcomes in AML patients.

Figure 8: Performance evaluation of a prognostic model of iron metabolism. (A) IMRS distribution (above) and survival time status (below) in GSE37642. (B) Imrs-based prediction model and prognostic KM curve in GSE37642. (C) 1-, 3-, and 5-year ROC curves based on genetic prognostic characteristics in GSE37642. (D) IMRS distribution (above) and survival time status (below) in TCGA-LAML. (E) TCGA-LAML prediction model based on IMRS and prognostic KM curve. (F) 1, 3, and 5-year ROC curves based on genetic prognostic characteristics for TCGA-LAML.
Correlation between iron metabolism prognostic model and immune microenvironment
The occurrence of tumors is not only related to the proliferation and growth of tumor cells but also to the growth of infiltrating inflammatory cells. The occurrence, development, and prognosis of malignant tumors is often found to be related to inflammatory response and cellular immunity. Immunotherapy of-L1 expression is also gradually applied in clinical practice. Nonetheless, the relationship between immune cells in cancer tissue and the progression and prognosis of cancer is still not clear. Therefore, it is necessary to study the relationship between immune cells in tumors and the associated prognosis. Concurrently, although the current TNM analysis system is the gold standard for malignant tumor treatment selection and prognosis evaluation, in clinical practice, many patients with the same TNM stage have different prognostic outcomes. This suggests that a single TNM stage may not be able to comprehensively and accurately predict the prognosis of patients, making it necessary to explore more effective prognostic indicators. On the other hand, TNM staging cannot evaluate the response of patients to treatment. Therefore, it is necessary to explore the correlation between the intratumoral infiltration of immune cells and the prognosis of malignant tumors, and further research is needed to further discover the relationship and mechanism of inflammation, immunity, and tumor progression. More importantly, in the future treatment and prognostic evaluation system of malignant tumor patients, whether the immunity to leukemia should be regarded as an independent prognostic evaluation standard, combined with the expression level of PD-1/PD-L1, as a comprehensive score standards, thereby opens new ideas for the prevention and treatment of malignant tumors. To explore the correlation between IMRGs prognostic model and immune infiltration in AML, the immune score and matrix score were calculated based on the estimate algorithm. The immunoscore, stroma score, ESTIMATE score, and tumor purity were compared in high-risk and low-risk groups, as shown in Fig. 9A. In addition, the HLA family genes and immune checkpoint (ICs) were both compared between the high-risk and low-risk groups; the expressions of HLA-B, HLA-G, and HLA-J in the high-risk group were significantly different from that in the low-risk group (Fig. 9B). Moreover, immune checkpoint (ICs) was compared between the two groups (Fig. 9C). The results showed that LAG3 expression in the high-risk group was significantly different from that in the low-risk group. Heatmap of correlations between iron metabolism risk scores and HLA family differentially expressed genes (HLA-B, HLA-G, and HLA-J) and immune checkpoint differentially expressed genes (LAG3) are shown in Fig. 9D. These results suggest that the prognostic characteristics associated with iron metabolism-related genes are associated with immune infiltration.

Figure 9: Correlation between iron metabolism prognostic model and immune microenvironment. (A) Immune score, stroma score, and tumor purity in the high- and low-risk groups. (B) Box diagram of HLA family genes expression differences between high-risk and low-risk groups. * represents p less than 0.05; ** indicates that P is less than 0.01, *** indicates that P is less than 0.001, and **** indicates that P is less than 0.0001. (C) Box plot of differential expression of immune checkpoints (ICs) in high-risk and low-risk groups. (D) Heat map of iron metabolism risk score associated with differential HLA family genes and immune checkpoints.
Chemotherapeutic drug sensitivity and immunotherapy efficacy analysis
To explore the sensitivity of AML patients to chemical drugs (IC50 value denoted sensitivity), we estimated the sensitivity of each patient to chemotherapy drugs from the Cancer Drug Sensitivity Genomics database (GDSC database). Drug sensitivity (IC50 value denoted sensitivity) was quantified by pRRophetic package of R. After that, the Wilcoxon test was used to compare the difference in IC50 of six common leukemia chemotherapy drugs (vinblastine, methotrexate, mitomycin, cisplatin, cyclopamine, and doxorubicin) between the high and low-risk groups. Only four drugs (doxorubicin, cisplatin, methotrexate, and cyclopamine) had significant sensitivity differences between the two groups (Figs. 10A–10D). The database of Tumor Immune Dysfunction and Exclusion (TIDE) was analyzed for the therapeutic effect of immunotherapy and the predicted response of each patient to immunotherapy was represented by the TIDE score, and the TIDE score of each patient was returned. Then, the correlation analysis between iron metabolism risk score and TIDE score showed that the a very significant correlation of the IMRS with the TIDE score (R = 0.12, P = 0.0045).

Figure 10: Chemotherapeutic drug sensitivity and immunotherapy efficacy analysis. (A–D) Comparison of IC50 differences among 4 chemotherapeutic agents in the high and low risk groups. (E) Comparison of TIDE score differences in high and low risk groups. (F) Correlation analysis between iron metabolism risk score and TIDE score.
Analysis of iron metabolism risk score mutation status
The information data related to LAML gene mutation were downloaded from the TCGA database. The mutation frequency of each gene in the included LAML samples was counted, and the top20 mutation frequencies in the LAML samples were visualized (Fig. 11A). Then, the TMB values of the LAML samples were calculated, and the comparison of TMB differences between the high and low groups revealed that the TMB values of the LAML samples in the high-risk group were significantly different from that in the low-risk group (P = 0.014) (Fig. 11B). Scatter plot of correlation between IMRS and TMB as shown in Fig. 11C, the correlation coefficient R value was −0.23 (P = 0.026).
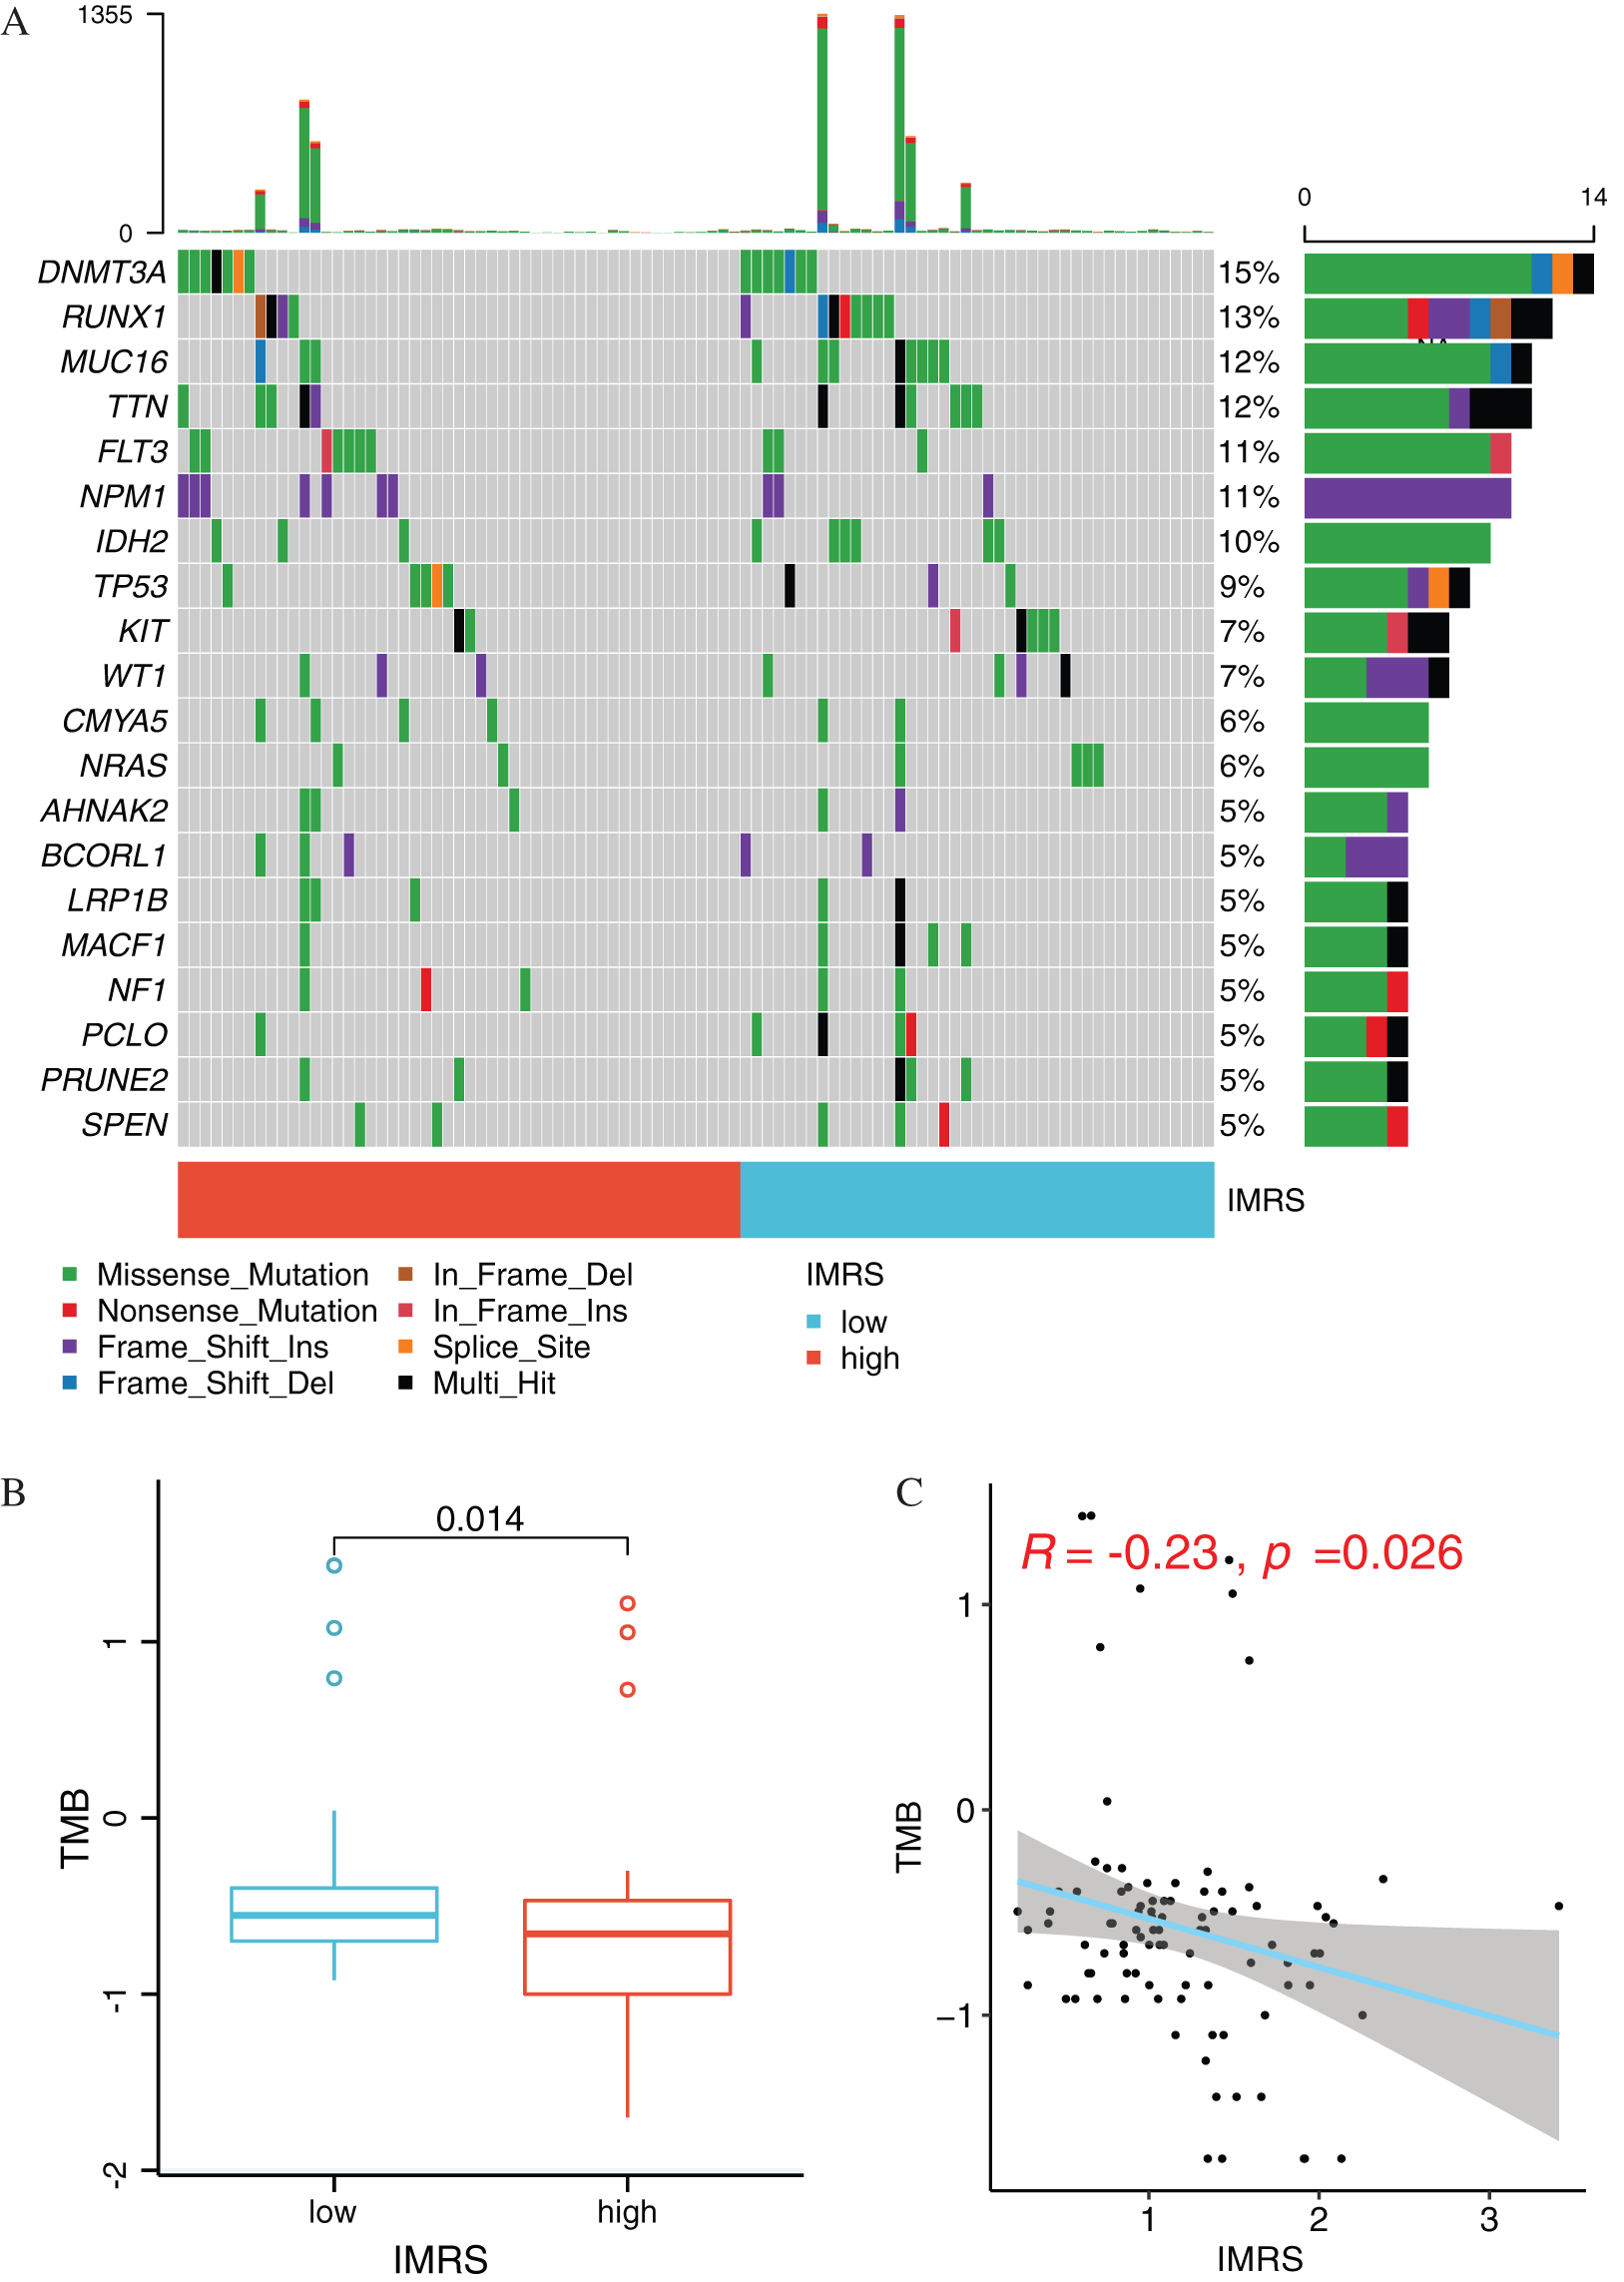
Figure 11: Mutation status analysis of IMRS. (A) Display of mutations of Top20 genes in different risk groups. (B) Box diagram of TMB value comparison between High and Low risk groups. (C) Scatter diagram of correlation between IMRS and TMB.
Independent prognostic analysis and the construction of rosette
Based on GSE37642 clinical information, the AGE, RUNX1_MUTATION, IMRS, and Cluster were included in the construction of the linographic survival model (Figs. 12A and 12B). The nomogram was constructed to predict 5-year expected survival for patients with AML based on univariate and multivariate regression analysis (Fig. 12C). The emergence of individualized prediction charts based on multiple factors can improve the accuracy of prediction and also calculate the survival rate of each patient, providing important information for out-of-hospital prevention and treatment as well as follow-up monitoring.
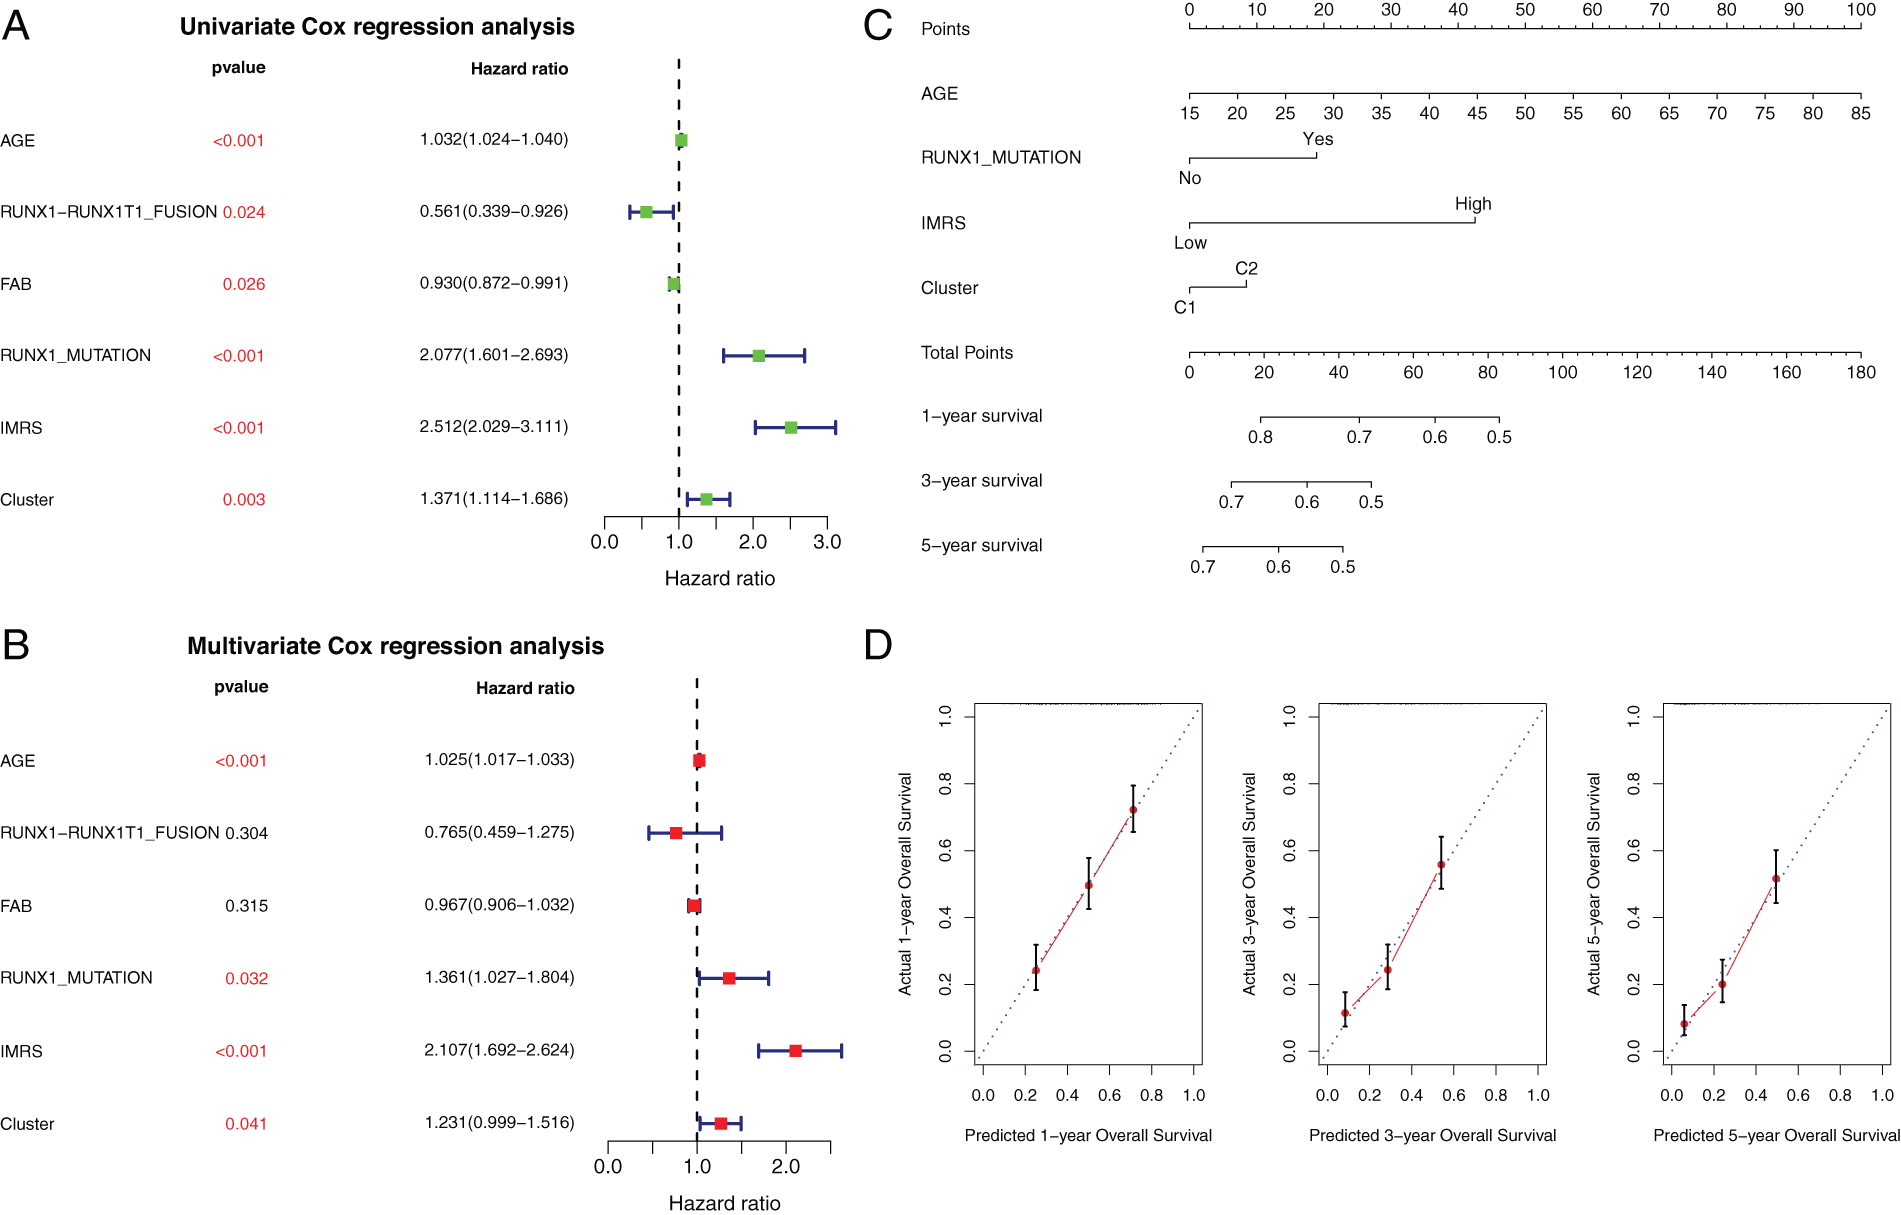
Figure 12: Independent prognostic analysis and the construction of rosette. (A and B) Clinical factors selected. Univariate and multivariate Cox regression forest maps for clinical factors, IMRS, and clusters. (C) Nomogram of independent prognostic factor survival prediction model. (D) Line graph The consistency lines of one-year, three-year and five-year predicted survival rates and actual survival rates. The horizontal axis represents the predicted survival rate, and the vertical axis represents the actual survival rate.
AML is a highly prevalent and fatal heterogeneous hematologic malignancy (Papaemmanuil et al., 2016). The tumor is also metastatic and highly recurrent despite effective treatment with radiotherapy and chemotherapy, among other modes. Generally, the current tumor staging systems fails to adequately predict the prognosis of numerous cancers, underlying the need for urgent identification of biomarkers for accurate tumor diagnosis and prognosis. Growing evidence shows that aberrant iron metabolism participates in AML initiation, progression, and infiltration of immune cells to the microenvironment (Kennedy et al., 2014; Benadiba et al., 2017; Hagag et al., 2018). Numerous studies have implicated dysregulated expression of IMRGs in cancer progression (Li et al., 2020; Zhu et al., 2021; Song et al., 2022). Therefore, iron metabolism is a potential target for clinical diagnosis and treatment of AML. Most studies have focused on the regulatory role of iron metabolism on tumorigenesis and its potential for cancer treatment. However, IMRGs that are related to AML prognosis have not been elucidated.
In the present study, we used sequences to identify IMRGs for potential AML diagnosis and prognosis prediction. Sequences A for 514 IMRGs were downloaded from MSigDB. Venn interaction between MSigDB and GSE37642, and 427 iron metabolism related genes were examined. Among these, 62 genes were identified as potential markers for leukemia prognosis. To evaluate the prognostic potential of our model, AMLs were classified into high and low-risk groups using unsupervised cluster analysis based on the medium-risk scores. We found a significant difference in the survival and prognosis between AML patients in high and low-risk groups. Further analyses showed no difference in the infiltration of M1 macrophages between patients of clusters 1 and 2, but patients in cluster 1 displayed higher infiltration of M2 macrophages, which might explain the difference in prognosis between patients of clusters 1 and 2. Therefore, M2 macrophages are potentially promising targets for inhibiting tumor growth. Iron metabolism disorder has a crucial role in the initiation and development of cancer. Thus, a related model can accurately predict AML prognosis. In the present study, LASSO regression analysis identified 35 iron metabolism-related genes associated with AML prognosis. Among these, 24 genes were selected for stepwise regression analysis. Eight of these genes (ATP6V1G2, ATP6VOE2, STEAP4, CYP2E1, ATP13A2, SLC22A4, ATP6VIH, and HMOX2) were shown to be most associated with AML patients. Among them, four genes encode subunits of a vacuolar-ATPase. The vacuolar-ATPase is a proton pump expressed both in the membrane of intracellular organelles and the plasma membrane. It is an important regulator of organellar functions, intracellular molecular trafficking, intercellular communication, and intracellular signaling, and is therefore, a possible therapeutic target in the treatment of leukemia. Further analyses were performed to assess whether the 8-gene risk score model was an independent predictor of AML. We found that the OS of AML was shorter for patients in the high-risk cluster than in the low-risk cluster, suggesting that eight models of IMRGs is an independent predictor of AML prognosis. Multivariate Cox regression analysis revealed comparable findings. Overall, these eight genes could accurately stratify patients into high and low-risk subgroups and, thus, can potentially guide appropriate treatment selection.
Apart from tumor cells, many other cells, such as normal stromal cells, immune cells, vascular endothelium, and blood cells, among others, are present in the tumor tissue (Yoshihara et al., 2013; Becht et al., 2016; Zhang et al., 2020). Among them, the immune and the stromal cells are the most important, and participate in tumor growth, invasion, immune escape, and drug resistance. Therefore, the proportion or abundance of immune, stromal, and tumor cells in tumor tissues is of great clinical significance. Our results reveal significant differences in the immune score, stromal score, and tumor purity between patients of clusters 1 and 2. Also, infiltrations of immune cells (or the listed parameters) and the phenotype were strongly associated. The results also revealed a significant difference in the expression of immune checkpoints LAG3 between cluster 1 and 2 AML patient groups, implying that immunotherapy works better for them. The above findings underline the significance of iron metabolism-related genes in predicting or influencing immunotherapeutic efficacy for AML patients.
Chemotherapy remains the standard option for AML treatment. In this study, the efficacies of six common chemotherapeutic drugs for AML patients on iron metabolism mode, including vinblastine, methotrexate, mitomycin, cisplatin, cyclopamine, and doxorubicin in high and low-risk groups, were compared using Wilcoxon text to reveal that the C2 pattern was more sensitive to these chemotherapeutic drugs than the C1 pattern. Naive B cells are poor APCs, which was, however, attributed to the lack of expression of costimulatory molecules, as dendritic cells, rather than naive B cells, are responsible for the activation of antigen-specific T helper cells during initiation of antibody responses. Neutrophils are myeloid-derived and they are key mediators of leukemogenesis and resistance to chemotherapy. These findings provide a reference for the selection of clinical chemotherapy drugs.
Overall, we established and validated a highly accurate risk score AML prognosis prediction based on IMRGs. Also, the expression pattern of IMRGs was related to clinicopathological features of AML. Collectively, these findings identified promising therapeutic targets for AML treatment.
Availability of Data and Materials: The datasets generated during and/or analysed during the current study are available from the corresponding author on reasonable request.
Author Contribution: Zhanshu Liu contributed to study conception and design, data collection and analysis. Xi Huang contributed to interpretation of results, manuscript writing and final version of the manuscript.
Ethics Approval: Not applicable.
Funding Statement: This work was supported by the Research Project of Yongchuan Hospital, Chongqing Medical University (YJJC202013) and the Natural Science Foundation of Yongchuan District, Chongqing (2021yc-jckx20029).
Conflicts of Interest: The authors declare that they have no conflicts of interest to report regarding the present study.
References
Becht E, Giraldo NA, Lacroix L, Buttard B, Elarouci N et al. (2016). Estimating the population abundance of tissue-infiltrating immune and stromal cell populations using gene expression. Genome Biology 17: 218. DOI 10.1186/s13059-016-1070-5. [Google Scholar] [CrossRef]
Benadiba J, Rosilio C, Nebout M, Heimeroth V, Neffati Z et al. (2017). Iron chelation: An adjuvant therapy to target metabolism, growth and survival of murine P TEN-deficient T lymphoma and human T lymphoblastic leukemia/lymphoma. Leukemia & Lymphoma 58: 1433–1445. DOI 10.1080/10428194.2016.1239257. [Google Scholar] [CrossRef]
Bogdan AR, Miyazawa M, Hashimoto K, Tsuji Y (2016). Regulators of iron homeostasis: New players in metabolism, cell death, and disease. Trends in Biochemical Sciences 41: 274–286. DOI 10.1016/j.tibs.2015.11.012. [Google Scholar] [CrossRef]
de Kouchkovsky I, Abdul-Hay M (2016). Acute myeloid leukemia: A comprehensive review and 2016 update. Blood Cancer Journal 6: e441. DOI 10.1038/bcj.2016.50. [Google Scholar] [CrossRef]
Dixon SJ, Stockwell BR (2014). The role of iron and reactive oxygen species in cell death. Nature Chemical Biology 10: 9–17. DOI 10.1038/nchembio.1416. [Google Scholar] [CrossRef]
Evstatiev R, Gasche C (2012). Iron sensing and signalling. Gut 61: 933–952. DOI 10.1136/gut.2010.214312. [Google Scholar] [CrossRef]
Hagag AA, Badraia IM, Abdelmageed MM, Hablas NM, Hazzaa S, Nosair NA (2018). Prognostic value of transferrin receptor-1 (cd71) expression in acute lymphoblastic leukemia. Endocrine, Metabolic & Immune Disorders-Drug Targets 18: 610–617. DOI 10.2174/1871530318666180605094706. [Google Scholar] [CrossRef]
Jung M, Mertens C, Tomat E, Brune B (2019). Iron as a central player and promising target in cancer progression. International Journal of Molecular Sciences 20: 273. DOI 10.3390/ijms20020273. [Google Scholar] [CrossRef]
Kennedy AE, Kamdar KY, Lupo PJ, Okcu MF, Scheurer ME, Baum MK, Dorak MT (2014). Examination of hfe associations with childhood leukemia risk and extension to other iron regulatory genes. Leukemia Research 38: 1055–1060. DOI 10.1016/j.leukres.2014.06.016. [Google Scholar] [CrossRef]
Legendre C, Garcion E (2015). Iron metabolism: A double-edged sword in the resistance of glioblastoma to therapies. Trends in Endocrinology & Metabolism 26: 322–331. DOI 10.1016/j.tem.2015.03.008. [Google Scholar] [CrossRef]
Li J, Hu C, Du Y, Tang X, Shao C et al. (2020). Identification of iron metabolism-related gene signatures for predicting the prognosis of patients with sarcomas. Frontiers in Oncology 10: 599816. DOI 10.3389/fonc.2020.599816. [Google Scholar] [CrossRef]
Medeiros BC, Chan SM, Daver NG, Jonas BA, Pollyea DA (2019). Optimizing survival outcomes with post-remission therapy in acute myeloid leukemia. American Journal of Hematology 94: 803–811. DOI 10.1002/ajh.25484. [Google Scholar] [CrossRef]
Meyers J, Yu Y, Kaye JA, Davis KL (2013). Medicare fee-for-service enrollees with primary acute myeloid leukemia: An analysis of treatment patterns, survival, and healthcare resource utilization and costs. Applied Health Economics and Health Policy 11: 275–286. DOI 10.1007/s40258-013-0032-2. [Google Scholar] [CrossRef]
Nemeth E, Ganz T (2021). Hepcidin-ferroportin interaction controls systemic iron homeostasis. International Journal of Molecular Sciences 22: 6493. DOI 10.3390/ijms22126493. [Google Scholar] [CrossRef]
Papaemmanuil E, Gerstung M, Bullinger L, Gaidzik VI, Paschka P et al. (2016). Genomic classification and prognosis in acute myeloid leukemia. The New England Journal of Medicine 374: 2209–2221. DOI 10.1056/NEJMoa1516192. [Google Scholar] [CrossRef]
Schonberg DL, Miller TE, Wu Q, Flavahan WA, Das NK et al. (2015). Preferential iron trafficking characterizes glioblastoma stem-like cells. Cancer Cell 28: 441–455. DOI 10.1016/j.ccell.2015.09.002. [Google Scholar] [CrossRef]
Song X, Xin S, Zhang Y, Mao J, Duan C et al. (2022). Identification and quantification of iron metabolism landscape on therapy and prognosis in bladder cancer. Frontiers in Cell and Developmental Biology 10: 810272. DOI 10.3389/fcell.2022.810272. [Google Scholar] [CrossRef]
Torti SV, Manz DH, Paul BT, Blanchette-Farra N, Torti FM (2018). Iron and cancer. Annual Review of Nutrition 38: 97–125. DOI 10.1146/annurev-nutr-082117-051732. [Google Scholar] [CrossRef]
Torti SV, Torti FM (2013). Iron and cancer: More ore to be mined. Nature Reviews Cancer 13: 342–355. DOI 10.1038/nrc3495. [Google Scholar] [CrossRef]
Wang Y, Yu L, Ding J, Chen Y (2018). Iron metabolism in cancer. International Journal of Molecular Sciences 20: 95. DOI 10.3390/ijms20010095. [Google Scholar] [CrossRef]
Yoshihara K, Shahmoradgoli M, Martinez E, Vegesna R, Kim H et al. (2013). Inferring tumour purity and stromal and immune cell admixture from expression data. Nature Communications 4: 2612. DOI 10.1038/ncomms3612. [Google Scholar] [CrossRef]
Zhang M, Yang H, Wan L, Wang Z, Wang H et al. (2020). Single-cell transcriptomic architecture and intercellular crosstalk of human intrahepatic cholangiocarcinoma. Journal of Hepatology 73: 1118–1130. DOI 10.1016/j.jhep.2020.05.039. [Google Scholar] [CrossRef]
Zhu P, Li FF, Zeng J, Tang DG, Chen WB, Guo CC (2021). Integrative analysis of the characteristics of lipid metabolism-related genes as prognostic prediction markers for hepatocellular carcinoma. European Review for Medical and Pharmacological Sciences 25: 116–126. DOI 10.26355/eurrev_202101_24355. [Google Scholar] [CrossRef]
Cite This Article
 Copyright © 2023 The Author(s). Published by Tech Science Press.
This work is licensed under a Creative Commons Attribution 4.0 International License , which permits unrestricted use, distribution, and reproduction in any medium, provided the original work is properly cited.
 Downloads
 Citation Tools