
 Submit a Paper
 Propose a Special lssue
 Open Access
ARTICLE

Selection and validation of reference genes for quantitative real-time polymerase chain reaction analyses of Serratia ureilytica DW2
1 The Department of Life Sciences, Changzhi University, Changzhi, China
2 Ecological and Environmental Research Institute of Taihang Mountain, Changzhi, China
* Corresponding Author: Jiahong Ren, # These authors contributed equally to this work.
(This article belongs to the Special Issue: Advances in Plant Cell Biology Research)
BIOCELL 2023, 47(3), 647-656. https://doi.org/10.32604/biocell.2023.024758
Received 27 July 2022; Accepted 07 September 2022; Issue published 03 January 2023
 View Full Text
 Download PDF
Abstract
Background: Serratia ureilytica DW2 is a highly efficient phosphate-solubilizing bacteria isolated from Codonopsis pilosula rhizosphere soil that can promote the growth of C. pilosula; nonetheless, until now, no validated reference genes from the genus Serratia have been reported that can be used for the normalization of quantitative real-time polymerase chain reaction (RT–qPCR) data. Methods: To screen stable reference genes of S. ureilytica DW2, the expression of its eight candidate reference genes (16S rRNA, ftsZ, ftsA, mreB, recA, slyD, thiC, and zipA) under different treatment conditions (pH, temperature, culture time, and salt content) was assayed by RT–qPCR. The expression stability of these genes was analyzed using different algorithms (geNorm, NormFinder, and BestKeeper). To verify the reliability of the data, the expression of the glucose dehydrogenase (gdh) gene under different soluble phosphate levels was quantified using the most stably expressed reference gene. Results: The results showed that the zipA and 16S rRNA genes were the most stable reference genes, and the least stable genes were thiC and recA. The expression of gdh was consistent with the phosphate solubilization ability on plates containing the National Botanical Research Institute phosphate growth medium. Conclusion: Therefore, this study provides a stable and reliable reference gene of Serratia for the accurate quantification of functional gene expression in future studies.Keywords
Real-time quantitative polymerase chain reaction (RT–qPCR) is an established technique for the quantitative expression analysis of target genes under different treatment conditions (Huggett et al., 2005). This technique has many advantages, including high sensitivity, accuracy, repeatability, and low labor intensity (Thellin et al., 1999; Ginzinger, 2002; Bustin et al., 2005; Hong et al., 2008; VanGuilder et al., 2008). However, RT–qPCR analyses can be affected by the RNA quality, amplification efficiency, and the stability of reference gene expression among different samples (Shen et al., 2010; Suzuki et al., 2000; Tunbridge et al., 2011). Therefore, reliable reference genes are vital for the accurate comparison of gene expression levels between the control and experimental groups (Rocha et al., 2015). The ideal reference genes are usually stable under different experimental conditions, and their abundances are closely correlated with the total mRNA amounts (Suzuki et al., 2000). These genes, such as gyrA, gyrB, recA, fabD, rpoB, and 16S rRNA, are usually used as reference genes but are not universal for all bacteria (Rivera et al., 2015). There are no published reports related to reference genes for the genus Serratia, making it necessary to explore potential reference genes for this genus.
Serratia ureilytica DW2 is an excellent phosphate-solubilizing bacteria (PSB) previously isolated from the Codonopsis pilosula rhizosphere by this research group. This species can fix nitrogen, dissolve potassium, and produce heteroauxin and siderophores (Meng et al., 2020). As observed in greenhouse experiments, the strain DW2 can promote the growth of C. pilosula after inoculation in rhizosphere soil. C. pilosula is a traditional Chinese medicine that is widely used clinically as a therapeutic to enhance immunity, lower blood pressure, and improve microcirculation (Luan et al., 2021). C. pilosula is cultivated in large quantities to meet the high market demand. During cultivation, fertilizer is often used to improve the yield of C. pilosula, which affects its quality and soil environment. S. ureilytica DW2 could be used to develop biofertilizer for C. pilosula and thereby promote its sustainable cultivation.
To further study the growth-promoting characteristics of S. ureilytica DW2 at the molecular level, reliable reference genes need to be confirmed. Reference genes can be used to validate gene expression among different samples. Therefore, eight genes, namely, recombinase A (recA), 16S ribosomal RNA (16S rRNA), rod shape-determining protein MreB (mreB), FKBP-type peptidyl-prolyl cis-trans isomerase (slyD), hydroxymethylpyrimidine phosphate synthase (thiC), cell division protein ZipA (zipA), FtsA (ftsA), and FtsZ (ftsZ), were selected in the present study as candidate reference genes. Their expression was detected by RT–qPCR, and their expression stabilities were evaluated using three methods using different algorithms (geNorm, NormFinder, and BestKeeper). This identification of reference genes of S. ureilytica DW2 constitutes the first reported research on reference genes of the genus Serratia and could provide a basis for the quantification of functional gene expression in this genus.
Selection of reference genes and design of primers
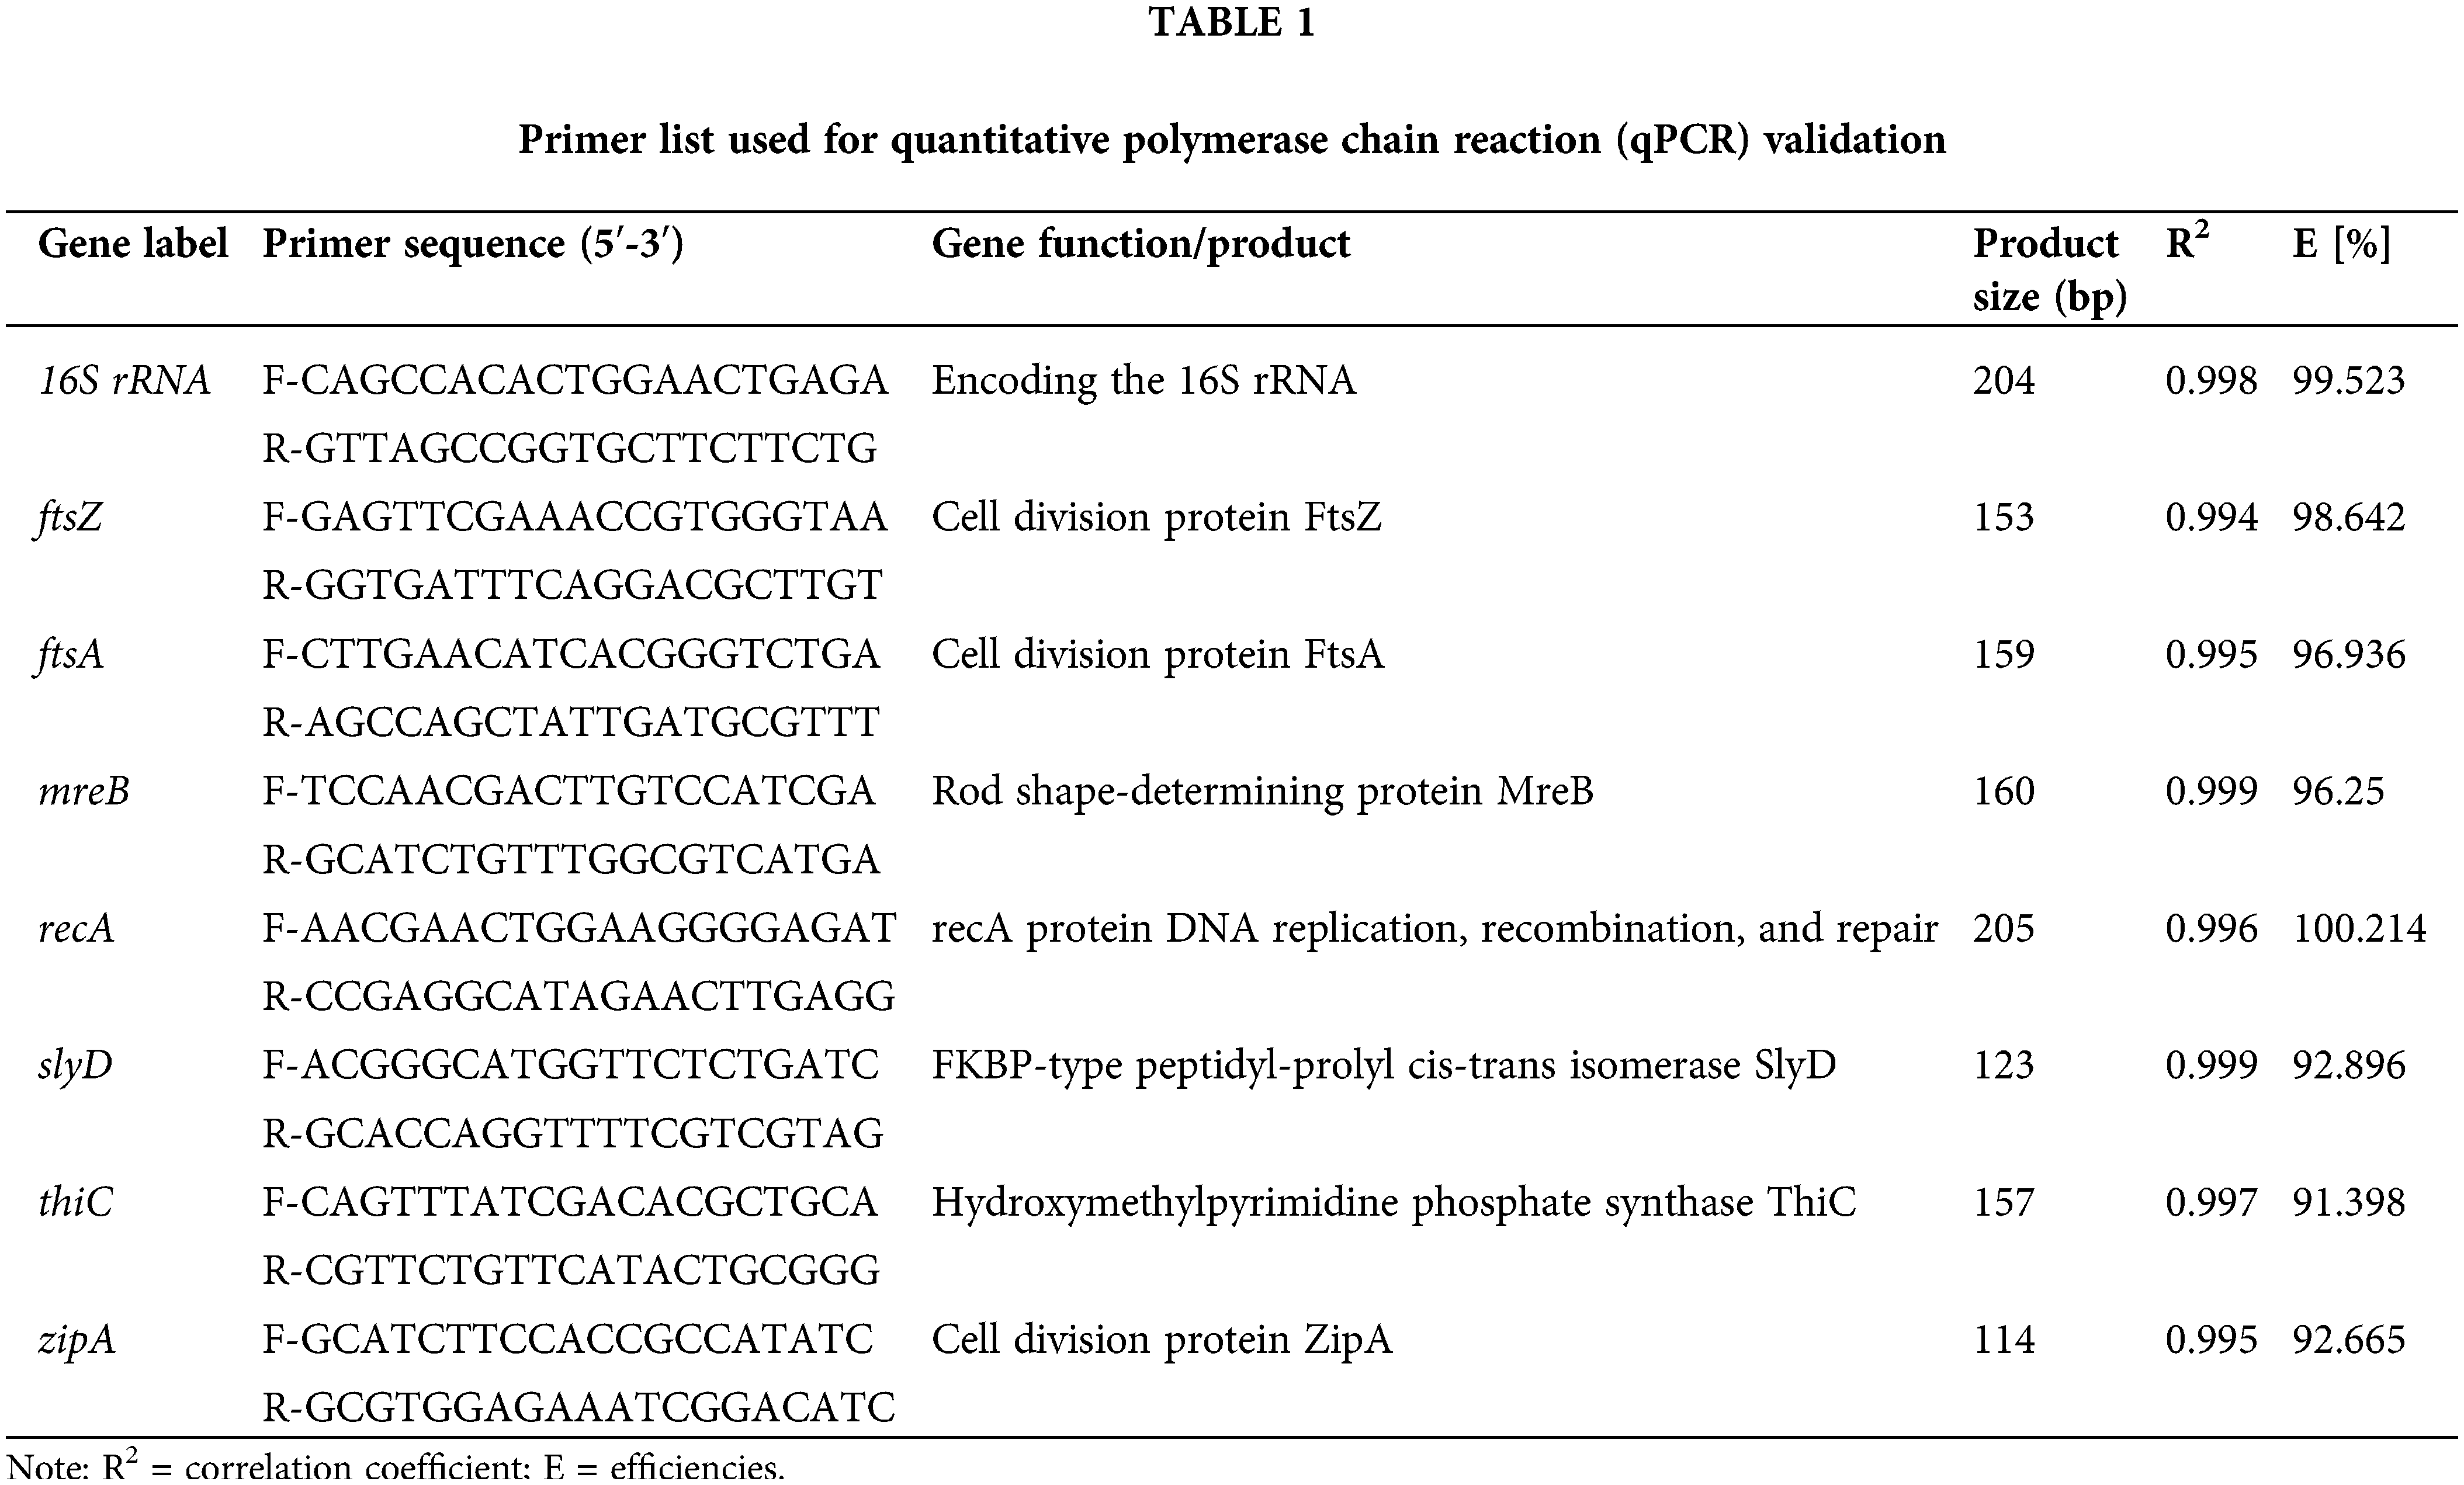
Eight genes (16S rRNA, ftsZ, ftsA, mreB, recA, slyD, thiC, and zipA) were selected for the real-time RT–qPCR-based relative expression analysis of target genes (Chang et al., 2009; Savli et al., 2003; Zhao et al., 2011). The sequences of these eight candidate reference genes were obtained from S. ureilytica DW2 genome data. Primers for the candidate reference genes were designed using Primer 3 software (Untergasser et al., 2012) and synthesized by Suzhou Jinweizhi Biotechnology Co., Ltd. (China).
Bacterial strain and culture conditions
To prepare samples for the assessment of candidate reference genes under different expression conditions. S. ureilytica DW2 was cultured in LB solid medium overnight, and single colonies were selected and activated twice at 30°C in liquid LB overnight. The cells were inoculated at 1% (volume fraction) in a triangular flask containing 200 mL of liquid LB, starting at pH 7, and cultured at 30°C for 9 h to the logarithmic metaphase. Single factor analysis was performed for grouping at different temperatures (25°C, 30°C, and 37°C), NaCl concentrations (0.5%, 1.0%, and 1.5%), pH values (5, 7, and 9), and culture times (12, 24, and 36 h). The samples were centrifuged at room temperature and 6,000 r/min for 10 min, frozen in liquid nitrogen, and stored in a refrigerator at −80°C for later use.
RNA extraction and cDNA synthesis
Two milliliters of DW2 cells were collected by centrifugation. RNA extraction was performed as follows: total RNA was extracted using TRIzol reagent (Invitrogen, USA) according to the manufacturer’s instructions. To ensure the complete removal of any contaminating DNA, all RNA preparations were subjected to a second DNase treatment using the genomic DNA (gDNA) Eraser (Perfect Real Time Kit, Takara Biochemicals, China). The RNA concentrations were quantified using a Nanodrop 2000 spectrophotometer (Thermo Fisher Scientific, USA). The OD260/OD280 and OD230/OD260 ratios were calculated to evaluate the purity of the RNA extracts. The integrity of the RNA was checked by agarose gel electrophoresis. Complementary DNA (cDNA) was synthesized using the PrimeScript RT reagent kit (Perfect Real Time Kit, Takara Biochemicals, China). Total RNA (1000 ng) was reverse transcribed using Phusion RT–PCR Kit (Finnzymes, Finland) and random primers according to the vendor’s instructions.
RT–qPCR was performed on a 7500 Fast Real Timer PCR system (ABI, USA) using an SYBR® Premix Ex Taq™ kit (Takara, China). The standard curve was measured with 10-fold serial dilutions of cDNA to determine the associated amplification efficiency (E) and nonspecific products. The PCR consisted of 10 μL of SYBR Green PCR Master Mix, 0.5 μL of each of the upstream and downstream primers, 0.2 μL of ROX (passive reference dye), and 2.0 μL of diluted cDNA template in a total volume of 20 μL. The PCR amplification process was as follows: 95°C for 5 min and 40 cycles of denaturation at 95°C for 5 s, and annealing at 60°C for 34 s. All qRT–PCR products were analyzed using three technical replicates and validated by subsequent melting curve analysis.
Analyses of reference gene expression stability
Three software programs (geNorm (Vandesompele et al., 2002), NormFinder (Andersen et al., 2004), and BestKeeper (Pfaffl et al., 2004)) were used to compare the expression stability of eight candidate reference genes under 12 treatments.
The software geNorm uses expression stability measurement values (M) to evaluate candidate reference genes. The most stable expression is indicated by the lowest M-value. The algorithm defines the stability of a gene by calculating the average paired variation based on a cutoff value of 1.54 (Pfaffl et al., 2004). If the critical value is greater than 1.5, the gene is not suitable for use as an internal reference. In the range of M values lower than 1.5, a smaller value indicates that the gene has better stability and is more suitable for use as an internal reference gene.
With NormFinder calculation, two stable internal parameters can be selected. Unlike geNorm, NormFinder considers changes in expression within and between groups. Therefore, the misinterpretation caused by gene coregulation can be avoided by this algorithm. Similar to geNorm, NormFinder analyzes candidate reference genes according to their expression stability value, and higher expression stability is associated with a lower value and vice versa (Andersen et al., 2004).
BestKeeper calculates the coefficient of variation (CV), Pearson correlation coefficient r-value, geometric mean (GM), arithmetic mean (AM), and other rich data. Suitable reference genes should meet both the normalization factor and limitations from the pairwise correlation analysis. This method compares the standard deviation of each gene, uses a standard deviation (SD) of <1 as a necessary condition, and does not consider those with values greater than 1 as suitable internal references. On this basis, the gene with the minimum CV (%Cq(Quantification cycle)) and ±Cq value was considered the most stable. BestKeeper analysis compared pairs, and the correlation coefficient (r) was calculated. An r-value closer to 1 indicates that the gene is more suitable as an internal reference.
Phosphate solubilization ability under different concentrations of soluble phosphate
The transparent circle formed by PSB bacteria on the National Botanical Research Institute phosphate (NBRIP) medium, can qualitatively represent the phosphorus-solubilizing capacity of microorganisms, which is determined by the ratio of the transparent zone diameter to the colony diameter (Zeng et al., 2016). Tricalcium phosphate (Ca3(PO4)2) was used as the only insoluble phosphate source in NBRIP solid medium. After the addition of soluble phosphate and dipotassium hydrogenphosphate (K2HPO4) at three different concentrations (0, 5.0, and 10.0 mmol L−1) and 7 days of culture, the transparent circles around colonies were observed to infer the phosphorus-solubilizing ability of DW2. Three replicates of each soluble phosphate level were analyzed.
Validation of glucose dehydrogenase (GDH) gene expression
PSB converts insoluble phosphate to soluble phosphate by producing organic acids. One of its pathways is the conversion of glucose to gluconic acid catalyzed by glucose dehydrogenase (GDH). GDH is a membrane-binding enzyme that participates in the direct oxidative pathway of glucose catabolism (Neijssel et al., 1983; Oubrie et al., 1999). In this study, the genomic sequence of S. ureilytica DW2 was analyzed and successfully cloned the gdh gene. The primer pairs gdhF (5′-TTCCGCCGTGGATCTGAAAA-3′) and gdhR (5′-GCATGCCCATTTTGAACGGTA-3′) were selected for the qRT–PCR assay. According to the average Cq value of the reference genes obtained by screening, the relative expression level of gdh at different soluble phosphate levels was calculated by the 2−ΔΔcq method (Livak & Schmittgen, 2001). Turkey tests (SPSS software) of one-way analysis of variance (ANOVA) were used to analyze the significant difference in the relative expression levels of target genes under different levels of soluble phosphate. By comparing the qRT–PCR results for the target gene and the ratio of colony diameters, the expression stability of the reference genes obtained by screening was verified.
Evaluation of experimental credibility
Information on the eight candidate reference genes is shown in Table 1. The products of the eight candidate reference genes were between 100 and 200 bp, which is consistent with the expected band size, and the bands were clear and single (Suppl. Fig. S1). Melting curve analysis showed that all the primers were specific because a single signal peak was obtained. The melting temperatures of the amplicons were in the range of 85.56°C to 90.17°C (Suppl. Fig. S2). The standard curves showed that PCR efficiencies (E [%]) ranged from 91.398% (thiC) to 100.214% (recA). The correlation coefficient (R2) results ranged from 0.994 to 0.999, indicating that the data was reliable.
Transcript levels of candidate reference genes
The expression levels of candidate genes of S. ureilytica DW2 were assessed by RT–qPCR. The expression of each candidate gene in the 12 processed samples is shown in Fig. 1. All genes were amplified prior to amplification of the PCR amplification profile. Among the eight candidate reference genes, the highest geometric mean of the Cq value was observed for thiC (32.57), and the lowest was obtained for 16S rRNA (12.37). The Ct values of 16S rRNA ranged from 10.91 to 13.66, indicating higher expression levels than those of the other seven genes. The data from the eight candidate reference genes were further analyzed.

Figure 1: Quantification cycle (Cq) values of eight candidate reference genes. Comparison of the expression stability of candidate reference genes according to normalization strategies. Three independent statistical algorithms were used to compare the expression stability.
geNorm is an effective tool for selecting stable internal parameters. This algorithm selects two targets with the same expression ratio as the most stable pair in the test samples (Liu et al., 2013). Fig. 2 shows the M values of the eight reference genes in the primary selection. The M values of seven candidate genes were <1.5, which indicates that all of the candidate genes, with the exception of thiC (M 1.54) can theoretically be used as reference genes. Overall, the least stable genes were thiC and recA. The 16S rRNA and zipA genes showed the lowest M values (0.48). Therefore, 16S rRNA and zipA were considered the two most stable reference genes according to the geNorm calculation.

Figure 2: geNorm analysis of reference genes of Serratia ureilytica DW2. The analyses were conducted with geNorm software. A low stability M value (y-axis) indicates that the gene was stably expressed under the 12 experimental conditions. Treatments with all conditions (A), different temperatures (B), NaCl concentrations (C), pH values (D), and culture times (E).
NormFinder was also used to analyze the expression stability of the reference genes. In general, a smaller S value indicates higher expression stability of the reference genes and a higher rank (Sundaram et al., 2019). According to the NormFinder analysis (Table 2), the top three genes with the lowest S values under all conditions were slyD (S = 0.106), zipA (S = 0.128), and mreB (S = 0.155). In comparison, thiC (S = 0.290) and recA (S = 0.277) had higher S values and were ranked as the least stable.
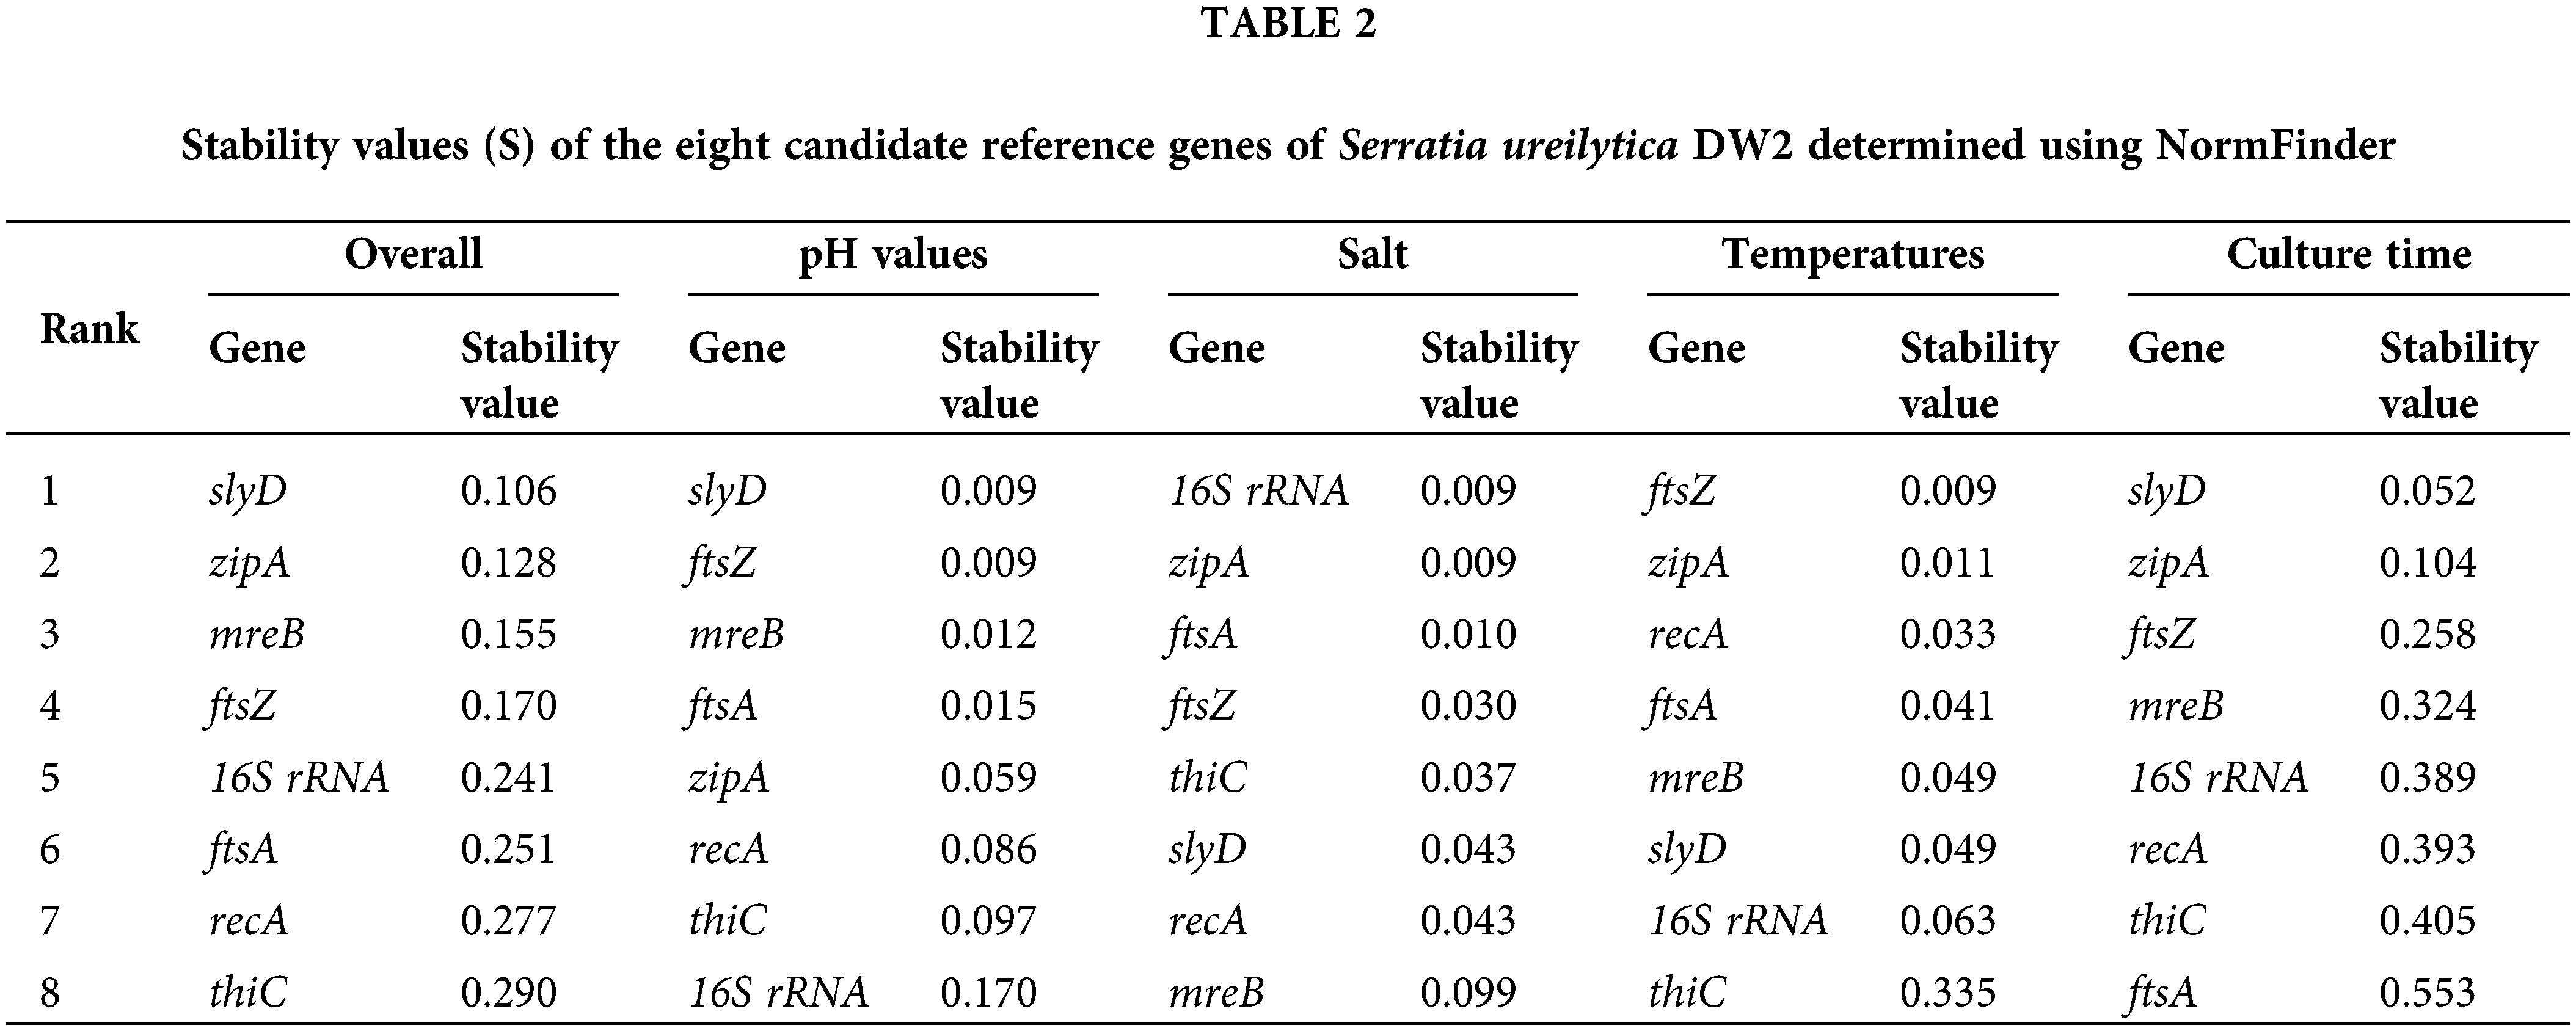
A comparing the operation results from geNorm and NormFinder under different treatment conditions (Table 2, Fig. 2) according to the geNorm algorithm indicates that 16S rRNA and zipA could be considered reference genes under the different pH values. However, NormFinder provides different recommendations and ranked 16S rRNA and zipA at positions eight and five, respectively. After salt treatment, zipA and ftsA showed the least overall variation under both algorithms. At different temperatures, ftsZ and zipA were the most stable under the two algorithms. The slyD and zipA genes exhibited the best performance at different culture times under both algorithms.
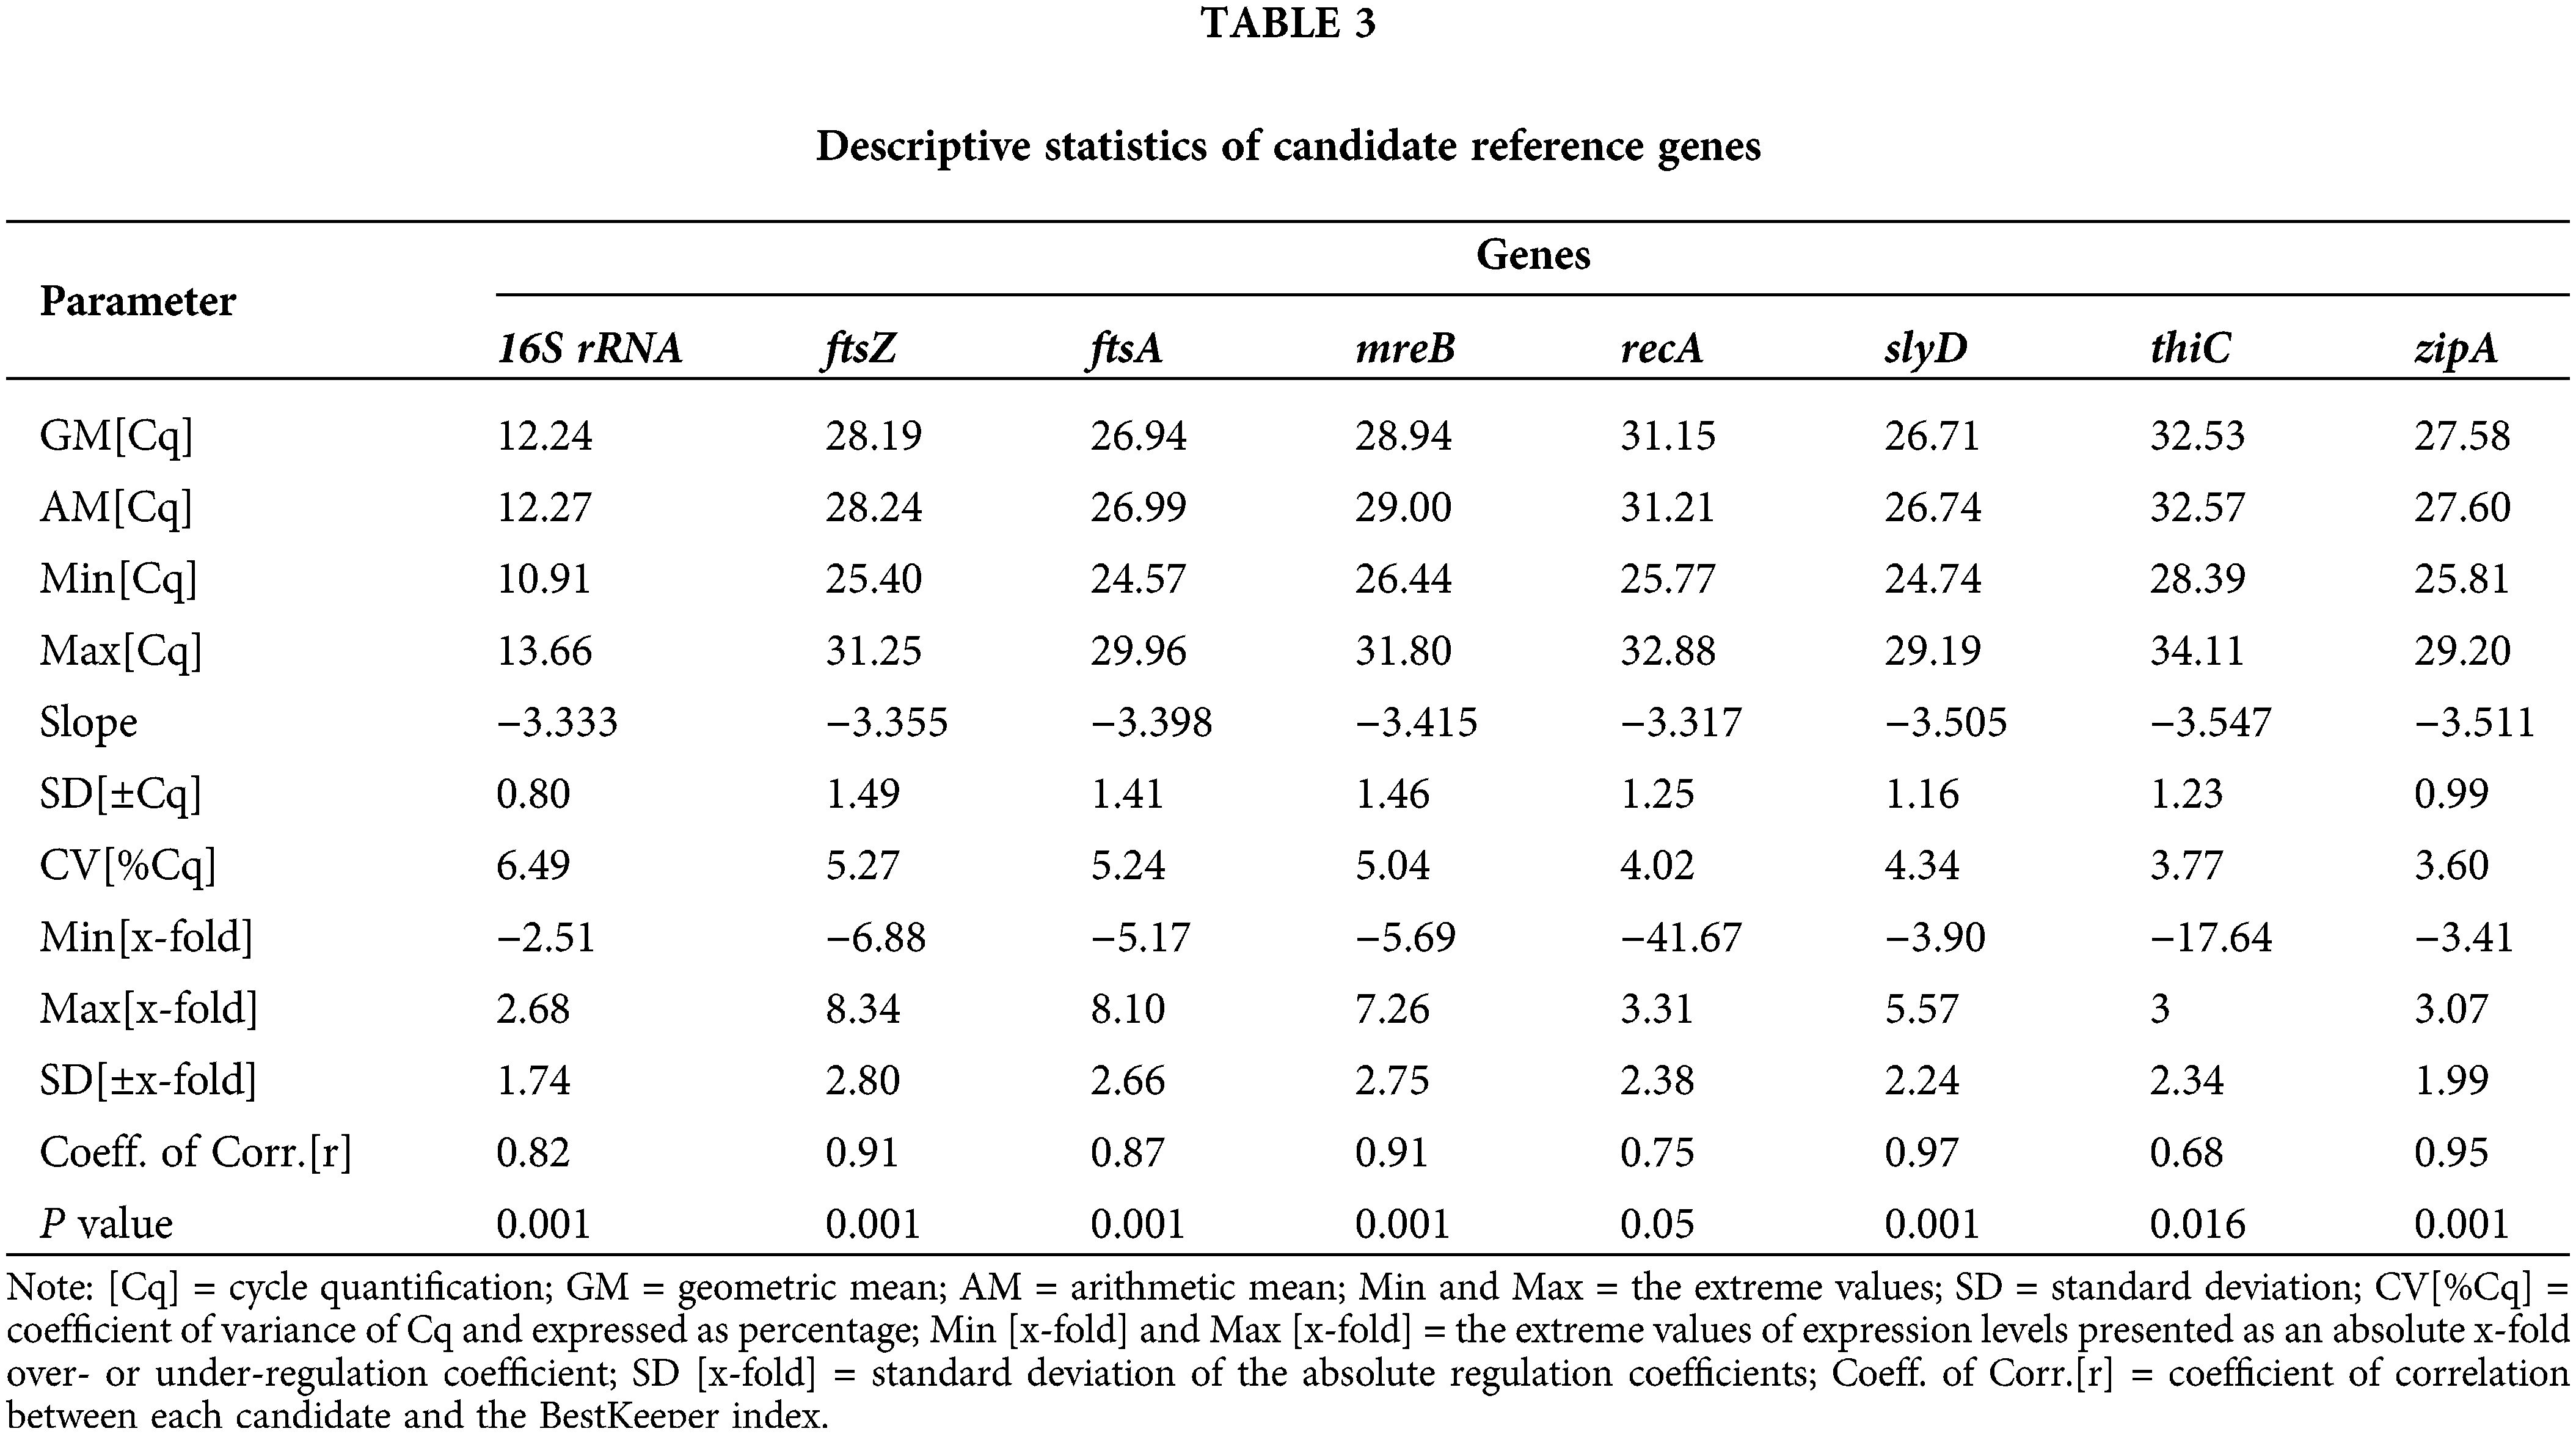
BestKeeper is a calculation method that mainly performs paired correlation and regression analyses using the selected genes (Morley, 2014). The results from the BestKeeper analysis are shown in Table 3. In general, ±Cq values for appropriate reference genes should be lower than 1. Based on this criterion, the genes 16S rRNA (0.8) and zipA (0.99) passed this screening. However, ftsZ has the highest SD [± Cq] (1.49). Moreover, the ± x-fold value should be <2 (Ritz et al., 2009), and only the 16S rRNA and zipA genes met this requirement. Among the 16S rRNA and zipA genes, the CV (%Cq) values (3.60) of zipA were lower. A comparison of the r-values of the reference genes showed that the r-value of zipA (0.95) was closer to 1. The thiC gene was the least stable, with an r-value of only 0.68. Based on the calculations using BestKeeper, zipA, and 16S rRNA were considered the two best internal reference genes.
According to the geometric mean of the ranking obtained by these three programs (Table 4), zipA and 16S rRNA had the smallest geometric mean and the highest expression stability.

Validation of gdh gene variation under different soluble phosphate levels
PSB can dissolve the inorganic phosphorus fraction into available phosphorus for plants and thereby indirectly promote plant growth (Chhetri et al., 2021). The phosphate-solubilizing activity of PSB is affected by the amount of exogenous soluble phosphate.
zipA and 16S rRNA were selected as reference genes to validate the gdh gene variation under conditions of sufficient and insufficient soluble phosphate (Fig. 3A). In the absence of soluble phosphate, the gdh gene exhibited the highest level, which was 199.21-fold higher than the gene expression under a soluble phosphate concentration of 10.0 mmol L−1. No significant difference (P < 0.01) in the gdh gene expression level was found between soluble phosphate concentrations of 5 and 10 mmol L−1.

Figure 3: Verification of gdh gene expression under different soluble phosphate levels. Relative gdh expression levels (A). Colony ratio of the transparent zone diameter to the colony diameter at different phosphate levels (B). Phosphate solubilization on NBRIP plates with different concentrations of soluble phosphate: 0 mmol L−1 (C), 5.0 mmol L−1 (D), and 10.0 mmol L−1 (E).
The phosphate solubilization results on the NBRIP plate are shown in Figs. 3B–3E. The phosphate-solubilizing ability was determined by the ratio of the transparent zone diameter to the colony diameter. At a soluble phosphate concentration of 0 mmol L−1, the average diameter of the transparent zone was 2.637-fold greater than the colony diameter. Compared with the level under soluble phosphate concentrations of 0 and 5 mmol L−1, the ratio of the transparent zone diameter to the colony diameter showed a significant decrease (P < 0.01). The ratio decreased with increases in the soluble phosphate concentration. No transparent zone was observed with a soluble phosphate concentration of 10.0 mmol L−1.
At present, RT–qPCR is used for almost all organisms, such as bacteria (Pistón et al., 2004; Ritz et al., 2009), viruses (Doshi et al., 2007; Liu et al., 2013), animals (Chen et al., 2021) and humans (Guo et al., 2010), and is one of the most widely used methods for gene expression analysis. An increasing number of studies have confirmed that the expression of even the commonly used housekeeping genes may vary among different species, different growing stages, and different experimental conditions (Doshi et al., 2007; Guo et al., 2010; Heng et al., 2011; Bin et al., 2012; Chen et al., 2017; Pombo et al., 2017; Chen et al., 2021). This finding suggests that reference genes should be selected according to species and experimental conditions. Reference genes for the genus Serratia have not been reported to date; therefore, confirming that the internal reference genes of this genus are of great significance.
S. ureilytica is a newly discovered species that was first isolated from the Torsa River in West Bengal, India, in 2005 by Bhadra et al., (2005). S. ureilytica DW2 was recently isolated from the rhizosphere soil of C. pilosula. S. ureilytica DW2 shows strong phosphorolytic properties and other plant growth-promoting properties, which means that strain DW2 has the potential to be used as a biofertilizer in C. pilosula cultivation. An analysis of phosphate-solubilizing mechanisms of C. pilosula based on whole-genome sequencing data revealed that there were no related reference genes for this species, which would limit the quantification of target gene expression under different conditions. The 16S rRNA gene is a common housekeeping gene used to verify the expression of functional genes (Conte et al., 2006; Schwartz et al., 2006), but the Cq level of 16S rRNA may rely on the nutritional environment of the cell (Condon et al., 1995). Furthermore, the expression levels of the target genes in cells were relatively low, but the 16S rRNA content was relatively high, resulting in large differences between the expression levels of 16S rRNA and target genes in the RT–qPCR experiment (Desroche et al., 2005). Therefore, it was necessary to screen more internal reference genes of S. ureilytica DW2.
In the present study, 12 candidate reference genes (16S rRNA, ftsZ, ftsA, mreB, recA, slyD, thiC, zipA, trpR, rpoD, secA, and pyrI) were selected and cloned for investigation based on previous reports (Galisa et al., 2012; Wu et al., 2017; Bai et al., 2020). Four genes, trpR, rpoD, pyrI, and secA, were not selected as candidate genes for internal reference due to poor standard curve data and low transcript abundance. However, according to the results of a study conducted by Bai, rpoD is a stable internal reference gene of Pseudomonas brassicacearum GS20 (Bai et al., 2020). Therefore, it could be inferred that the internal reference genes exhibit specificity (Hoang et al., 2017).
Eight genes were ultimately selected for screening and operation under different conditions. Under different conditions, the most unstable genes were uniformly identified as thiC and recA by geNorm and NormFinder, which was in accordance with the findings from previous studies (Artico et al., 2010; Wan et al., 2010).
The most stable genes in this experiment were found to be consistent across all treatment conditions. GeNorm software can screen any number of reference genes in any sample and select appropriate reference genes through analysis. NormFinder software can not only compare the expression differences of reference genes but also calculate the variation between groups and finally screen out an appropriate reference gene. The top three genes, according to geNorm, were zipA, 16S rRNA, and slyD, and the top three genes identified by NormFinder were slyD, zipA, and mreB. BestKeeper could screen only two stable reference genes that met its screening conditions: zipA and 16S rRNA. Therefore, geometric average values were used to rank these candidate reference genes, and zipA and 16S rRNA were selected as the most suitable reference genes for strain DW2.
After confirming the reliability of the reference genes, the gdh gene was found to be related to the phosphate-solubilizing ability of strain DW2. The zipA and 16S rRNA genes were then used to validate gdh expression under three soluble phosphate concentrations. The expression of gdh was upregulated under 0 mmol−1 soluble phosphate, which could enhance the ability of DW2 to produce gluconic acid and thus result in the transformation of insoluble phosphate into soluble phosphate. The expression of gdh decreased with an increase in the soluble phosphorus concentration. When the soluble phosphate content reached 5 and 10 mmol−1, gdh expression was significantly decreased (P < 0.01). This result was consistent with the data obtained from the NBRIP plate, which showed that the largest transparent zone diameters were produced with a soluble phosphate content of 0 mm. Therefore, the expression of gdh was objectively quantified by zipA and 16S rRNA, and these two genes could be used as reference genes of S. ureilytica DW2. This study is the first to identify reference genes of S. ureilytica DW2 and confirms their reliability. This study may provide a reference for studies on other strains in the genus Serratia and serve as a basis for research on phosphate solubilization by S. ureilytica DW2.
Acknowledgement: Yuhe Fan, Pengfei Zhang, and Heng Xue helped conduct the S. ureilytica DW2 culture experiment, and we thank them very much for their hard work.
Availability of Data and Materials: All data generated or analyzed during this study are included in this published article (and its supplementary information files).
Author Contribution: Study conception and design: Fenglin Bai, Jiahong Ren, Guiping Zhang; Data collection: Fenglin BAI; Analysis and interpretation of results: Fenglin BAI, Bianxia BAI, Tingting JIN; Draft manuscript preparation: Fenglin BAI, Bianxia BAI. All authors reviewed the results and approved the final version of the manuscript.
Ethics Approval: Not applicable.
Funding Statement: This work was supported by the General Program of Natural Science Foundation of China (32071770), the Fundamental Research Program of Shanxi Province (Award No. 202103021223380), and the Fund for Shanxi “1331 Project” Key Subjects Construction (1331KSC).
Conflicts of Interest: The authors declare that they have no conflicts of interest to report regarding the present study.
References
Andersen CL, Jensen JL, Orntoft TF (2004). Normalization of real-time quantitative reverse transcription-PCR data: A model-based variance estimation approach to identify genes suited for normalization, applied to bladder and colon cancer data sets. Cancer Research 64: 5245–5250. DOI 10.1158/0008-5472.CAN-04-0496. [Google Scholar] [CrossRef]
Artico S, Nardeli SM, Brilhante O, Grossi-de-Sa MF, Alves-Ferreira M (2010). Identification and evaluation of new reference genes in Gossypium hirsutum for accurate normalization of real-time quantitative RT-PCR data. BMC Plant Biology 10: 49. DOI 10.1186/1471-2229-10-49. [Google Scholar] [CrossRef]
Bai B, Ren J, Bai F, Hao L (2020). Selection and validation of reference genes for gene expression studies in Pseudomonasbrassicacearum GS20 using real-time quantitative reverse transcription PCR. PLoS One 15: e0227927. DOI 10.1371/journal.pone.0227927. [Google Scholar] [CrossRef]
Bhadra B, Roy P, Chakraborty R (2005). Serratia ureilytica sp. nov., a novel urea-utilizing species. International Journal of Systematic and Evolutionary Microbiology 55: 2155–2158. DOI 10.1099/ijs.0.63674-0. [Google Scholar] [CrossRef]
Bin WS, Wei LK, Ping DW, Li Z, Wei G, Bing LJ, Gui PB, Jian WH, Feng CJ (2012). Evaluation of appropriate reference genes for gene expression studies in pepper by quantitative real-time PCR. Molecular Breeding 30: 1393–1400. DOI 10.1007/s11032-012-9726-7. [Google Scholar] [CrossRef]
Bustin SA, Benes V, Nolan T, Pfaffl MW (2005). Quantitative real-time RT-PCR—A perspective. Journal of Molecular Endocrinology 34: 597–601. DOI 10.1677/jme.1.01755. [Google Scholar] [CrossRef]
Chang Q, Amemiya T, Liu J, Xu X, Rajendran N, Itoh K (2009). Identification and validation of suitable reference genes for quantitative expression of xylA and xylE genes in Pseudomonas putida mt-2. Journal of Bioscience and Bioengineering 107: 210–214. DOI 10.1016/j.jbiosc.2008.09.017. [Google Scholar] [CrossRef]
Chen X, Sun Y, Zhang P, Li J, Li H, Wei C, Cao Z, Zhou Y (2021). Screening of stable internal reference genes by quantitative real-time PCR in humpback grouper Cromileptes altivelis. Journal of Oceanology and Limnology 39: 1985–1999. DOI 10.1007/s00343-020-0238-8. [Google Scholar] [CrossRef]
Chen XJ, Zhang XQ, Huang S, Cao ZJ, Qin QW, Hu WT, Sun Y, Zhou YC (2017). Selection of reference genes for quantitative real-time RT-PCR on gene expression in Golden Pompano (Trachinotus ovatus). Polish Journal of Veterinary Sciences 20: 583–594. DOI 10.1515/pjvs-2017-0071. [Google Scholar] [CrossRef]
Chhetri G, Kang M, Kim J, Kim I, So Y, Seo T (2021). Fuscibacter oryzae gen. nov., sp. nov., a phosphate-solubilizing bacterium isolated from the rhizosphere of rice plant. Antonie van Leeuwenhoek 114: 1453–1463. DOI 10.1007/s10482-021-01619-2. [Google Scholar] [CrossRef]
Condon C, Squires C, Squires CL (1995). Control of rRNA transcription in Escherichia coli. Microbiological Reviews 59: 623–645. DOI 10.1128/mr.59.4.623-645.1995. [Google Scholar] [CrossRef]
Conte E, Catara V, Greco S, Russo M, Alicata R, Strano L, Lombardo A, Di Silvestro S, Catara A (2006). Regulation of polyhydroxyalkanoate synthases (phaC1 and phaC2) gene expression in Pseudomonas corrugata. Applied Microbiology and Biotechnology 72: 1054–1062. DOI 10.1007/s00253-006-0373-y. [Google Scholar] [CrossRef]
Desroche N, Beltramo C, Guzzo J (2005). Determination of an internal control to apply reverse transcription quantitative PCR to study stress response in the lactic acid bacterium Oenococcus oeni. Journal of Microbiological Methods 60: 325–333. DOI 10.1016/j.mimet.2004.10.010. [Google Scholar] [CrossRef]
Doshi KM, Eudes F, Laroche A, Gaudet D (2007). Anthocyanin expression in marker free transgenic wheat and triticale embryos. In Vitro Cellular & Developmental Biology-Plant 43: 429–435. DOI 10.1007/s11627-007-9089-7. [Google Scholar] [CrossRef]
Galisa PS, da Silva HAP, Macedo AVM, Reis VM, Vidal MS, Baldani JI, Simões-Araújo JL (2012). Identification and validation of reference genes to study the gene expression in Gluconacetobacter diazotrophicus grown in different carbon sources using RT-qPCR. Journal of Microbiological Methods 91: 1–7. DOI 10.1016/j.mimet.2012.07.005. [Google Scholar] [CrossRef]
Ginzinger DG (2002). Gene quantification using real-time quantitative PCR: An emerging technology hits the mainstream. Experimental Hematology 30: 503–512. DOI 10.1016/S0301-472X(02)00806-8. [Google Scholar] [CrossRef]
Guo Y, Chen JX, Yang S, Fu XP, Zhang Z, Chen KH, Huang Y, Li Y, Xie Y, Mao YM (2010). Selection of reliable reference genes for gene expression study in nasopharyngeal carcinoma. Acta Pharmacologica Sinica 31: 1487–1494. DOI 10.1038/aps.2010.115. [Google Scholar] [CrossRef]
Heng SSJ, Chan OYW, Keng BMH, Ling MHT (2011). Glucan biosynthesis protein G is a suitable reference gene in Escherichia coli K-12. ISRN Microbiology 2011: 469053. DOI 10.5402/2011/469053. [Google Scholar] [CrossRef]
Hoang VLT, Tom LN, Quek XC, Tan JM, Payne EJ et al. (2017). RNA-seq reveals more consistent reference genes for gene expression studies in human non-melanoma skin cancers. PeerJ 5: e3631. DOI 10.7717/peerj.3631. [Google Scholar] [CrossRef]
Hong SY, Seo PJ, Yang MS, Xiang F, Park CM (2008). Exploring valid reference genes for gene expression studies in Brachypodium distachyon by real-time PCR. BMC Plant Biology 8: 112. DOI 10.1186/1471-2229-8-112. [Google Scholar] [CrossRef]
Huggett J, Dheda K, Bustin S, Zumla A (2005). Real-time RT-PCR normalisation; strategies and considerations. Genes & Immunity 6: 279–284. DOI 10.1038/sj.gene.6364190. [Google Scholar] [CrossRef]
Liu J, Tan Y, Yang X, Chen X, Li F (2013). Evaluation of Clostridium ljungdahlii DSM 13528 reference genes in gene expression studies by qRT-PCR. Journal of Bioscience and Bioengineering 116: 460–464. DOI 10.1016/j.jbiosc.2013.04.011. [Google Scholar] [CrossRef]
Livak KJ, Schmittgen TD (2001). Analysis of relative gene expression data using real-time quantitative PCR and the 2−ΔΔCT method. Methods 25: 402–408. DOI 10.1006/meth.2001.1262. [Google Scholar] [CrossRef]
Luan F, Ji Y, Peng L, Liu Q, Cao H, Yang Y, He X, Zeng N (2021). Extraction, purification, structural characteristics and biological properties of the polysaccharides from Codonopsis pilosula: A review. Carbohydrate Polymers 261: 117863. DOI 10.1016/j.carbpol.2021.117863. [Google Scholar] [CrossRef]
Meng Y, Xu YJ, Chang C, Qiu ZP, Hu JJ, Wu Y, Zhang BH, Zheng GH (2020). Extraction, characterization and anti-inflammatory activities of an inulin-type fructan from Codonopsis pilosula. International Journal of Biological Macromolecules 163: 1677–1686. DOI 10.1016/j.ijbiomac.2020.09.117. [Google Scholar] [CrossRef]
Morley AA (2014). Digital PCR: A brief history. Biomolecular Detection and Quantification 1: 1–2. DOI 10.1016/j.bdq.2014.06.001. [Google Scholar] [CrossRef]
Neijssel OM, Tempest DW, Postma PW, Duine JA, Jzn JF (1983). Glucose metabolism by K+-limitedKlebsiella aerogenes: Evidence for the involvement of a quinoprotein glucose dehydrogenase. FEMS Microbiology Letters 20: 35–39. DOI 10.1111/fml.1983.20. [Google Scholar] [CrossRef]
Oubrie A, Rozeboom HJ, Kalk KH, Olsthoorn AJ, Duine JA, Dijkstra BW (1999). Structure and mechanism of soluble quinoprotein glucose dehydrogenase. EMBO Journal 18: 5187–5194. DOI 10.1093/emboj/18.19.5187. [Google Scholar] [CrossRef]
Pfaffl MW, Tichopad A, Prgomet C, Neuvians TP (2004). Determination of stable housekeeping genes, differentially regulated target genes and sample integrity: BestKeeper–excel-based tool using pair-wise correlations. Biotechnology Letters 26: 509–515. DOI 10.1023/B:BILE.0000019559.84305.47. [Google Scholar] [CrossRef]
Pistón F, Dorado G, Martín A, Barro F (2004). Cloning and characterization of a gamma-3 hordein mRNA (cDNA) from Hordeum chilense (Roem. et Schult.). Theoretical and Applied Genetics 108: 1359–1365. DOI 10.1007/s00122-003-1548-x. [Google Scholar] [CrossRef]
Pombo MA, Zheng Y, Fei Z, Martin GB, Rosli HG (2017). Use of RNA-seq data to identify and validate RT-qPCR reference genes for studying the tomato-Pseudomonas pathosystem. Scientific Reports 7: 44905. DOI 10.1038/srep44905. [Google Scholar] [CrossRef]
Ritz M, Garenaux A, Berge M, Federighi M (2009). Determination of rpoA as the most suitable internal control to study stress response in C. jejuni by RT-qPCR and application to oxidative stress. Journal of Microbiological Methods 76: 196–200. DOI 10.1016/j.mimet.2008.10.014. [Google Scholar] [CrossRef]
Rivera L, López-Patiño MA, Milton DL, Nieto TP, Farto R (2015). Effective qPCR methodology to quantify the expression of virulence genes in Aeromonas salmonicida subsp. salmonicida. Journal of Applied Microbiology 118: 792–802. DOI 10.1111/jam.12740. [Google Scholar] [CrossRef]
Rocha DJP, Santos CS, Pacheco LGC (2015). Bacterial reference genes for gene expression studies by RT-qPCR: Survey and analysis. Antonie van Leeuwenhoek 108: 685–693. DOI 10.1007/s10482-015-0524-1. [Google Scholar] [CrossRef]
Savli H, Karadenizli A, Kolayli F, Gundes S, Ozbek U, Vahaboglu H (2003). Expression stability of six housekeeping genes: A proposal for resistance gene quantification studies of Pseudomonas aeruginosa by real-time quantitative RT-PCR. Journal of Medical Microbiology 52: 403–408. DOI 10.1099/jmm.0.05132-0. [Google Scholar] [CrossRef]
Schwartz T, Walter S, Marten SM, Kirschhöfer F, Nusser M, Obst U (2006). Use of quantitative real-time RT-PCR to analyse the expression of some quorum-sensing regulated genes in Pseudomonas aeruginosa. Analytical and Bioanalytical Chemistry 387: 513–521. DOI 10.1007/s00216-006-0909-0. [Google Scholar] [CrossRef]
Shen GM, Jiang HB, Wang XN, Wang JJ (2010). Evaluation of endogenous references for gene expression profiling in different tissues of the oriental fruit fly Bactrocera dorsalis (Diptera: Tephritidae). BMC Molecular Biology 11: 76. DOI 10.1186/1471-2199-11-76. [Google Scholar] [CrossRef]
Sundaram VK, Sampathkumar NK, Massaad C, Grenier J (2019). Optimal use of statistical methods to validate reference gene stability in longitudinal studies. PLoS One 14: e0219440. DOI 10.1371/journal.pone.0219440. [Google Scholar] [CrossRef]
Suzuki T, Higgins PJ, Crawford DR (2000). Control selection for RNA quantitation. BioTechniques 29: 332–337. DOI 10.2144/00292rv02. [Google Scholar] [CrossRef]
Thellin O, Zorzi W, Lakaye B, De Borman B, Coumans B, Hennen G, Grisar T, Igout A, Heinen E (1999). Housekeeping genes as internal standards: Use and limits. Journal of Biotechnology 75: 291–295. DOI 10.1016/S0168-1656(99)00163-7. [Google Scholar] [CrossRef]
Tunbridge EM, Eastwood SL, Harrison PJ (2011). Changed relative to what? Housekeeping genes and normalization strategies in human brain gene expression studies. Biological Psychiatry 69: 173–179. DOI 10.1016/j.biopsych.2010.05.023. [Google Scholar] [CrossRef]
Untergasser A, Cutcutache I, Koressaar T, Ye J, Faircloth BC, Remm M, Rozen SG (2012). Primer3-new capabilities and interfaces. Nucleic Acids Research 40: e115–e127. DOI 10.1093/nar/gks596. [Google Scholar] [CrossRef]
Vandesompele J, de Preter K, Pattyn F, Poppe B, van Roy N, de Paepe A, Speleman F (2002). Accurate normalization of real-time quantitative RT-PCR data by geometric averaging of multiple internal control genes. Genome Biology 3: research0034.0031. DOI 10.1186/gb-2002-3-7-research0034. [Google Scholar] [CrossRef]
VanGuilder HD, Vrana KE, Freeman WM (2008). Twenty-five years of quantitative PCR for gene expression analysis. BioTechniques 44: 619–626. DOI 10.2144/000112776. [Google Scholar] [CrossRef]
Wan H, Zhao Z, Qian C, Sui Y, Malik AA, Chen J (2010). Selection of appropriate reference genes for gene expression studies by quantitative real-time polymerase chain reaction in cucumber. Analytical Biochemistry 399: 257–261. DOI 10.1016/j.ab.2009.12.008. [Google Scholar] [CrossRef]
Wu BY, Ye JR, Huang L, He LM, Li DW (2017). Validation of reference genes for RT-qPCR analysis in Burkholderia pyrrocinia JK-SH007. Journal of Microbiological Methods 132: 95–98. DOI 10.1016/j.mimet.2016.10.004. [Google Scholar] [CrossRef]
Zeng Q, Wu X, Wen X (2016). Effects of soluble phosphate on phosphate-solubilizing characteristics and expression of gcd Gene in Pseudomonas frederiksbergensis JW-SD2. Current Microbiology 72: 198–206. DOI 10.1007/s00284-015-0938-z. [Google Scholar] [CrossRef]
Zhao W, Li Y, Gao P, Sun Z, Sun T, Zhang H (2011). Validation of reference genes for real-time quantitative PCR studies in gene expression levels of Lactobacillus casei Zhang. Journal of Industrial Microbiology and Biotechnology 38: 1279–1286. DOI 10.1007/s10295-010-0906-3. [Google Scholar] [CrossRef]

SUPPLEMENTARY FIGURE S1: Agarose gel electrophoresis of polymerase chain reaction products from candidate reference genes.

SUPPLEMENTARY FIGURE S2: Melting curve analysis of primer specificity for the amplification of genes of Serratia ureilytica DW2. (A) 16S rRNA (Tm = 87.20°C); (B) ftsZ (Tm = 87.09°C); (C) ftsA (Tm = 85.56°C) (D) mreB (Tm = 87.19°C); (E) recA (Tm = 90.17°C); (F) slyD (Tm = 88.09°C); (G) thiC (Tm = 89.73°C); (H) zipA (Tm = 88.59°C).
Cite This Article
 Copyright © 2023 The Author(s). Published by Tech Science Press.
This work is licensed under a Creative Commons Attribution 4.0 International License , which permits unrestricted use, distribution, and reproduction in any medium, provided the original work is properly cited.
 Downloads
 Citation Tools