
 Submit a Paper
 Propose a Special lssue
 Open Access
ARTICLE

SPP1 and the risk score model to improve the survival prediction of patients with hepatocellular carcinoma based on multiple algorithms and back propagation neural networks
1 Nursing Department, Renmin Hospital of Wuhan University, Wuhan, 430060, China
2 Oncology Department, Renmin Hospital of Wuhan University, Wuhan, 430060, China
3 Department of Engineering Structure and Mechanics, School of Science, Wuhan University of Technology, Wuhan, 430070, China
* Corresponding Author: Qingjia Chi,
(This article belongs to the Special Issue: Bioinformatics Study of Diseases)
BIOCELL 2023, 47(3), 581-592. https://doi.org/10.32604/biocell.2023.025957
Received 08 August 2022; Accepted 04 November 2022; Issue published 03 January 2023
 View Full Text
 Download PDF
Abstract
Hepatocellular carcinoma (HCC) is associated with poor prognosis and fluctuations in immune status. Although studies have found that secreted phosphoprotein 1 (SPP1) is involved in HCC progression, its independent prognostic value and immune-mediated role remain unclear. Using The Cancer Genome Atlas and Gene Expression Omnibus data, we found that low expression of SPP1 is significantly associated with improved survival of HCC patients and that SPP1 expression is correlated with clinical characteristics. Univariate and multivariate Cox regression confirmed that SPP1 is an independent prognostic factor of HCC. Subsequently, we found that T cell CD4 memory-activated monocytes, M0 macrophages, and resting mast cells showed significant differences in penetration in the high and low SPP1 expression groups. Next, we used the Weighted Gene Co-Expression Network and Least Absolute Shrinkage Sum Selection Operator algorithms to construct a risk score for the 9-immune-related genes signature. The risk score showed a good ability to identify high and low-risk patients and improved survival prediction. We also used multivariate Cox regression to validate that risk score was significantly correlated with SPP1 and overall survival. Lastly, the Back-Propagation Neural Network confirmed the reliability of the results of multiple algorithms. In conclusion, the findings suggest that SPP1 is an independent marker of HCC survival and immunotherapy.Keywords
Hepatocellular carcinoma (HCC) ranks among the top malignant tumors in terms of both morbidity and mortality (Armstrong and He, 2020), and the five-year survival rate of patients at various stages of HCC is less than 10% (Siegel et al., 2020). Surgical resection and orthotopic liver transplantation are the most effective treatments for early HCC. However, due to the insidious onset of HCC, it is typically at an advanced stage when discovered, which poses a challenge to surgical treatment (Ogasawara et al., 2019). In the past 10 years, anti-angiogenesis-targeted drugs (e.g., sorafenib, lenvatinib) have brought hope to patients with advanced HCC (Rimassa et al., 2019). However, due to high relapse and drug resistance, the prognostic resistance of HCC patients remains poor (Sim and Knox, 2018). Therefore, developing new treatments is essential for prolonging the survival of HCC patients.
Recent research on various tumor immune escape mechanisms has enabled immunotherapy to suppress the development of malignant tumors (Eggermont et al., 2016). The liver is a well-known immune tolerance organ, and its immunosuppressive microenvironment promotes the immune escape of HCC cells (Huang et al., 2018). For example, high expression of cytotoxic T lymphocyte-associated antigen 4 (CTLA-4) in patients with HCC may promote tumor immune escape (Yin and Li, 2020). Thus, an immunotherapy that activates tumor-specific immune responses to achieve anti-tumor effects has become a new treatment direction for HCC. Among immunotherapies, the well-studied programmed cell death protein 1 (PD-1) and PD ligand-1 (PD-L1) immunosuppressants have been successfully used to treat advanced HCC (Obeid et al., 2018). While immunotherapy does significantly prolong survival time for HCC patients (Ma et al., 2019), it still has two important limitations: (1) no established markers for predicting efficacy and (2) most patients still have disease progression after 7 to 8 months of treatment, and the selection of subsequent treatment options is a challenge. Therefore, determining reliable immune markers is key to improving the prognosis of HCC patients.
The gene that encodes secreted phosphoprotein 1 (SPP1), also known as osteopontin (osteopontin), is located on human chromosome 4q22.1 (Singh et al., 2018). It is secreted by various cells, including osteoclasts and T cells (Anborgh et al., 2010). SPP1 is an extracellular matrix protein closely associated with tumor invasion, metastasis, apoptosis inhibition, and angiogenesis. Many tumors express high levels of SPP1. Patients with HCC are known to have significantly increased serum HCC levels which are related to the clinical stage of the tumor (Song et al., 2020). In recent studies, SPP1 was the only common gene reported in the four-gene models (CENPA, SPP1, MAGEB6, HOXD9; KPNA2, CDC20, SPP1, TOP2A) that predicted the prognosis of HCC (Chen et al., 2019c; Long et al., 2018). In addition, SPP1-mediated blocking of CSF1/CSF1R can prevent TAM transport, thereby enhancing the efficacy of PD-L1 in treating HCC (Zhu et al., 2019). Studies have reported the prognostic value of SPP1 in other cancers (Chen et al., 2019a; Li et al., 2018) and its role in the pathogenesis of HCC (Nardo et al., 2020; Wang et al., 2019). However, to date, the immune function of SPP1 in the prognosis of HCC has not yet been explored. An in-depth exploration of the immune characteristics driven by SPP1 may thus guide improvement in HCC treatment and survival.
In our previous studies, we identified various biomarkers and potential therapeutic targets that modulate inflammation using experimental and bioinformatics methods. This approach relies on literature searches (PubMed) and online software (Gene Expression Profiling Interactive Analysis, GEPIA2, and Encyclopedia of RNA Interactomes) to determine the SPP1 gene for research. In the present study, we applied the ESTIMATE and Cell-type Identification by Estimating Relative Subsets of RNA Transcripts (CIBERSORT) algorithms to evaluate the immune characteristics of different expression groups of SPP1. The weighted gene co-expression network analysis (WGCNA) algorithm constructs a co-expression network of differentially expressed genes (DEGs) based on SPP1 to define immune-related genes (IRGs). Subsequently, univariate Cox regression and the LASSO algorithm were used to describe risk characteristics. We also used multivariate Cox analysis to determine candidate features for constructing an artificial neural network (ANN). Lastly, we further verified the results of e multiple algorithms based on the back propagation neural network (BPNN) model.
Patient information collection
HCCseq-Counts and clinical information were downloaded from the Cancer Genome Atlas (TCGA) database (https://cancergenome.nih.gov/; July 2020). After excluding patients with no or time <0 information, we retained 365 HCC and 50 normal samples. At the same time, GSE14520 was retrieved from Gene Expression Omnibus (GEO) (https://www.ncbi.nlm.nih.gov/geo) as an external verification data set. We have retained 242 HCC and 241 normal samples by integrating GPL3921 and GPL571. All expression values undergo log2 conversion.
Identification of immune cells
The ESTIMATE algorithm can evaluate the immune abundance and tumor purity of the tumor microenvironment. The CIBERSORT conversion method uses the CIBERSORT function to perform statistical analysis on the transcriptome sequencing expression profile of complex tissues (such as large solid tumors). It uses the anti-stacking method to remove the unknown mixture content to estimate the relative proportion of 22 immune cell subpopulations. In this study, we used the CIBERSORT analysis tool (https://cibersort.stanford.edu) to calculate the composition of 22 immune cells in HCC tissue. First, the HCC expression profile data was compiled using standard annotation files and uploaded to the CIBERSORT website. Subsequently, we used the white blood cell characteristic matrix (LM22) to run 1,000 times to predict the scores of 22 immune cells. Finally, Wilcoxon was used to test the differences in immune cell infiltration between different groups (p < 0.05).
Weighted gene co-expression network analysis
For DEGs screening and WGCNA analysis, we first used the Limma package to screen DEGs (SPP1 high expression group vs. low expression progenitor) with |log 2FC| ≥1 and false discovery rate <0.05 as the threshold. Subsequently, the expression profile of DEGs was selected to construct the co-expression network. Then, we used average-linkage to cluster the DEGs and calculate the eigengenes of each module in turn. Finally, the mergeCutHeight was set at 0.25, and minModuleSize was set at 30 to calculate the correlation between the feature vector of the module and the immune traits. The module with a correlation coefficient >0.5 was selected as the module significantly related to the immune status. The specific steps of the algorithm are as follows: The similarity between genes was calculated using the Pearson correlation coefficient, and then the correlation matrix was constructed.
A β value that conforms to the law of a scale-free network was set with R^2 = 0.85, and the adjacency matrix A was constructed.
Subsequently, the adjacency matrix was converted into a topological overlap matrix TOM.
Finally, hierarchical clustering of the representative genes in all modules-feature vector genes (ME) was performed to construct module membership (MM).
COX regression and LASSO analysis
Univariate COX regression was used to initially screen candidate genes closely related to patient survival (p < 0.05). Subsequently, the candidate genes were input into LASSO COX to construct a risk model. The LASSO model uses an L1-norm penalty mechanism to avoid over-fitting algorithms, which can be expressed as a constraint on the target vector.
Subsequently, the model gene signature combination establishes a risk score (RS) to determine the risk characteristics of the patient. Among them, n represents the number of genes, COEF represents the multi-variable COX regression coefficient of gene I, and EXP represents the expression value of gene I.
Back propagation neural network construction
We incorporated immune features and RS obtained by different algorithms into multivariate COX analysis to screen for significant candidate features. Subsequently, through the artificial neural network function of MATLAB, candidate features were reverse-verified in-depth. BPNN is a hierarchical neural network comprising input, hidden, and output layers. This study used BPNN to change the weights to reduce the error between the predicted results and the determined output. The output result adopts the forward propagation, and the error adopts the backward propagation method. The process was repeated in an iterative mode until the error fell below the set threshold. The algorithm process was as follows:
(1) Normalization of eigenvalues.
(2) The input function of the neuron is as follows:
Among them, w is the weight of connecting the two layers of neurons before and after, and b is the bias of the hidden layer.
(3) The output function of the neuron is as follows:
(4) To find the parameter with the smallest error, BPNN must find the smallest error according to the direction of the negative gradient. The error formula was expressed as follows:
where s refers to the actual value (target value), t refers to the output value of the neural network, and o_i refers to i output layers.
We performed all bioinformatics analyses using the R v3.6.1 environment. p < 0.05 was considered statistically significant. The “ggplot2 v3.3.2” data package draws the volcano map of DEGs, and the regression of Kaplan-Meier (K-M) and COX depends on the “survival v3.2-3” package. The tROC and LASSO algorithms were implemented by “timeROC v 0.4” and “glmnet v4.0-2”, respectively.
Clinical performance of secreted phosphoprotein 1
The prognostic performance and clinical value of the expression of SPP1 in HCC were significantly higher than in normal tissues (p = 2.6e-14; Fig. 1A). Survival analysis demonstrated that reduced SPP1 expression was significantly associated with improved patient survival (p < 0.001; Fig. 1B). In addition, tROC showed that the 1, 3, and 5-year area under the curve (AUC) values of SPP1 were 0.700, 0.645, and 0.659, respectively (Fig. 1C). Interestingly, the GEO cohort demonstrated that SPP1 has a good prognostic value (Fig. 1). Fig. 1D shows that as the expression of SPP1 increases, the T, grade, and stage show an upward trend. This implies a correlation between the high expression of SPP1 and the degree of malignancy of HCC.
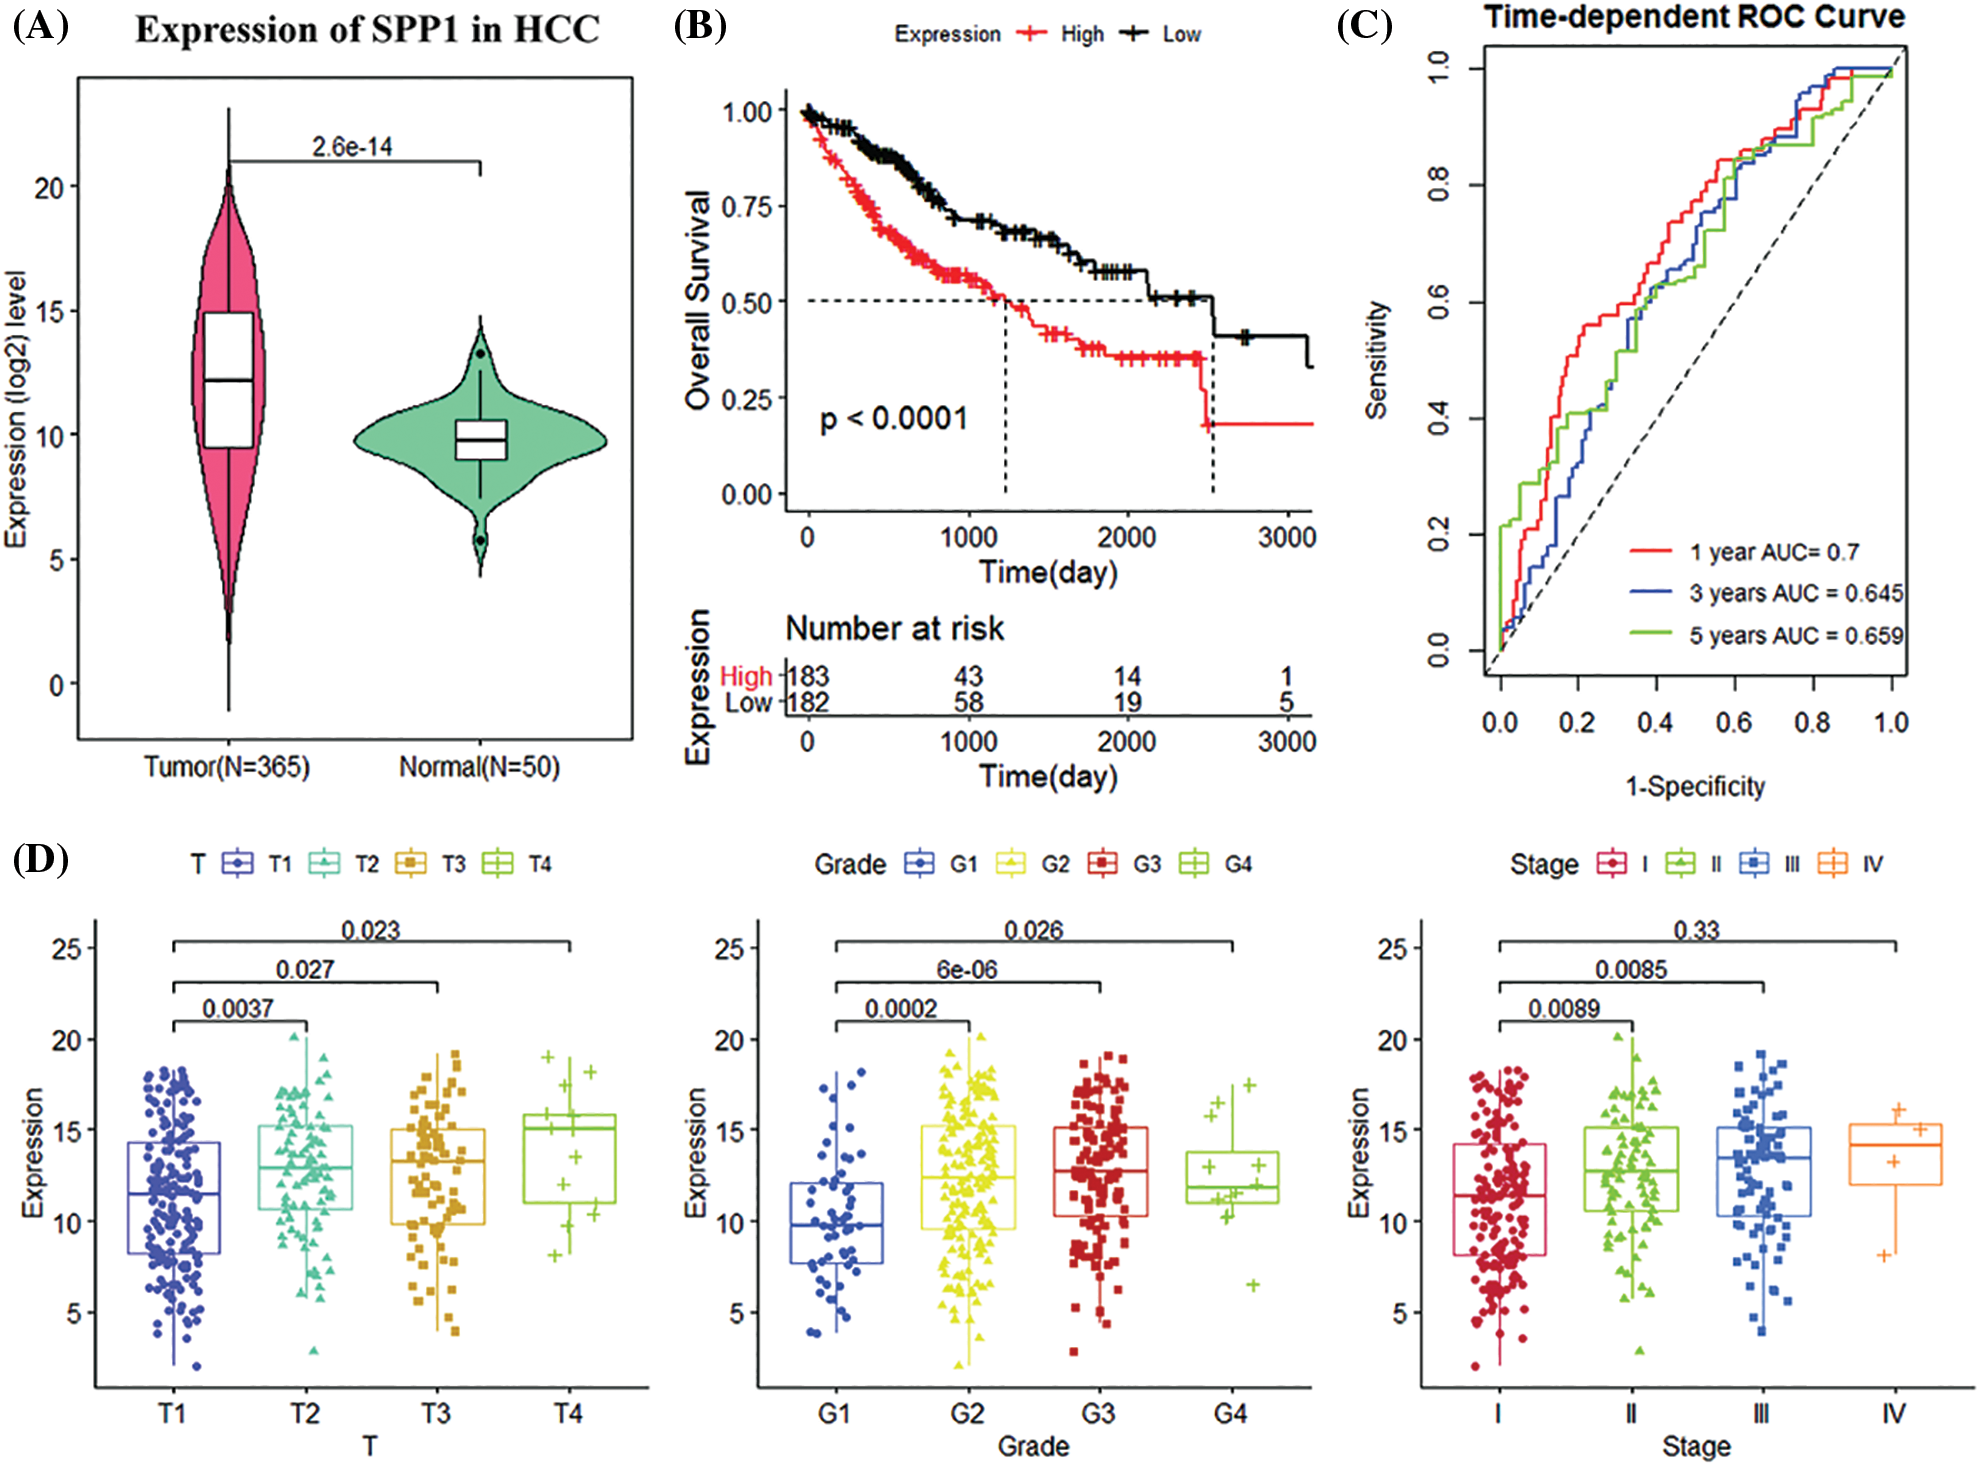
Figure 1: Analysis of clinical manifestations of secreted phosphoprotein 1 (SPP1) in the Cancer Genome Atlas (TCGA) cohort. (A) Relative expression of SPP1 in normal and tumor samples; (B) Kaplan-Meier (K-M) curves of high and low SPP1 expression groups of the Cancer Genome Atlas (TCGA) cohort; (C) Receiver operating characteristic curves of TCGA cohort 1, 3, and 5 years; (D) shows Boxplots of relative expression of SPP1 in different disease stages and tumor grades. The center marker is the median.
Independent prognostic analysis validated the prognostic performance of secreted phosphoprotein 1
To infer the independent prognostic value of SPP1, we included clinical information (age, gender, and stage) and SPP1 in the Cox regression analysis. Univariate Cox regression using the TCGA dataset showed that SPP1 (hazard ratio (HR) = 1.127, p < 0.001) and stage (Stage I, HR = 0.458, p < 0.001; Stage III, HR = 2.098, p < 0.001; Stage IV, HR = 3.660, p = 0.027) were prognostic risk factors for HCC. The multivariate results showed that SPP1 (HR = 1.117, p < 0.001) and stage (Stage I, HR = 0.372, p = 0.006; Stage II, HR = 0.462, p = 0.040) were independent markers for assessing HCC survival (Fig. 2A). The GEO cohort further confirmed the independent prognostic value of SPP1 (Fig. 2B).
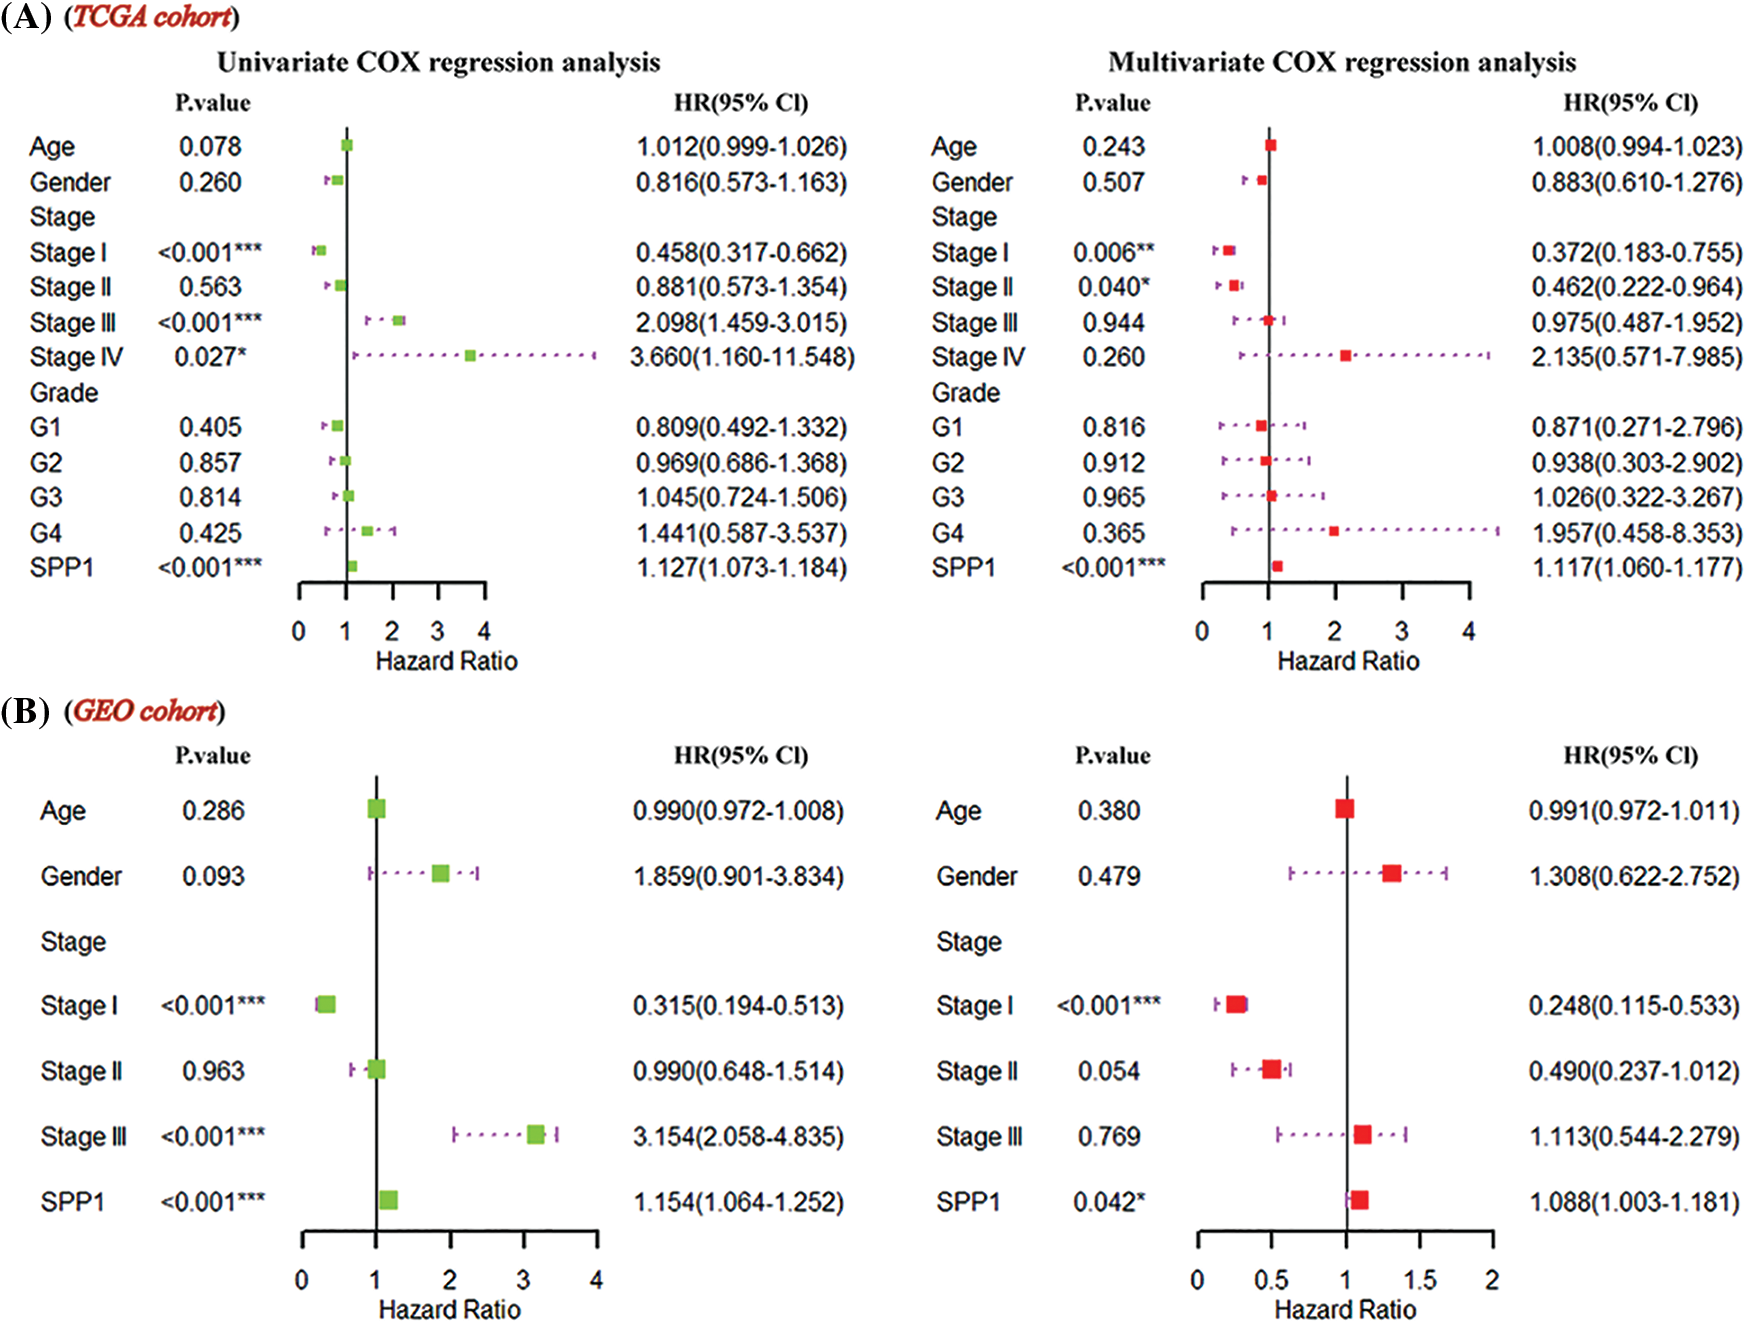
Figure 2: Prognostic significance of secreted phosphoprotein 1 (SPP1). (A) Multivariate Cox regression of the Cancer Genome Atlas (TCGA) cohort revealed that SPP1 was an independent prognostic marker for hepatocellular carcinoma (HCC); (B) SPP1 significantly affected patient survival.
Immune cell characteristics of high and low expression groups of secreted phosphoprotein 1
To understand immune fluctuations in HCC, we evaluated the composition of immune cells in different expression groups of SPP1. The TCGA results showed that CD4 naïve T cells (p = 0.023), CD4 memor-activated T cells (p = 0.004), regulatory T cells (Tregs) (p = 0.001), monocytes (p = 0.01), and M0 macrophages (p < 0.001). There were significant differences in penetration levels of M1 macrophages (p = 0.031), M2 macrophages (p = 0.014), resting mast cells (p < 0.001), and neutrophils (p = 0.001) (Fig. 3A). Interestingly, the GEO cohort analysis revealed similar results (Fig. 3B). We also identified four target immune cell types (CD4 memory-activated T cells, monocytes, M0 macrophages, and resting mast cells) by cross-linking the differential tumor-infiltrating immune cells (DTICs) of TCGA and GEO (Fig. 3C). Fig. 3D shows that the expression of SPP1 is negatively correlated with monocytes (r = −0.18) and resting mast cells (r = −0.25) but is significantly positively correlated with CD4 memory-activated T cells (r = 0.11) and M0 macrophages (r = 0.31).
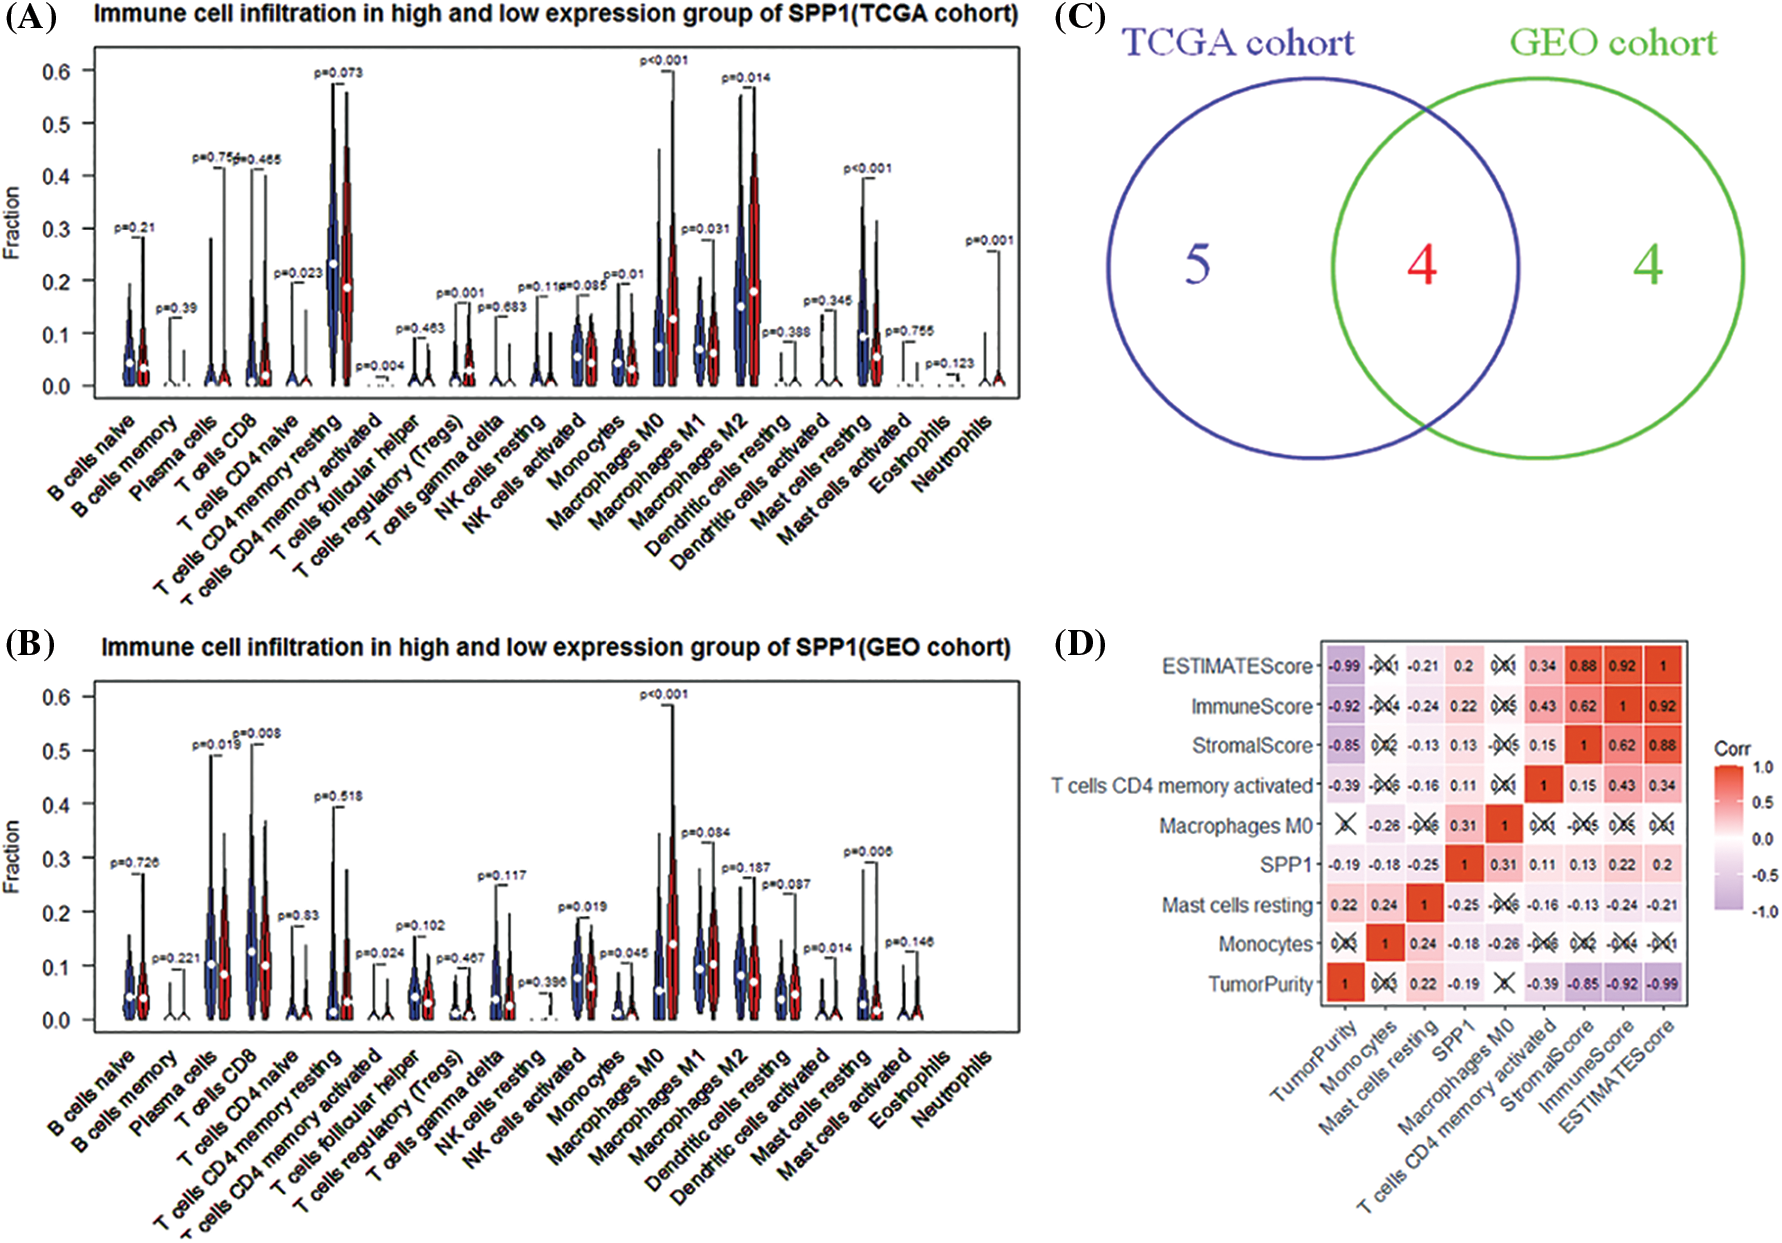
Figure 3: Analysis of secreted phosphoprotein 1 (SPP1)-driven immune cells. (A, B) Differences in the infiltration of 22 immune cells in high and low expression of SPP1; (C) Venn diagram identifying three types of immune cells; (D) SPP1 and immune cells and immune checkpoint inhibitors (programmed cell death protein 1 (PD-1) and PD)-ligand (L1)) correlation analysis.
Definition of immune-related genes related to secreted phosphoprotein 1
Using the level of SPP1 expression as grouping information, we identified 819 up-regulated and 128 down-regulated genes (Fig. 4A). Subsequently, we used the WGCNA algorithm to construct a co-expression network of 947 DEGs. We used the β = 4 scale-free network law (Fig. 4B) to identify six gene modules, except the gray module (Fig. 4C). Fig. 4D is a network heat map based on hierarchical gene and sample data clustering. The module-trait correlation analysis results show that the turquoise module and StromalScore (r = 0.55, p = 3e-27), ImmuneScore (r = 0.52, p = 4e-24), ESTIMATEScore (r = 0.60, p = 2e-33), and M0 macrophages (r = 0.24, p = 8e-6) are significantly positively correlated. It is worth noting that the turquoise module is negatively correlated with TumorPurity (r = −0.59, p = 2e-32) and resting mast cells (r = −0.38, p = 8e-13) (Fig. 4E). Therefore, the 453 genes in the turquoise module were used as the IRGs in the subsequent analysis.
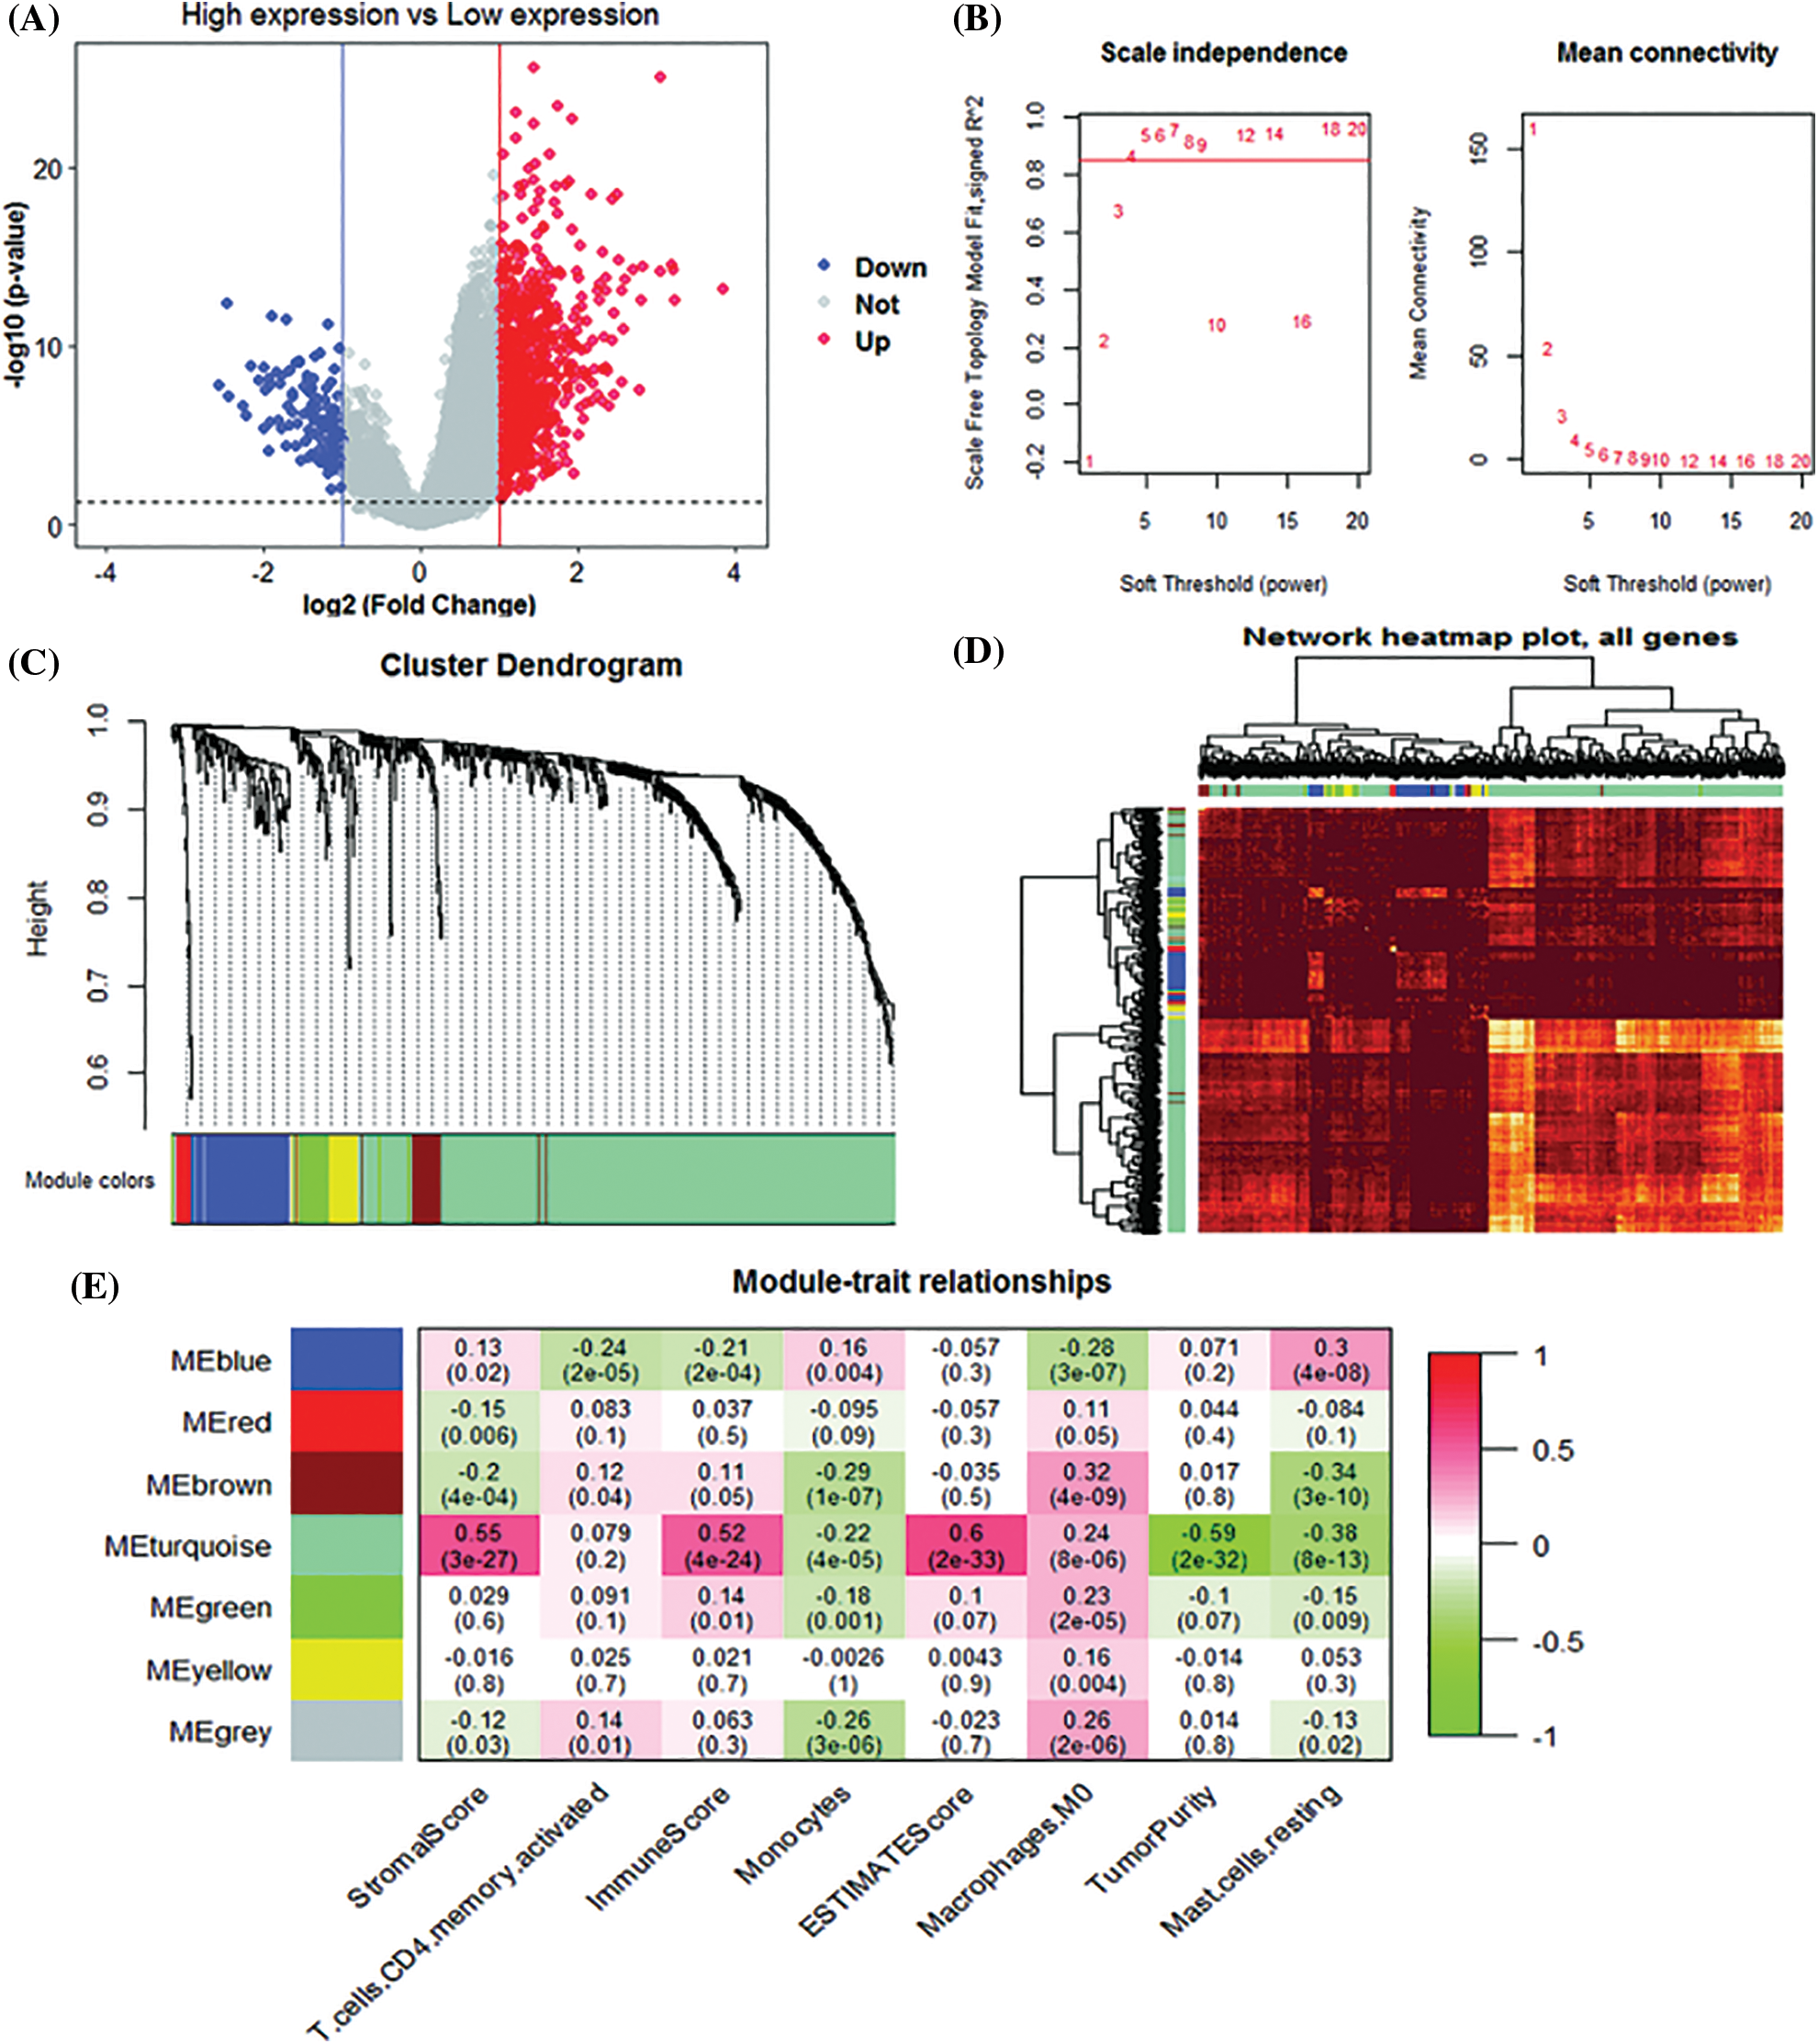
Figure 4: Weighted gene co-expression network analysis (WGCNA) analysis. (A) Volcano plot of differentially expressed genes (B) Unscaled fit index of soft threshold power. The graph on the left shows the relationship between the soft threshold and R2. The right panel shows the relationship between soft threshold and average connectivity. (C) Dendrogram of differentially expressed gene clusters based on different metrics. Each branch in the graph represents a gene. (D) Heatmap of correlations between gene modules and clinical features. (E) The correlation coefficient for each cell represents the correlation between gene modules and clinical features.
Construction and validation of the prognostic risk score model
We identified 263 IRGs significantly related to overall survival (OS) through univariate Cox regression analysis. Subsequently, LASSO Cox in-depth analysis obtained 10 prognostic signatures of IRGs (Fig. 5). Except for the HOMER1 gene (p = 0.068), low expression of the other nine IRGs significantly improves the survival of HCC patients (Fig. 6). Therefore, we established risk characteristics with nine IRG signatures. The resulting formula is: RS = 0.0137 * C5orf30 + 0.0082 * DNAJC6 + 0.0582 * MMP1 + 0.0286 * RGS20 + 0.0314 * S100A9 + 0.0443 * SLC1A5 + 0.0462 * SLC2A1 + 0.0355 * SOX11 + 0.0024 * STC2.
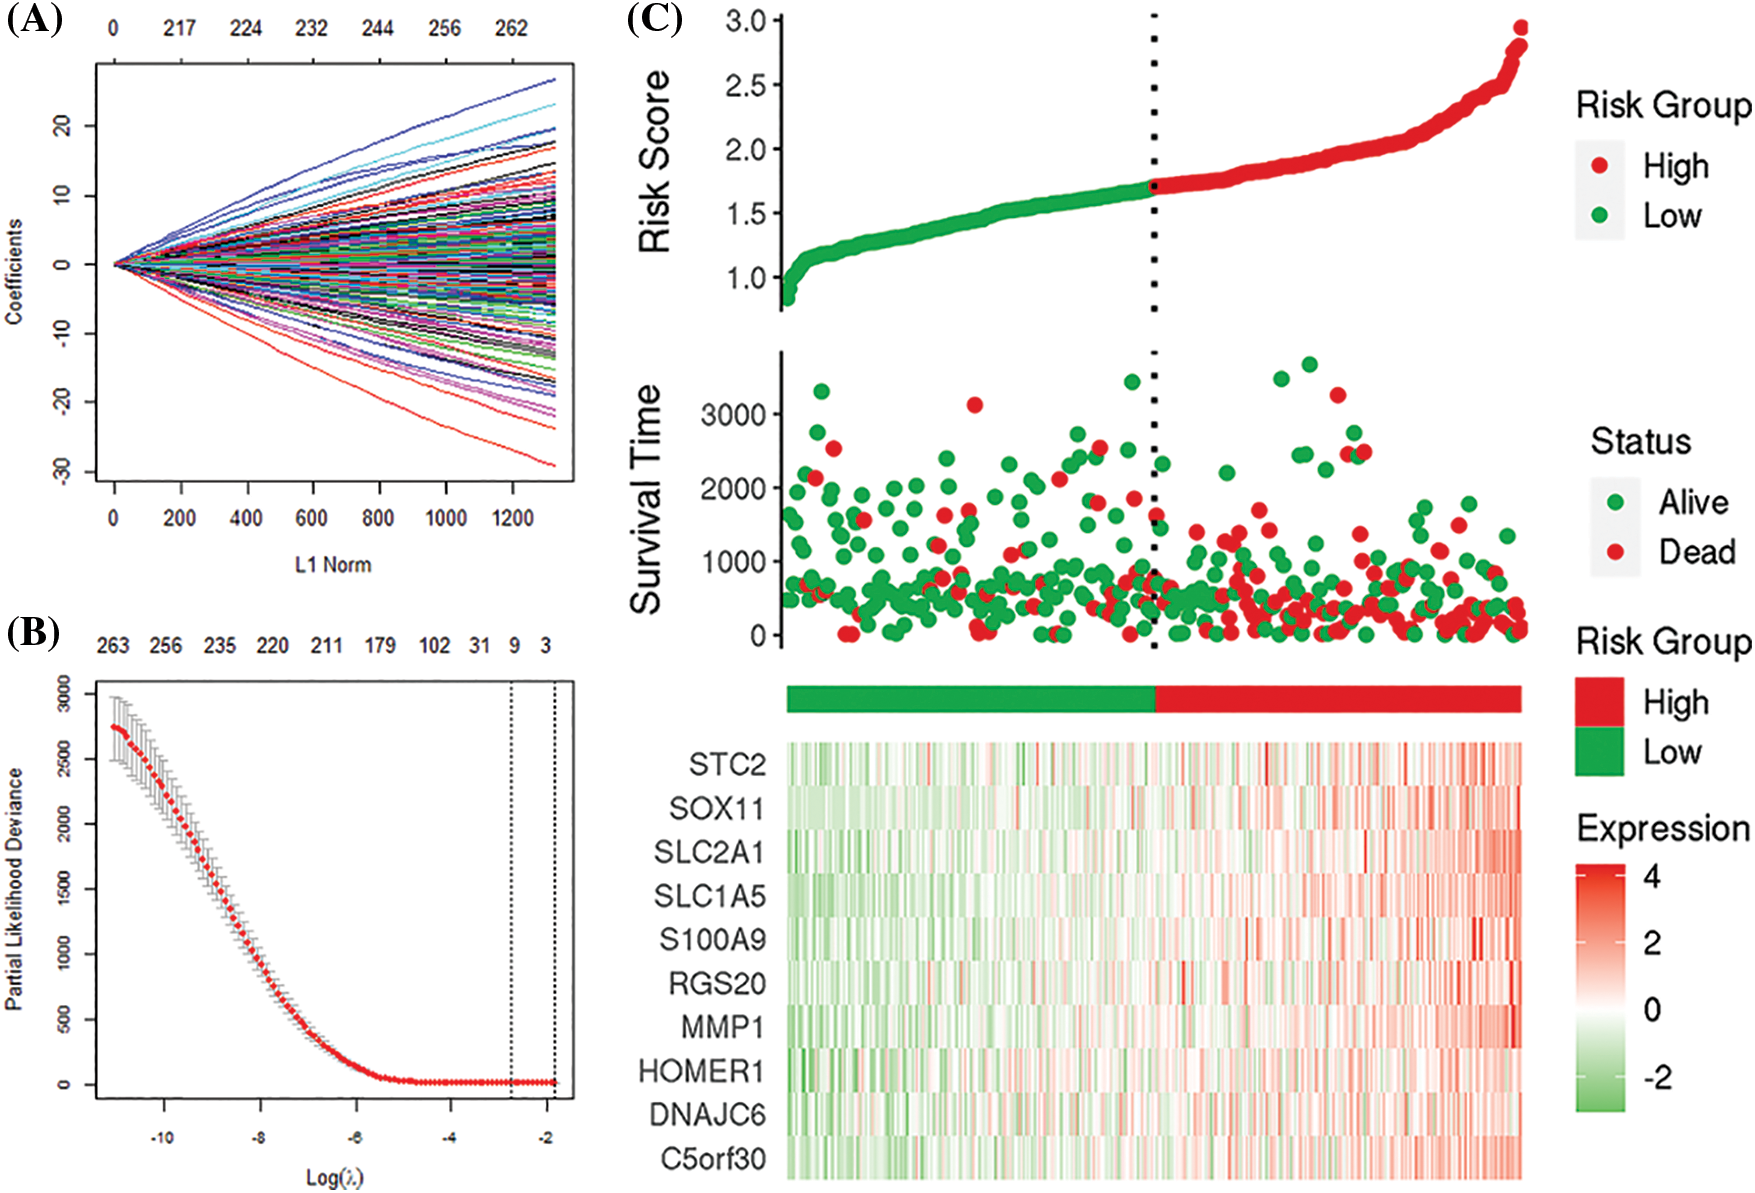
Figure 5: Least absolute shrinkage sum selection operator (LASSO) analysis. (A, B) Determination of the number of genetic screenings. (C) Prognostic risk score model analysis.
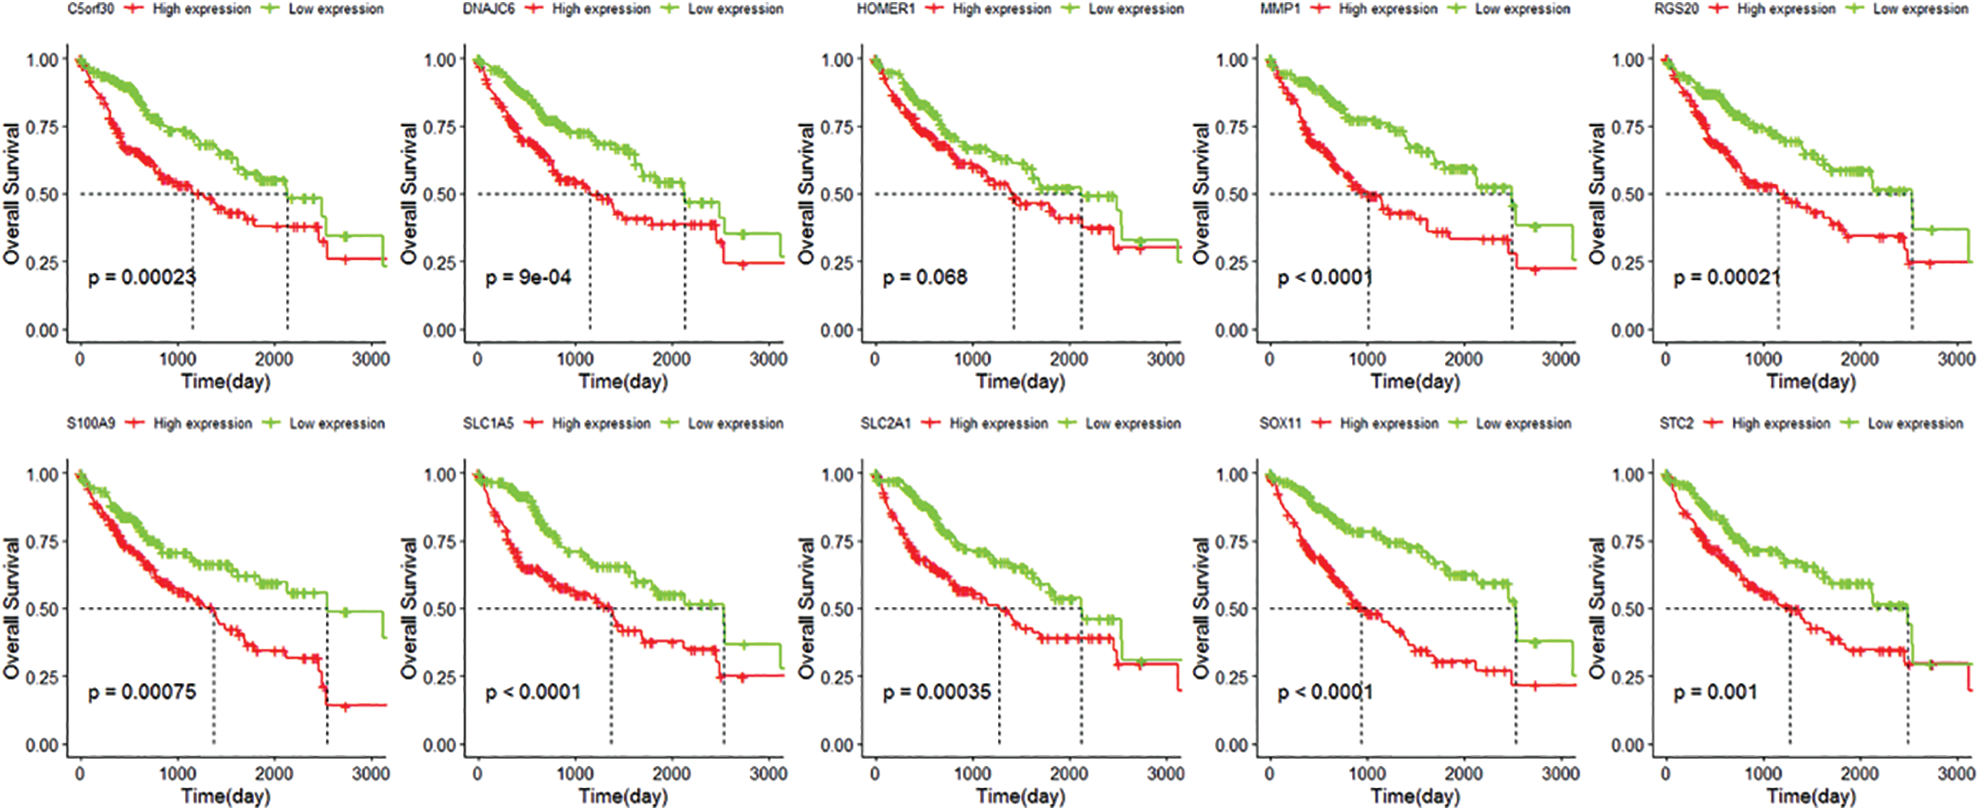
Figure 6: Kaplan-Meier curve of C5orf30, DNAJC6, MMP1, HOMER1, RGS20, S100A9, SLC1A5, SLC2A1, SOX11, STC2.
We used the median risk score (RS) value to divide TCGA (Nhigh-risk = 183, Nlow-risk = 182) and GEO (Nhigh-risk = 121, Nlow-risk = 121) patients into high-risk and low-risk groups. In the TCGA cohort, low-risk patients had a significantly longer lifespan (p < 0.0001). The 1, 3, and 5-year AUCs of RS were 0.777, 0.729, and 0.723, respectively (Fig. 7A). The GEO cohort achieved consistent results with 1, 3, and 5-year AUCs of 0.618, 0.643, and 0.644 (Fig. 7B).
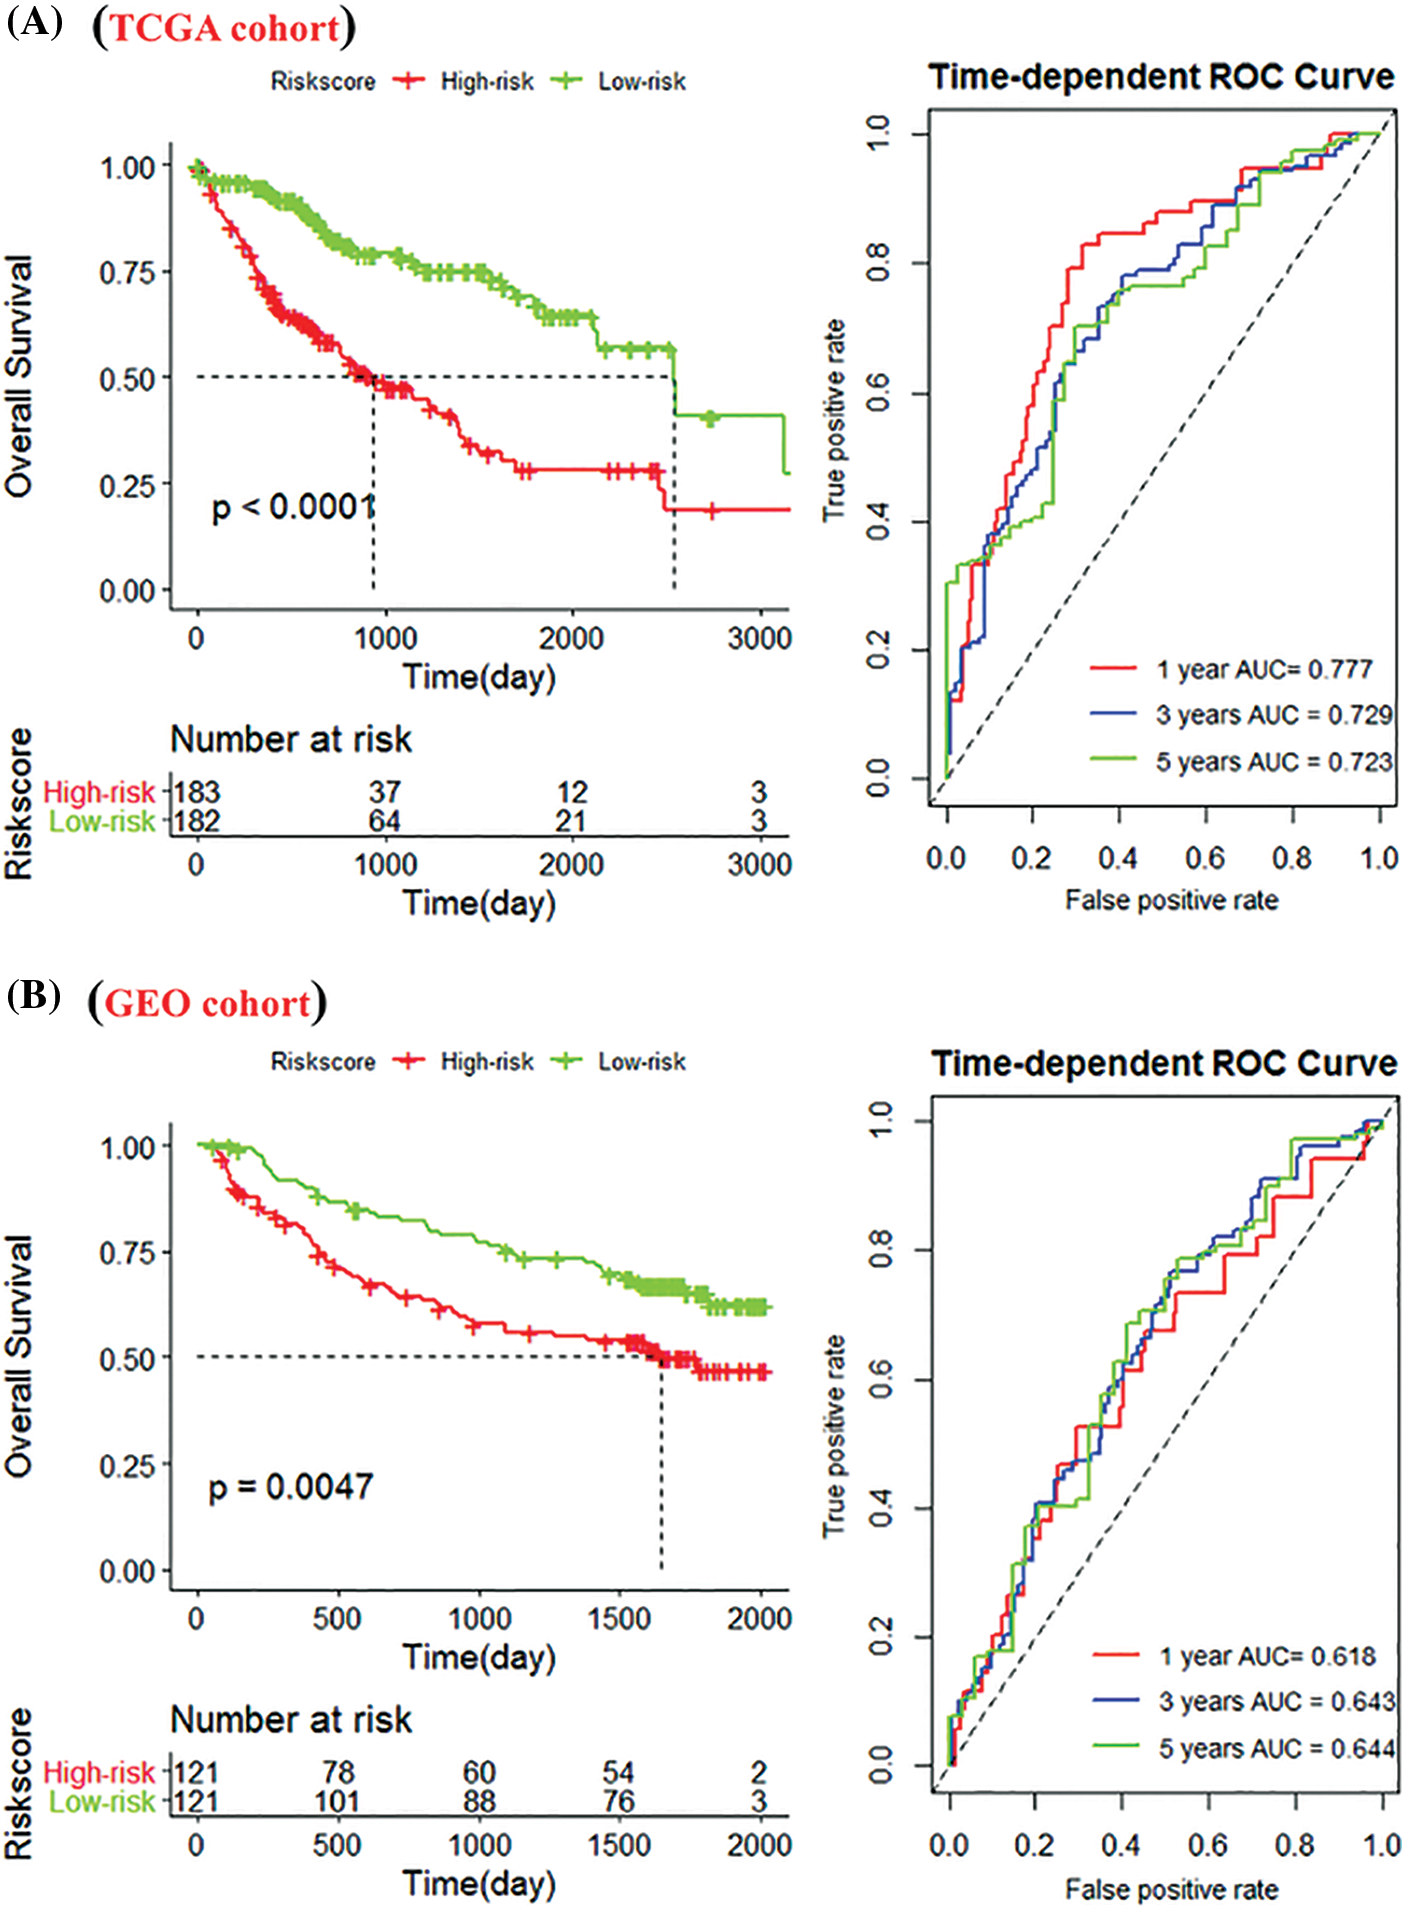
Figure 7: Construction of the immune-related gene (IRG) signature. (A) Kaplan-Meier (K-M) curves of high-risk and low-risk groups of The Cancer Genome Atlas (TCGA) cohort. The low-risk group significantly improved patient outcomes compared with the high-risk group; (B) K-M curves of the high- and low-risk groups in the Gene Expression Omnibus (GEO) cohort; and 1-, 3-, and 5-year survival rates.
Validation of the risk score model by the back propagation neural network
Next, we incorporated the immune features and risk features obtained by the different algorithms into the multivariate Cox regression analysis. The results showed that ImmuneScore (HR = 0.99918, p = 0.018), TumorPunity (HR = 0.00012, p = 0.035), M0 macrophages (HR = 0.18084, p = 0.003), and RiskScore (HR = 0.15655, p < 0.001) significantly affect SPP1 expression (Fig. 8A). In addition, StromalScore (HR = 0.998, p = 0.0077), ImmuneScore (HR = 0.998, p < 0.001), TumorPunity (HR = 9.61e-9, p = 0.0097), monocytes (HR = 194, p = 0.0469), and RiskScore (HR = 7.490, p < 0.001) were identified as key to predicting overall survival of HCC patients (Fig. 8B). Therefore, we identified ImmuneScore, TumorPunity, and RiskScore as candidate features.
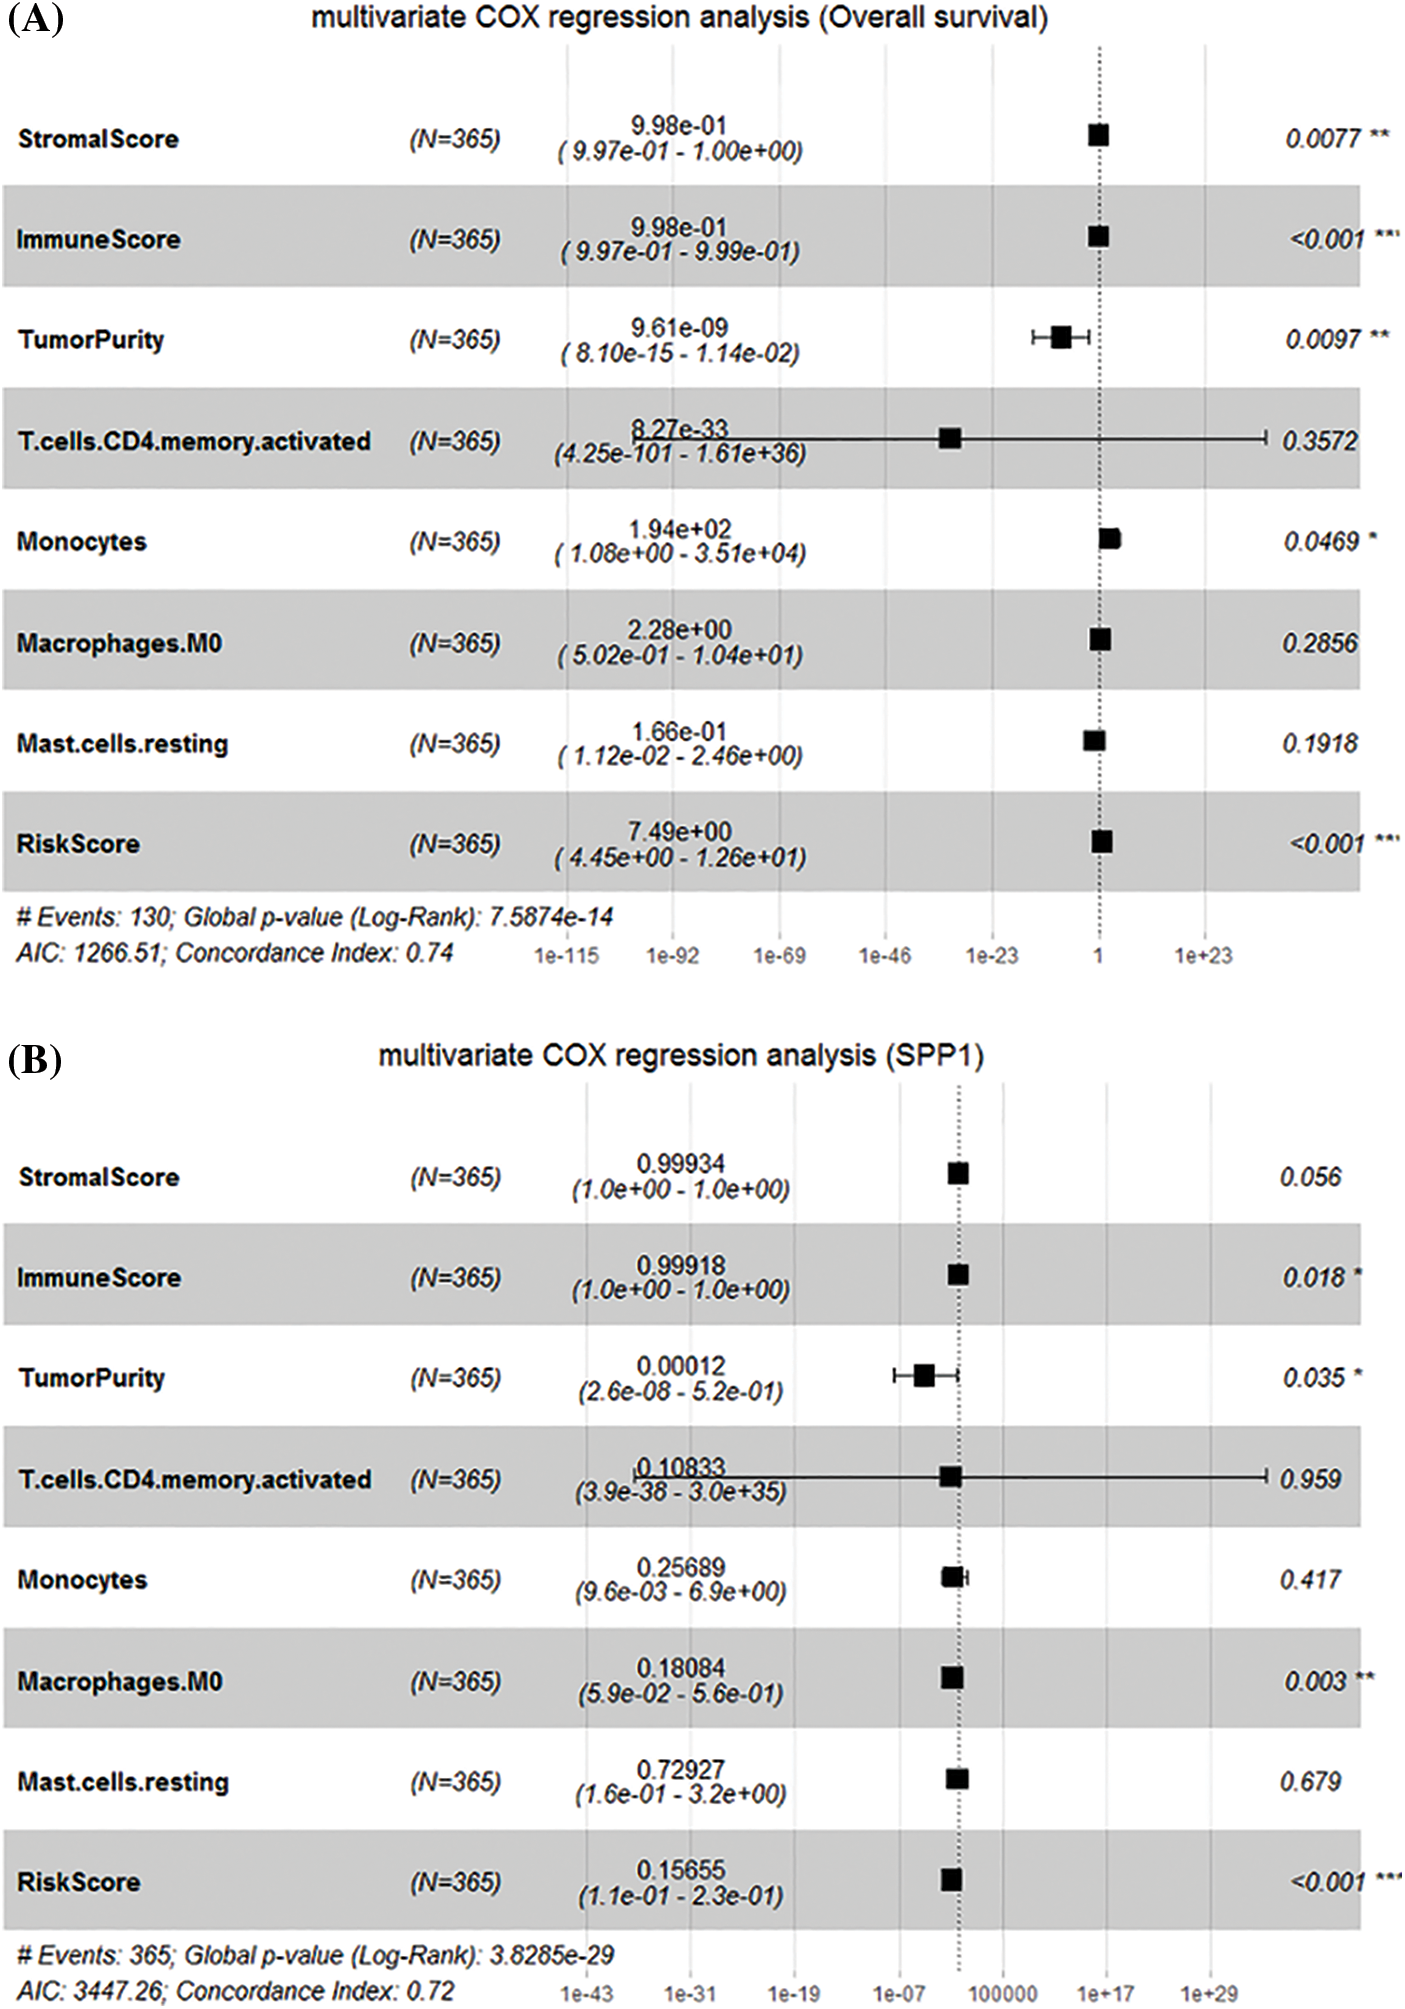
Figure 8: Identification of candidate features. (A) Multivariate Cox regression determines the relationship between candidate features and overall survival; (B) Multivariate Cox regression determines the relationship between candidate features and secreted phosphoprotein 1.
We used the BPNN model to further validate the risk score of multiple algorithms (ESTIMATE, CIBERSORT, WGCNA, and LASSO Cox). We first used the candidate features as input and the corresponding expression of SPP1 as output for BPNN prediction analysis. Subsequently, we divided the 365 samples into a training set (N = 255), validation set (N = 55), and test set (N = 55) to implement the neural network. The mean square error (MSE) was 0.00019679, and the best performance of the BPNN model was obtained at 5 epochs (Fig. 9A). Fig. 9B shows that the prediction error range is −0.02463 to 0.03088. We also found that training (R = 0.99989), validation (R = 0.99988), and testing (R = 0.9999) had higher regression values, which further increased the accuracy of the results (Fig. 10). Therefore, the BPNN prediction model further validated the reliability of the risk score of the multiple algorithms.
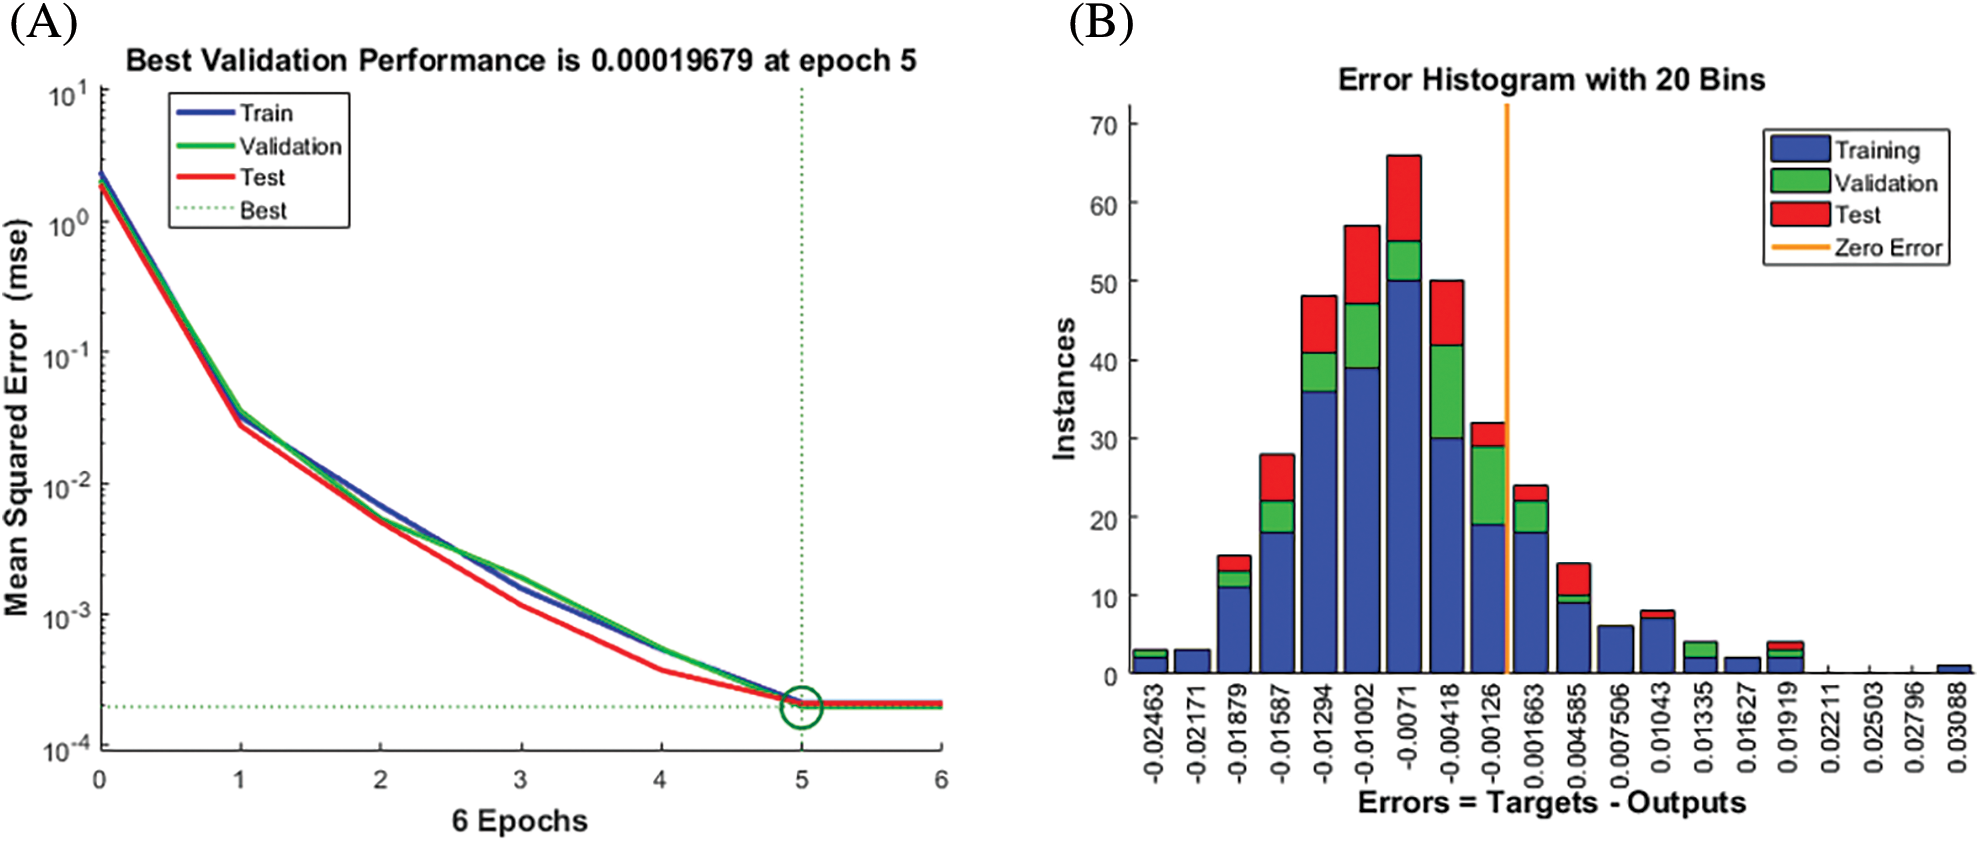
Figure 9: Best validation performance of the back propagation neural network (BPNN) model. (A) Performance Evaluation (B) Mean squared error distribution.
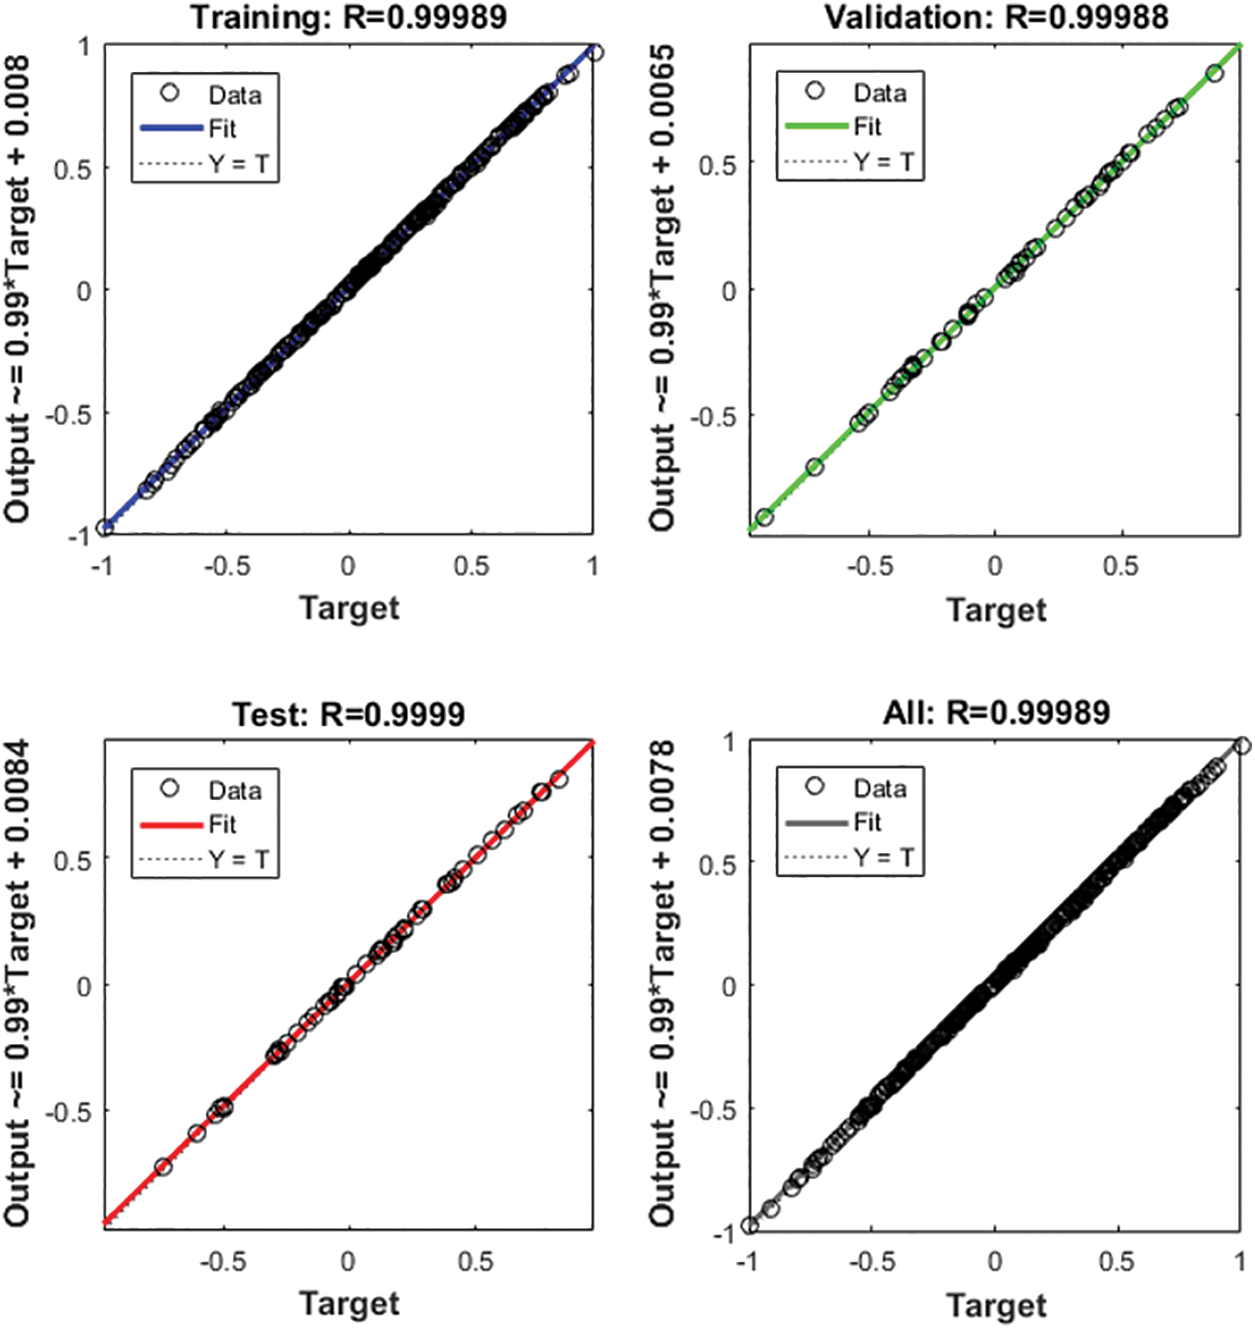
Figure 10: Regression analysis of the back propagation neural network (BPNN) model.
Immune regulation is vital in predicting tumor progression and prognosis (Giannone et al., 2020). As a carcinogen, SPP1 is dysregulated in various tumors (Assidi et al., 2019; Chen et al., 2019b). However, abnormalities of the immune components of the HCC microenvironment mediated by SPP1 remain unknown. In the present study, the expression of SPP1 in HCC tissues was significantly higher than that in normal tissues and had a strong prognostic value, which is consistent with previous experimental results (Lu et al., 2020). It is worth noting that SPP1 is positively correlated with T, grade, and stage, implying that high SPP1 expression is related to the degree of malignancy of HCC. In addition, we found that SPP1 and stage are independent factors that improve the prognosis of HCC. Currently, the stage is one of the most widely used prognostic indicators of HCC in clinical practice (Abdel-Rahman, 2018). The matching selection of SPP1 and an appropriate treatment plan may focus on the stage system. Therefore, SPP1 has the potential to be used as a marker to predict the survival of HCC patients.
To understand the relationship between SPP1 and tumor immunity, we used an expression matrix to evaluate the level of immune penetration in the HCC microenvironment. Based on the analysis of immune data from different cohorts, we found significant differences in CD4 memory-activated T cells, monocytes, M0 macrophages, and resting mast cells. Notably, these immune cells are significantly related to the expression of SPP1. CD4 memory-activated T cells are the primary surface marker of Th cells, which enhance the anti-infective effect mediated by phagocytes and the humoral immune response mediated by B lymphocytes. They also play an essential role in assisting CD8+ T cells and B cells in tumor immunity (Reynolds et al., 2016). Highly infiltrating monocytes are significantly related to the survival of HCC patients. The activated monocytes can mediate PD-L1 to inhibit tumor-specific T-cell immunity (Kuang et al., 2009). In addition, M0 macrophages are significantly recruited in tumor tissues and promote angiogenesis in HCC through MMP9 overexpression (Farha et al., 2020). Interestingly, high concentrations of resting mast cells produce interleukin 17, which participates in the progression and migration of HCC and is significantly related to poor prognosis (Tu et al., 2016). Therefore, SPP1 plays an essential role in the HCC microenvironment.
Based on the expression data of 947 DEGs, we identified 453 IRGs through the WGCNA analysis. We then constructed the risk characteristics of 9-IRGs through the stepwise Cox and LASSO algorithms to assess improvement in patient survival. Pre-built models using high-dimensional sequencing data may show over-fitting, and the LASSO penalty mechanism can avoid this shortcoming (Gaines et al., 2018). In the TCGA cohort, risk characteristics effectively separated patients, and low risk improved patient survival (p < 0.0001). The GEO cohort analysis confirmed the reliability of the risk characteristics (p = 0.0047). To date, several risk models similar to our research have been reported. However, the gene signature model constructed by Wang et al. (2018) and Chen et al. (2019c) lacked quantitative analysis of the predictive ability of the risk characteristics. Compared with previously developed multi-gene signatures such as Liu et al. (2020) (4-gene model, AUC 1-year = 0.724; AUC 3-years = 0.683; AUC 5-years = 0.650), Zhang et al. (2020) (14-gene model, AUC 1-year = 0.714; AUC 5-years = 0.635), Liu et al. (2019) (6-gene model, AUC 1-year = 0.773; AUC 3-years = 0.702; AUC 5-years = 0.673), our signature showed a better survival improvement effect (AUC 1-year = 0.777; AUC 3-years = 0.729; AUC 5-years = 0.723).
The 9-IRGs (C5orf30, DNAJC6, MMP1, RGS20, S100A9, SLC1A5, SLC2A1, SOX11, STC2) signatures we constructed showed good survival prediction effects. Among them, MMP1 had the most prominent predictive ability and is an independent risk factor for HCC. Matrix metalloproteinase-1 (MMP1) is a carcinogen associated with the progression of HCC, and its high expression corresponds to a poor prognosis (Sanchez-Lorencio et al., 2018). Studies reported the knockdown of MMP1 blocked the proliferation and invasion of HCC cells (Kim et al., 2018). Yu et al. (2020) confirmed that PA mediates the down-regulation of MMP1 and activates the ERK signaling pathway to inhibit the migration of HCC. In addition, Lai et al. (2017) found that a polymorphism in the promoter region of MMP1 is highly correlated with HCC. Notably, SPP1 and MMP1 simultaneously appear in the 5-gene HCC prognostic model (Xiong et al., 2020). Fan et al. (2019) found that SPP1 can affect the occurrence of diseases by increasing the expression of MMP1. Therefore, we speculate that SPP1 and MMP1 play a combined role in HCC, although more experimental verification is needed.
With updating information generation methods and diversification, single algorithms (such as WGCNA and LASSO) often have unsatisfactory predictions and can no longer meet demands (Toubiana et al., 2019; Waldmann et al., 2019). Combined algorithms have achieved good results in predicting the prognosis of liver cancer. For example, Yang et al. (2021) used the WGCNA and LASSO algorithms to establish a 4-gene signature for survival improvement in HCC patients and achieved good results. However, the results were not further verified using multiple algorithms. Recently, neural network algorithms and other bioinformatical approaches have been successfully applied for the clinical prediction of tumors (Lin et al., 2020; Peng et al., 2020; Qiu et al., 2021; Xie et al., 2022). Therefore, in the present study, we first confirmed the good effect of SPP1 in improving the survival of HCC patients using multiple algorithms (i.e., ESTIMATE, CIBERSORT, WGCNA, Cox regression, and LASSO) and then further verified the accuracy of these results through BPNN.
Our results support that SPP1 is an independent marker of overall survival in HCC, with low expression being significantly associated with improved survival. Using various algorithms, we could confirm that SPP1 is significantly related to the immune microenvironment. Subsequently, based on the SPP1 expression grouping and immune characteristics, the risk score of the 9-IRG signature was established with excellent survival prediction performance. The use of BPNN further validated the reliability of the score of multiple algorithms. Therefore, SPP1 is a potential marker for HCC survival prediction. This was an exploratory study; therefore, the application value of SPP1 should be further verified by prospective multi-center clinical trials.
Availability of Data and Materials: The datasets generated during and/or analysed during the current study are available from the corresponding author on reasonable request.
Author Contribution: The authors confirm contribution to the paper as follows: draft manuscript preparation: Wenli Zeng; data collection: Feng Ling, Kainuo Dang; study conception and design: Qingjia Chi. All authors reviewed the results and approved the final version of the manuscript.
Funding Statement: This work was supported by Hubei Provincial Key Laboratory Opening Project of Renmin Hospital of Wuhan University (2022KFH010).
Conflicts of Interest: All the authors declared no potential conflicts of interest.
References
Abdel-Rahman O (2018). Assessment of the discriminating value of the 8th ajcc stage grouping for hepatocellular carcinoma. HPB 20: 41–48. DOI 10.1016/j.hpb.2017.08.017. [Google Scholar] [CrossRef]
Anborgh PH, Mutrie JC, Tuck AB, Chambers AF (2010). Role of the metastasis-promoting protein osteopontin in the tumour microenvironment. Journal of Cellular and Molecular Medicine 14: 2037–2044. DOI 10.1111/j.1582-4934.2010.01115.x. [Google Scholar] [CrossRef]
Armstrong SA, He AR (2020). Immuno-oncology for hepatocellular carcinoma: The present and the future. Clinical Liver Disease 24: 739–753. DOI 10.1016/j.cld.2020.07.007. [Google Scholar] [CrossRef]
Assidi M, Gomaa W, Jafri M, Hanbazazh M, Al-Ahwal M et al. (2019). Prognostic value of osteopontin (SPP1) in colorectal carcinoma requires a personalized molecular approach. Tumour Biology 41: 1391226037. DOI 10.1177/1010428319863627. [Google Scholar] [CrossRef]
Chen J, Hou C, Zheng Z, Lin H, Lv G, Zhou D (2019a). Identification of secreted phosphoprotein 1 (SPP1) as a prognostic factor in lower-grade gliomas. World Neurosurgery 130: e775–e785. DOI 10.1016/j.wneu.2019.06.219. [Google Scholar] [CrossRef]
Chen J, Hou C, Zheng Z, Lin H, Lv G, Zhou D (2019b). Identification of secreted phosphoprotein 1 (SPP1) as a prognostic factor in lower-grade gliomas. World Neurosurgery 130: e775–e785. DOI 10.1016/j.wneu.2019.06.219. [Google Scholar] [CrossRef]
Chen PF, Li QH, Zeng LR, Yang XY, Peng PL, He JH, Fan B (2019c). A 4-gene prognostic signature predicting survival in hepatocellular carcinoma. Journal of Cellular Biochemistry 120: 9117–9124. DOI 10.1002/jcb.28187. [Google Scholar] [CrossRef]
Eggermont AM, Chiarion-Sileni V, Grob JJ, Dummer R, Wolchok JD et al. (2016). Prolonged survival in stage III melanoma with ipilimumab adjuvant therapy. The New England Journal of Medicine 375: 1845–1855. DOI 10.1056/NEJMoa1611299. [Google Scholar] [CrossRef]
Fan F, Zhou Q, Xu Z, Wang D (2019). Osteopontin in the pathogenesis of aortic dissection by the enhancement of mmp expressions. International Heart Journal 60: 429–435. DOI 10.1536/ihj.18-017. [Google Scholar] [CrossRef]
Farha M, Jairath NK, Lawrence TS, El NI (2020). Characterization of the tumor immune microenvironment identifies m0 macrophage-enriched cluster as a poor prognostic factor in hepatocellular carcinoma. JCO Clinical Cancer Informatics 4: 1002–1013. DOI 10.1200/CCI.20.00077. [Google Scholar] [CrossRef]
Gaines BR, Kim J, Zhou H (2018). Algorithms for fitting the constrained lasso. Journal of Computational and Graphical 27: 861–871. DOI 10.1080/10618600.2018.1473777. [Google Scholar] [CrossRef]
Giannone G, Ghisoni E, Genta S, Scotto G, Tuninetti V, Turinetto M, Valabrega G (2020). Immuno-metabolism and microenvironment in cancer: Key players for immunotherapy. International Journal of Molecular Sciences 21: 4414. DOI 10.3390/ijms21124414. [Google Scholar] [CrossRef]
Huang H, Lu Y, Zhou T, Gu G, Xia Q (2018). Innate immune cells in immune tolerance after liver transplantation. Frontiers in Immunology 9: 2401. DOI 10.3389/fimmu.2018.02401. [Google Scholar] [CrossRef]
Kim E, Kim D, Lee JS, Yoe J, Park J et al. (2018). Capicua suppresses hepatocellular carcinoma progression by controlling the ETV4–MMP1 axis. Hepatology 67: 2287–2301. DOI 10.1002/hep.29738. [Google Scholar] [CrossRef]
Kuang DM, Zhao Q, Peng C, Xu J, Zhang JP, Wu C, Zheng L (2009). Activated monocytes in peritumoral stroma of hepatocellular carcinoma foster immune privilege and disease progression through PD-L1. The Journal of Experimental Medicine 206: 1327–1337. DOI 10.1084/jem.20082173. [Google Scholar] [CrossRef]
Lai YL, Gong CL, Fu CK, Yueh TC, Tsai CW et al. (2017). The contribution of matrix metalloproteinase-1 genotypes to hepatocellular carcinoma susceptibility in Taiwan. Cancer Genomics Proteomics 14: 119–125. DOI 10.21873/cgp.20024. [Google Scholar] [CrossRef]
Li S, Yang R, Sun X, Miao S, Lu T, Wang Y, Wo Y, Jiao W (2018). Identification of SPP1 as a promising biomarker to predict clinical outcome of lung adenocarcinoma individuals. Gene 679: 398–404. DOI 10.1016/j.gene.2018.09.030. [Google Scholar] [CrossRef]
Lin Y, Zhang W, Cao H, Li G, Du W (2020). Classifying breast cancer subtypes using deep neural networks based on multi-omics data. Genes 11: 888. DOI 10.3390/genes11080888. [Google Scholar] [CrossRef]
Liu GM, Xie WX, Zhang CY, Xu JW (2020). Identification of a four-gene metabolic signature predicting overall survival for hepatocellular carcinoma. Journal of Cellular Physiology 235: 1624–1636. DOI 10.1002/jcp.29081. [Google Scholar] [CrossRef]
Liu GM, Zeng HD, Zhang CY, Xu JW (2019). Identification of a six-gene signature predicting overall survival for hepatocellular carcinoma. Cancer Cell International 19: 138. DOI 10.1186/s12935-019-0858-2. [Google Scholar] [CrossRef]
Long J, Zhang L, Wan X, Lin J, Bai Y, Xu W, Xiong J, Zhao H (2018). A four-gene-based prognostic model predicts overall survival in patients with hepatocellular carcinoma. Journal of Cellular and Molecular Medicine 22: 5928–5938. DOI 10.1111/jcmm.13863. [Google Scholar] [CrossRef]
Lu C, Fang S, Weng Q, Lv X, Meng M et al. (2020). Integrated analysis reveals critical glycolytic regulators in hepatocellular carcinoma. Cell Communication and Signaling 18: 97. DOI 10.1186/s12964-020-00539-4. [Google Scholar] [CrossRef]
Ma J, Zheng B, Goswami S, Meng L, Zhang D et al. (2019). PD1(Hi) CD8+ T cells correlate with exhausted signature and poor clinical outcome in hepatocellular carcinoma. Journal for Immunotherapy of Cancer 7: 331. DOI 10.1186/s40425-019-0814-7. [Google Scholar] [CrossRef]
Nardo AD, Grun NG, Zeyda M, Dumanic M, Oberhuber G et al. (2020). Impact of osteopontin on the development of non-alcoholic liver disease and related hepatocellular carcinoma. Liver International 40: 1620–1633. DOI 10.1111/liv.14464. [Google Scholar] [CrossRef]
Obeid JM, Kunk PR, Zaydfudim VM, Bullock TN, Slingluff CJ, Rahma OE (2018). Immunotherapy for hepatocellular carcinoma patients: Is it ready for prime time? Cancer Immunol Immunother 67: 161–174. DOI 10.1007/s00262-017-2082-z. [Google Scholar] [CrossRef]
Ogasawara S, Ooka Y, Kato N (2019). Regorafenib in patients with advanced hepatocellular carcinoma;current status and future perspective. Nihon Shokakibyo Gakkai Zasshi 116: 28–35. DOI 10.11405/nisshoshi.116.28. [Google Scholar] [CrossRef]
Peng J, Zou D, Gong W, Kang S, Han L (2020). Deep neural network classification based on somatic mutations potentially predicts clinical benefit of immune checkpoint blockade in lung adenocarcinoma. Oncoimmunology 9: 1734156. DOI 10.1080/2162402X.2020.1734156. [Google Scholar] [CrossRef]
Qiu Y, Li H, Xie J, Qiao X, Wu J (2021). Identification of ABCC5 among ATP-binding cassette transporter family as a new biomarker for hepatocellular carcinoma based on bioinformatics analysis. International Journal of General Medicine 14: 7235–7246. DOI 10.2147/IJGM.S333904. [Google Scholar] [CrossRef]
Reynolds G, Gibbon JR, Pratt AG, Wood MJ, Coady D et al. (2016). Synovial CD4+ T-cell-derived GM-CSF supports the differentiation of an inflammatory dendritic cell population in rheumatoid arthritis. Annals of the Rheumatic Diseases 75: 899–907. DOI 10.1136/annrheumdis-2014-206578. [Google Scholar] [CrossRef]
Rimassa L, Danesi R, Pressiani T, Merle P (2019). Management of adverse events associated with tyrosine kinase inhibitors: Improving outcomes for patients with hepatocellular carcinoma. Cancer Treatment Reviews 77: 20–28. DOI 10.1016/j.ctrv.2019.05.004. [Google Scholar] [CrossRef]
Sanchez-Lorencio MI, Saenz L, Ramirez P, Villalba-Lopez F, de la Orden V et al. (2018). Matrix metalloproteinase 1 as a novel biomarker for monitoring hepatocellular carcinoma in liver transplant patients. Transplant Proceedings 50: 623–627. DOI 10.1016/j.transproceed.2017.11.061. [Google Scholar] [CrossRef]
Siegel RL, Miller KD, Jemal A (2020). Cancer statistics, 2020. CA: A Cancer Journal for Clinicians 70: 7–30. DOI 10.3322/caac.21590. [Google Scholar] [CrossRef]
Sim HW, Knox J (2018). Hepatocellular carcinoma in the era of immunotherapy. Current Problems in Cancer 42: 40–48. DOI 10.1016/j.currproblcancer.2017.10.007. [Google Scholar] [CrossRef]
Singh A, Gill G, Kaur H, Amhmed M, Jakhu H (2018). Role of osteopontin in bone remodeling and orthodontic tooth movement: A review. Progress in Orthodontics 19: 18. DOI 10.1186/s40510-018-0216-2. [Google Scholar] [CrossRef]
Song Z, Chen W, Athavale D, Ge X, Desert R, Das S, Han H, Nieto N (2020). Osteopontin takes center stage in chronic liver disease. Hepatology 73: 1594–1608. DOI 10.1002/hep.31582. [Google Scholar] [CrossRef]
Toubiana D, Puzis R, Sadka A, Blumwald E (2019). A genetic algorithm to optimize weighted gene co-expression network analysis. Journal of Computational Biology 26: 1349–1366. DOI 10.1089/cmb.2019.0221. [Google Scholar] [CrossRef]
Tu JF, Pan HY, Ying XH, Lou J, Ji JS, Zou H (2016). Mast cells comprise the major of interleukin 17-producing cells and predict a poor prognosis in hepatocellular carcinoma. Medicine 95: e3220. DOI 10.1097/MD.0000000000003220. [Google Scholar] [CrossRef]
Waldmann P, Ferencakovic M, Meszaros G, Khayatzadeh N, Curik I, Solkner J (2019). Autalasso: An automatic adaptive lasso for genome-wide prediction. BMC Bioinformatics 20: 167. DOI 10.1186/s12859-019-2743-3. [Google Scholar] [CrossRef]
Wang J, Hao F, Fei X, Chen Y (2019). SPP1 functions as an enhancer of cell growth in hepatocellular carcinoma targeted by mir-181c. American Journal of Translational Research 11: 6924–6937. [Google Scholar]
Wang Z, Teng D, Li Y, Hu Z, Liu L, Zheng H (2018). A six-gene-based prognostic signature for hepatocellular carcinoma overall survival prediction. Life Science 203: 83–91. DOI 10.1016/j.lfs.2018.04.025. [Google Scholar] [CrossRef]
Xie J, Chen L, Sun Q, Li H, Wei W, Wu D, Hu Y, Zhu Z, Shi J, Wang M (2022). An immune subtype-related prognostic signature of hepatocellular carcinoma based on single-cell sequencing analysis. Sedentary Life and Nutrition 1214: 3276–3292. DOI 10.18632/aging.204012. [Google Scholar] [CrossRef]
Xiong C, Wang G, Bai D (2020). A novel prognostic models for identifying the risk of hepatocellular carcinoma based on epithelial-mesenchymal transition-associated genes. Bioengineered 11: 1034–1046. DOI 10.1080/21655979.2020.1822715. [Google Scholar] [CrossRef]
Yang Z, Zi Q, Xu K, Wang C, Chi Q (2021). Development of a macrophages-related 4-gene signature and nomogram for the overall survival prediction of hepatocellular carcinoma based on wgcna and lasso algorithm. International Immunopharmacology 90: 107238. DOI 10.1016/j.intimp.2020.107238. [Google Scholar] [CrossRef]
Yu CL, Yu YL, Yang SF, Hsu CE, Lin CL, Hsieh YH, Chiou HL (2020). Praeruptorin a reduces metastasis of human hepatocellular carcinoma cells by targeting ERK/MMP1 signaling pathway. Environmental Toxicology 36: 540–549. DOI 10.1002/tox.23059. [Google Scholar] [CrossRef]
Zhang BH, Yang J, Jiang L, Lyu T, Kong LX et al. (2020). Development and validation of a 14-gene signature for prognosis prediction in hepatocellular carcinoma. Genomics 112: 2763–2771. DOI 10.1016/j.ygeno.2020.03.013. [Google Scholar] [CrossRef]
Zhu Y, Yang J, Xu D, Gao XM, Zhang Z et al. (2019). Disruption of tumour-associated macrophage trafficking by the osteopontin-induced colony-stimulating factor-1 signalling sensitises hepatocellular carcinoma to anti-PD-L1 blockade. Gut 68: 1653–1666. DOI 10.1136/gutjnl-2019-318419. [Google Scholar] [CrossRef]
Yin ZY, Li XW (2020). Immunotherapy for hepatocellular carcinoma. Cancer Letters 470: 8–17. DOI 10.1016/j.canlet.2019.12.002. [Google Scholar] [CrossRef]
Cite This Article
 Copyright © 2023 The Author(s). Published by Tech Science Press.
This work is licensed under a Creative Commons Attribution 4.0 International License , which permits unrestricted use, distribution, and reproduction in any medium, provided the original work is properly cited.
 Downloads
 Citation Tools