
 Submit a Paper
 Propose a Special lssue
 Open Access
ARTICLE

Structural characterization of four Rhododendron spp. chloroplast genomes and comparative analyses with other azaleas
1 Life Science College, Luoyang Normal University, Luoyang, 471934, China
2 College of Life Science and Technology, Henan Institute of Science and Technology, Xinxiang, 453003, China
* Corresponding Author: Xiaojun Zhou,
(This article belongs to the Special Issue: Advances in Plant Cell Biology Research)
BIOCELL 2023, 47(3), 657-668. https://doi.org/10.32604/biocell.2023.026781
Received 26 September 2022; Accepted 15 November 2022; Issue published 03 January 2023
 View Full Text
 Download PDF
Abstract
Azalea is a general designation of Rhododendron in the Ericaceae family. Rhododendron not only has high ornamental value but also has application value in ecological protection, medicine, and scientific research. In this study, we used Illumina and PacBio sequencing to assemble and annotate the entire chloroplast genomes (cp genomes) of four Rhododendron species. The chloroplast genomes of R. concinnum, R. henanense subsp. lingbaoense, R. micranthum, and R. simsii were assembled into 207,236, 208,015, 207,233, and 206,912 bp, respectively. All chloroplast genomes contain eight rRNA genes, with either 88 or 89 protein-coding genes. The four cp genomes were compared and analyzed by bioinformatics, and the phylogenetic analysis based on chloroplast genomes of 26 species of Ericaceae, Actinidiaceae, and Primulaceae under Ericales was conducted. A comparison of the linear structure of cp genomes of four Rhododendron showed that there were substantial sequence similarities in coding regions, but high differences in non-coding regions. A phylogenetic analysis, based on chloroplast whole genome sequences, showed that all Rhododendron species are in the clade Ericaceae. This study provides valuable genetic information for the study of population genetics and evolutionary relationships in Rhododendron and other azalea species.Keywords
Supplementary Material
Supplementary Material FileAzalea, one of China’s top ten most famous flowers, is a general name of Rhododendron plants in the Ericaceae family of flowering plants. Rhododendron is not only of high ornamental value but is also used in ecological protection, medicine, and scientific research (Liang et al., 2016; Li et al., 2018). There are about 1025 species worldwide, and more than 580 are distributed in China, of which 420 are endemic. Due to frequent interspecific hybridization and introgression, the interspecific phylogenetic relationship within the genus has long been suspected (Kurashige et al., 2001; Gao et al., 2002; Goetsch et al., 2005; Yan et al., 2017; Xia et al., 2022; Fu et al., 2022). Although the germplasm resources of Rhododendron are rich, with the development of society and economic activities, some populations and wild species with a small number of individuals and little attention have been seriously disturbed and have even become extinct or endangered (Ma et al., 2014; Ma et al., 2017).
The chloroplast is an important organelle with autonomous genetic information for photosynthesis. It is commonly found in terrestrial plants, algae, and protozoa (Dobrogojski et al., 2020). The chloroplast genome is a typical double-stranded circular multi-copy DNA molecule in cells. Plant chloroplast (cp) genomes are very conserved and can be divided into four segments, namely two inverted repeat (IRa and IRb) regions, a large single copy (LSC) region, and a small single copy (SSC) region separating IR regions (Wicke et al., 2011; Cui et al., 2021). The expansion or contraction of the IR regions often results in the variation in length of the chloroplast genome (Chung et al., 2006). Compared with the nuclear genome, most chloroplast genomes are characterized by highly conserved sequences, compact size, lack of recombination, and maternal inheritance (Zhu et al., 2017). The characteristic of maternal inheritance enables it to stably retain its characteristics without being affected by the environment. Its structure and sequence information are valuable for revealing species’ origin, evolution, and genetic relationship (Wang et al., 2012; Brock et al., 2022).
According to the published data, eight chloroplast genomes of Rhododendron species have been reported. The published Rhododendron spp. are as follows: R. pulchrum (MN182619, 146,941 bp), R. simsii (MW030509, 152,214 bp), R. delavayi (MN413198, 193,798 bp), R. mole (MZ073672, 197,877 bp), R. platypodum (MT985162, 201,047 bp), R. griersonianum (MT533181, 206,467 bp), R. datiandingense (MW381788, 207,311 bp), and R. kawakamii (MW762686, 230,777 bp) (Shen et al., 2020; Xu et al., 2021; Liu et al., 2020b; Liu et al., 2021; Ma et al., 2021; Liu et al., 2020a; Wang et al., 2021b; Wang et al., 2021a). Considering the numerous Rhododendron species, the cp genome data of Rhododendron spp. are still insufficient. In this study, we combined Illumina and PacBio sequencing technology to assemble and annotate the cp genomes of four Rhododendron species (R. concinnum, R. henanense subsp. lingbaoense, R. micranthum, and R. simsii). These genomes were compared, and phylogenetic analysis of 26 species (18 species of Ericaceae, 5 species of Actinidiaceae, and 3 species of Primulaceae) based on cp genomes was conducted. Our study provides more sequence resources for the phylogenetic research on Rhododendron and a theoretical basis for further clarifying the genetic protection and cp genome evolution of Rhododendron.
Plant material and DNA extraction
Samples of R. concinnum and R. henanense subsp. lingbaoense were collected from the Xiaoqinling National Nature Reserve, Lingbao County, Henan Province, China (110°35′45″E, 34°24′32″N). R. micranthum and R. simsii were collected in the Funiu Mountain District, Luanchuan County, Henan Province (111°50′12″E, 33°41′48″N). The plant specimens in this study have been compared and identified with the National Plant Specimen Resource Center of China and deposited in the herbarium of Luoyang Normal University under accession numbers BOT20200613-BOT20200616.
Total genomic DNA was extracted from fresh leaves using a modified cetyltrimethylammonium bromide (CTAB) method (Li et al., 2013a). The integrity and concentration of DNA were assessed by agarose gel electrophoresis and spectrophotometer, and qualified DNA was used for library construction.
Library construction and sequencing
After DNA isolation, 1 μg of purified DNA was randomly fragmented to 300~500 bp by ultrasound with Covaris M220. The paired-end (PE) libraries were prepared from total genomic DNA using Illumina TruSeq™ Nano DNA Sample Prep Kit. First, the fragmented DNAs were purified, end-repaired, dA-tailed, and index connector ligated with TruSeq™ Kit. Next, PCR amplification was performed to enrich the library. Then, the target band was recovered with 2% Certified Low Range Ultra Agarose. Finally, the resulting libraries were sequenced using Illumina Hiseq 4000 (Borgström et al., 2011), and the sequencing read was 2 × 150 bp. The raw data were filtered to get clean data by removing the joint, low-quality, and error sequences. The process was as follows: Polymerase reads with lengths less than 100 bp and mass less than 0.80 were filtered out, and the subreads were further extracted from the polymerase reads. The adapter sequences and subreads less than 500 bp in length were filtered out. For PacBio single-molecule real-time (SMRT) sequencing, 20-kb DNA inserts libraries were created and sequenced on a PacBio Sequel RSII platform. The PacBio reads were adjusted in accordance with clean Illumina reads using LoRDEC v0.9 (Salmela and Rivals, 2014). The specific parameters and experimental procedures are described in the Li et al. (2020).
Chloroplast genome assembly and annotation
To improve the reliability of assembly, we used two strategies to assemble the cp genomes. In the first strategy, the short clean reads were de novo assembled with GetOrganelle v1.6.4, and potential chloroplast contigs were extracted by aligning against the chloroplast protein-coding genes from the plant chloroplast database of NCBI with BLAST (Jin et al., 2020). Then, the putative long chloroplast reads were baited by mapping the Pacbio long reads to the potential chloroplast contigs using BLASR v5.1 (Chaisson and Tesler, 2012). Finally, the putative long chloroplast reads were assembled by Canu v2.1.1 (Koren et al., 2017). In the second strategy, all Pacbio long reads were assembled de novo by using Canu directly. Subsequently, we used BWA to map the short clean reads to the draft contigs and improved the draft contigs with Pilon v1.22 (https://github.com/broadinstitute/pilon/) (Li and Durbin, 2009). Then, MUMmer 3.23 was used to check whether these contigs were circular (Kurtz et al., 2004). Finally, the corrected contigs obtained from the above two strategies were aligned using MUMmer, and the results show that the two contigs were identical. Through the above steps, the total length and GC content of the genome assembly results were obtained. The chloroplast genes were annotated using the online GeSeq tool to predict protein-coding genes, transfer RNA (tRNA) genes, and ribosome RNA (rRNA) genes (Tillich et al., 2017). After the amino acid sequence of the sample was predicted, it was compared with the known protein databases KEGG (Kanehisa et al., 2006), COG (Tatusov et al., 2003), NR, Swiss-Prot (Magrane, 2011), and GO (Ashburner et al., 2000). The annotation result was obtained by combining the gene with the corresponding functional annotation information. Since there may be more than one alignment result for each sequence, the optimal alignment result is retained as the annotation of the gene to ensure its biological significance. The circular cp genome maps were drawn using OrganellarGenomeDRAW (Greiner et al., 2019).
The relative probability for a specific codon between the synonymous codons encoding the corresponding amino acid reflects the degree of preference for codon usage. We used the software cusp (EMBOSS v6.6.0.0) to calculate Relative Synonymous Codon Usage (RSCU) to obtain the codon preference values. The ratio (ω) of the non-synonymous substitution rate (Ka) to the synonymous substitutions rate (Ks) was used to measure the selective pressure. Pairwise Ka/Ks ratios of the four Rhododendron species were calculated using the concatenated single-CDS alignments with KaKs Calculator 2.0 (Wang et al., 2010).
Repeat sequences and comparative analysis of the cp genomes
The software REPuter was used for long repeat analysis, with parameters set to minimal repeat size of 30 bp and edit distance of 3. The following four repeat types were found: F (Forward), R (Reverse), C (Complement), and P (Palindromic) (Kurtz et al., 2001). Simple sequence repeats (SSRs), also known as microsatellites, are abundant across the genome and are generally composed of 1–6 bp motif as the main repeating unit. SSR analysis was performed on the sequences obtained from the sample assembly using the MIcroSAtellite identification tool (MISA) with the following parameters: 4 repeat units for hexa-, penta-, and tetranucleotides, 5 for tri-, dinucleotides, and 8 for mononucleotides (Beier et al., 2017). The minimum distance between the two SSRs is 100 bp. Finally, the Primer3 software was used to design primers for SSR sequences obtained from MISA recognition (Untergasser et al., 2012).
Comparative analysis was done using the mVISTA program in the Shuffle-LAGAN mode to align the cp sequences (Frazer et al., 2004). The software DnaSP V5.10 was used to analyze the nucleotide variability (Pi) of coding genes and non-coding regions to reveal divergent hotspot regions of the cp genomes (Librado and Rozas, 2009). The parameters were set as window length = 300 bp, step size = 200 bp.
The annotated information (boundaries of LSC, SSC, IRs regions, and the genes near each boundary) were mapped on the simplified chloroplast genome structure maps by Adobe Illustrator CS5 software (Adobe Systems, San Jose, CA) to compare the cp genomes, and to show the extent of the degree of IR expansion and contraction.
A total of 26 complete chloroplast genome sequences (including the four species we sequenced) under Ericales were downloaded from the National Center for Biotechnology Information (NCBI) for the phylogenetic analysis. Nucleotide sequences of the 26 cp genomes were aligned using MAFFT (v7.313) software (Katoh et al., 2019), and the results were used to construct a phylogenetic tree using MEGA 11 (Tamura et al., 2021). The phylogeny was examined by the Bootstrap method with 1000 replications.
Characteristics of the chloroplast genomes
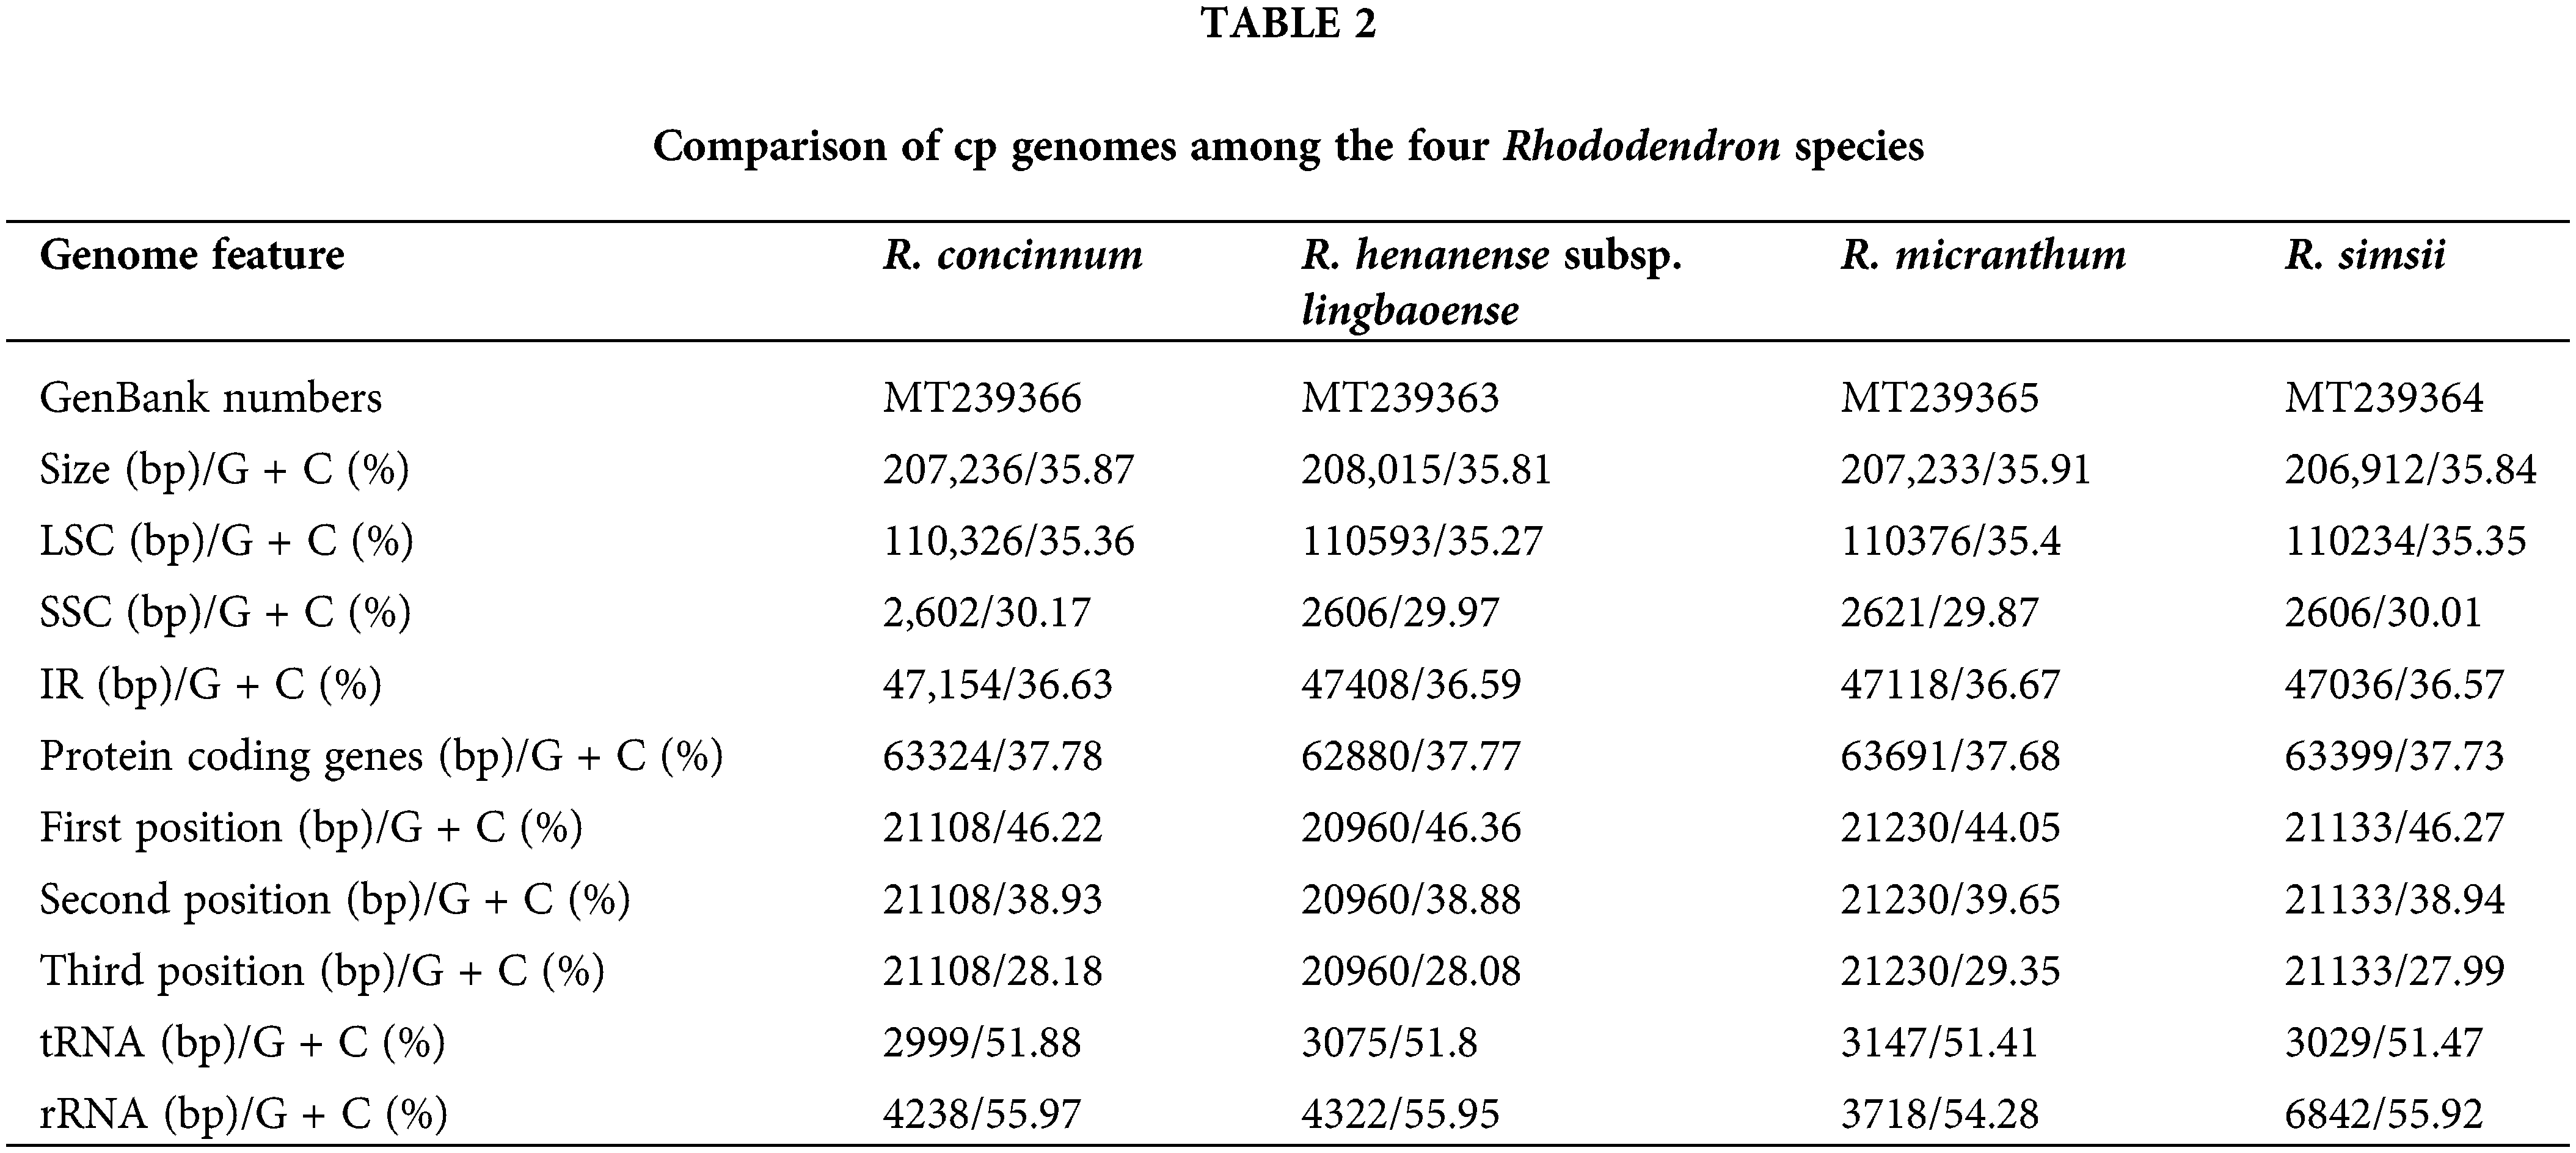
The Illumina sequencing clean data of the four Rhododendron species (R. concinnum, R. henanense subsp. lingbaoense, R. micranthum, and R. simsii) were 4.6, 6.0, 6.0, 4.3 Gb respectively, and PacBio sequencing data were 6.7, 6.5, 6.9 and 7.3 Gb, respectively, of which the maximum read length is 118,991 bp (Table 1). The total cp genome sizes of the four Rhododendron plants were 207,236, 208,015, 207,233, and 206,912 bp, respectively. The resulting cp genomes of the four Rhododendron plants, R. concinnum (MT239366), R. henanense subsp. lingbaoense (MT239363) (Zhou et al., 2021), R. micranthum (MT239365), and R. simsii (MT239364) have been deposited in the NCBI. As with most flowering plants, the cp genomes of the four Rhododendron species all have a circular and quadripartite structure, consisting of a pair of IRs (47154, 47408, 47118, 47036 bp) and two single-copy regions (LSC: 110326, 110593, 110376, 110234 bp; SSC: 2602, 2606, 2621, 2606 bp), as shown in Fig. 1 and Table 2. The GC content of the four genomes ranges from 35.81% to 35.91%.
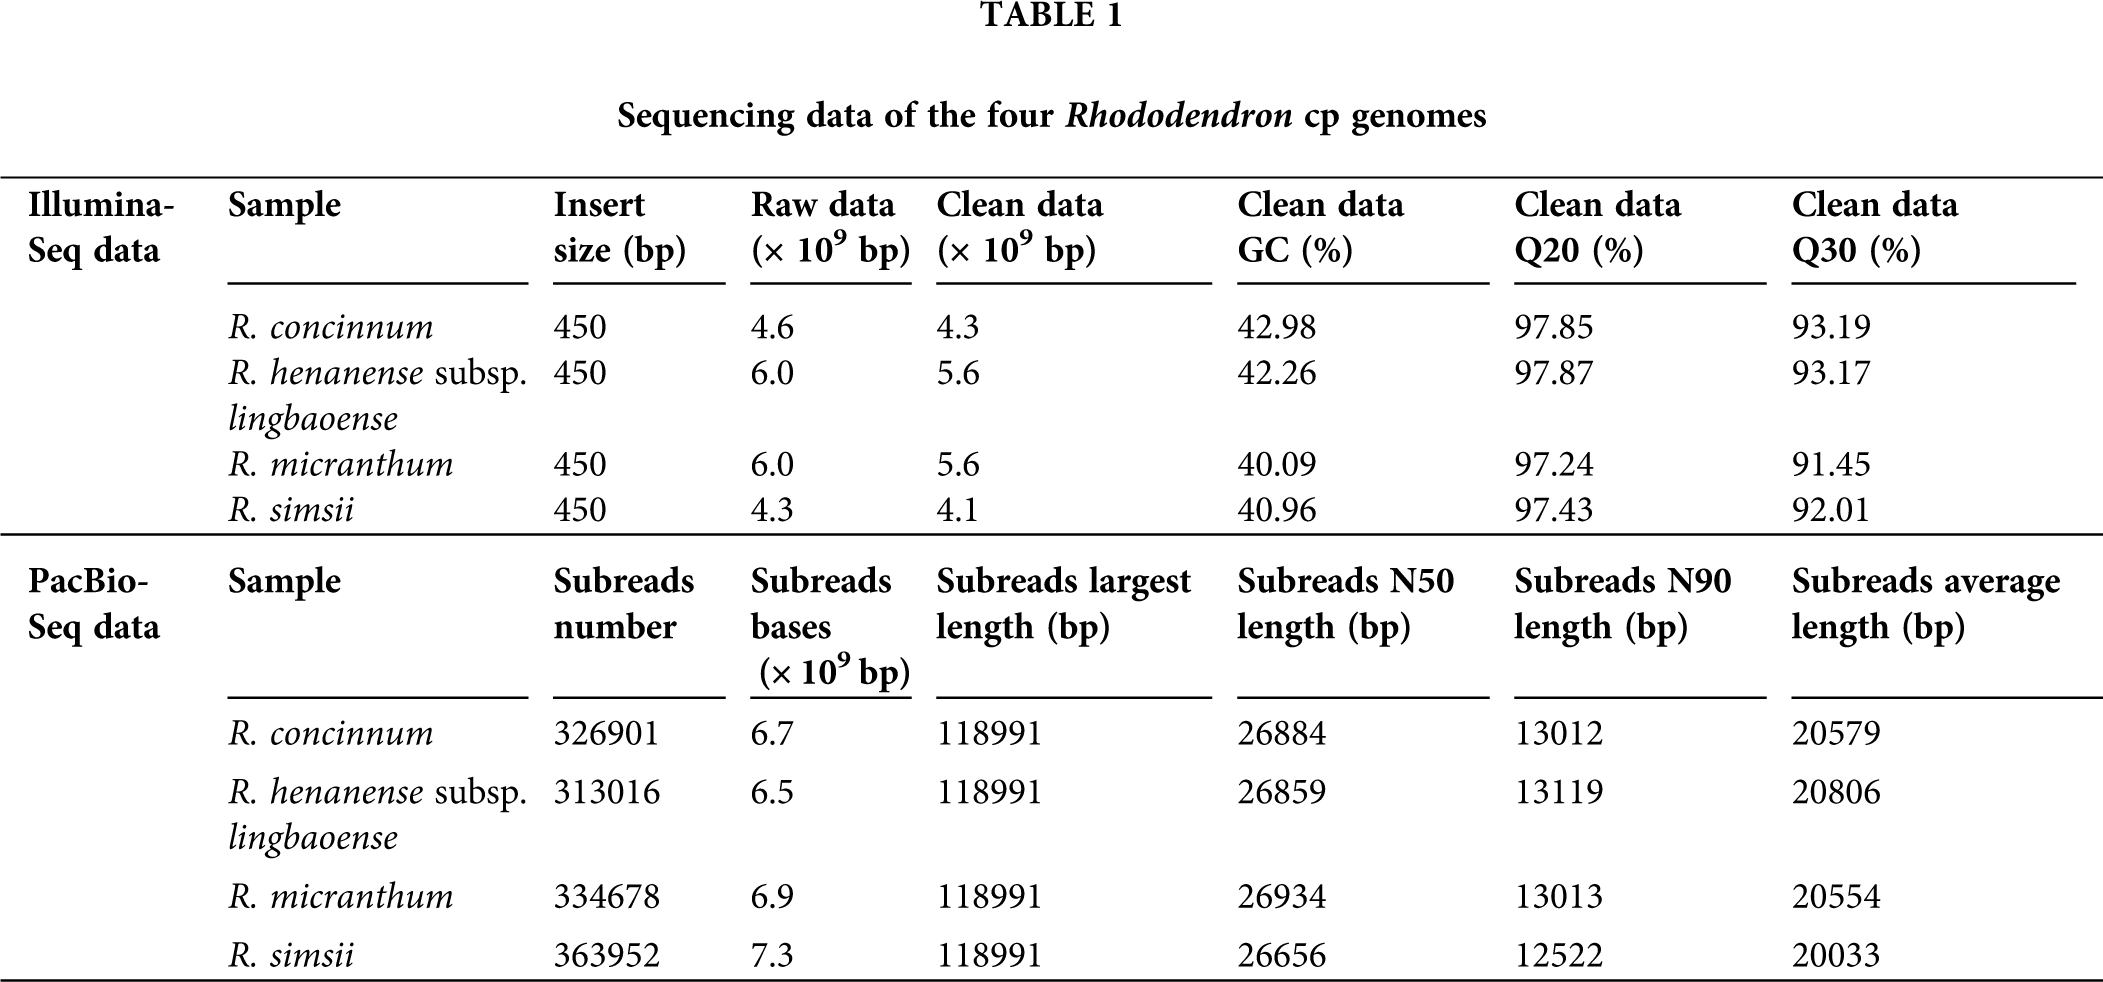
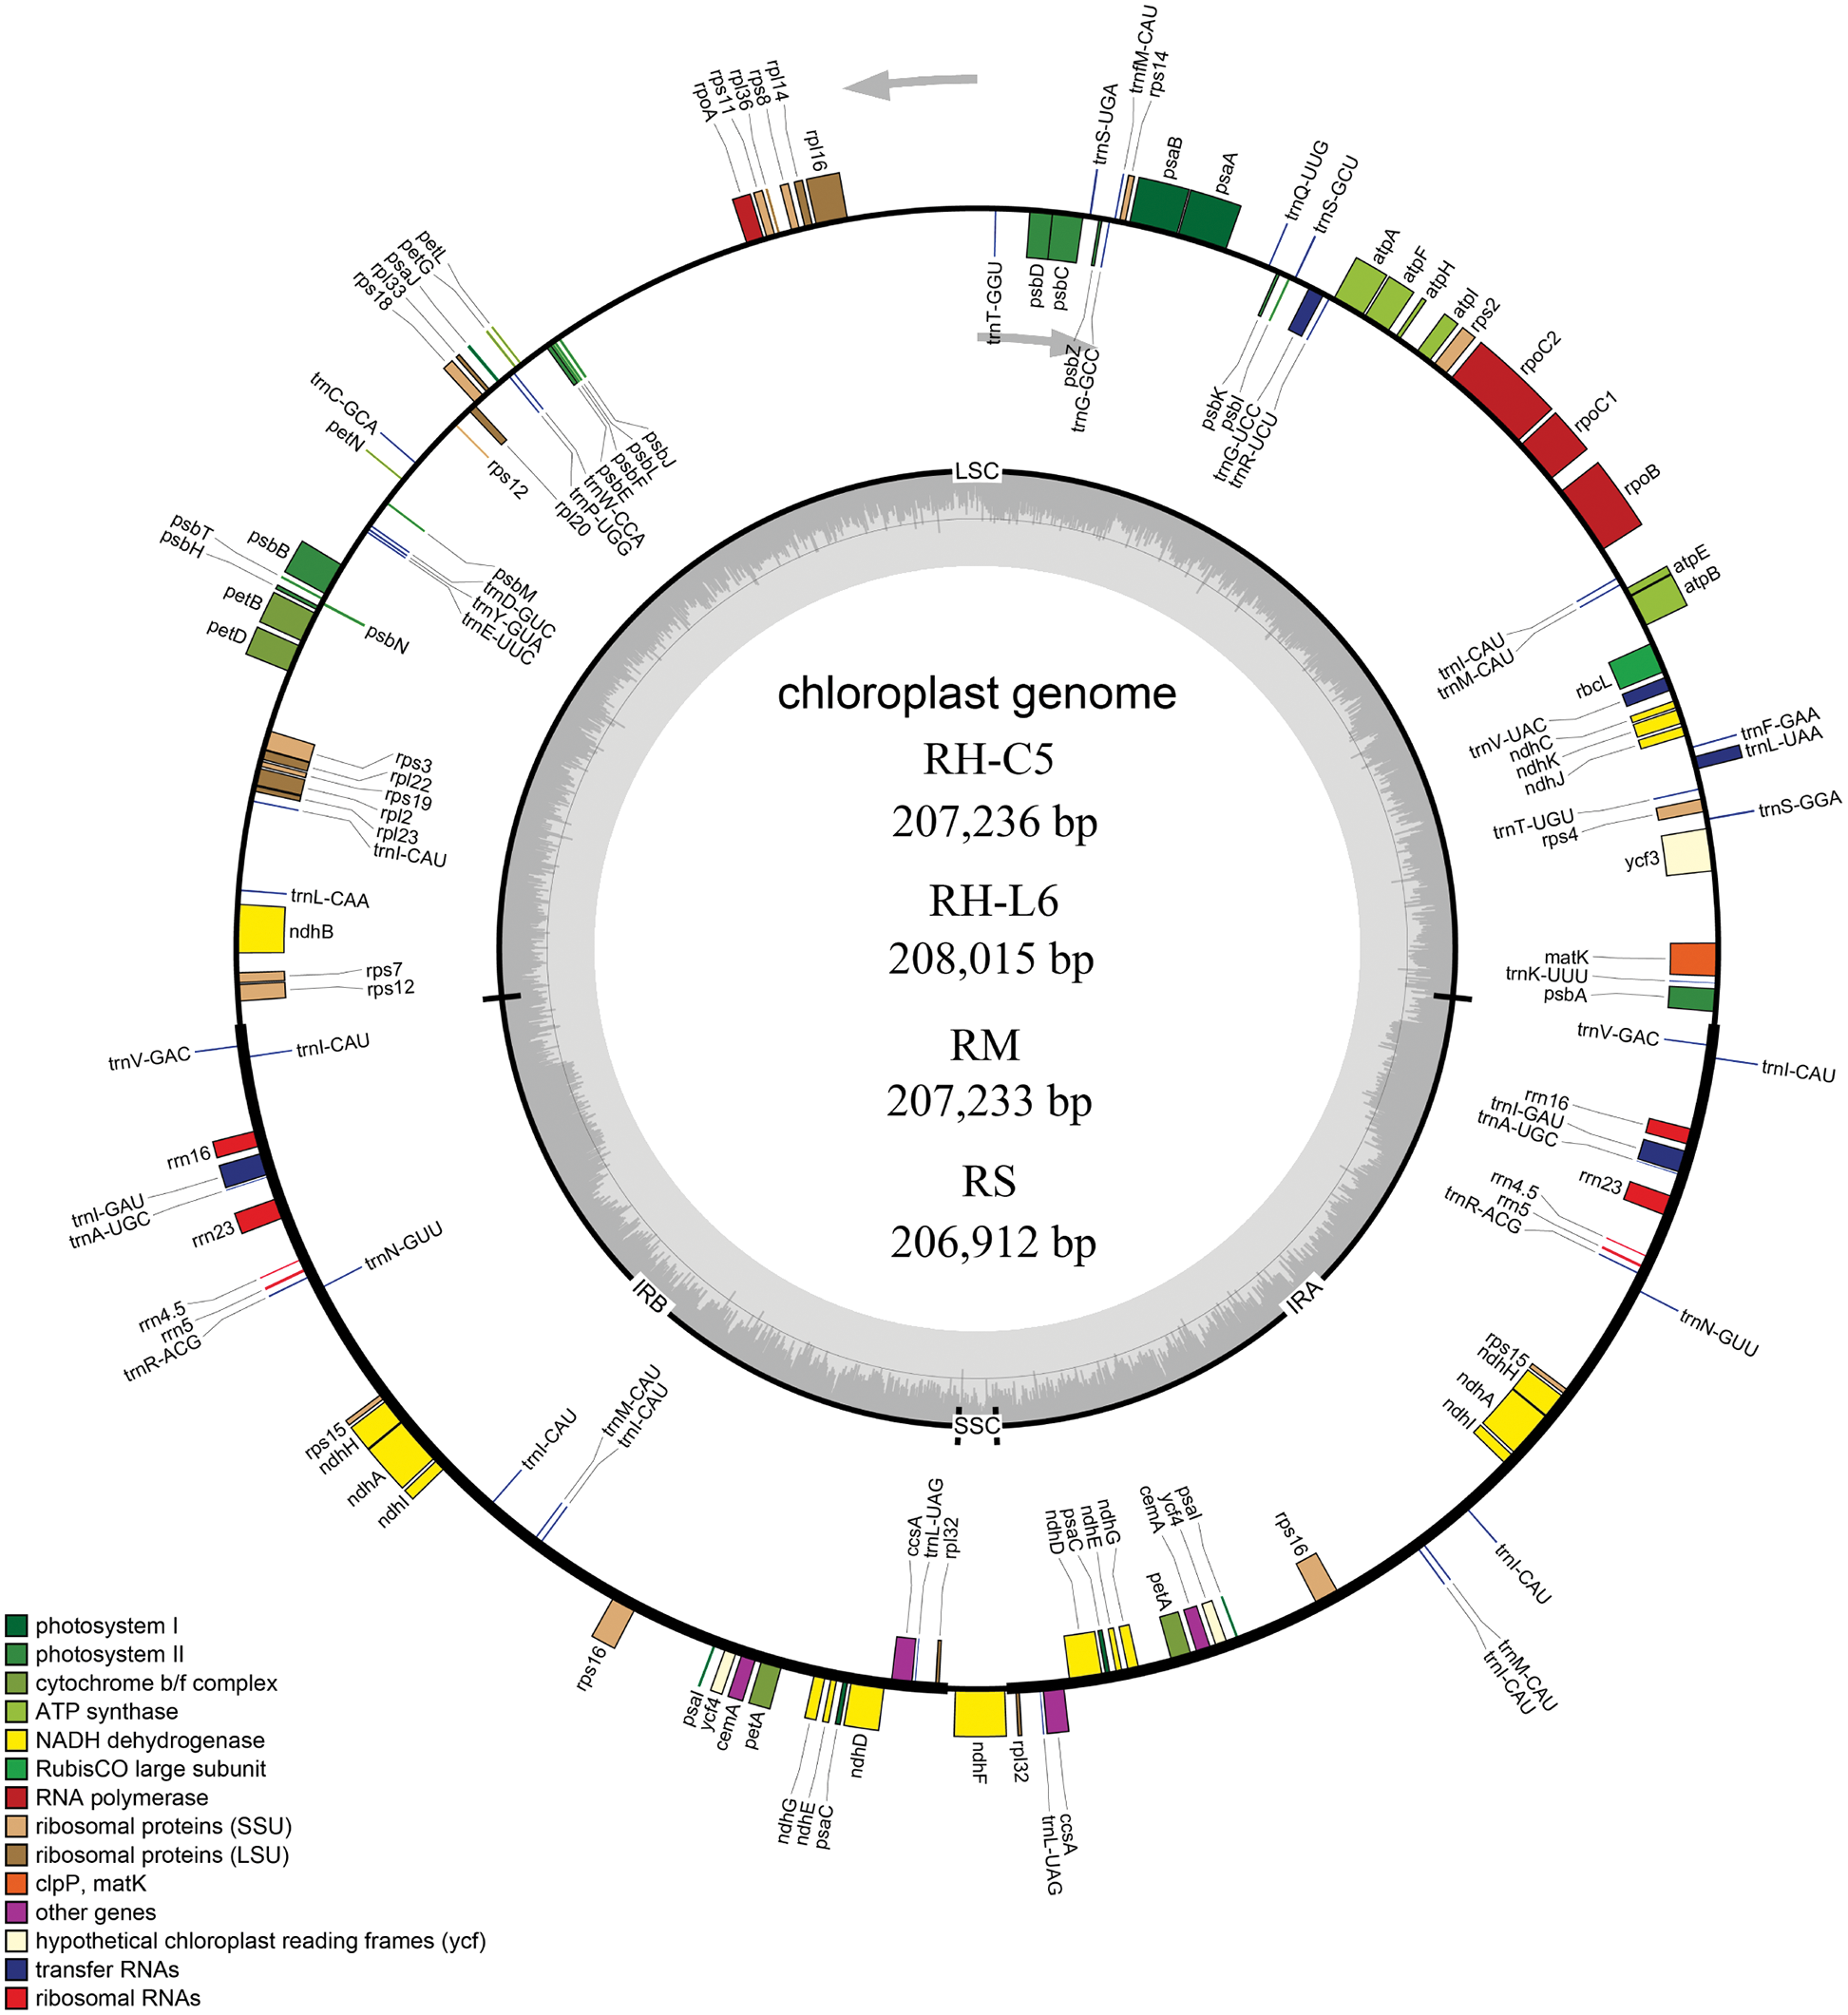
Figure 1: Genetic map of four Rhododendron cp genomes. RH-L6, RH-C5, RM, and RS were R. henanense subsp. lingbaoense, R. concinnum, R. micranthum, and R. simsii respectively. Genes outside and inside the outer circle are transcribed in the direction of the gray arrows. Genes are divided into 14 groups according to their biological functions and are shown by different colored boxes. In the inner circle, dark gray denotes GC content and light gray denotes AT content.
There were few differences in the number and types of genes in the four Rhododendron cp genomes. There were 93 genes in the R. concinnum cp genome, consisting of 59 protein-coding genes and 30 tRNA genes. There were 58 protein-coding genes in the cp genomes of R. henanense subsp. lingbaoense and R. micranthum, and 59 protein-coding genes in the cp genome of the R. simsii. There were four rRNA genes (rrn16, rrn23, rrn4.5, and rrn5) in all three genomes. Out of these genes, the protein coding sequence (CDS) region of the rpoC2 gene was the largest, while that of the trnK-UUU gene was the smallest.
The number of codons of the four Rhododendron species was 21,133, 21,184, 21,108, and 20,906, respectively. Out of these codons, ATT (972/977/972/964) encoding isoleucine (Ile) and TAG (18/17/20/19) encoding termination codons were the most and the least used in the four species, respectively. Except for methionine (Met, codon: ATG) and tryptophan (Trp, codon: TGG), all the amino acids are compiled by multiple codons, as shown in Fig. 2. There are six synonymous codons for serine (Ser), leucine (Leu), and arginine (Arg); four synonymous codons for each of alanine (Ala), proline (Pro), glycine (Gly), threonine (Thr), and valine (Val); three synonymous codons for each of isoleucine (Ile) and stop codons. The remaining nine amino acids all have two synonymous codons. Except that the synonymous codon of leucine and serine is mutated at both the first and third sites, the synonymous codons of other amino acids are usually mutated at the third position for reducing harmful mutations.
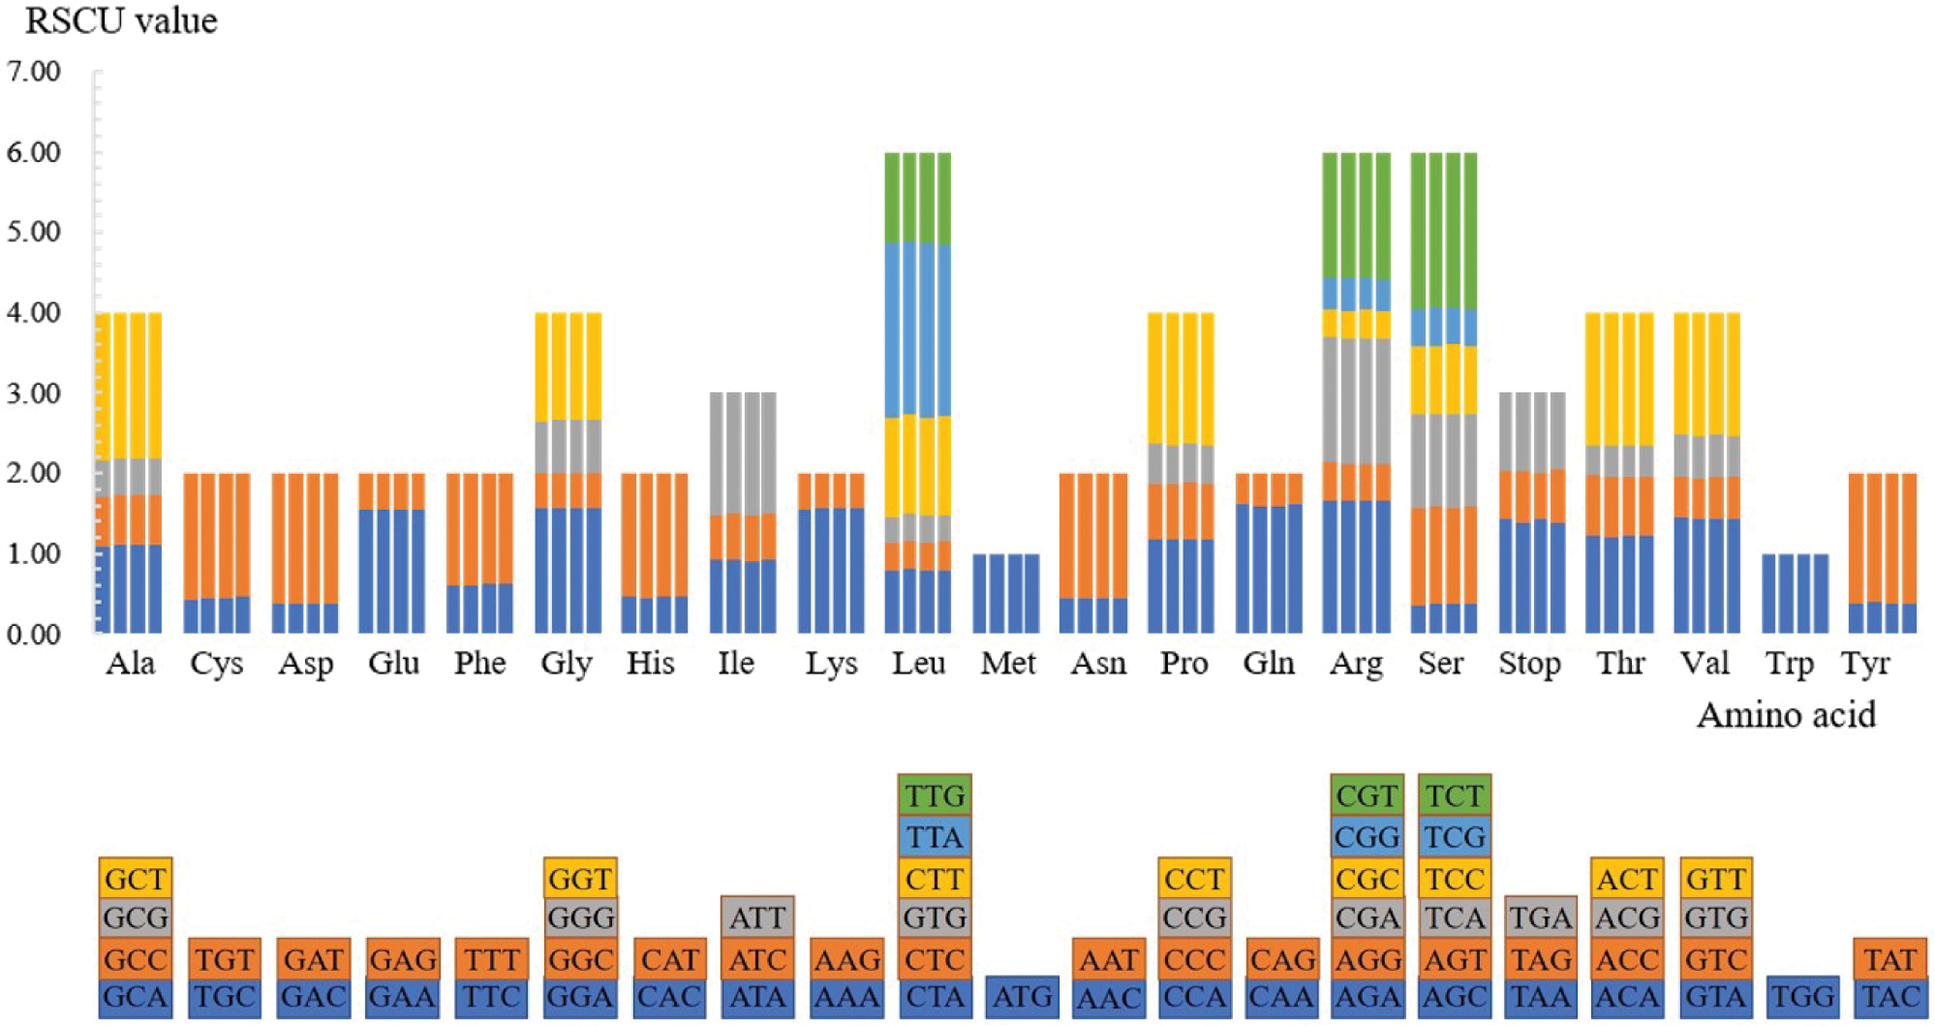
Figure 2: Codon content for the CDS in the four Rhododendron cp genomes. The X-scale axis denotes the 20 amino acids and terminators, and the Y-scale axis denotes the RSCU value. For each amino acid, the corresponding species from left to right are as follows: R. simsii, R. henanense subsp. lingbaoense, R. micranthum and R. concinnum. The different color of each amino acid corresponds to the codon of the same color below.
Introns can increase the exogenous gene expression levels at plant sites and play a vital part in the regulation of gene expression. A total of 20 genes containing introns were observed in the four Rhododendron cp genomes, among which 18 contained one intron and 2 (ycf3 and rps12) contained two introns. The intron of the rps12 gene was the longest, and rps12 is a trans-spliced gene. Specifically, in the cp genomes of the four Rhododendron species, both 5′ and 3′ end of the rps12 gene were in the LSC region.
Repeat sequences and SSR analysis
Long and complex repeats may play an important role in the rearrangement and recombination of cp genomes (Ogihara et al., 1988; Weng et al., 2014). The results showed that there were no reverse repeats and complement repeats among these four Rhododendron plants. There were 341 forward repeats and 299 palindromic repeats, consisting of 83/77, 89/71, 86/74, and 89/71 forwarding repeats and palindromic repeats, respectively. The details of the different sizes of the repeat areas are shown in Fig. 3. Most of the repeats were found in the non-coding region, some in the trnI-CAU coding region, and a few in the interval between ndhI and trnI-CAU. Tandem repeats were also observed in the four cp genomes (45 in R. concinnum, 48 in R. henanense subsp. lingbaoense, 46 in R. micranthum, and 51 in R. simsii). The detailed cp genomes’ repeat sequences of the four Rhododendron species are presented in Suppl. Table S1.
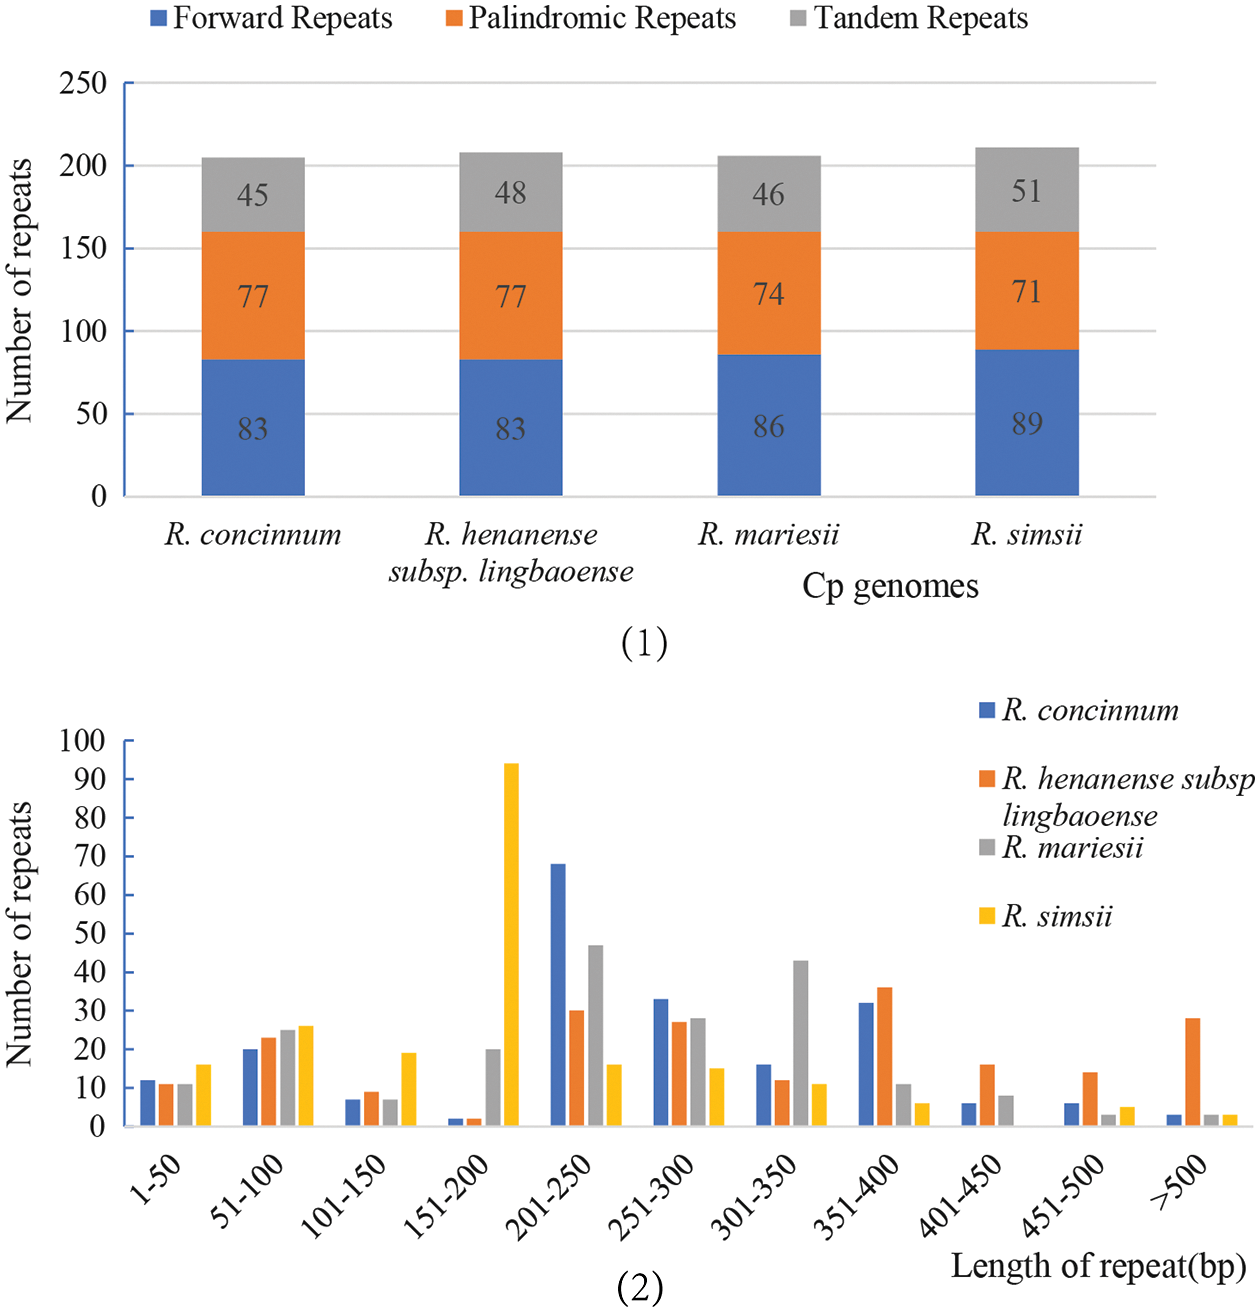
Figure 3: The repeat types of the four Rhododendron cp genomes. (1) The number of three repeat types; (2) The number of repeats of different lengths.
Repeat sequences and SSR analysis
Long and complex repeats may play an important role in the rearrangement and recombination of cp genomes (Ogihara et al., 1988; Weng et al., 2014). The results showed that there were no reverse repeats and complement repeats among these four Rhododendron plants. There were 341 forward repeats and 299 palindromic repeats, consisting of 83/77, 89/71, 86/74, and 89/71 forwarding repeats and palindromic repeats, respectively. The details of the different sizes of the repeat areas are shown in Fig. 3. Most of the repeats were found in the non-coding region, some in the trnI-CAU coding region, and a few in the interval between ndhI and trnI-CAU. Tandem repeats were also observed in the four cp genomes (45 in R. concinnum, 48 in R. henanense subsp. lingbaoense, 46 in R. micranthum, and 51 in R. simsii). The detailed cp genomes’ repeat sequences of the four Rhododendron species are presented in Suppl. Table S1.
A total of 338, 351, 331, and 325 SSRs were observed in the R. concinnum, R. henanense subsp. lingbaoense, R. micranthum, and R. simsii cp genomes, respectively. The number of different repeat units of different SSR types in the four Rhododendron cp genomes is given in Suppl. Table S2. In the four cp genomes, the number of mono-, di-, tri-, tetra-, penta- and hexa-nucleotide SSRs were 232/17/70/16/2/1, 245/18/68/16/3/1, 229/18/64/19/0/1, and 226/13/65/16/4/1, respectively.
Comparative analysis of the cp genomes
Analysis of the chloroplast genomic polymorphisms showed that the SSC region had the highest nucleotide polymorphism (0.10), followed by the IR region (0.083), as shown in Fig. 4. The Pi values also proved that there was moderate sequence differentiation in the cp genomes of Rhododendron. Polymorphic analysis of the four cp genomes showed that the IR region was more conservative than the LSC and SSC regions, and there were more variations in the latter two regions. Highly divergent regions appear in the IGSs (intergenic spacers) of these cp genomes, including ycf3-matK, atpE-rpoB, psbK-psaA, trnT(GGU)-rpl16, rpoA-psbJ, rpl23-trnL(CAA) and rps7-ndhB in the LSC region; and ndhI-psaI, rps16-trnI(CAU), rps16-psaI, trnM(CAU)-ndhI, rps15-trnR(ACG) and trnV(GAC)-rrn16 in the IR region (Suppl. Fig. S1). Some divergences were also observed in the coding regions of the ndhF gene located in the SSC region in the four cp genomes.
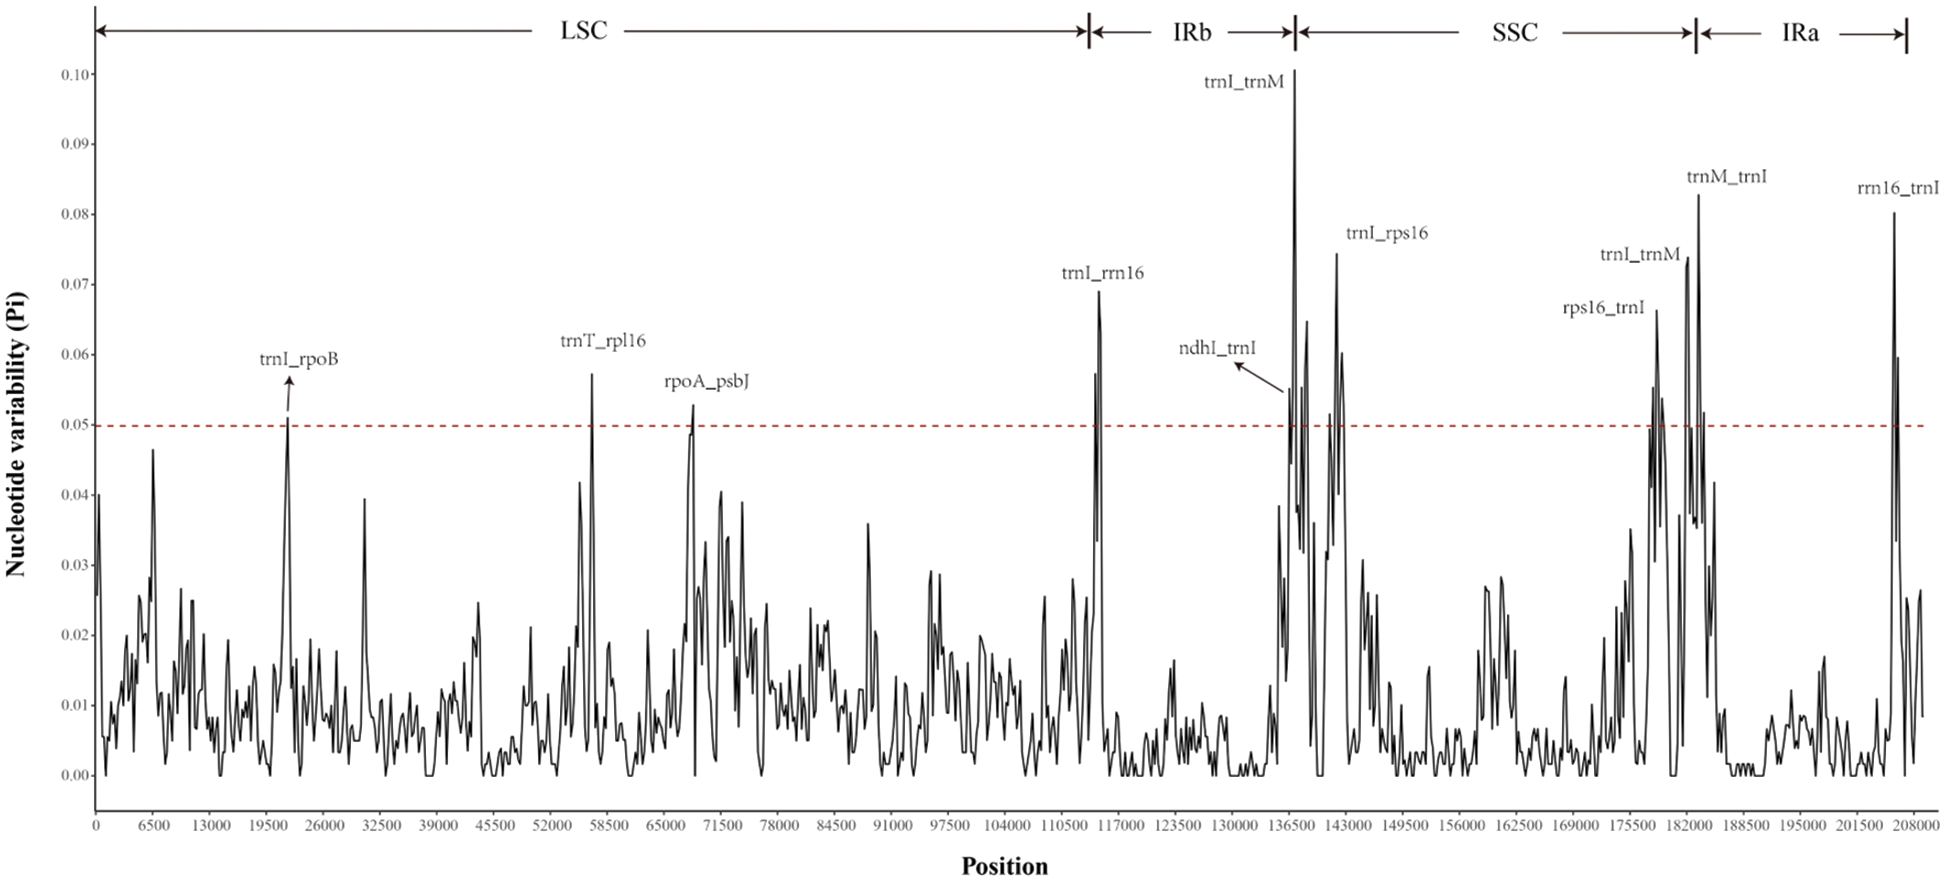
Figure 4: The distribution curve of Nucleotide variability (Pi) values. The X-scale axis represents the genomic coordinate, and the Y-scale axis represents the value of Pi. The red dotted line indicates the threshold boundary, and regions above the dotted line are genomic variation hotspots.
The contraction and expansion of the IRs is a common evolutionary phenomenon in plants (Henriquez et al., 2020). To explore the potential contraction and expansion of IR boundaries, the IR and SC boundaries of Rhododendron plants were compared. The results show that the IR length, the gene content, and the structure of the IR/SC boundary remained distinct and different (Fig. 5). The IR region of Rhododendron spp. was highly variable, ranging from 951 −47,467 bp, with the smallest being R. pulchrum and the largest being R. griersonianum. Among the 12 Rhododendron spp., seven had SSC regions of approximately 2,600 bp in size. The R. molle had the shortest SSC region of 26 bp, and R. simsii (MW030509) had the largest of 69,783 bp. The position of rps12 and rpl32 is relatively fixed, and the rps12 gene spacers extend into the LSC region by different lengths depending on the genome (R. micranthum 1011 bp, R. henanense subsp. lingbaoense 1005 bp, and R. concinnum 1013 bp). The psbA gene is 543, 547, 553, and 556 bp away from JLA junction toward the LSC side in R. concinnum, R. micranthum, R. henanense subsp. lingbaoense, and R. simsii (MT239364) respectively. The ndhF gene is 309, 311, 309, and 306 bp away from JSB junction toward the SSC side and 53, 66, 53, and 52 bp away from JSA junction toward the SSC side in R. simsii, R. micranthum, R. henanense subsp. lingbaoense and R. concinnum, respectively. However, in R. kawakamii and R. mole, the ndhF gene is located exclusively in the IR region.
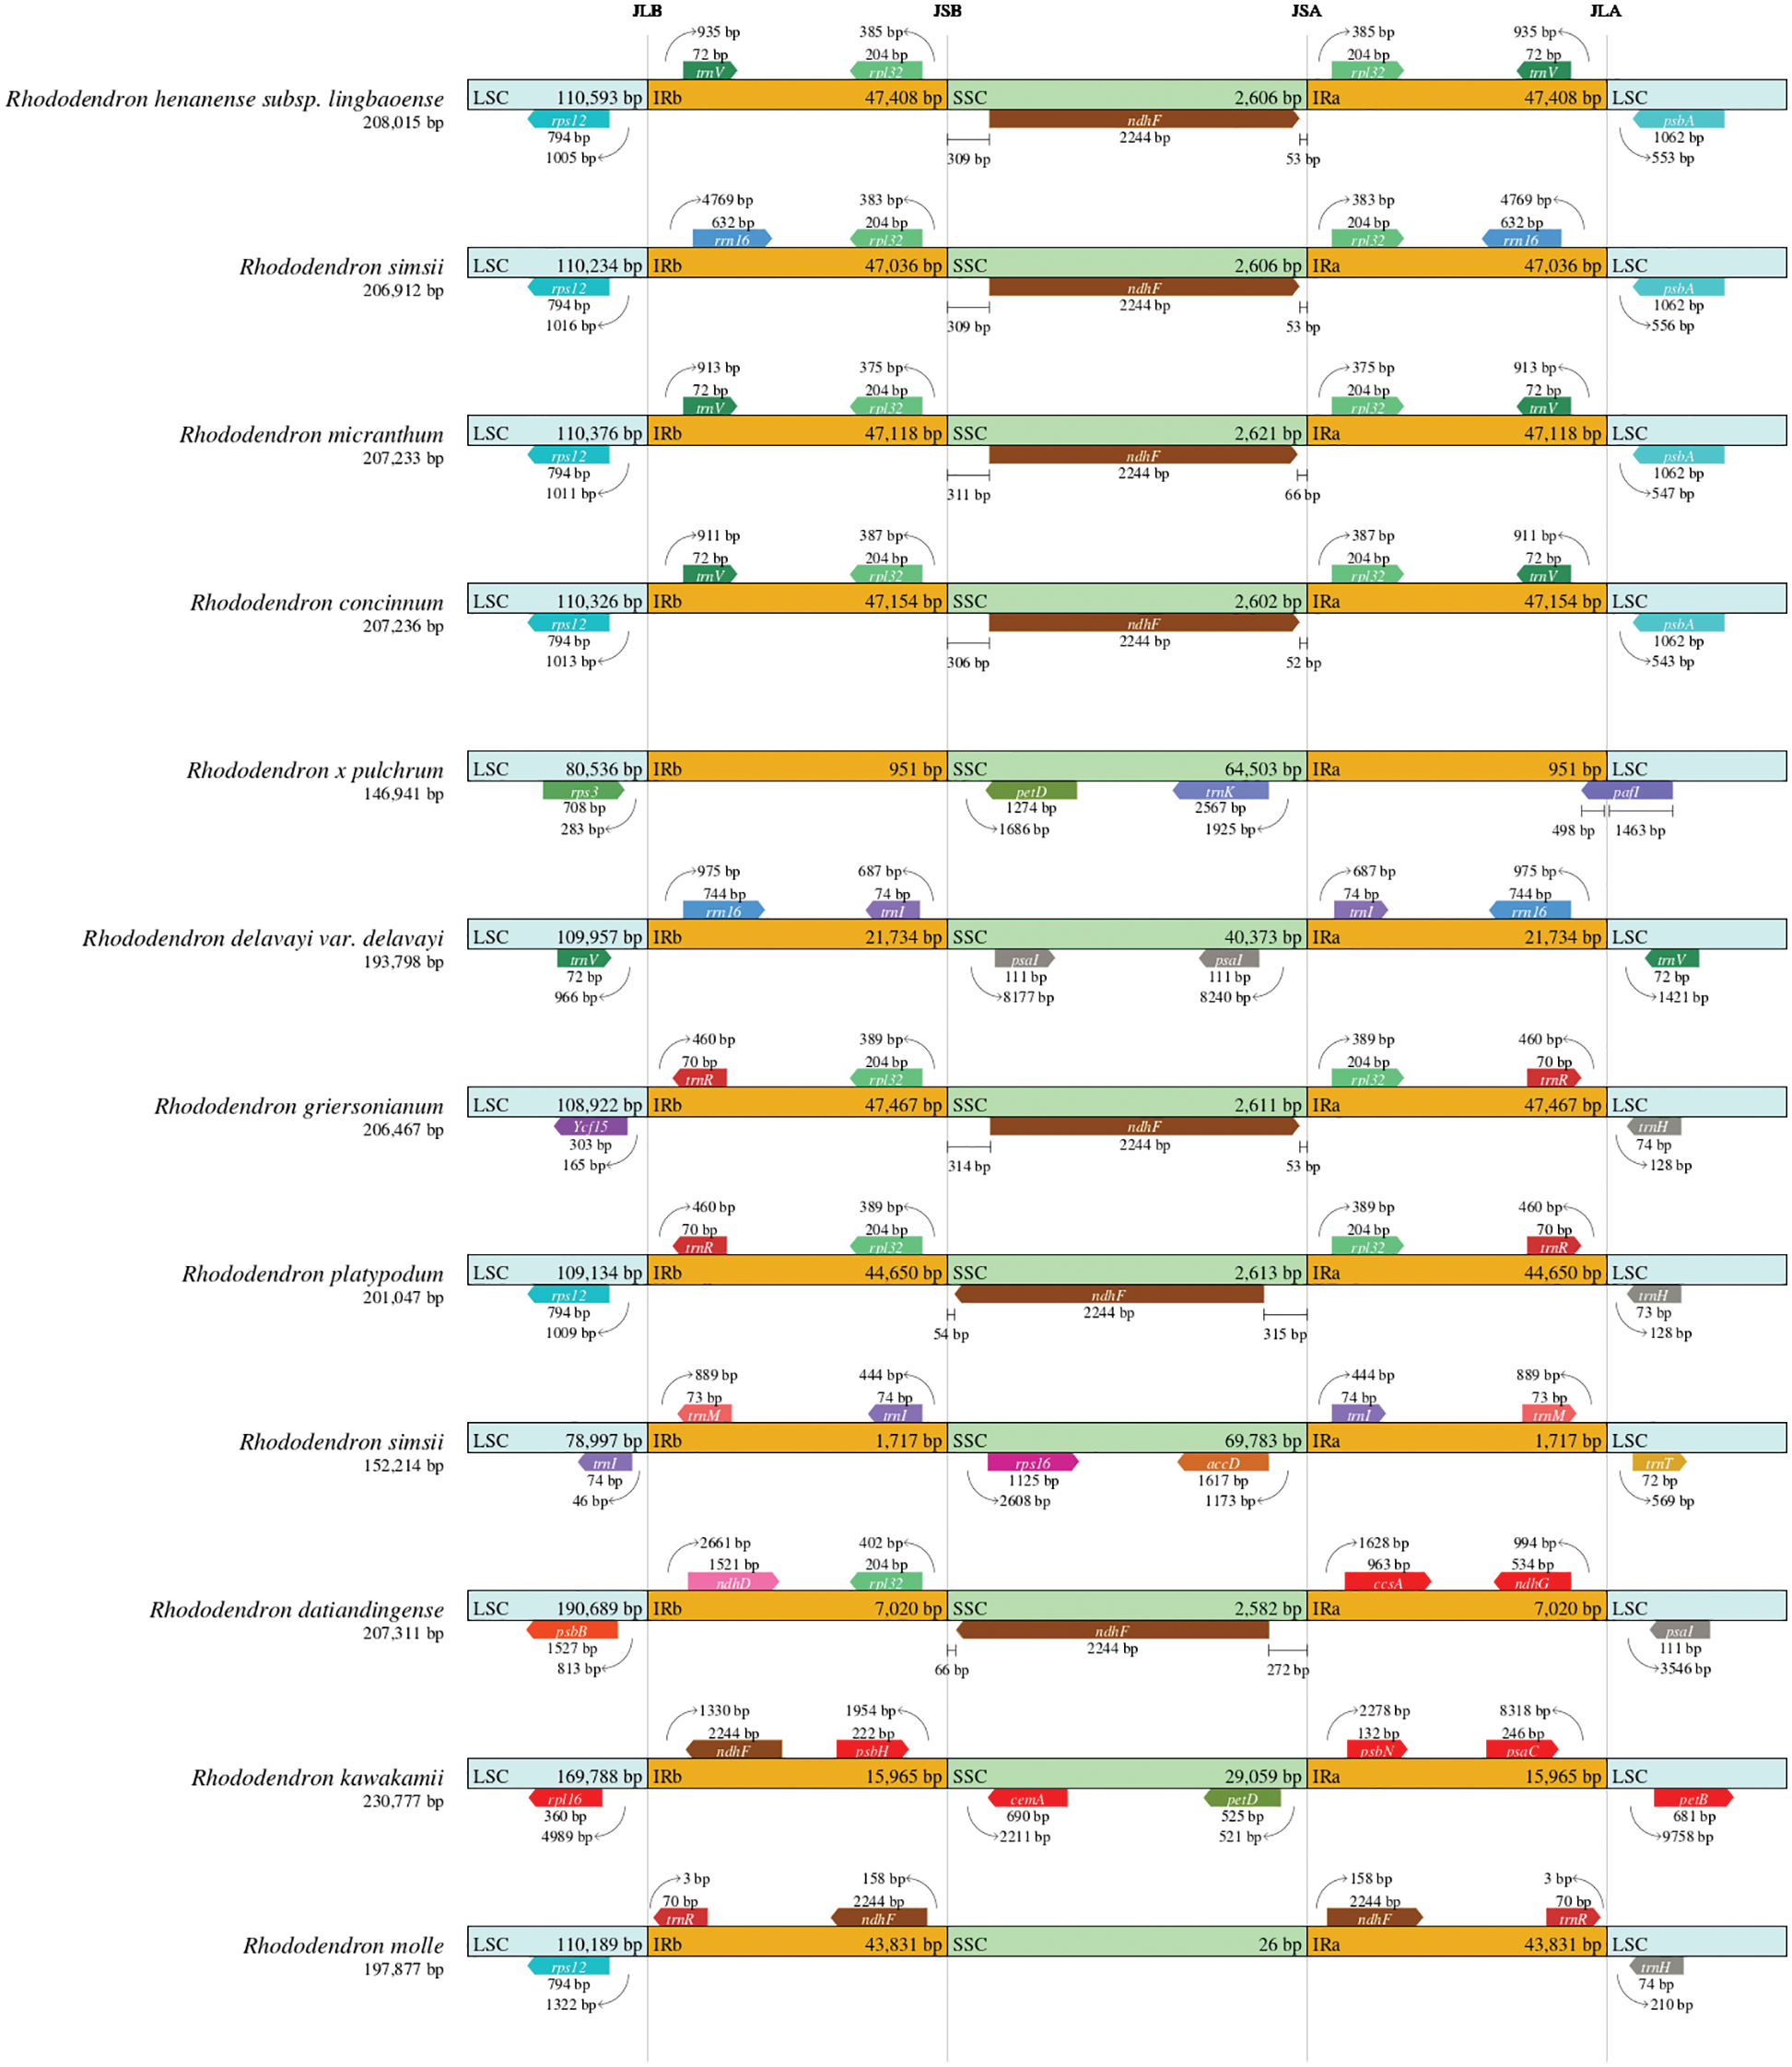
Figure 5: Comparison of the LSC, IR, and SSC border regions among the 12 Rhododendron chloroplast genomes.
The ω = dN/dS (Ka/Ks), the ratio of non-synonymous (Ka) to the synonymous (Ks) mutation, is used to describe whether there is selection pressure on a protein-coding gene. Ka/Ks ratios (ω) are categorized with 0 < ω < 1, ω = 1, and ω > 1 denoting negative or purifying selection, neutral evolution, and positive selection, respectively. Positive selection (ω > 1) means some favorable mutations are being selected. When 0 < ω < 1, the smaller the ω value is, the greater the negative selection pressure is, and the more conservative the amino acid sequence is. Ka/Ks values of 70 common protein-coding genes in the four species of Rhododendron were calculated between two species, 152 effective values were obtained (Suppl. Table S3), and the rest were invalid due to Ks = 0. The results showed that the ω-values of atpF, cemA, ndhG, rpl14, rpl16, rpl22, and rps14 were all greater than 1 in each species pair, and they were all positively selected. One or two species pairs of ω > 1 were found in ccsA, ndhD, ndhJ, ndhK, rpl14, rps11, rps15, rps16, rps19, rps2, rpl2, and rpoB, suggesting that these genes were positively selected in Rhododendron. The ω values of ndhD in R. concinnum-R. henanense subsp. lingbaoense and R. concinnum-R. simsii were 50 and 1.151, respectively. The ω values of rpl2 in R. concinnum-R. micranthum and R. concinnum-R. simsii were 1.092 and 1.087, respectively. The ω value of rpoB was 1.297 (>1) only in R. concinnum-R. henanense subsp. lingbaoense.
A phylogenetic tree based on 18 Ericaceae, 5 Actinidiaceae, and 3 Primulaceae cp genomes was conducted using the maximum likelihood (ML) method, with three Primulaceae species (Maesa Montana, Aegiceras corniculatum, and Embelia vestita) as the outgroup, as shown in Fig. 6. The number above any given branch of the tree indicates confidence, and the closer the value is to 100, the higher the confidence. As the Figure shows, R. delavayi and R. henanense subsp. lingbaoense, R. kawakamii, and R. datiandingense, and two R. simsii (MT239364 and MW030509) are clustered together separately. The twelve Rhododendron species are clustered with Vaccinium, Gaultheria, and Arbutus to represent the Ericaceae.
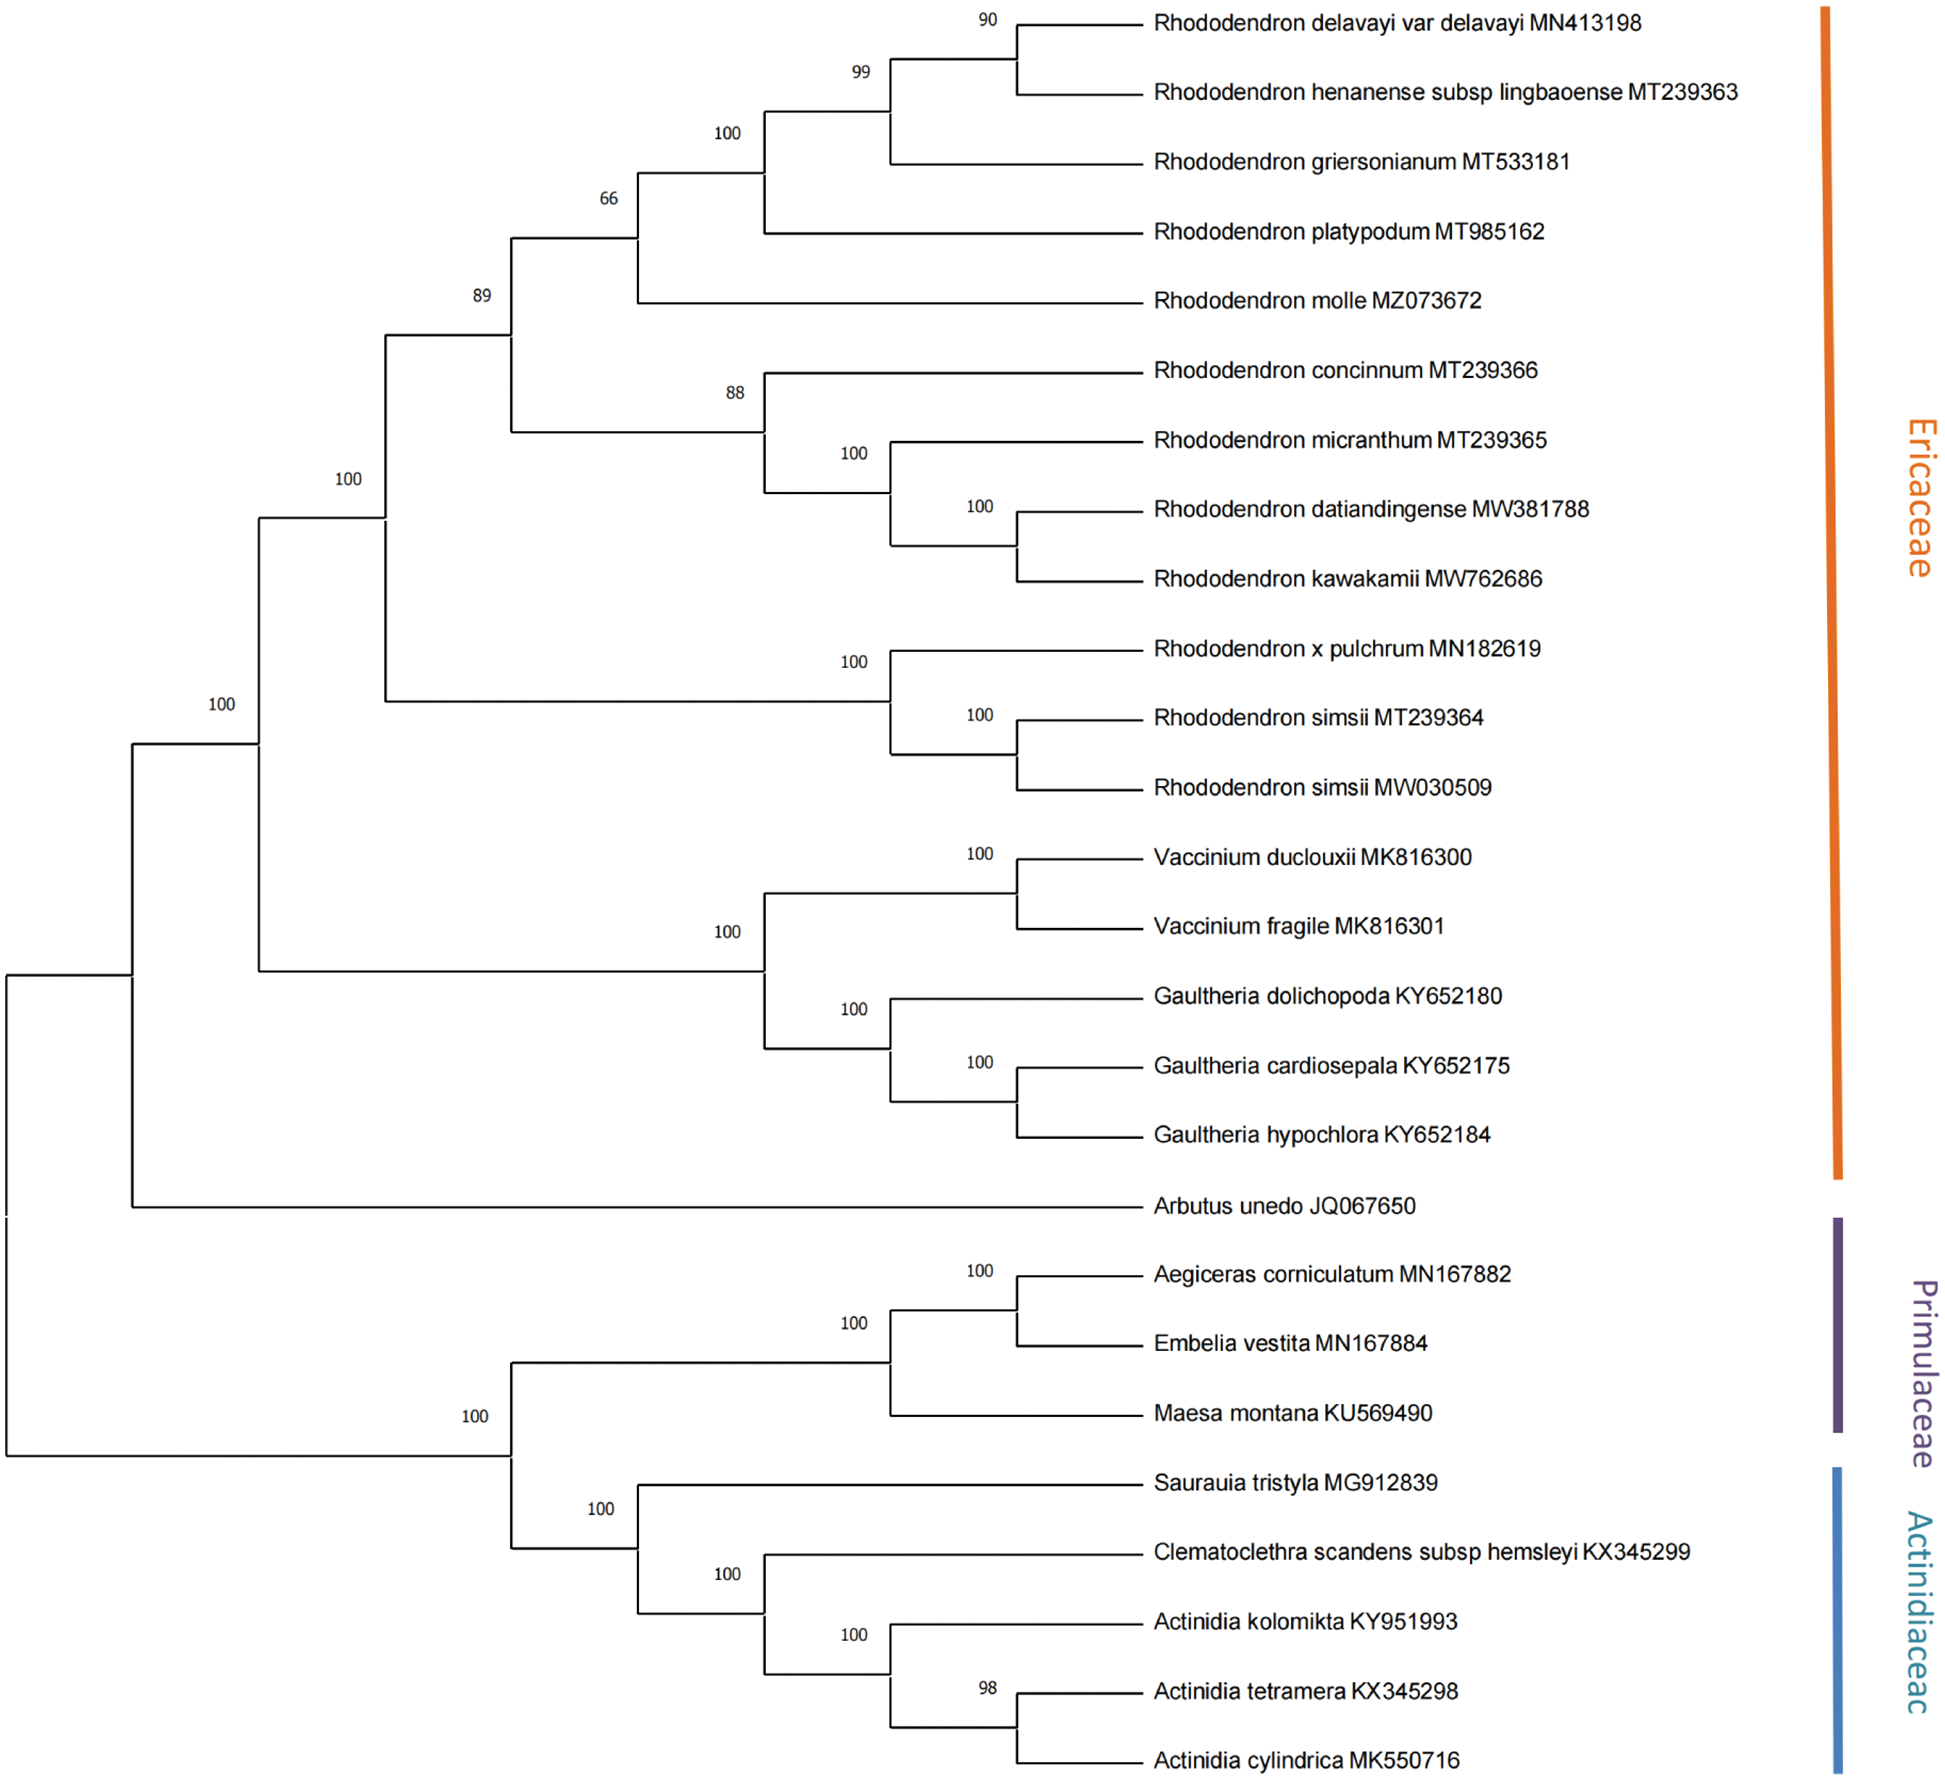
Figure 6: Phylogenetic tree reconstruction containing the cp genomes of 26 species.
As with most flowering plants, the cp genomes of the four Rhododendron species all have circular and quadripartite structures. Due to four rRNA genes distributed in IRs, the GC content in the IR regions (36.57%–36.67%) was higher than that in the LSC region (35.27%–35.4%) and SSC regions (29.87%–30.17%). Like other terrestrial plants, AT content in the four cp genomes is higher than that of GC (Li et al., 2013b; Vining et al., 2017; Liang et al., 2019). In the CDS region of the chloroplast genome, the GC contents of the four species of Rhododendron are 46.22%/46.36%/44.05%/46.27%, 38.93%/38.88%/39.65%/38.94%, and 28.18%/28.08%/29.35%/27.99% at the first, second, and third codon positions, respectively (Table 2). AT preference at the third codon position in these cp genomes also appears in other angiosperms (Guo et al., 2017; Lu et al., 2016).
SSRs are extensively distributed in different locations of the genome (Zhou et al., 2015; Asaf et al., 2017; Zhou et al., 2022). The cp genome is uniparental inheritance, and SSRs have a high level of variation within the same species. Therefore, cp SSRs have a broad range of applications as molecular markers in the study of mapping, target gene calibration, and genetic map construction (Yin et al., 2017; Zhou et al., 2018; Yu et al., 2020). The results showed that the main SSR type of Rhododendron was mononucleotide. The vast majority of SSRs were A/T type, and the polymeric A/T was far more than the polymeric G/C, which was also reported in Rehmannia, Primula, and Salvia (Zeng et al., 2017; Zhou et al., 2016; Liang et al., 2019). The cp SSRs found in the four Rhododendron species are more than have been reported for other Ericaceae species (Shen et al., 2020). These cpSSR markers offer an alternative to nuclear DNA markers and morphological features in defining Rhododendron subsections. The cpSSRs obtained in this study can be applied to genetic structure determination, as well as the diversity, differentiation, and maternity studies of Rhododendron and related species.
Identity plot comparing the chloroplast genomes of the 12 Rhododendron species was obtained using mVISTA. As shown in the Figure (Suppl. Fig. S1), these cp genomes exhibited moderate differentiation, with the coding regions being more conserved than the non-coding regions. It is worth noting that the R. simsii cp genome (MW030509, 152,214 bp) previously published is not consistent with our study (MT239364, 206,912 bp). The comparison by mVISTA revealed that the two differed significantly in the IR region as well as the non-coding region. Previous studies have shown that the plastid genome sizes of rhododendrons vary greatly even among closely related species (Li et al., 2020). These findings further confirm the complexity of Ericaceae plastid genomes. Comparative analysis indicated that there was no rearrangement in the four Rhododendron cp genomes, showing a collinear relationship. The non-coding and SC regions exhibited more variation than the coding regions and IR regions. The result that coding regions are more conserved than non-coding regions has also been shown in the studies of Acanthoideae, Symplocos, Phaseolus, and Calycophyllum (Alzahrani et al., 2020; Kim et al., 2021; Tian et al., 2021; Saldaña et al., 2022).
The phylogenetic tree is used to describe the evolutionary relationships among species that share a common ancestor. It has been reported that, R. delavayi and R. henanense subsp. lingbaoense belong to the Subgen. Hymenanthes and Sect. Ponticum; R. concinnum and R. micranthum belong to the Subgen. Rhododendron and Sect. Rhododendron; R. pulchrum and R. simsii belong to the Subgen. Tsutsusi and Sect. Tsutsusi (Fang et al., 2005). This is consistent with our findings and validates the reliability of the chloroplast genomes sequencing results.
In this study, four Rhododendron species (R. henanense subsp. lingbaoense, R. simsii, R. concinnum, and R. micranthum) cp genomes were reported. Comparative analysis indicated that the non-coding and SC regions exhibited more variation than the coding regions and IR regions. The variation in genome size is mainly due to the contraction of the IR/SC boundaries. The data obtained in this study can provide insight into the phylogenetic relationships among Rhododendron species at the genomic scale, and these cp genomes may inform future genetic breeding and further biological discoveries.
Availability of Data and Materials: All data generated or analyzed during this study are included in this published article and its supplementary information files.
Supplementary Material: The supplementary material is available online at DOI 10.32604/biocell.2023.026781.
Author Contribution: The authors confirm contribution to the paper as follows: study conception and design: X.J.Z.; analysis and interpretation of results: M.X.L. and L.L.S.; draft manuscript preparation: X.J.Z. and M.X.L. All authors reviewed the results and approved the final version of the manuscript.
Ethics Approval: Not applicable.
Funding Statement: This work was supported by the National Natural Science Foundation of China [Grant No. 31870697].
Conflicts of Interest: The authors declare that they have no conflicts of interest to report regarding the present study.
References
Alzahrani DA, Yaradua SS, Albokhari EJ, Abba A (2020). Complete chloroplast genome sequence of Barleria prionitis, comparative chloroplast genomics and phylogenetic relationships among Acanthoideae. BMC Genomics 21: 1–19. DOI 10.1186/s12864-020-06798-2. [Google Scholar] [CrossRef]
Asaf S, Khan AL, Khan MA, Waqas M, Kang SM, Yun BW, Lee IJ (2017). Chloroplast genomes of Arabidopsis halleri ssp. gemmifera and Arabidopsis lyrata ssp. petraea: Structures and comparative analysis. Scientific Reports 7: 1–15. DOI 10.1038/s41598-017-07891-5. [Google Scholar] [CrossRef]
Ashburner M, Ball CA, Blake JA, Botstein D, Butler H et al. (2000). Gene ontology: Tool for the unification of biology. Nature Genetics 25: 25–29. DOI 10.1038/75556. [Google Scholar] [CrossRef]
Beier S, Thiel T, Münch T, Scholz U, Mascher M (2017). MISA-web: A web server for microsatellite prediction. Bioinformatics 33: 2583–2585. DOI 10.1093/bioinformatics/btx198. [Google Scholar] [CrossRef]
Borgström E, Lundin S, Lundeberg J (2011). Large scale library generation for high throughput sequencing. PLoS One 6: e19119. DOI 10.1371/journal.pone.0019119. [Google Scholar] [CrossRef]
Brock JR, Mandáková T, McKain M, Lysak MA, Olsen KM (2022). Chloroplast phylogenomics in Camelina (Brassicaceae) reveals multiple origins of polyploid species and the maternal lineage of C. sativa. Horticulture Research 9: uhab050. DOI 10.1093/hr/uhab050. [Google Scholar] [CrossRef]
Chaisson MJ, Tesler G (2012). Mapping single molecule sequencing reads using basic local alignment with successive refinement (BLASRApplication and theory. BMC Bioinformatics 13: 1–18. DOI 10.1186/1471-2105-13-238. [Google Scholar] [CrossRef]
Chung HJ, Jong DJ, Park HW (2006). The complete chloroplast genome sequences of Solanum tuberosum and comparative analysis with Solanaceae species identified the presence of a 241-bp deletion in cultivated potato chloroplast DNA sequence. Plant Cell Reports 25: 1369–1379. DOI 10.1007/s00299-006-0196-4. [Google Scholar] [CrossRef]
Cui G, Wang C, Wei X, Wang H, Wang X, Zhu X, Li J, Yang H, Duan H (2021). Complete chloroplast genome of Hordeum brevisubulatum: Genome organization, synonymous codon usage, phylogenetic relationships, and comparative structure analysis. PLoS One 116: e0261196. DOI 10.1371/journal.pone.0261196. [Google Scholar] [CrossRef]
Dobrogojski J, Adamiec M, Luciński R (2020). The chloroplast genome: A review. Acta Physiologiae Plants 42: 1–13. DOI 10.1007/s11738-020-03089-x. [Google Scholar] [CrossRef]
Fang MY, Fang RZ, He MY, Hu LZ, Yang HB, Qin HN et al. (2005). RHODODENDRON Linnaeus. Flora of China 14: 260–455. [Google Scholar]
Frazer KA, Pachter L, Poliakov A, Rubin EM, Dubchak I (2004). VISTA: Computational tools for comparative genomics. Nucleic Acids Research 32: 273–279. DOI 10.1093/nar/gkh458. [Google Scholar] [CrossRef]
Fu CN, Mo ZQ, Yang JB, Cai J, Ye LJ et al. (2022). Testing genome skimming for species discrimination in the large and taxonomically difficult genus Rhododendron. Molecular Ecology Resources 22: 404–414. DOI 10.1111/1755-0998.13479. [Google Scholar] [CrossRef]
Gao LM, Li DZ, Zhang CQ, Yang JB (2002). Infrageneric and sectional relationships in the genus Rhododendron (Ericaceae) inferred from ITS sequence data. Journal of Integrative Plant Biology 44: 1351–1356. DOI 10.3321/j.issn:1672-9072.2002.11.015. [Google Scholar] [CrossRef]
Goetsch L, Eckert AJ, Hall BD (2005). The molecular systematics of Rhododendron (EricaceaeA phylogeny based upon RPB2 gene sequences. Systematic Botany 30: 616–626. DOI 10.1600/0363644054782170. [Google Scholar] [CrossRef]
Greiner S, Lehwark P, Bock R (2019). OrganellarGenomeDRAW (OGDRAW) version 1.3.1: Expanded toolkit for the graphical visualization of organellar genomes. Nucleic Acids Research 47: W59–W64. DOI 10.1093/nar/gkz238. [Google Scholar] [CrossRef]
Guo H, Liu J, Luo L, Wei X, Zhang J, Qi Y, Zhang B, Liu H, Xiao P (2017). Complete chloroplast genome sequences of Schisandra chinensis: Genome structure, comparative analysis, and phylogenetic relationship of basal angiosperms. Science China-Life Sciences 60: 1286–1290. DOI 10.1007/s11427-017-9098-5. [Google Scholar] [CrossRef]
Henriquez CL, Mehmood F, Carlsen MM, Islam M, Waheed MT, Poczai P, Croat TB, Ahmed I (2020). Complete chloroplast genomes of Anthurium huixtlense and Pothos scandens (Pothoideae, AraceaeUnique inverted repeat expansion and contraction affect rate of evolution. Journal of Molecular Evolution 88: 562–574. DOI 10.1007/s00239-020-09958-w. [Google Scholar] [CrossRef]
Jin JJ, Yu WB, Yang JB, Song Y, DePamphilis CW, Yi TS, Li DZ (2020). GetOrganelle: A fast and versatile toolkit for accurate de novo assembly of organelle genomes. Genome Biology 21: 1–31. DOI 10.1186/s13059-020-02154-5. [Google Scholar] [CrossRef]
Kanehisa M, Goto S, Hattori M, Aoki-Kinoshita KF, Itoh M, Kawashima S, Katayama T, Araki M, Hirakawa M (2006). From genomics to chemical genomics: New developments in KEGG. Nucleic Acids Research 34: 354–357. DOI 10.1093/nar/gkj102. [Google Scholar] [CrossRef]
Katoh K, Rozewicki J, Yamada KD (2019). MAFFT online service: Multiple sequence alignment, interactive sequence choice and visualization. Briefings in Bioinformatics 20: 1160–1166. DOI 10.1093/bib/bbx108. [Google Scholar] [CrossRef]
Kim SC, Lee JW, Choi BK (2021). Seven complete chloroplast genomes from Symplocos: Genome organization and comparative analysis. Forests 12: 608. DOI 10.3390/f12050608. [Google Scholar] [CrossRef]
Koren S, Walenz BP, Berlin K, Miller JR, Bergman NH, Phillippy AM (2017). Canu: Scalable and accurate long-read assembly via adaptive k-mer weighting and repeat separation. Cenome Research 27: 722–736. DOI 10.1101/gr.215087.116. [Google Scholar] [CrossRef]
Kurashige Y, Etoh JI, Handa T, Takayanagi K, Yukawa T (2001). Sectional relationships in the genus Rhododendron (EricaceaeEvidence from matK and trnK intron sequences. Plant Systematics and Evolution 228: 1–14. DOI 10.1007/s006060170033. [Google Scholar] [CrossRef]
Kurtz S, Choudhuri JV, Ohlebusch E, Schleiermacher C, Stoye J, Giegerich R (2001). REPuter: The manifold applications of repeat analysis on a genomic scale. Nucleic Acids Research 29: 4633–4642. DOI 10.1093/nar/29.22.4633. [Google Scholar] [CrossRef]
Kurtz S, Phillippy A, Delcher AL, Smoot M, Shumway M, Antonescu C, Salzberg SL (2004). Versatile and open software for comparing large genomes. Genome Biology 5: R12. DOI 10.1186/gb-2004-5-2-r12. [Google Scholar] [CrossRef]
Li H, Durbin R (2009). Fast and accurate short read alignment with burrows-wheeler transform. Bioinformatics 24: 1754–1760. DOI 10.1093/bioinformatics/btp324. [Google Scholar] [CrossRef]
Li H, Guo Q, Li Q, Yang L (2020). Long-reads reveal that Rhododendron delavayi plastid genome contains extensive repeat sequences, and recombination exists among plastid genomes of photosynthetic Ericaceae. PeerJ 8: e9048. DOI 10.7717/peerj.9048. [Google Scholar] [CrossRef]
Li J, Wang S, Yu J, Wang L, Zhou S (2013a). A modified CTAB protocol for plant DNA extraction. Chinese Bulletin of Botany 48: 72–78. DOI 10.3724/SP.J.1259.2013.00072. [Google Scholar] [CrossRef]
Li T, Liu X, Li Z, Ma H, Wan Y, Liu X, Fu L (2018). Study on reproductive biology of Rhododendron longipedicellatum: A newly discovered and special threatened plant surviving in limestone habitat in Southeast Yunnan. China Frontiers in Plant Science 9: 33. DOI 10.3389/fpls.2018.00033. [Google Scholar] [CrossRef]
Li XW, Gao HH, Wang YT, Song J, Henry R et al. (2013b). Complete chloroplast genome sequence of Magnolia grandiflora and comparative analysis with related species. Science China-Life Sciences 56: 189–198. DOI 10.1007/s11427-012-4430-8. [Google Scholar] [CrossRef]
Liang C, Wang L, Lei J, Duan B, Ma W et al. (2019). A comparative analysis of the chloroplast genomes of four Salvia medicinal plants. Engineering 5: 907–915. DOI 10.1016/j.eng.2019.01.017. [Google Scholar] [CrossRef]
Liang JY, You CX, Guo SS, Zhang WJ, Li Y, Geng ZF, Wang CF, Du SS, Deng ZW, Zhang J (2016). Chemical constituents of the essential oil extracted from Rhododendron thymifolium and their insecticidal activities against Liposcelis bostrychophila or Tribolium castaneum. Industrial Crops and Products 79: 267–273. DOI 10.1016/j.indcrop.2015.11.002. [Google Scholar] [CrossRef]
Librado P, Rozas J (2009). DnaSP v5: A software for comprehensive analysis of DNA polymorphism data. Bioinformatics 25: 1451–1452. DOI 10.1093/bioinformatics/btp187. [Google Scholar] [CrossRef]
Liu D, Fu C, Yin L, Ma Y (2020a). Complete plastid genome of Rhododendron griersonianum, a critically endangered plant with extremely small populations (PSESP) from southwest China. Mitochondrial DNA B 5: 3086–3087. DOI 10.1080/23802359.2020.1800427. [Google Scholar] [CrossRef]
Liu J, Chen T, Zhang Y, Li Y, Gong J, Yi Y (2020b). The complete chloroplast genome of Rhododendron delavayi (Ericaceae). Mitochondrial DNA Part B 5: 37–38. DOI 10.1080/23802359.2019.1689860. [Google Scholar] [CrossRef]
Liu Y, Li Q, Wang L, Wu L, Huang Y, Zhang J, Song Y, Liao J (2021). The complete chloroplast genome of Rhododendron molle and its phylogenetic position within Ericaceae. Mitochondrial DNA Part B 6: 2587–2588. DOI 10.1080/23802359.2021.1959458. [Google Scholar] [CrossRef]
Lu C, Shen Q, Yang J, Wang B, Song C (2016). The complete chloroplast genome sequence of Safflower (Carthamus tinctorius L.). Mitochondrial DNA Part A 27: 3351–3353. DOI 10.3109/19401736.2015.1018217. [Google Scholar] [CrossRef]
Ma H, Li TQ, Liu XF, Wan YM, Li YY (2017). Research progress in conservation biology of Rhododendron. World Forestry Research 30: 13–17. DOI 10.13348/j.cnki.sjlyyj.2017.0037.y. [Google Scholar] [CrossRef]
Ma LH, Zhu HX, Wang CY, Li MY, Wang HY (2021). The complete chloroplast genome of Rhododendron platypodum (EricaceaeAn endemic and endangered species from China. Mitochondrial DNA Part B 6: 196–197. DOI 10.1080/23802359.2020.1860714. [Google Scholar] [CrossRef]
Ma Y, Nielsen J, Chamberlain DF, Li X, Sun W (2014). The conservation of Rhododendrons is of greater urgency than has been previously acknowledged in China. Biodiversity and Conservation 23: 3149–3154. DOI 10.1007/s10531-014-0764-9. [Google Scholar] [CrossRef]
Magrane M (2011). UniProt knowledgebase: A hub of integrated protein data. Database-Oxford 9. DOI 10.1093/database/bar009. [Google Scholar] [CrossRef]
Ogihara Y, Terachi T, Sasakuma T (1988). Intramolecular recombination of chloroplast genome mediated by short direct-repeat sequences in wheat species. PNAS 85: 8573–8577. DOI 10.1073/pnas.85.22.857. [Google Scholar] [CrossRef]
Saldaña CL, Rodriguez-Grados P, Chávez-Galarza JC, Feijoo S, Guerrero-Abad JC, Vásquez HV, Maicelo JL, Jhoncon JH, Arbizu CI (2022). Unlocking the complete chloroplast genome of a native tree species from the amazon basin, Capirona (Calycophyllum Spruceanum, Rubiaceaeand its comparative analysis with other ixoroideae species. Genes 13: 113. DOI 10.3390/genes13010113. [Google Scholar] [CrossRef]
Salmela L, Rivals E (2014). LoRDEC: Accurate and efficient long read error correction. Bioinformatics 30: 3506–3514. DOI 10.1093/bioinformatics/btu538. [Google Scholar] [CrossRef]
Shen J, Li X, Zhu X, Huang X, Jin S (2020). The complete plastid genome of Rhododendron pulchrum and comparative genetic analysis of Ericaceae species. Forests 11: 158. DOI 10.3390/f11020158. [Google Scholar] [CrossRef]
Tamura K, Stecher G, Kumar S (2021). MEGA 11: Molecular evolutionary genetics analysis version 11. Molecular Biology and Evolution 38: 3022–3027. DOI 10.1093/molbev/msab120. [Google Scholar] [CrossRef]
Tatusov RL, Fedorova ND, Jackson JD, Jacobs AR, Kiryutin B et al. (2003). The COG database: An updated version includes eukaryotes. BMC Bioinformatics 4: 41. DOI 10.1186/1471-2105-4-41. [Google Scholar] [CrossRef]
Tian S, Lu P, Zhang Z, Wu JQ, Zhang H, Shen H (2021). Chloroplast genome sequence of Chongming lima bean (Phaseolus lunatus L.) and comparative analyses with other legume chloroplast genomes. BMC Genomics 22: 1–14. DOI 10.1186/s12864-021-07467-8. [Google Scholar] [CrossRef]
Tillich M, Lehwark P, Pellizzer T, Ulbricht-Jones ES, Fischer A, Bock R, Greiner S (2017). GeSeq-versatile and accurate annotation of organelle genomes. Nucleic Acids Research 45: W6–W11. DOI 10.1093/nar/gkx391. [Google Scholar] [CrossRef]
Untergasser A, Cutcutache I, Koressaa T, Ye J, Faircloth BC, Remm M, Rozen SG (2012). Primer3-new capabilities and interfaces. Nucleic Acids Research 40: e115. DOI 10.1093/nar/gks596. DOI 10.1093/nar/gks596. [Google Scholar] [CrossRef]
Vining KJ, Johnson SR, Ahkami A, Lange I, Parrish AN, Trapp SC, Croteau RB, Straub SCK, Pandelova I, Lange BM (2017). Draft genome sequence of Mentha longifolia and development of resources for mint cultivar improvement. Molecular Plant 10: 323–339. DOI 10.1016/j.molp.2016.10.018. [Google Scholar] [CrossRef]
Wang D, Zhang Y, Zhang Z, Jiang Z, Yu J (2010). KaKs_Calculator 2.0: A toolkit incorporating gamma-series methods and sliding window strategies. Genomics Proteomics Bioinformatics 8: 77–80. DOI 10.1016/S1672-0229(10)60008-3. [Google Scholar] [CrossRef]
Wang L, Dong WP, Zhou SL (2012). Structural mutations and reorganizations in chloroplast genomes of flowering plants. Northwestern Journal of Botany 32: 1282–1288. DOI 10.3969/j.issn.1000-4025.2012.06.031. [Google Scholar] [CrossRef]
Wang ZF, Chang LW, Cao HL (2021a). The complete chloroplast genome of Rhododendron kawakamii (Ericaceae). Mitochondrial DNA Part B 6: 2538–2540. DOI 10.1080/23802359.2021.1959439. [Google Scholar] [CrossRef]
Wang ZF, Feng HF, Li YY, Wang HF, Cao HL (2021b). The complete chloroplast genome of Rhododendron datiandingense (Ericaceae). Mitochondrial DNA Part B 6: 1749–1751. DOI 10.1080/23802359.2021.1931504. [Google Scholar] [CrossRef]
Weng ML, Blazier JC, Govindu M, Jansen RK (2014). Reconstruction of the ancestral plastid genome in Geraniaceae reveals a correlation between genome rearrangements, repeats, and nucleotide substitution rates. Molecular Biology and Evolution 31: 645–659. DOI 10.1093/molbev/mst257. [Google Scholar] [CrossRef]
Wicke S, Schneeweiss GM, Depamphilis CW, Müller KF, Quandt D (2011). The evolution of the plastid chromosome in land plants: gene content, gene order, gene function. Plant Molecular Biology 76: 273–297. DOI 10.1007/s11103-011-9762-4. [Google Scholar] [CrossRef]
Xia XM, Yang MQ, Li CL, Huang SX, Jin T et al. (2022). Spatiotemporal evolution of the global species diversity of Rhododendron. Molecular Biology and Evolution 39: msab314. DOI 10.1093/molbev/msab314. [Google Scholar] [CrossRef]
Xu J, Luo H, Nie S, Zhang RG, Mao JF (2021). The complete mitochondrial and plastid genomes of Rhododendron simsii, an important parent of widely cultivated azaleas. Mitochondrial DNA Part B 6: 1197–1199. DOI 10.1080/23802359.2021.1903352. [Google Scholar] [CrossRef]
Yan LJ, Burgess KS, Milne R, Fu CN, Li DZ, Gao LM (2017). Asymmetrical natural hybridization varies among hybrid swarms between two diploid Rhododendron species. Annals of Botany 120: 51–61. DOI 10.1093/aob/mcx039. [Google Scholar] [CrossRef]
Yin D, Wang Y, Zhang X, Ma X, He X, Zhang J (2017). Development of chloroplast genome resources for peanut (Arachis hypogaea L.) and other species of Arachis. Scientific Reports 7: 1–11. DOI 10.1038/s41598-017-12026-x. [Google Scholar] [CrossRef]
Yu T, Huang BH, Zhang Y, Liao PC, Li JQ (2020). Chloroplast genome of an extremely endangered conifer Thuja sutchuenensis Franch.: Gene organization, comparative and phylogenetic analysis. Physiology and Molecular Biology of Plants 26: 409–418. DOI 10.1007/s12298-019-00736-7. [Google Scholar] [CrossRef]
Zeng S, Zhou T, Han K, Yang Y, Zhao J, Liu ZL (2017). The complete chloroplast genome sequences of six Rehmannia species. Genes 8: 103. DOI 10.3390/genes8030103. [Google Scholar] [CrossRef]
Zhou T, Wang J, Jia Y, Li W, Xu F, Wang X (2018). Comparative chloroplast genome analyses of species in Gentiana section Cruciata (Gentianaceae) and the development of authentication markers. International Journal of Molecular Sciences 19, 1962. DOI 10.3390/ijms19071962. [Google Scholar] [CrossRef]
Zhou T, Zhao JX, Chen C, Meng X, Zhao G (2016). Characterization of the complete chloroplast genome sequence of Primula veris (Ericales: Primulaceae). Conservation Genetics Resources 8: 455–458. DOI 10.1007/s12686-016-0595-y. [Google Scholar] [CrossRef]
Zhou X, Lu X, Wang X (2022). Development of polymorphic SSR markers and their applicability in genetic diversity evaluation in Euptelea pleiosperma. BIOCELL 46: 2489–2495. DOI 10.32604/biocell.2022.020311. [Google Scholar] [CrossRef]
Zhou XJ, Wang YY, Xu YN, Yan RS, Zhao P, Liu WZ (2015). De novo characterization of flower bud transcriptomes and the development of EST-SSR markers for the endangered tree Tapiscia sinensis. International Journal of Molecular Sciences 16: 12855–12870. DOI 10.3390/ijms160612855. [Google Scholar] [CrossRef]
Zhou XJ, Wei MJ, Zhang K, Han JW, Wang HL, Dong SW (2021). Characterization of the complete chloroplast genome of Rhododendron henanense subsp. lingbaoense Fang. Mitochondrial DNA Part B 6: 3325–3326. DOI 10.1080/23802359.2021.1994898. [Google Scholar] [CrossRef]
Zhu TT, Zhang L, Chen WS, Yin J, Li Q (2017). Analysis of chloroplast genomes in 1342 plants. Genomics and Applied Biology 36: 4323–4333. DOI 10.13417/j.gab.036.004323. [Google Scholar] [CrossRef]
Supplementary Materials
FIGURE S1. Sequence alignment of chloroplast genomes from 12 rhododendrons by mVISTA. Gray arrows above the alignment indicate the direction and position of transcription for each gene. The scale on the vertical axis shows the percent sequence identity between 50% and 100%.
TABLE S1. Repeat sequences of the four Rhododendron cp genomes.
TABLE S2. Frequency of classified repeat types in the four Rhododendron cp genomes.
TABLE S3. Ka/Ks values of protein-coding genes in each species.
Cite This Article
 Copyright © 2023 The Author(s). Published by Tech Science Press.
This work is licensed under a Creative Commons Attribution 4.0 International License , which permits unrestricted use, distribution, and reproduction in any medium, provided the original work is properly cited.
 Downloads
 Citation Tools