
 Submit a Paper
 Propose a Special lssue
 Open Access
ARTICLE

A pan-cancer analysis of the biological function and clinical value of BTLA in tumors
1 Graduate School, Ningxia Medical University, Yinchuan, 750004, China
2 General Surgery Clinical Medical Center, Gansu Provincial Hospital, Lanzhou, 730000, China
3 Key Laboratory of Molecular Diagnostics and Precision Medicine for Surgical Oncology in Gansu Province, Gansu Provincial Hospital, Lanzhou, 730000, China
4 NHC Key Laboratory of Diagnosis and Therapy of Gastrointestinal Tumor, Gansu Provincial Hospital, Lanzhou, 730000, China
5 The First Clinical Medical College of Lanzhou University, Lanzhou, 730000, China
* Corresponding Author: HUI CAI. Email:
# Xianglai Jiang, Jin He and Yongfeng Wang were the co-first authors
(This article belongs to the Special Issue: Bioinformatics Study of Diseases)
BIOCELL 2023, 47(2), 351-366. https://doi.org/10.32604/biocell.2023.025157
Received 24 June 2022; Accepted 13 September 2022; Issue published 18 November 2022
 View Full Text
 Download PDF
Abstract
B and T-lymphocyte attenuator (BTLA) plays an immunosuppressive role by inhibiting T- and B-cell functions. BTLA is associated with a variety of diseases, especially cancer immunity. However, the function of BTLA in various cancers and its clinical prognostic value have still not been comprehensively analyzed. This study aimed to identify the relationship between BTLA and cancer from the perspectives of differences in BTLA expression, its clinical value, immune infiltration, and the correlation with immune-related genes in various cancers. Data regarding mRNA expression, miRNA expression, lncRNA expression, and clinical data of patients of 33 existing cancers were collected from the TCGA database. Target miRNA of BTLA and the lncRNA that interacts with the target miRNA were obtained from the StarBase database. Based on bioinformatics analysis methods, the relationship between various types of cancers and BTLA was thoroughly investigated, and a competing endogenous RNA network of BTLA, target miRNA, and interacting lncRNA was constructed. The Kaplan-Meier (KM) prognostic analysis of BTLA and target miRNA (has-miR-137) in various types of cancers was completed using the KM plotter. BTLA expression varied in different cancers, with statistical significance in nine cancer types. KM plotter to analyze the overall survival (OS) and regression-free survival prognosis of cancer patients revealed that the BTLA expression was statistically different in the OS of 11 types of cancers out of 21 types of cancers; the OS of 8 type of cancers was also statistically different. Correlation analysis of tumor immune genes revealed a positive correlation of BTLA expression with immunosuppressive gene (CTLA4 and PDCD1) expression. Gene Set Enrichment Analysis showed that BTLA and its co-expressed genes mainly act through biological processes and pathways, including immune response regulation, cell surface receptor signaling pathway, antigen binding, antigen receptor-mediated signaling pathway, and leukocyte migration. BTLA has the potential as a prognostic marker for CLL, COAD, NSCLC, and OV and a diagnostic marker for CLL, COAD, and KIRC. BTLA has a close and complex relationship with the occurrence and development of tumors, and cancer immunotherapy for BTLA is worthy of further analysis.Keywords
Supplementary Material
Supplementary Material FileAbbreviations
| BTLA | B and T-lymphocyte attenuator |
| TME | tumor immune microenvironment |
| HVEM | herpes virus entry mediator |
| TCGA | The Cancer Genome Atlas database |
| TISIDB | Tumor and Immune System Interaction Database |
| RFS | relapse-free survival |
| OS | overall survival |
| HR | hazard ratio |
| SNV | single nucleotide variation |
| TMB | tumor mutational burden |
| GSEA | Gene Set Enrichment Analysis |
| qRT-PCR | quantitative real-time polymerase chain reaction |
| ceRNA | competing endogenous RNA |
| DSS | disease-free survival |
| MSI | microsatellite instability |
| TICs | tumor-infiltrating immune cells |
| ACC | adrenocortical carcinoma |
| BLCA | bladder urothelial carcinoma |
| BRCA | breast invasive carcinoma |
| CESC | cervical squamous cell carcinoma and endocervical adenocarcinoma |
| CHOL | cholangiocarcinoma |
| CLL: | chronic lymphocytic leukemia |
| COAD | colon adenocarcinoma |
| DLBC | lymphoid neoplasm diffuse large B-cell lymphoma |
| ESCA | esophageal carcinoma |
| GBM | glioblastoma multiforme |
| HNSC | head and neck squamous cell carcinoma |
| KICH | kidney chromophobe |
| KIRC | kidney renal clear cell carcinoma |
| KIRP | kidney renal papillary cell carcinoma |
| LAML | acute myeloid leukemia |
| LGG | brain lower grade glioma |
| LIHC | liver hepatocellular carcinoma |
| LUAD | lung adenocarcinoma |
| LUSC | lung squamous cell carcinoma |
| MESO | mesothelioma |
| NSCLC | non-small cell lung cancer |
| OV | ovarian serous cystadenocarcinoma |
| PAAD | pancreatic adenocarcinoma |
| PCPG | pheochromocytoma and Paraganglioma |
| PRAD | prostate adenocarcinoma |
| READ | rectum adenocarcinoma |
| SARC | sarcoma |
| SKCM | skin cutaneous melanoma |
| STAD | stomach adenocarcinoma |
| TGCT | testicular germ cell tumors |
| THYM | thymoma |
| THCA | thyroid carcinoma |
| TNBC | triple-negative breast cancer |
| UCS | uterine carcinosarcoma |
| UCEC | uterine corpus endometrial carcinoma |
| UVM | uveal melanoma |
Cancer is the main or secondary cause of death in more than half of the countries worldwide, and brings a heavy burden to patients and their families. It is estimated that nearly 20 million new cancer patients were identified, and nearly 10 million people died from cancer in 2020 (Siegel et al., 2020). The treatment of different types of cancer varies. Some cancers can be cured by early surgical intervention; however, the 5-year survival rate of most cancers is not high (Wyld et al., 2015). Cancer immunotherapy (CIT), based on the development of the immune system, has achieved surprising results in the treatment of tumors (Yang, 2015). However, CIT is only effective in some cancer types, and the identified patients who will benefit most from the ideal curative effect of CIT will achieve a prolonged survival time and improved quality of life (Korman et al., 2021). Inflammation plays an important role in the development of tumors, and the tumor immune microenvironment (TME) and immune cell infiltration related to inflammation are also an important basis for determining whether CIT will be beneficial (Fukumura et al., 2018; Kalaora et al., 2022).
B and T-lymphocyte attenuator (BTLA) belongs to the immunoglobulin superfamily and contains a domain of receptors that transmit inhibitory signals to suppress immune responses. The interaction between BTLA and HVEM has different physiological functions in different cells, and BTLA is mainly expressed in immune cells (B and T cells) and immune-related organs (Murphy et al., 2006). As the only identified ligand of BTLA, the binding of HVEM to BTLA usually mediates immunosuppression by inhibiting the normal biological activities of T cells and B cells, thereby affecting various physiological and pathological processes in the human body (Wojciechowicz et al., 2022). BTLA is differentially expressed in auxiliary T cells, cytotoxic T lymphocytes, and apoptotic cells (Paulos and June, 2010) and can inhibit T cell signaling by preferentially recruiting SH2 domain-containing protein-tyrosine phosphatase-1 (SHP1) (Xu et al., 2020). The BTLA protein structure consists of an extracellular domain, transmembrane domain, and cytoplasmic domain, which is similar to the protein structure of programmed cell death-1 (PD-1) and cytotoxic T lymphocyte-associated antigen-4 (CTLA-4). Together with CTLA-4 and PD-1, BTLA is a key player in regulating T cell function (Watanabe et al., 2003), and it is a part of the inhibitory receptors expressed on lymphocytes. BTLA-deficient T cells have higher activity, and BTLA-deficient mice have stronger specific antibody responses and stronger autoimmune responses (Murphy and Murphy, 2010). Inhibitory immunotherapy for CTLA-4 and PD-1/PD-L1 inhibited tumor development in studies conducted in vivo and in vitro, therefore suggesting that inhibiting BTLA may assist the immune system in identifying and killing tumor cells. Thus, further comprehensive analysis and exploration of the role of BTLA are crucial for evaluating the efficacy of CIT (Demerlé et al., 2021; Rowshanravan et al., 2018). However, current research on BTLA pan-cancer is not comprehensive and in-depth, and single-gene pan-cancer analysis can show similar or different roles of a single gene in different types of cancers. Therefore, we searched The Cancer Genome Atlas database (TCGA) for 33 types of cancer and obtained the RNA-seq and somatic mutation sample information regarding BTLA expression and clinical information. Moreover, the association of immunomodulator gene expression with BTLA expression was collected from 33 cancers from the Tumor and Immune System Interaction Database (TISIDB). By using the StarBase database, the miRNA targets of BTLA and lncRNAs interacting with the corresponding miRNA targets were retrieved (Li et al., 2014). Based on the correlation between BTLA and the expression of target miRNAs and corresponding lncRNAs in 33 cancers, a competing endogenous RNA (ceRNA) network was constructed (Salmena et al., 2011). Bioinformatics tools were used to carry out a comprehensive pan-cancer analysis of BTLA, including gene expression, gene expression and prognosis, gene mutation, and immune infiltration. To clarify the expression of BTLA in different types of cancer and its influence on the prognosis of patients, a comprehensive tumor immune analysis of BTLA was conducted, and its potential as a target for CIT was explored. The flow diagram of this process is shown in Fig. 1.
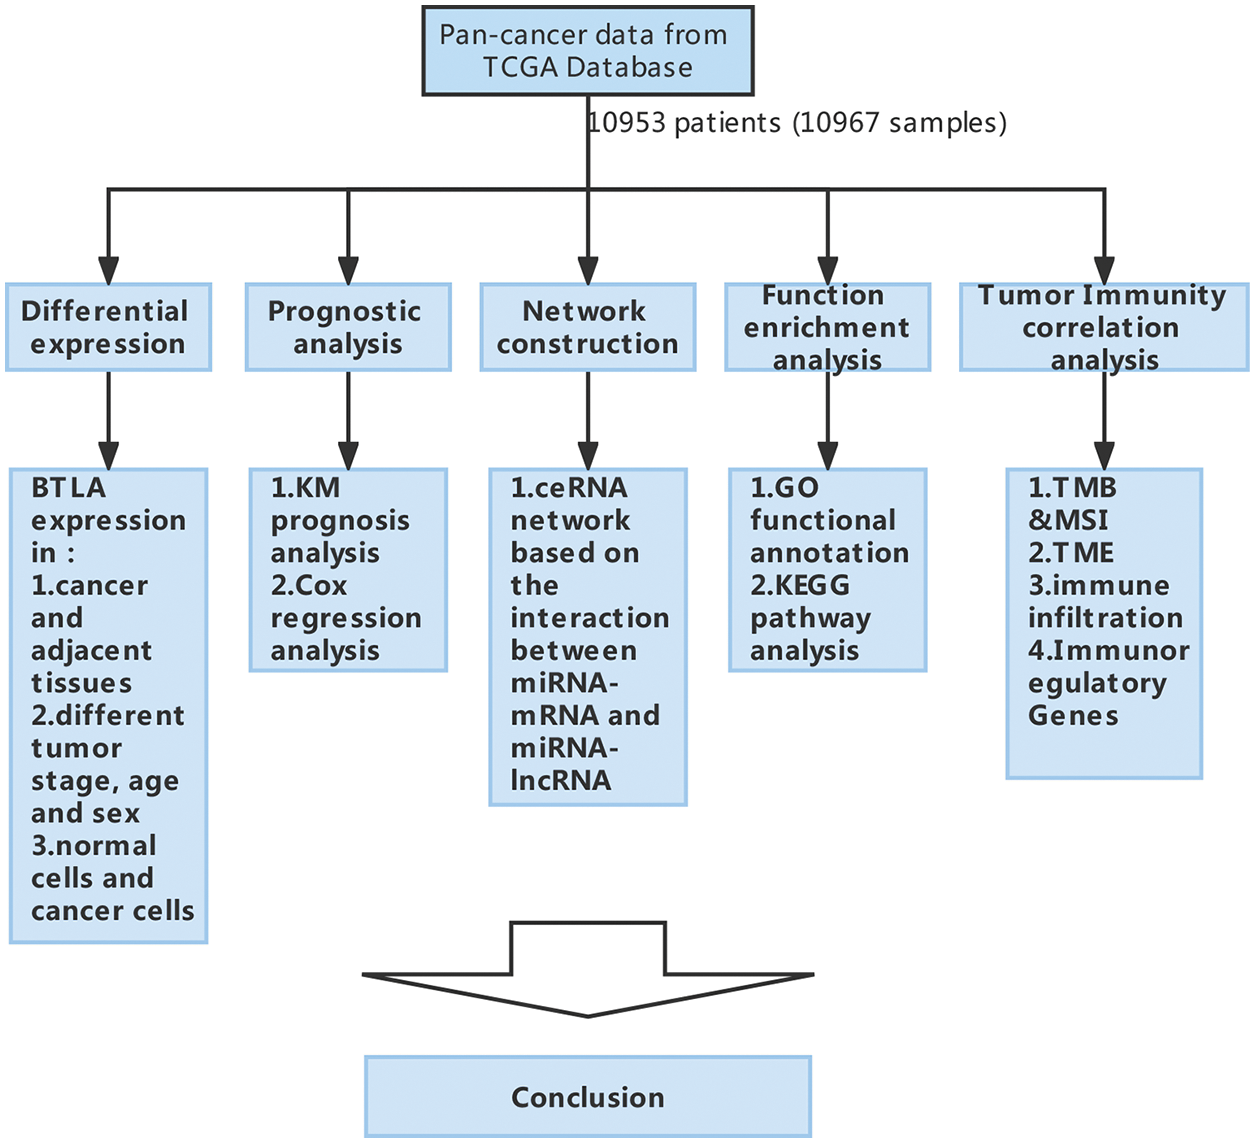
Figure 1: The flow diagram of study design and data analysis.
Expression of B and T-lymphocyte attenuator (BTLA) and its genetic alteration type and frequency in different cancers
The RNA sequences, somatic mutations, and clinical prognosis data of 33 cancers were retrieved and downloaded from TCGA database (https://portal.gdc.cancer.gov/). The “limma” software package was used to extract the expression of BTLA in various cancers, and its high and low expression in different tissues was determined (Gentleman et al., 2004; Smyth, 2004). In addition, whether the expression in each cancer tissue and normal tissue was statistically different was analyzed. A box plot was drawn using “ggpubr” software to show the differences in BTLA expression in each type of cancer (Wickham, 2016). To show the mRNA expression of BTLA in different cancer cells, data on the expression of BTLA in different cancer cells were collected from the Cancer Cell Line Encyclopedia (CCLE) database (https://sites.broadinstitute.org/ccle). The cBio Cancer Genomics Portal (http://cbioportal.org), as an open database that can obtain multidimensional cancer genomics data sets, can analyze OncoPrint, mutual exclusivity, and geological frequency in a variety of cancers (Cerami et al., 2012; Gao et al., 2013b). Gene amplification refers to the amplification of some parts of the genome (Matsui et al., 2013). Compared with the rest, previous studies have shown that a considerable number of oncogenes exist in these amplified regions (Albertson, 2006). Deep deletion is a type of mutation in which the complete loss of some genetic material results in the loss of functions, such as regulating cell growth and differentiation, which may cause tumor progression (Aggarwal et al., 2002). Thus, after obtaining relevant data from the cBioPortal database, the genetic changes of BTLA regarding mutation, amplification, and deep deletion were evaluated in a variety of cancers (Gao et al., 2013b).
Human renal cortex proximal tubule epithelial cells (HK-2), human renal clear cell carcinoma (Caki-1), human colon epithelial cells (NCM460), and human colon cancer cells (SW620 and SW480) were purchased from the Shanghai Institute of Life Sciences, Chinese Academy of Sciences. Cells were maintained in RPMI 1640 medium (Thermo Fisher Scientific, Waltham, USA) containing 100 U/mL penicillin and 100 U/mL streptomycin (Gibco, Carlsbad, USA), 10% fetal bovine serum (Invitrogen, Carlsbad, USA), and were cultured at 37°C in a 5% CO2 atmosphere.
Quantitative real-time polymerase chain reaction (qRT-PCR)
After the above-mentioned cells were pretreated, total RNA was extracted according to the instructions of the TRIzol reagent (Mei5bio, Wuhan, China). RNA was reverse transcribed into cDNA using a reverse transcription kit (Vazyme, Nanjing, China). To detect BTLA expression levels in cells, qRT-PCR analysis was performed using a real-time PCR system (Roche, Basel, Switzerland). PCR primers were purchased from Sangon Biotech (Sangon Biotech, Shanghai, China). BTLA: forward (5′-3′): AGGAAAGCAAAATGAACTCTCTGAC, reverse (5′-3′): TAGCAGTACTTGGGAATTTTGCC; GAPDH: forward (5′-3′): GGAAGCTTGTCATCAATGGAAATC, reverse (5′-3′): TGATGACCCTTTTGGCTCCC. Expression level multiples were calculated using the 2−ΔΔCT method, and GraphPad Prism 8 software was used to complete the image drawing. The difference in expression levels between normal cells and each group of cancer cells was calculated using the t-test method, and p < 0.05 was considered statistically significant.
Prognostic analysis of differential B and T-lymphocyte attenuator expression
To determine the effect of differential BTLA expression on the prognosis of various cancers, the RNA-seq module was selected to perform pan-cancer analysis on BTLA using the KM Plotter website. Regression-free survival (RFS) and overall survival (OS) were used as evaluation criteria. Single-factor Cox regression analysis was conducted based on the 95% confidence interval and hazard ratio (Györffy et al., 2010).
Construction of B and T-lymphocyte attenuator--related competing endogenous RNA network
The miRNA that interacts with BTLA was obtained using the StarBase database. Because miRNA has a negative regulatory effect on mRNA, the Spearman statistical method was used to calculate the correlation between the target miRNA and the expression of BTLA in 33 tumors. To identify the target miRNA that is significantly negatively correlated with the expression of BTLA (p < 0.05). Similarly, lncRNAs that interact with target miRNAs were obtained from the StarBase database. The correlation between the corresponding lncRNAs and BTLA expression in 33 tumors was calculated using the Spearman statistical method, and lncRNAs that significantly positively correlated with BTLA expression (p < 0.05) were screened. Cytoscape software (3.9.0) was used to construct the ceRNA network of mRNA-miRNA-lncRNA with the screened miRNA and lncRNA as nodes.
Immune infiltration of differential B and T-lymphocyte attenuator expression
Single nucleotide variation data of 33 cancers were retrieved and downloaded from the TCGA database, and the tumor mutational burden (TMB) was calculated. Cancer cell mutation data were downloaded from the TCGA database, and the microsatellite instability (MSI) status of patients was obtained. The Spearman rank correlation coefficient method was used to determine the difference in TMB or MSI between differential BTLA expression levels. The “estimate” R-software and “limma” R-software were used to score TME of 33 types of cancer (Arneth, 2020). The “gglot2” R-software package, “ggExtra” R-software package, and “ggpulr” R-software package were used to analyze the correlation between BTLA and the TME scores of 33 types of cancer. Moreover, the “e1071” R-software package was used to analyze the immunocyte content in the samples of 33 cancer patients, and the “gglot2” R-software package, “GGExtra” R-software package, and “ggpulr” R-software package were used to analyze the correlation between BTLA expression and the immune cell content of 33 cancers (Meyer et al., 2014).
Examining the relationship between B and T-lymphocyte attenuator expression and immunomodulators
TISIBD Database (http://cis.hku.hk/TISIDB/) comprehensively includes tumor immune-related data and carries out ten types of analyses of tumor immune function for each gene, including function and literature, and is a tool for tumor immune analysis. Using the function of the immunomodulator module of the TISIBD website, the correlation between BTLA expression and immunomodulator gene in 33 kinds of cancer was evaluated by three dimensions of immune inhibitor, immunostimulator, and major histocompatibility complex (MHC) molecule and displayed in the form of a heatmap.
Investigation of B and T-lymphocyte attenuator co-expression genes and pathways analysis of BTLA co-expression genes and their pathways
The gene pathway and function files were downloaded from the Gene Set Enrichment Analysis (http://www.gsea-msigdb.org/gsea/index.jsp) website (Ogata et al., 1999; Subramanian et al., 2005). The co-expression genes and pathways related to BTLA expression were analyzed using the “limma” R-software package, “org. Hs. eg. db” R-software package, “DOSE” R-software package, “clusterProfiler” R-software package, and “enrichedplot” R-software package (Yu et al., 2012).
The “Wilcox Test” was used to analyze the BTLA expression data from the TCGA databases. Spearman’s correlation analysis was employed to explore the correlation between BTLA expression and TMB, MSI, the TME, and immune cell infiltration. For survival analysis, the KM method and a single-factor Cox proportional hazard model were used to analyze the relationship between BTLA expression and prognosis in 33 cancer patients, and p < 0.05 was considered statistically significant.
The expression and genetic alterations of B and T-lymphocyte attenuator in cancers
First, the expression profiles of cells in 33 types of tumors and normal tissues were extracted and analyzed from the TCGA database. The results showed that BTLA was highly expressed in HNSC, KIRC, LUAD, and GBM compared with normal tissues. On the contrary, BTLA showed a relatively low expression in BLCA, COAD, KICH, READ, and THCA. As shown in Fig. 2A, the expression of BTLA was different between various cancer tissues and normal tissues, and the difference between the above nine cancer tissues and normal tissues was statistically significant. As shown in Fig. 2B, the relative expression of BTLA in CLL cells was the highest, followed by that in DLBC cells. Overall, BTLA has a relatively low alteration frequency in a variety of cancers (all less than 6%), and the “amplification” type was the most common alteration type, followed by the “mutation” type, as shown in Fig. 2C. Patients with the highest alteration frequency were patients with CESC (>5%). Patients with the “mutation” type as the main type and the highest frequency of change were cervical adenocarcinoma patients (>2%). “Deep deletion” was the rarest type of alteration frequency, which was only found in patients with esophageal squamous cell carcinoma (>1%). As shown in Fig. 2D, the results of qRT-PCR confirmed that the expression of BTLA mRNA in colon cancer cells was significantly lower than that in colon epithelial cells, and the expression of BTLA in human renal clear cell carcinoma cells was significantly higher than that in renal cortex proximal tubule epithelial cells.
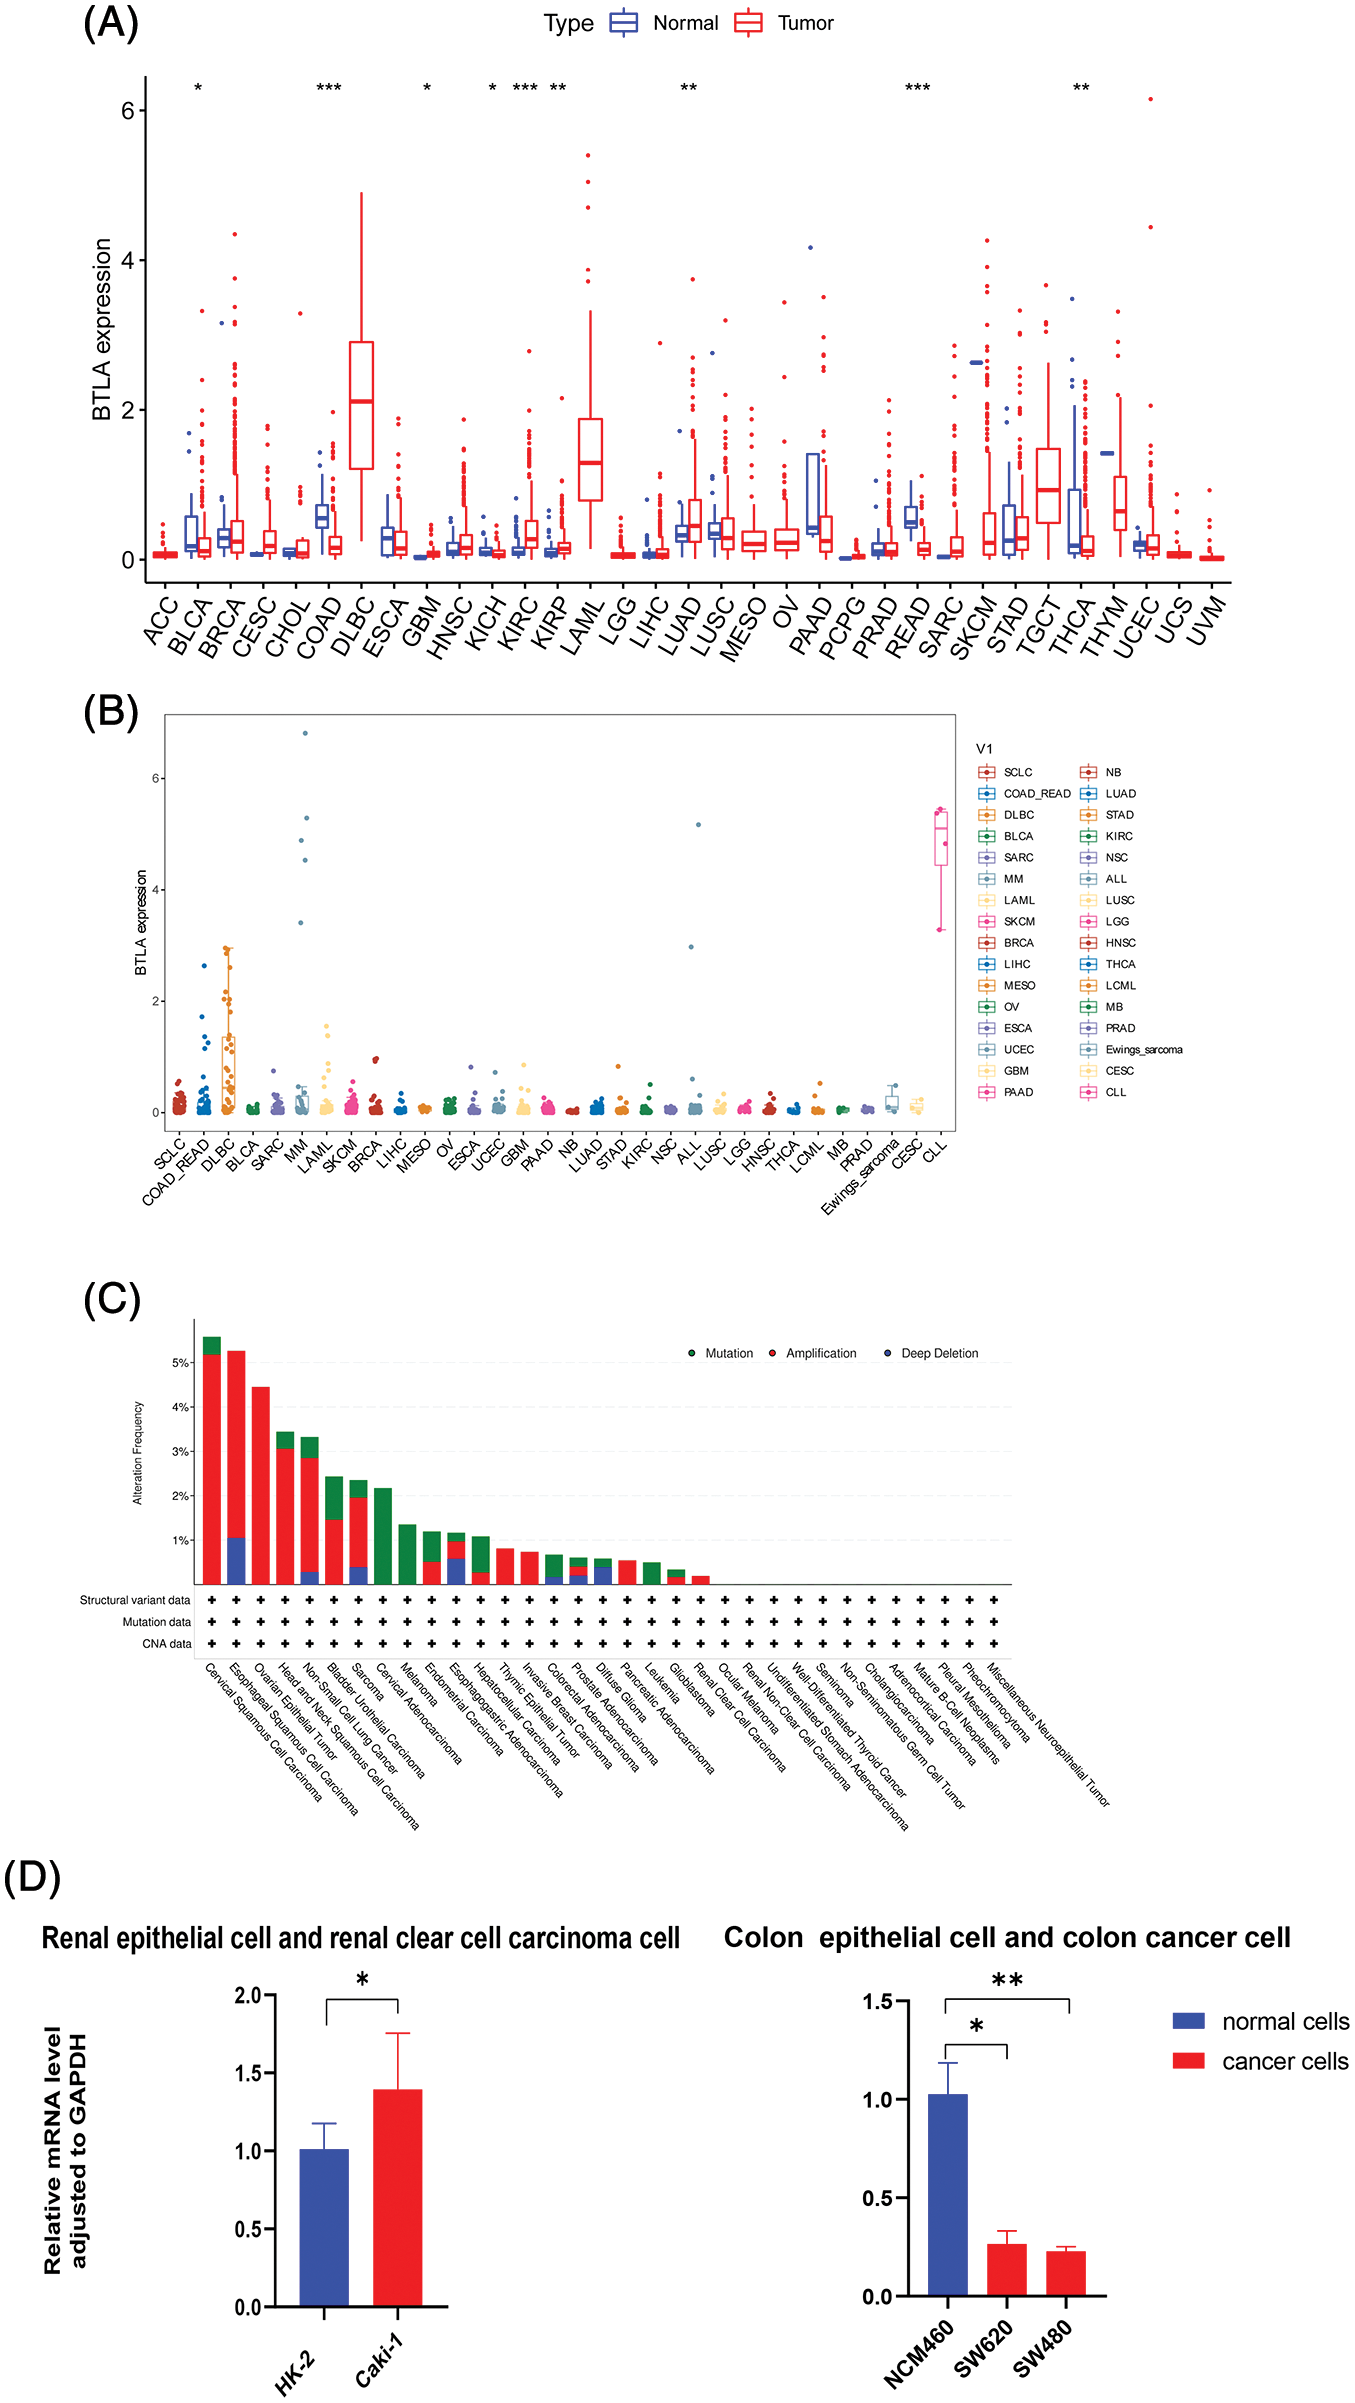
Figure 2: The expression of B and T-lymphocyte attenuator (BTLA) and gene alteration of BTLA in cancers. (A) Comparison of BTLA expression in cancer tissues and normal tissues (from TCGA Database). (B) Comparison of BTLA expression in cancer cells (from CELL Database). (C) Mutation and CNA status of BTLA in cancers (from cBioPortal database). (D) Expression of BTLA at mRNA level in the renal epithelial cells, renal clear cell carcinoma cell, colon epithelial cell, and colon cancer cell. The data were log 2(TPM + 1) transformed. Red represents the expression in cancer tissue, and blue represents the expression in adjacent tissue or normal tissue. *Represents p < 0.05, **represents p < 0.01 and ***represents p < 0.001.
Prognostic value of B and T-lymphocyte attenuator in cancers
To evaluate the prognostic significance of BTLA in various types of cancer, all collected tumor cases were divided into differentially expressed groups, and correlation analysis was performed between differential BTLA expression and survival prognosis. As shown in Fig. 3, a higher expression of BTLA was related to a worse OS in 11 out of 21 cancers in the pan-cancer analysis module of the KM Plotter database (BLCA, BRCA, CESC, HNSC, KIRP, LIHC, LUAD, OV, READ, SARC, and UCEC). Furthermore, a lower expression of BTLA was related to a poor OS in KIRC and TGCT. High expression of BTLA was associated with a poor prognosis of RFS in five types of cancer (BLCA, CESC, LIHC, OV, and UCEC). Low BLCA expression was associated with a poor prognosis of RFS in three types of cancer (STAD, KIRP, and ESCA). The results showed that differential BTLA expression was directly related to the tumor stage of COAD, KICH, KIRC, KIRP, LUAD, and STAD. Differential expression of BTLA is associated with disease-free survival (DSS) in cancer. Patients with CESC, HNSC, and SKCM with a high BTLA expression, showed a shorter DSS. UVM patients with low BTLA expression showed a shorter DSS. The results of the KM survival analysis and Cox regression analysis using the prognosis of patients obtained from the TCGA database are shown in Figs. 4 and 6.
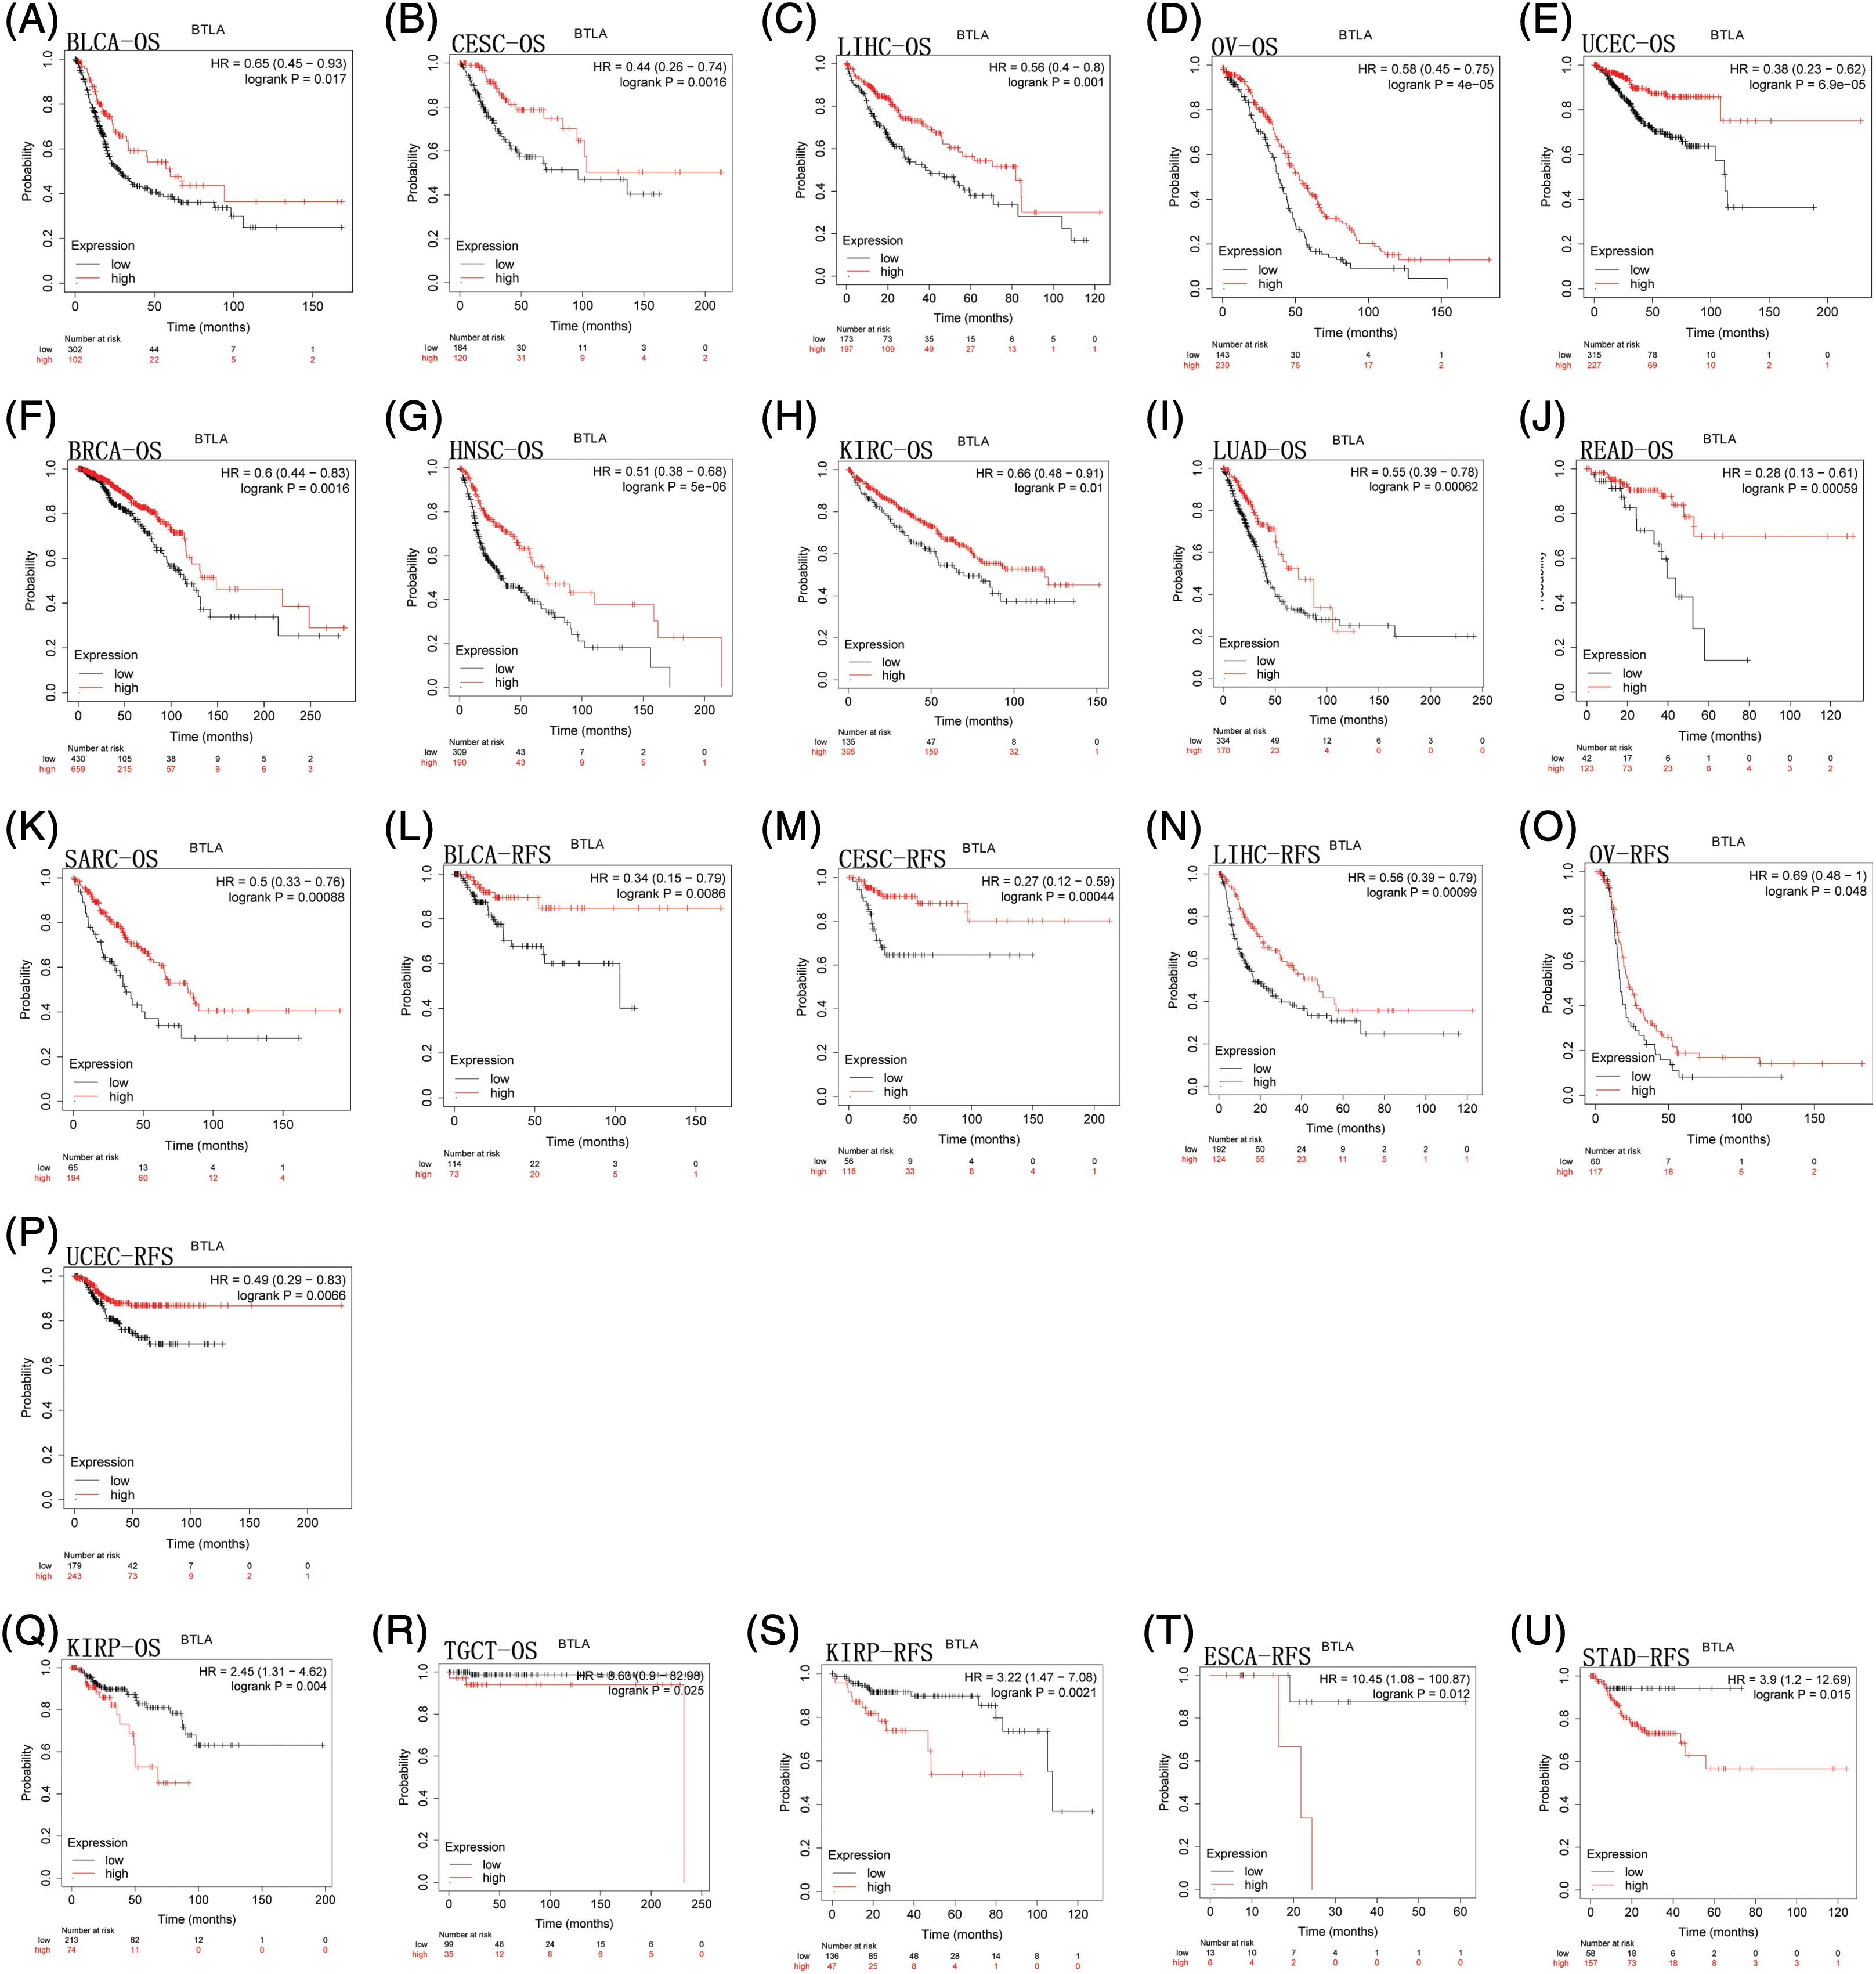
Figure 3: Correlation between B and T-lymphocyte attenuator (BTLA) expression with overall survival (OS) of patients (from Kaplan-Meier Plotter Database). Survival curves comparison of patients with different expressions of BTLA. OS difference between groups in BLCA (A), CESC (B), LIHC (C), OV (D), UCEC (E), BRCA (F), HNSC (G), KIRC (H), LUAD (I), READ (J), SARC (K), KIRP (Q) and TGCT (R). Regression-free survival difference between groups in BLCA (L), CESC (M), LIHC (N), OV (O), UCEC (P), KIRP (S), ESCA (T), and STAD (U). Red lines represent groups with high expression of BTLA, blue lines represent groups with low expression of BTLA.
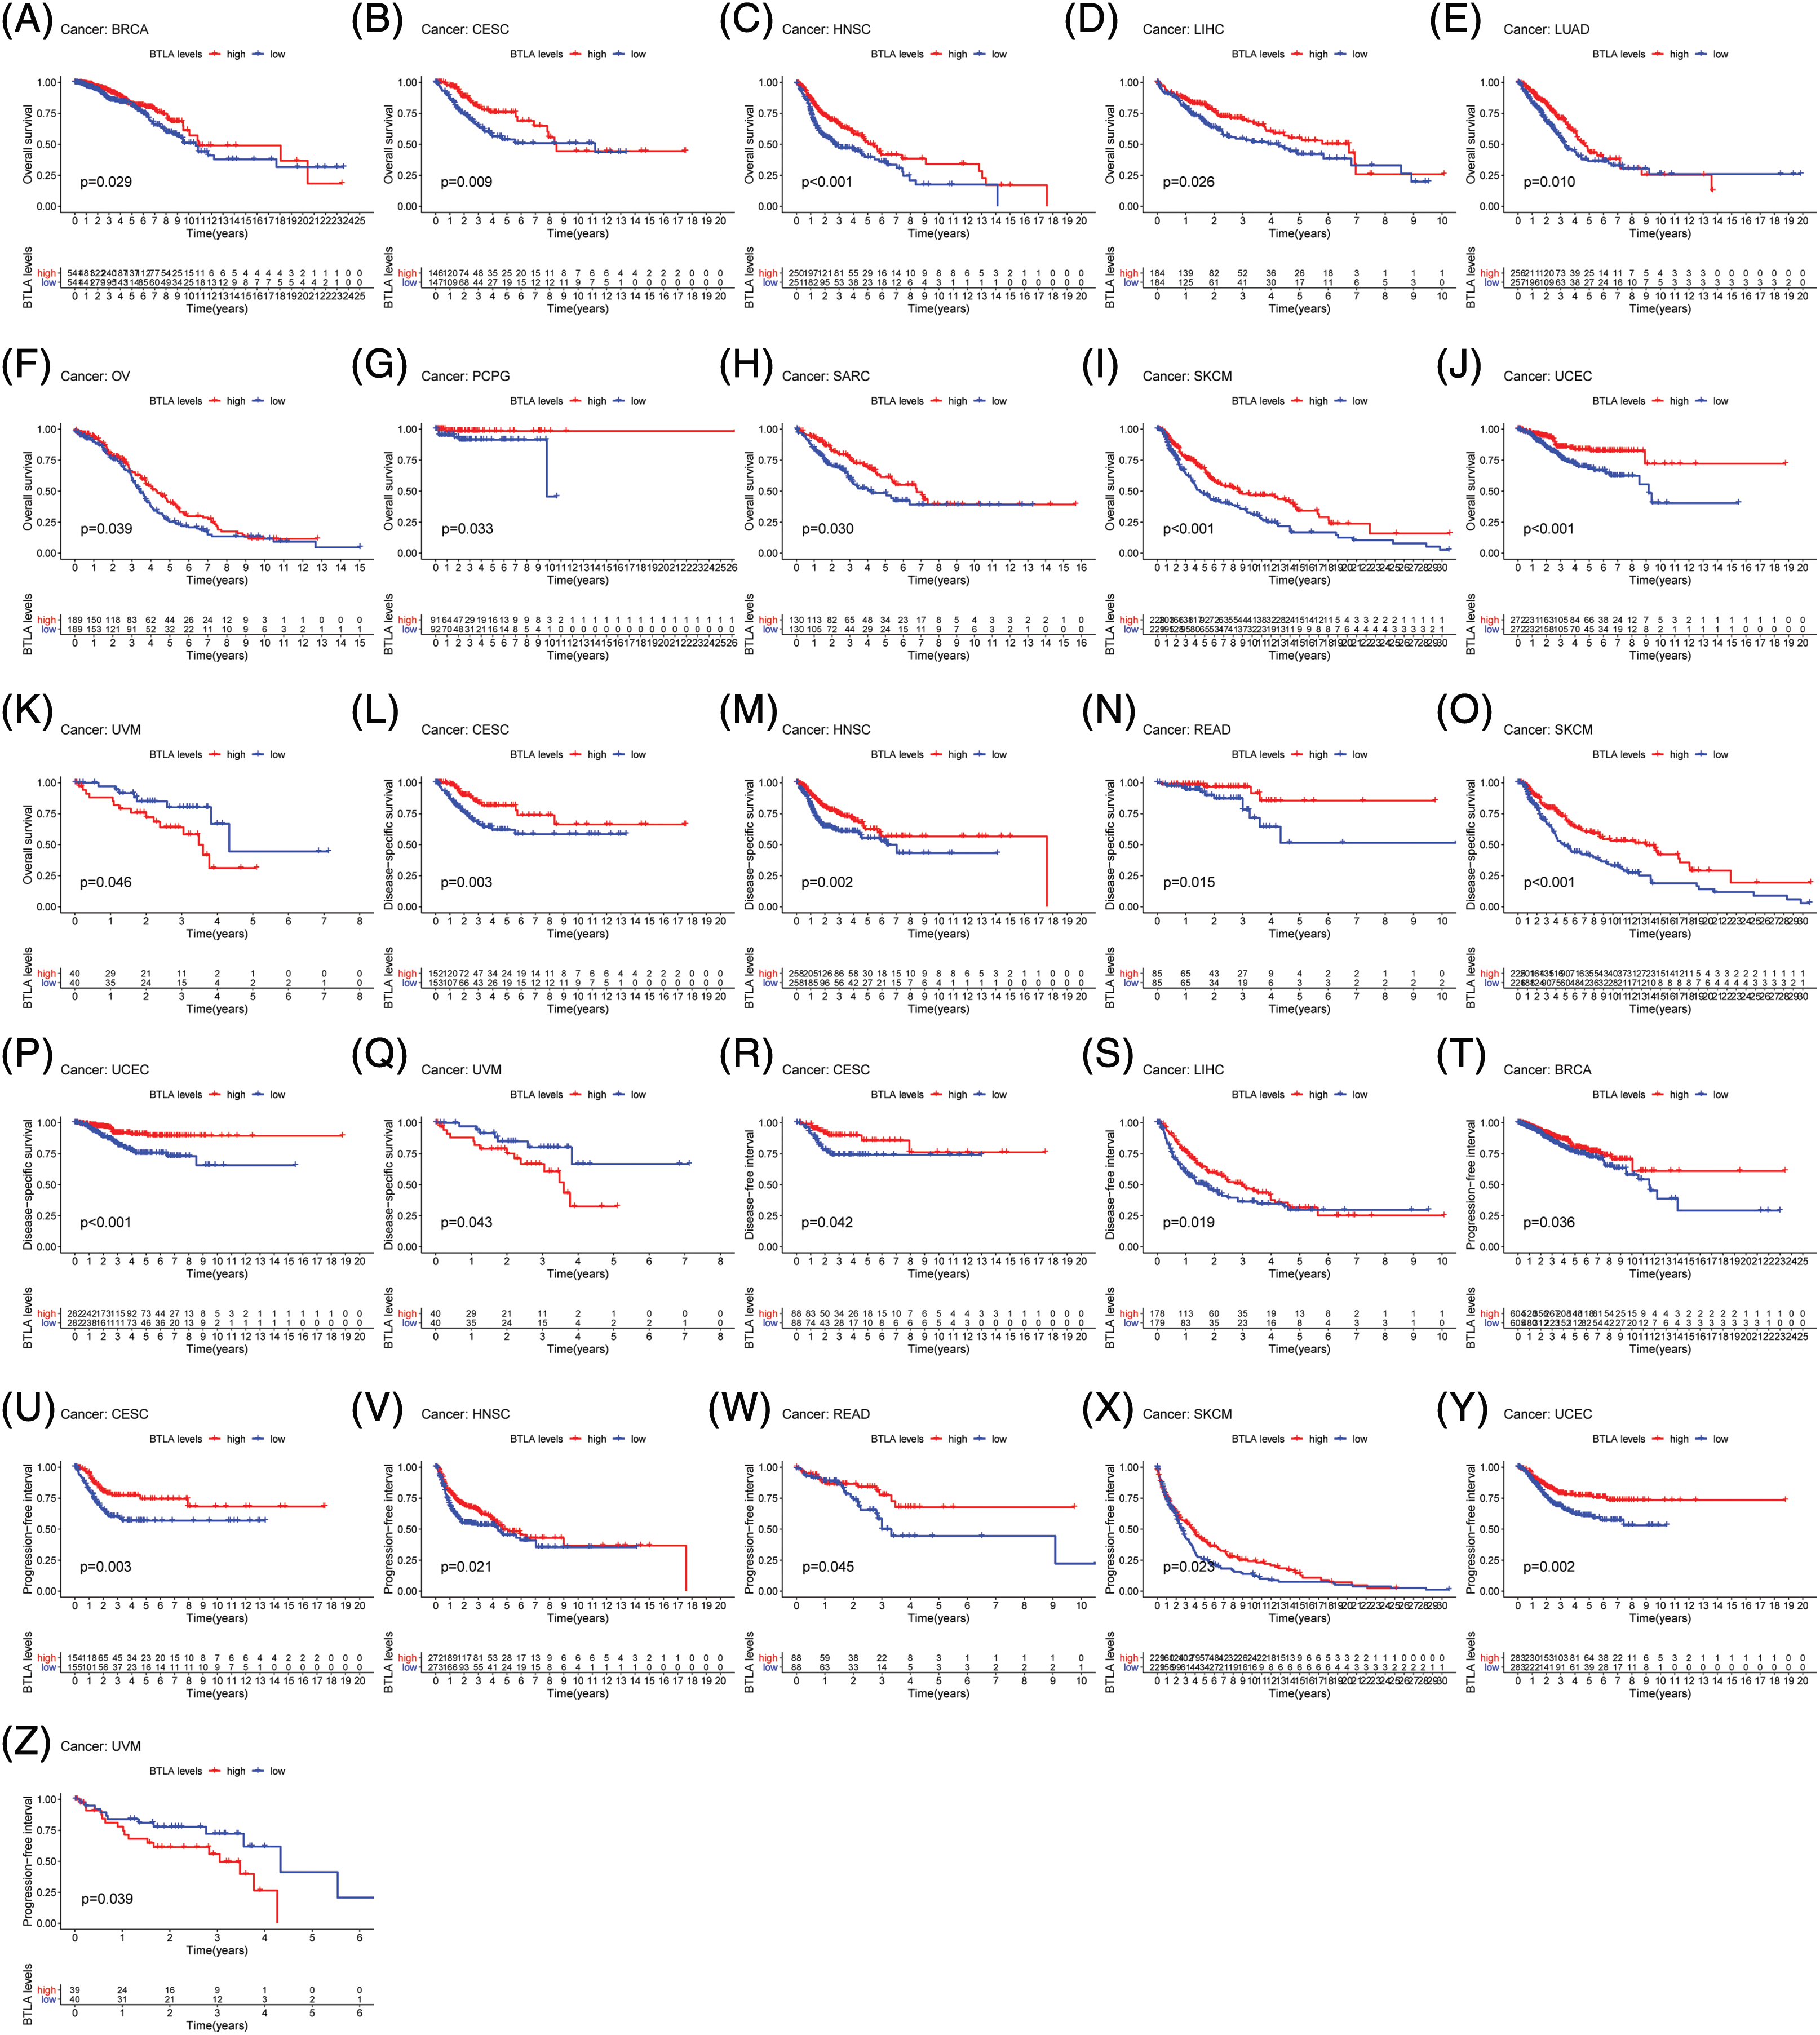
Figure 4: Correlation between B and T-lymphocyte attenuator (BTLA) expression with OS of patients (from TCGA Database). Survival curves Comparison of patients with different expressions of BTLA. OS difference between groups in BRCA (A), CESC (B), HNSC (C), LIHC (D), LUAD (E), OV (F), PCGC (G), SARC (H), SKCM (I), UCEC (J) and UVM (K). DSS difference between groups in CESC (L), HNSC (M), READ (N), SKCM (O), UCEC (P), and UVM (Q). DFI difference between groups in CESC (R) and LIHC (S). DFI difference between groups in. PFI difference between groups in BRCA (T), CESC (U), HNSC (V), READ (W), SKCM (X), UCEC (Y), and UVM (Z). Red lines represent groups with high expression of BTLA, and blue lines represent groups with low expression of BTLA.
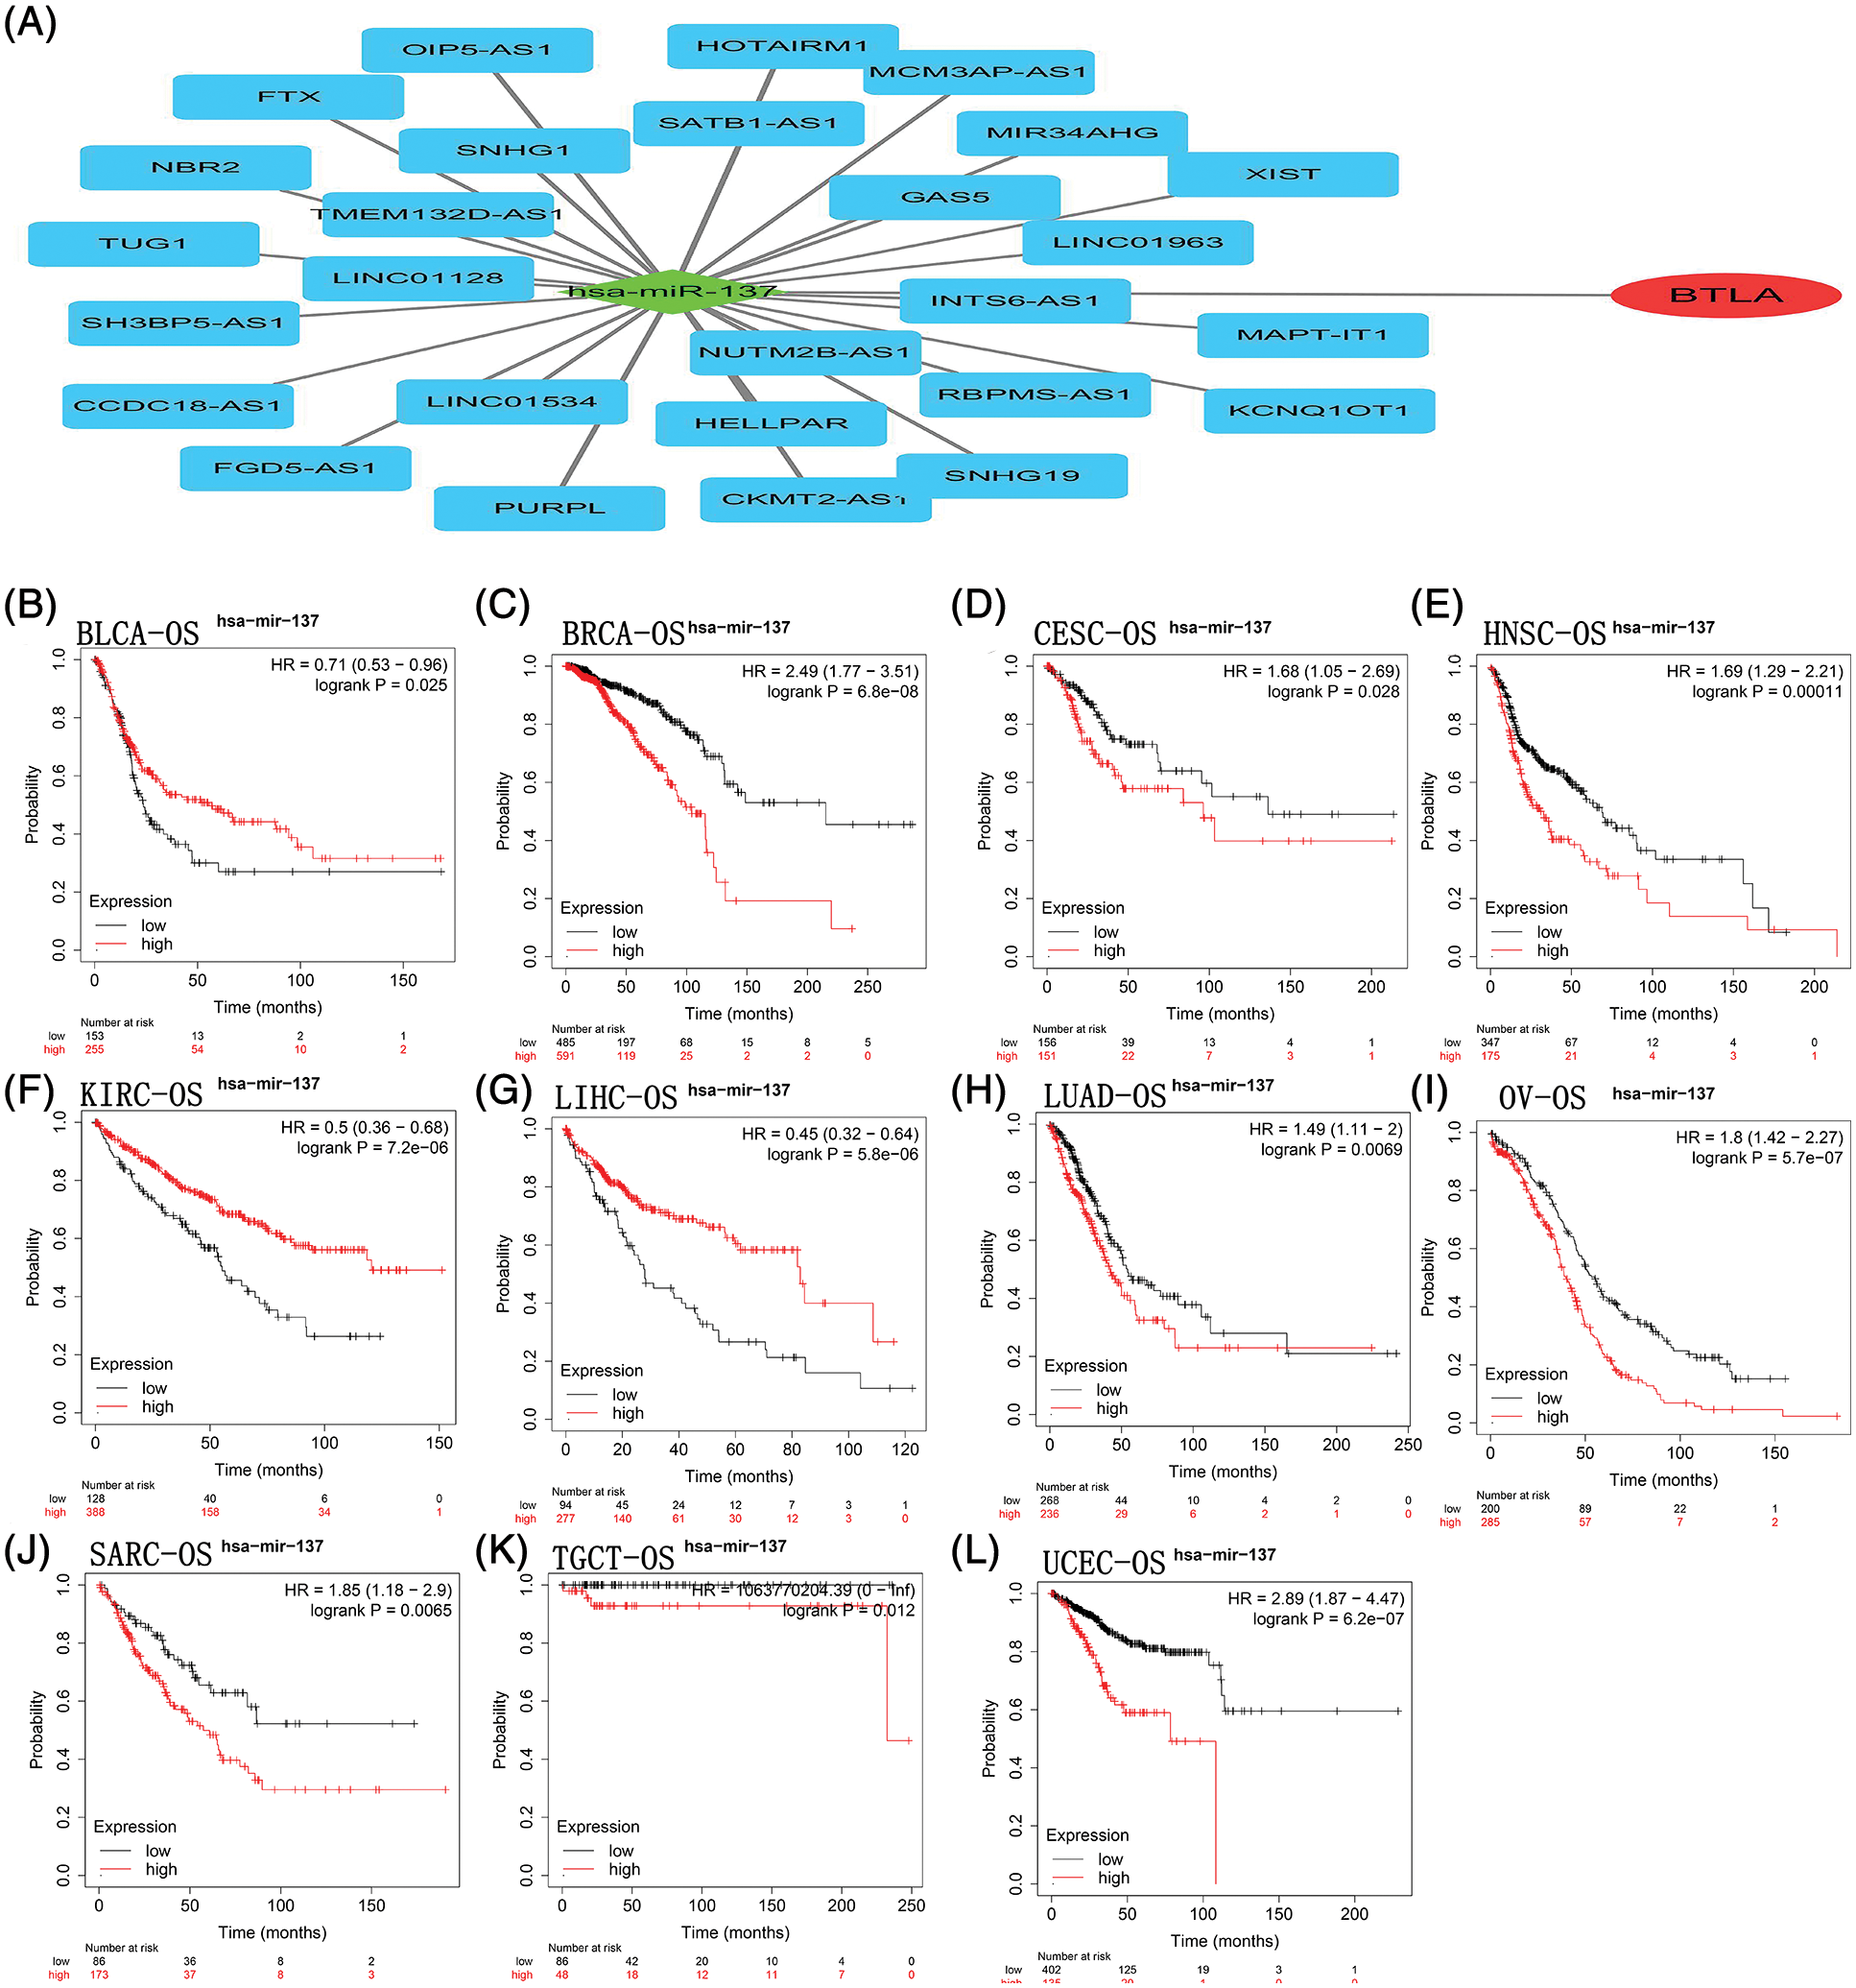
Figure 5: B and T-lymphocyte attenuator (BTLA)-related competing endogenous RNA (ceRNA) network and correlation between hsa-miR-137 expression and OS in cancer patients. The ceRNA network (A) was constructed by miRNA and lncRNA interacting with BTLA. As a target miRNA, hsa-miR-137 was used for KM prognosis analysis in patients with BLCA (B), BRCA (C), CESC (D), HNSC (E), KIRC (F), LIHC (G), LUAD (H), OV (I), SARC (J), TGCT (K) and UCEC (L).
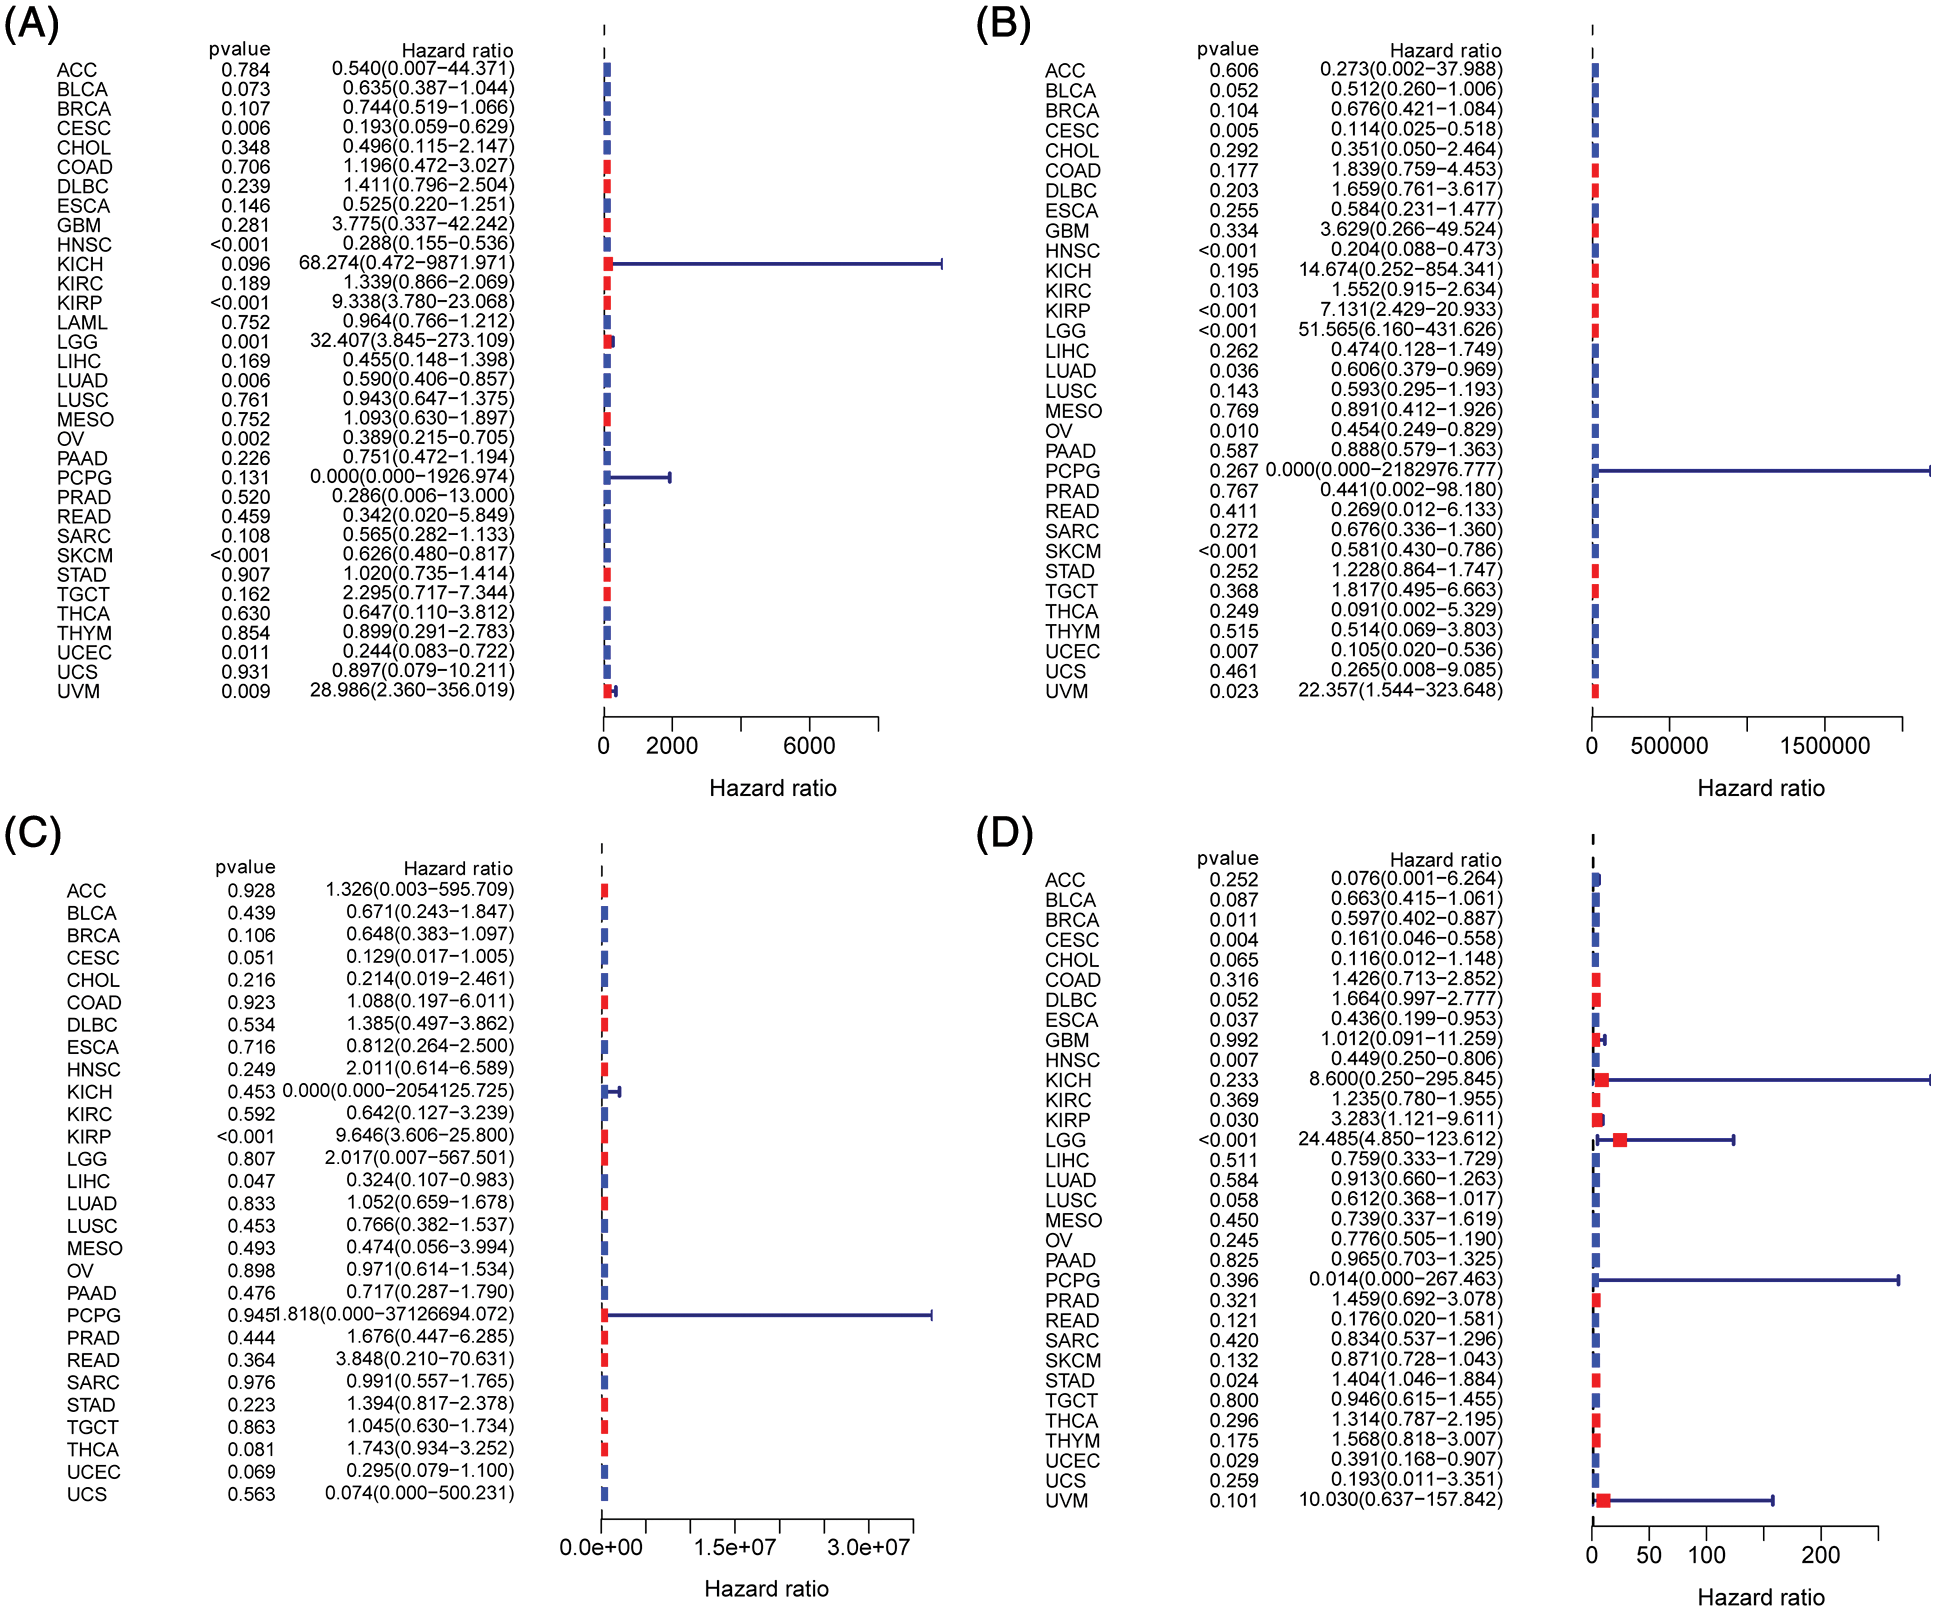
Figure 6: Prognostic significance of B and T-lymphocyte attenuator (BTLA) expression in cancer patients. Correlation between BTLA and OS (A), DSS (B), DFI (C), and PFI (D) in cancer patients by Cox regression analysis.
B and T-lymphocyte attenuator-related competing endogenous RNA network
A total of 33 miRNAs targeting BTLA were retrieved from the StarBase database. Has-miR-137 negatively correlated with BTLA expression and was statistically significant (p < 0.05). A total of 72 lncRNAs that interact with has-miR-137 were obtained from the StarBase database, and 27 lncRNAs (SNHG1, INTS6-AS1, MCM3AP-AS1, GAS5, MIR34AHG, HELLPAR, TMEM132D-AS1, NBR2, TUG1, SNHG19, KCNQ1OT1, XIST, PURPL, CCDC18-AS1, MAPT-IT1, NUTM2B-AS1, FGD5-AS1, SATB1-AS1, LINC01534, SH3BP5-AS1, OIP5-AS1, RBPMS-AS1, FTX, HOTAIRM1, LINC01963, CKMT2-AS1, and LINC01128) positively correlated with BTLA expression (p < 0.05). The ceRNA network was constructed with miRNA (has-miR-137) as the center of mRNA, miRNA, and lncRNA, and the results are shown in Fig. 5A. Finally, as shown in Figs. 5B–5L, KM prognostic analysis of has-miR-137 in cancer with a prognostic significance for BTLA expression was completed on the KM plotter website. The results showed that contrary to BTLA, the expression of has-miR-137 was significantly associated with a shorter OS in BLCA, KIRC, and LIHC patients and a longer OS in patients with BRCA, CESC, HNSC, LUAD, OV, SARC, TGCT, and UCEC.
Correlation between B and T-lymphocyte attenuator expression with clinicopathological features of cancer
After collecting the clinical information of 33 cancer patients, the age and tumor stage of patients was analyzed. As shown in Fig. 7, the results showed significant differences in the expression of BTLA in different stages of COAD, KICH, KIRC, KIRP, LUAD, and STAD. The results suggested that the expression level of BTLA in elderly patients (age over 65 as the standard) was higher. Especially in ACC, BRCA, STAD, TYHM and UVM patients. Further, elderly patients with ESCA showed lower expression of BTLA.
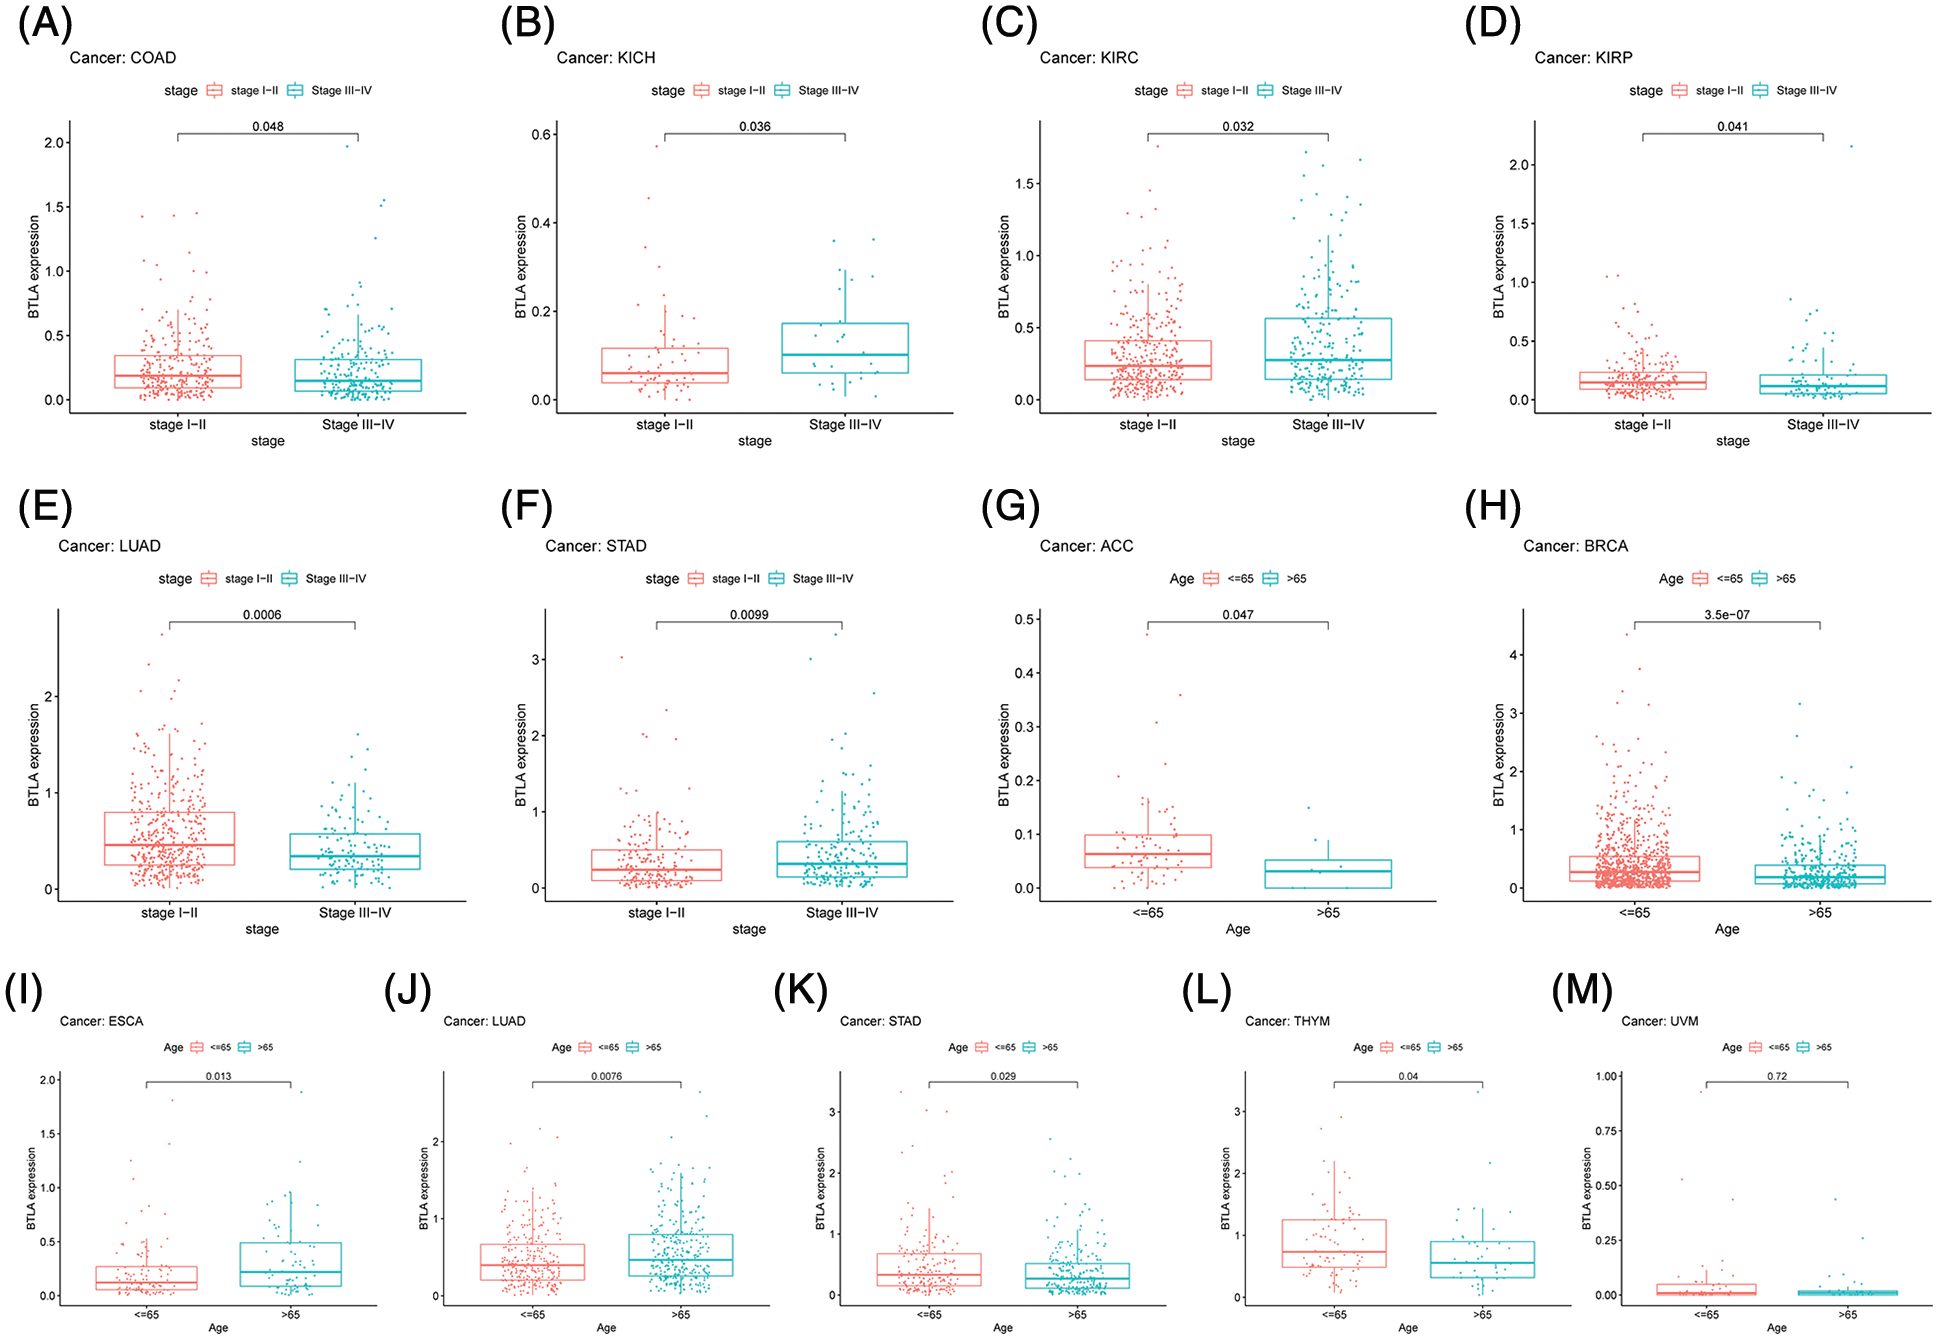
Figure 7: Correlation between B and T-lymphocyte attenuator (BTLA) expression with clinicopathological features. Correlation between BTLA expression with tumor stage in COAD (A), KICH (B), KIRC (C), KIRP (D), LUAD (E), and STAD (F). Correlation between BTLA expression with age in ACC (G), BRCA (H), ESCA (I), LUAD (J), STAD (K), TYHM (L) and UVM (M).
Correlation between B and T-lymphocyte attenuator expression with tumor mutational burden and microsatellite instability
TMB is the number of somatic nonsynonymous mutations or all mutations per megabase in the detected gene region, which is considered to predict whether CIT can take effect. As shown in Fig. 8A, the correlation analysis between BTLA expression and TMB showed that the expression of BTLA correlated with the occurrence of TMB in 13 types of cancers and positively correlated with the occurrence of TMB in UCEC, LGG, and COAD, and negatively correlated with THYM, THCA, TGCT, STAD, PCPG, PAAD, LUSC, LUAD, LIHC, and HNSC. MSI is caused by the loss of DNA mismatch repair activity, which determines the effect of immunotherapy on patients with gastrointestinal cancer to a certain extent, and is also a biomarker of CIT. As shown in Fig. 8B, the results showed that higher MSI was associated with higher BTLA expression in UCEC and COAD, whereas MSI was negatively correlated with BTLA expression in TGCT, STAD, SKCM, LUSC, LIHC, HNSC, ESCA, and DLBC.
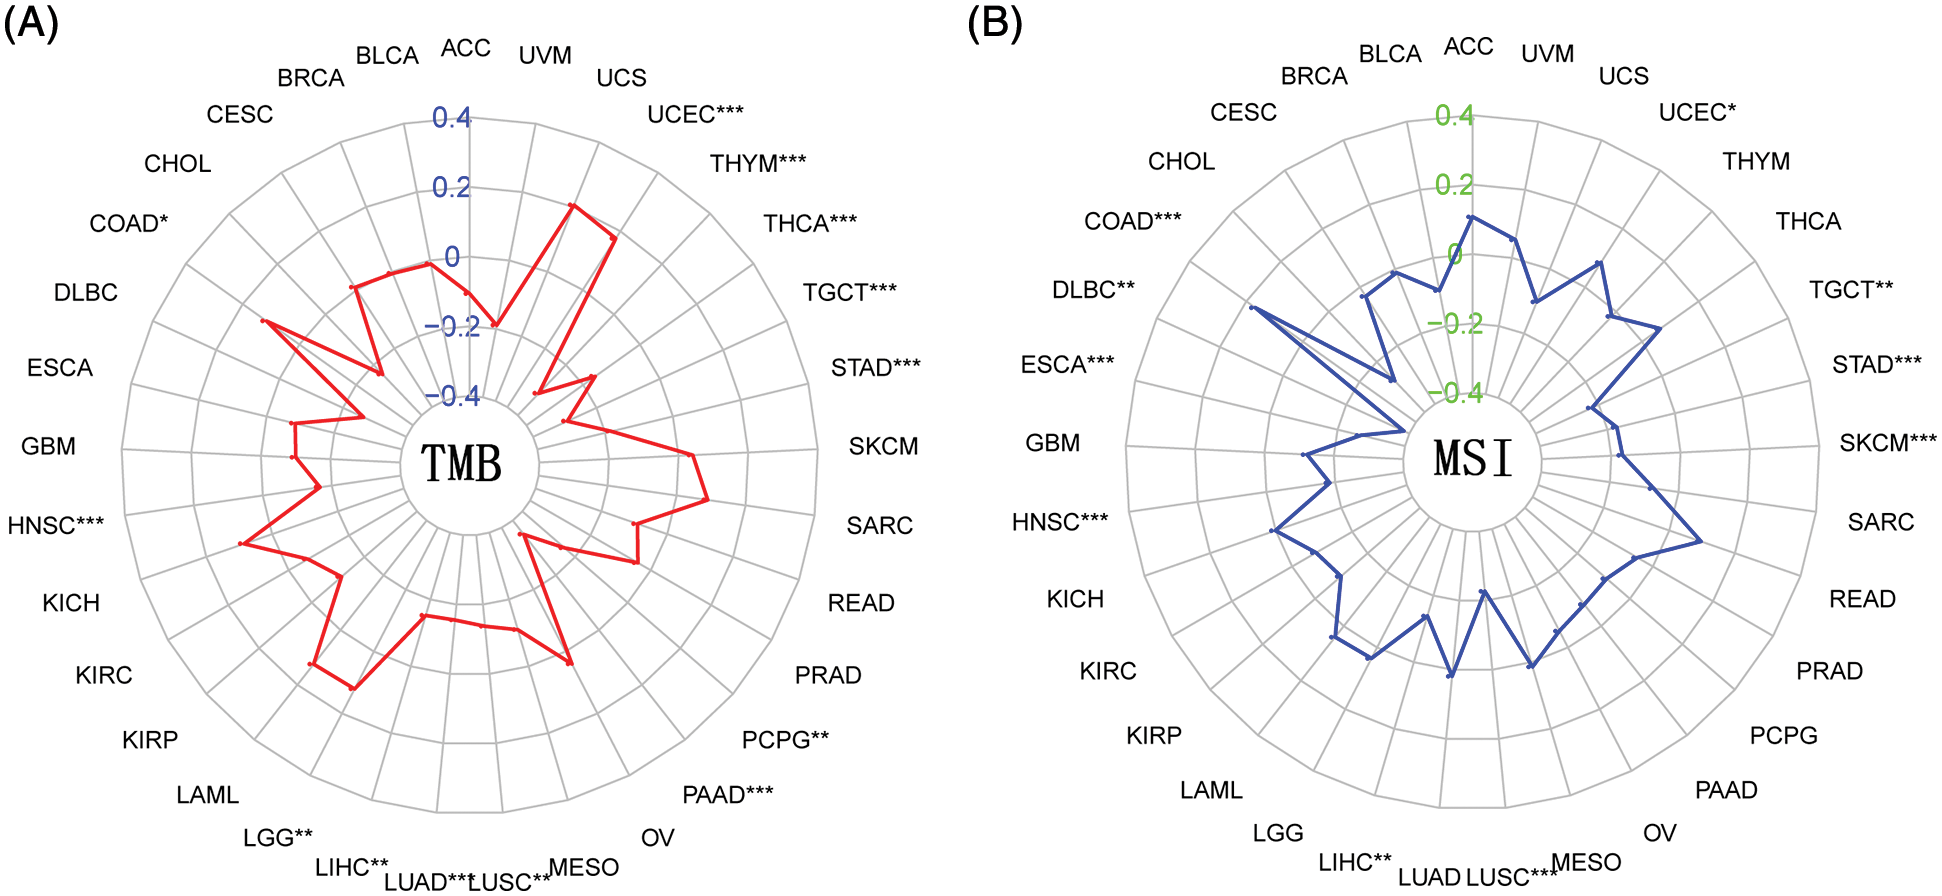
Figure 8: Correlation between B and T-lymphocyte attenuator (BTLA) expression with tumor mutational burden (TMB) and microsatellite instability (MSI). (A) Radar plot of correlation between BTLA expression and TMB. (B) Radar plot of correlation between BTLA expression and MSI. The positive number indicates that BTLA expression is positively correlated with the incidence of TMB/MSI, and the negative number indicates that BTLA expression is negatively correlated with the incidence of TMB/MSI. *Represents p < 0.05, **represents p < 0.01 and ***represents p < 0.001.
Correlation of B and T-lymphocyte attenuator expression with tumor microenvironment and immune infiltration in cancer
A variety of cells, including stromal cells, fibroblasts, and immune cells, together constitute the TME and its complex regulatory network. Tumor-infiltrating immune cells (TICs) have been related to the prognosis and immunotherapy of various types of cancer. Therefore, we aimed to clarify the relationship between the expression of BTLA and immune infiltration. The results indicated that the expression of BTLA positively correlated with the ImmuneScore in various tumors, including prognosis-related tumors (BLCA, BRCA, CESC, HNSC, KIRP, LIHC, LUAD, OV, READ, SARC, UCEC, KIRC, and TGCT), as shown in Fig. 9 (Suppl. Fig. S1). The data showed that the expression of BTLA positively correlated with dendritic cells activated in PRAD and BRCA and negatively correlated to dendritic cells activated in ACC, BLCA, BRCA, CESC, HNSC, LIHC, LUSC, THCA, UCEC, and ESCA. The expression of BTLA was passively related to the infiltration of macrophages M0 in BLCA, BRCA, CESC, COAD, ESCA, HNSC, LIHC, LUAD, LUSC, OV, PAAD, READ, SKCM, STAD, THCA, UCEC, and UCS. Macrophage M1 infiltration was positively correlated in ACC, BLCA, BRCA, CESC, ESCA, HNSC, KIRC, LIHC, LUAD, LUSC, MESO, PRAD, SARC, SKCM, UCEC, and UCS, while macrophages M2 infiltration was positively correlated in BRCA, KIRC, KIRP, LIHC, LUAD, MESO, PAAD, PRAD, SARC, SKCM, TGCT, THCA, and UVM. The expression of BTLA was positively correlated with the immune infiltration of CD8 + T cells in ACC, BLCA, BRCA, CESC, KIRC, KIRP, LIHC, LUSC, MESO, PAAD, SKCM, STAD, TGCT, THCA, UCEC, and UVM. BTLA expression had a positive relation with memory activation of CD4 + T cells in BLCA, BRCA, CESC, HNSC, KIRC, LIHC, LUAD, LUSC, MESO, PAAD, PRAD, SARC, see Suppl. Fig. S2 for details.
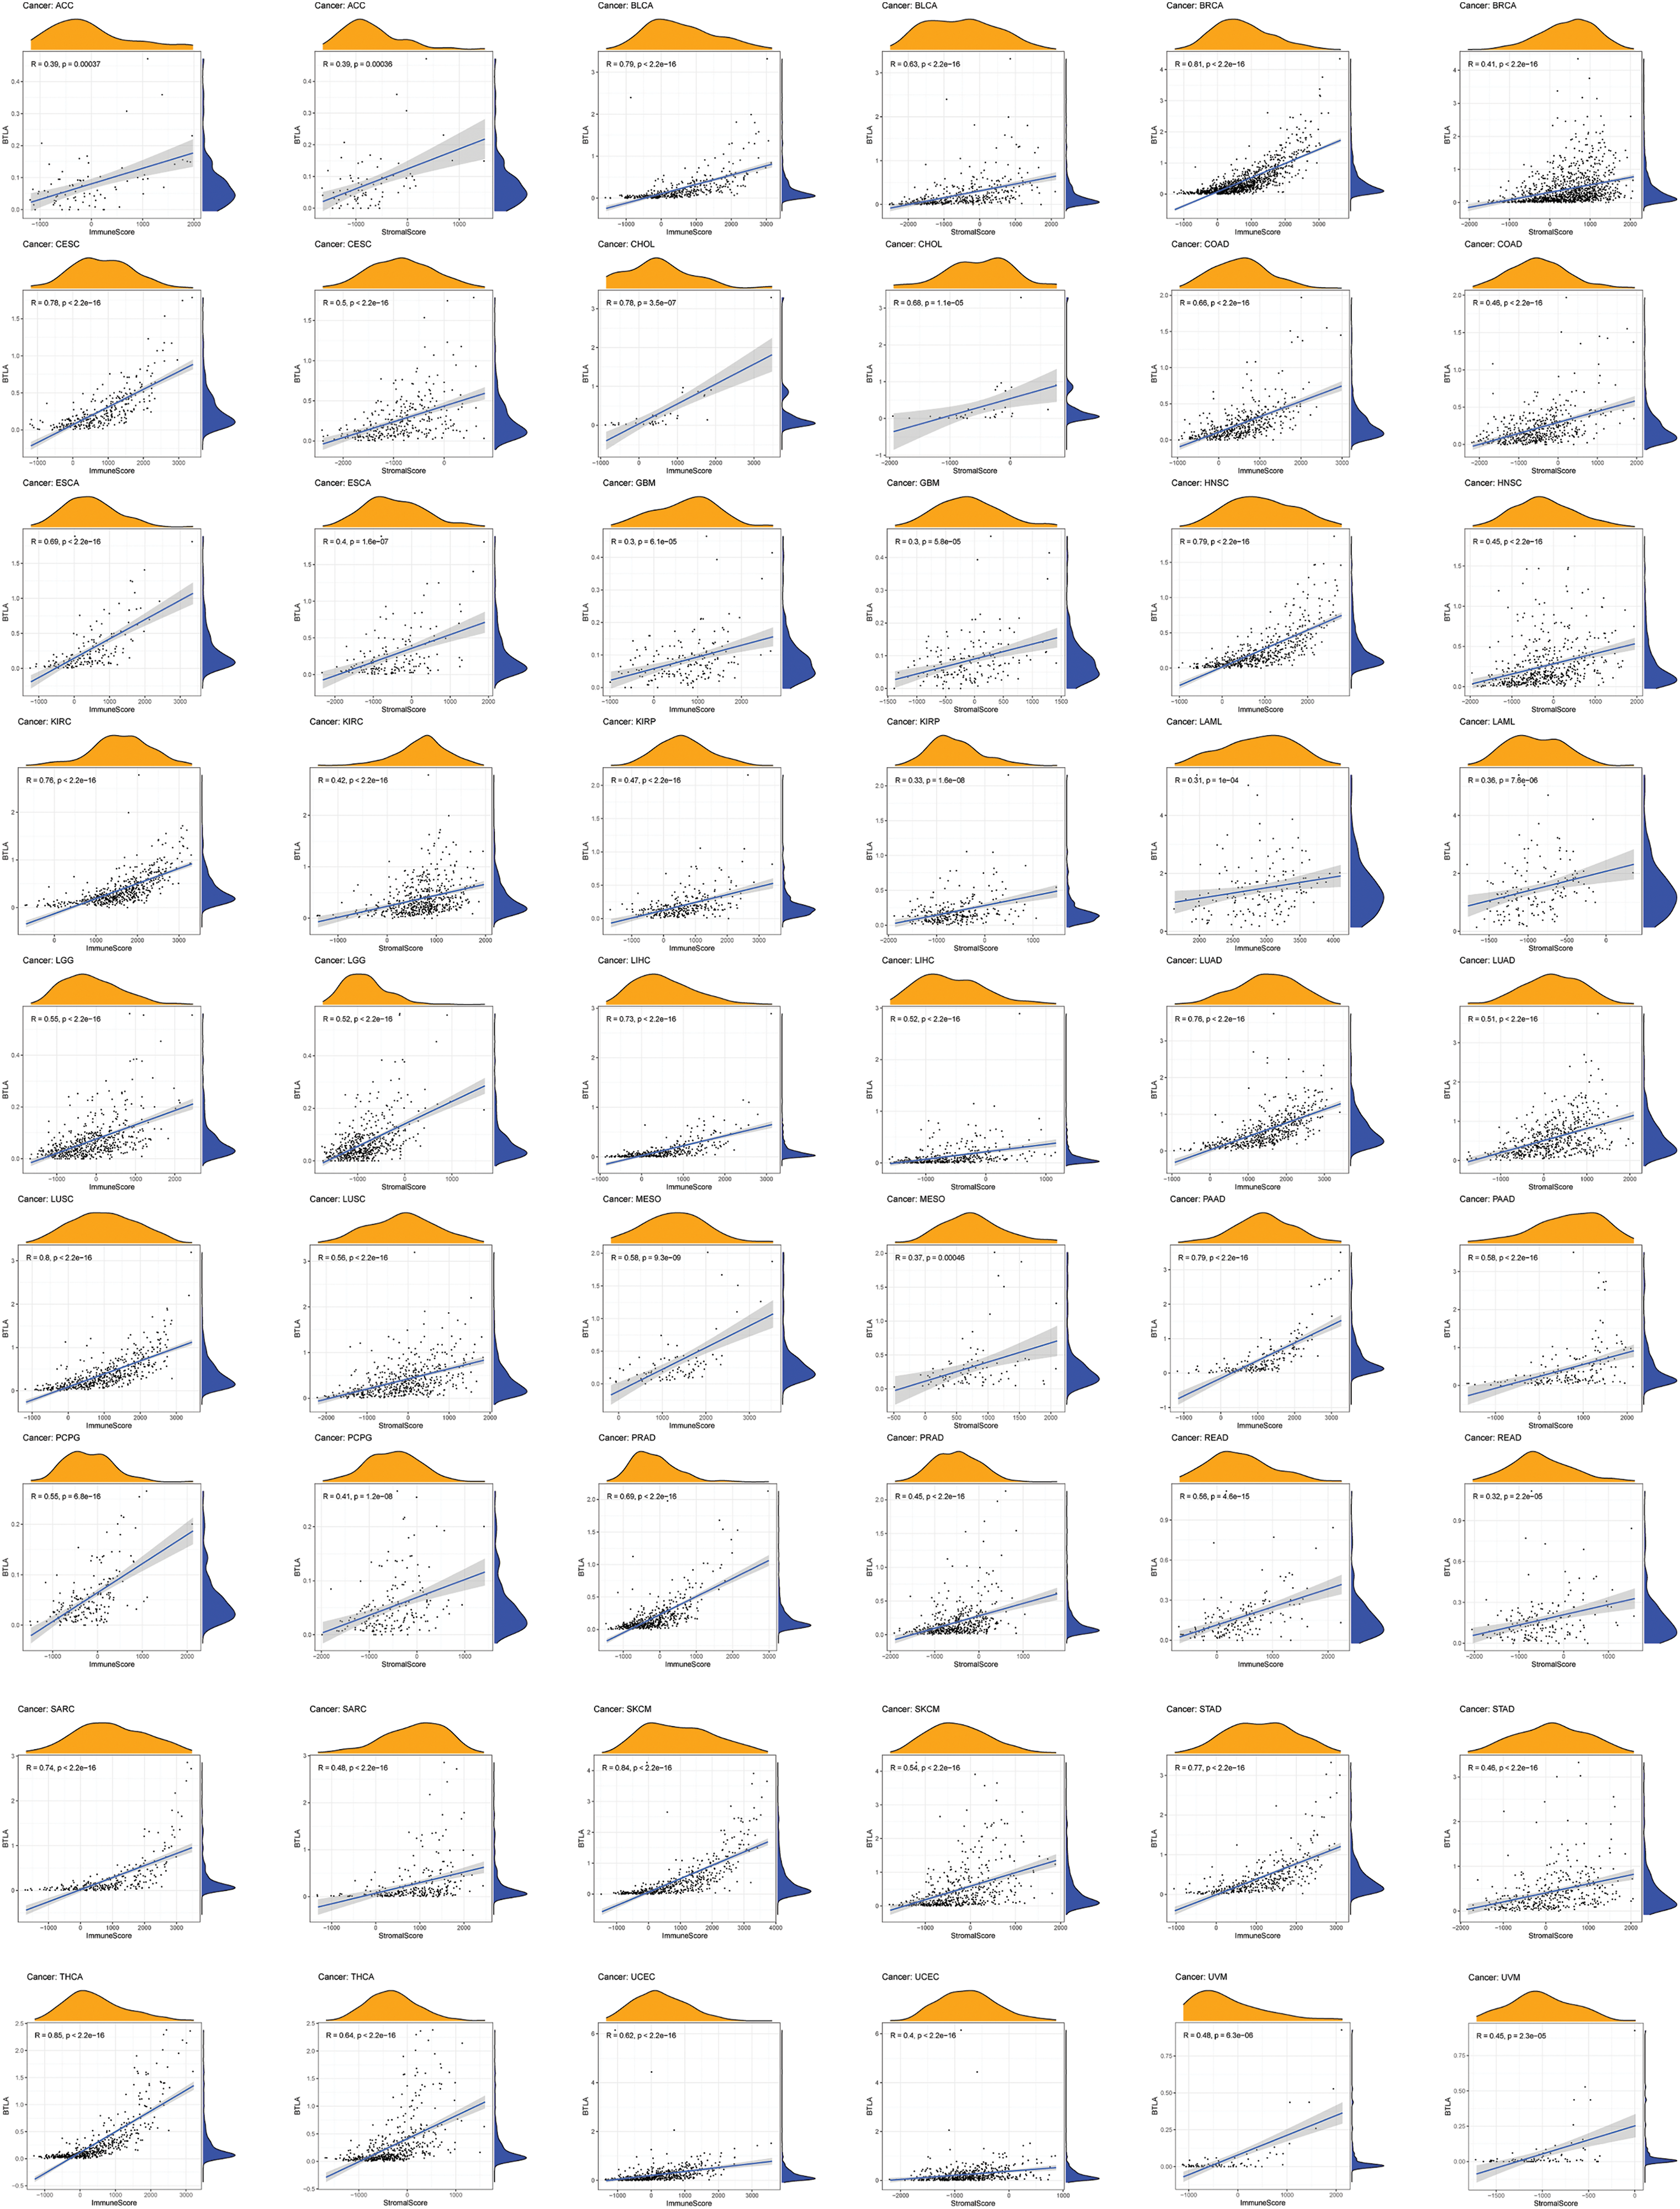
Figure 9: Correlation of B and T-lymphocyte attenuator (BTLA) expression and ImmuneScore/Stromal Score in cancers. Correlation of BTLA expression and ImmuneScore and Stromal Score in ACC, BLCA, BRCA, CESC, CHOL, COAD, ESCA, GBM, HNSC, KIRC, KIRP, LAML, LGG, LIHC, LUAD, LUSC, MESO, PAAD, PCPG, PRAD, READ, SARC, SKCM, STAD, THCA, UCEC, and UVM.
Correlation between B and T-lymphocyte attenuator and immunoregulatory genes
The immune correlation analysis of BTLA and the tumor using TISIBD showed that it was consistent with the expression of Immunostimulator genes CD40LG, CD48, ICOS, KLRK1, and LTA and MHC molecule genes HLA-DOA, HLA-DPA1, HLA-DPB2, and HLA-DRA (Figs. 10B and 10C). Moreover, BTLA expression positively correlated with the expression of Immunoinhibitor genes, such as CD96, PDCD1, TIGIT, and CTLA4. Furthermore, BTLA is an Immunoinhibitor gene (Fig. 10A).
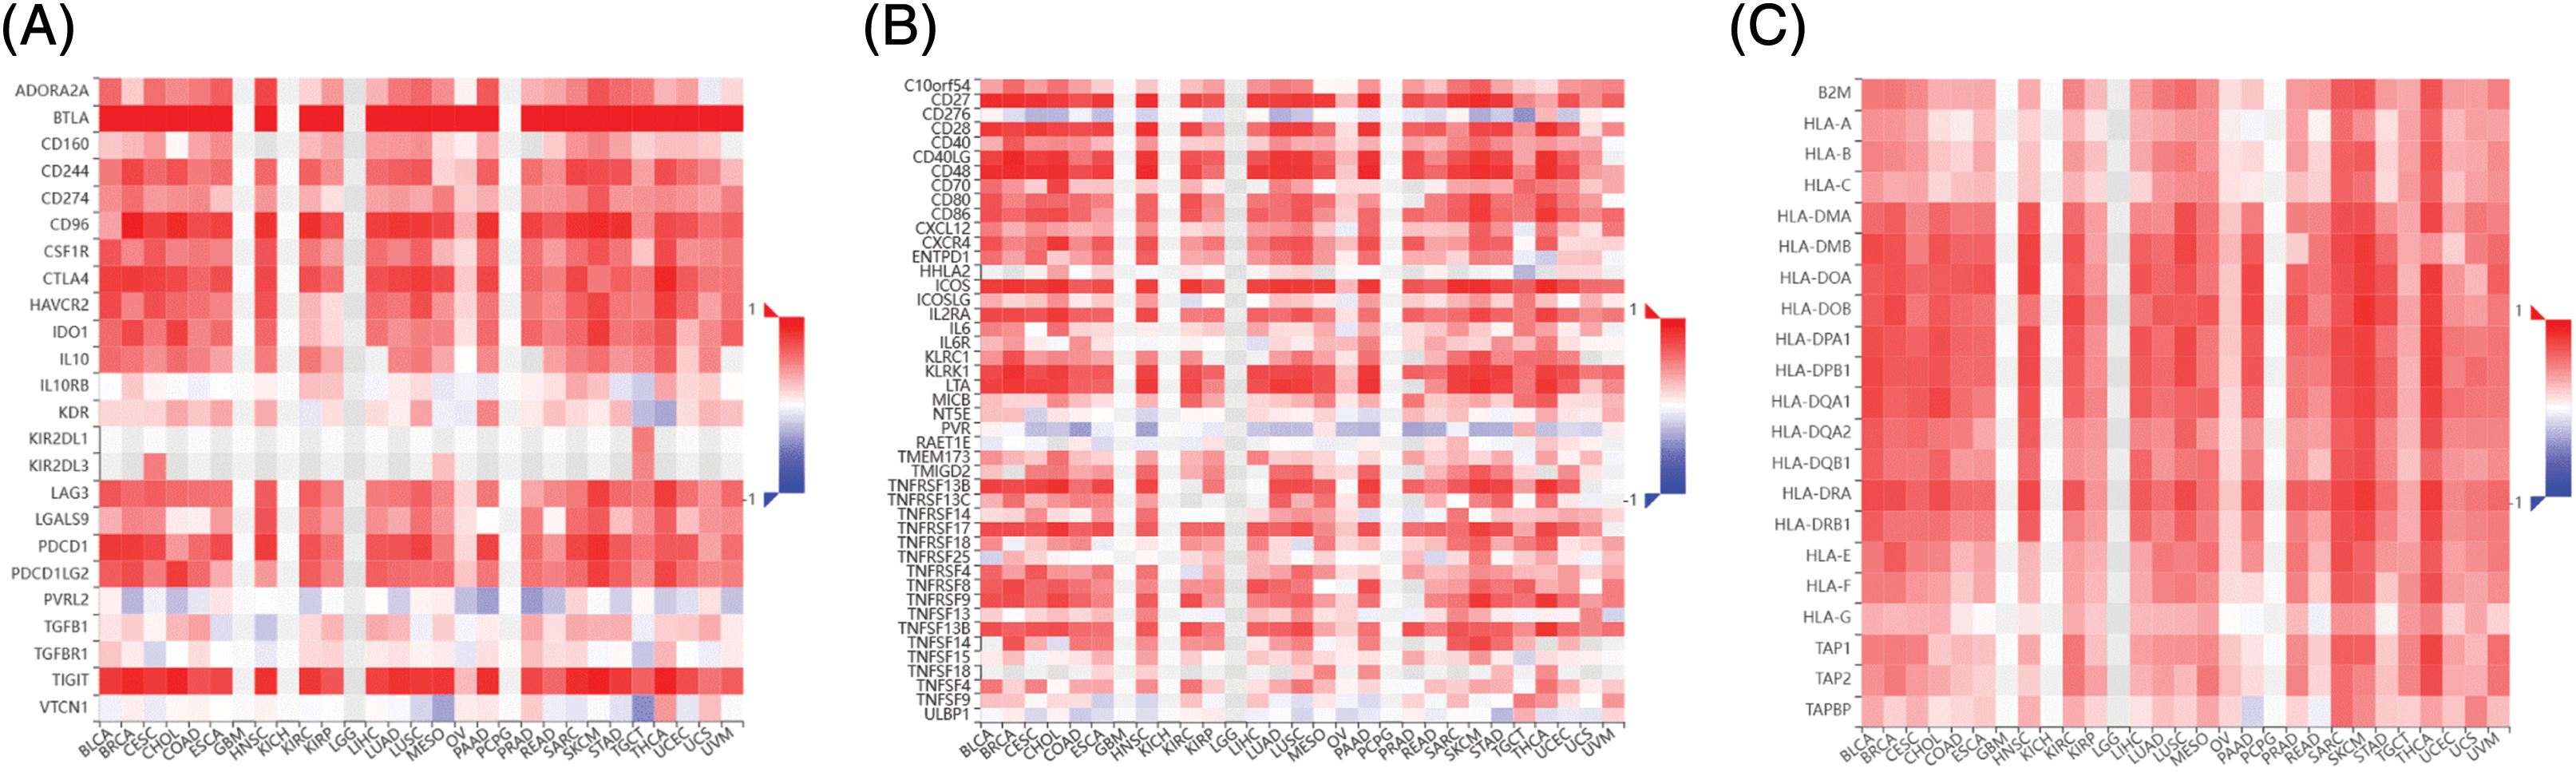
Figure 10: Correlation between B and T-lymphocyte attenuator (BTLA) and immunoregulatory genes. Correlation between BTLA and Immunoinhibitor (A), Immunostimulator (B), and major histocompatibility complex (MHC) molecule (C) in various cancers.
Analysis of B and T-lymphocyte attenuator and its co-expression genes enrichment
BTLA and BTLA co-expression genes were collected from 33 cancers, and their pathways involved in the human body were observed. Data were presented by GO functional annotation and KEGG pathway analysis. In general, BTLA regulates the immune response regulating cell surface receptor signaling pathway, antigen binding, antigen receptor-mediated signaling pathway, b cell activation, and b cell-mediated immunity, and gene enrichment analysis in cancers which are related to prognosis (Fig. 11). Immune-related processes, such as leukocyte migration play a positive regulatory role in the context of GO functional annotation. Our data showed that BTLA inhibited cytokine receptor interaction, chemokine signaling pathway, cell adhesion molecules cams, hematopoietic cell lineage, JAK stat signaling pathway, and natural killer cell-mediated cytotoxicity. The olfactory transduction, T cell receptor signaling pathway, and other immune-related pathways play a positive regulatory role. In TGCT, BTLA regulates the calcium signaling pathway, drug metabolism by cytochrome p450, and metabolism of xenobiotics by cytochrome p450. Neuroactive ligand-receptor interaction and steroid hormone biosynthesis negatively regulate these pathways.
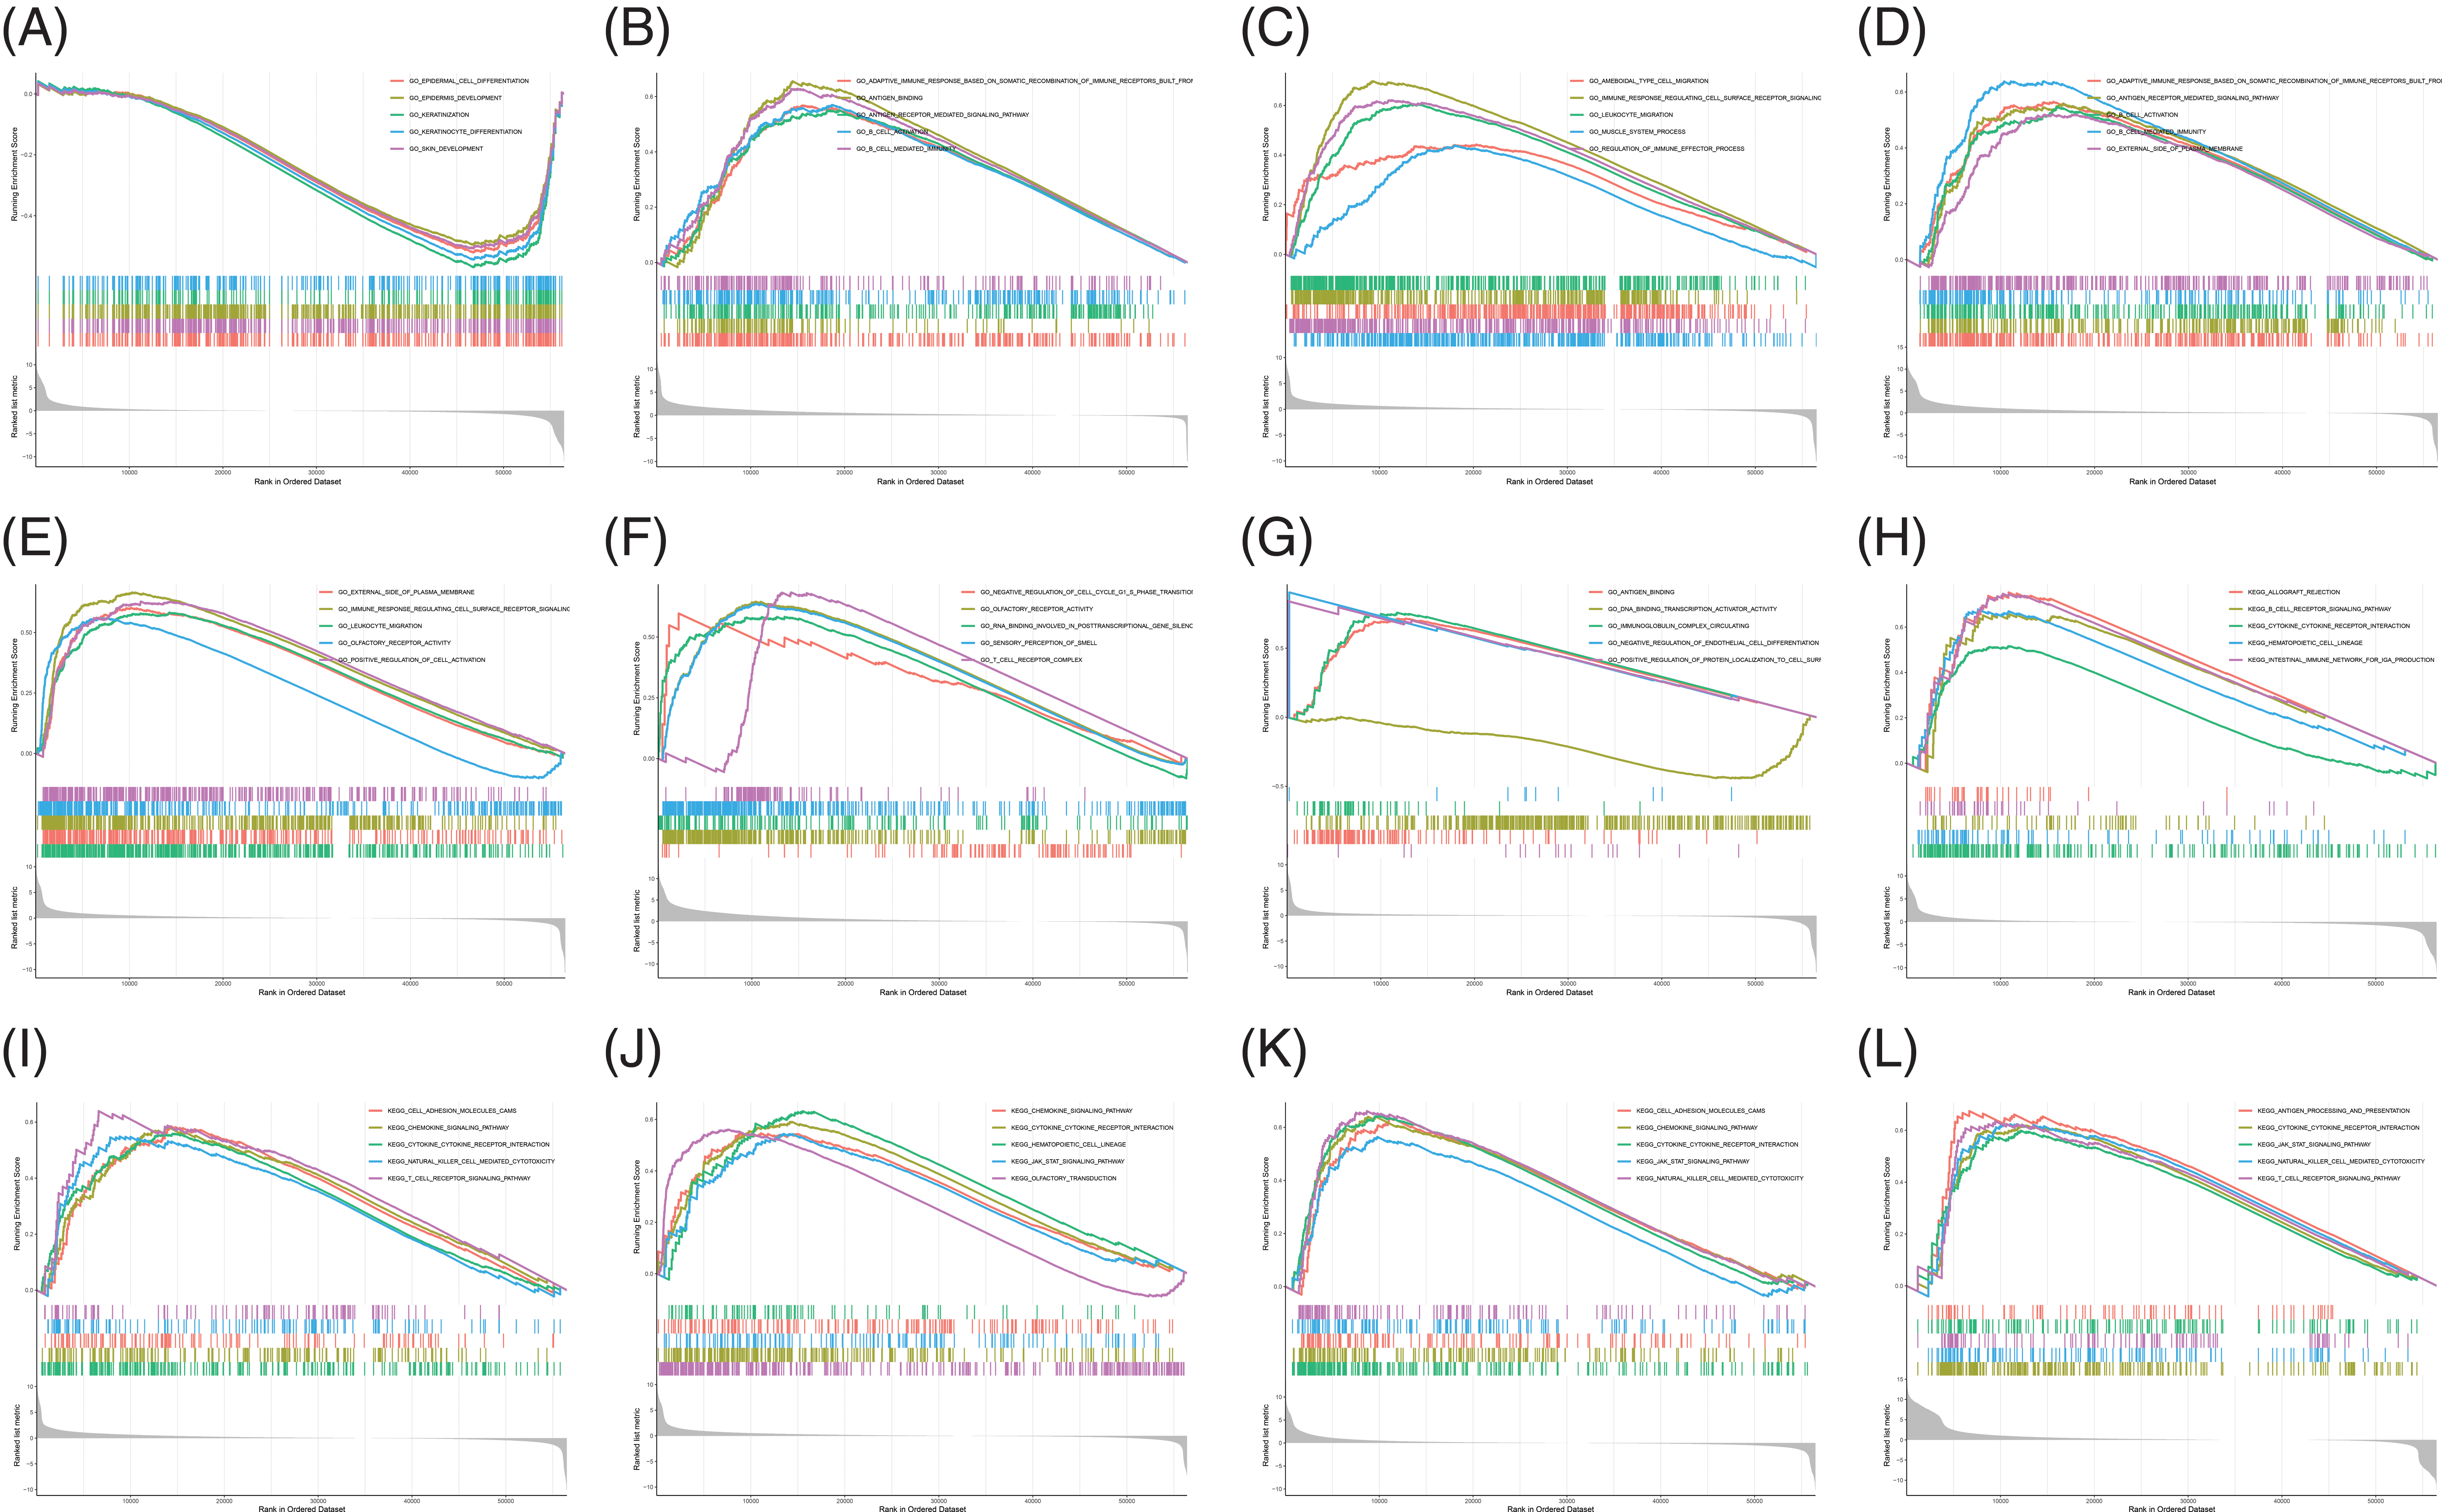
Figure 11: Analysis of B and T-lymphocyte attenuator (BTLA) and BTLA co-expression genes enrichment. Gene ontology functional annotation of BTLA in CESC (A), ESCA (B), HNSC (C), KIRP (D), LGG (E), LUAD (F), and OV (G). KEGG pathway analysis of BTLA in CESC (H), HNSC (I), LGG (J), SKCM (K), and UVM (L).
BTLA is expressed on tumor-infiltrating lymphocytes, and as an immunosuppressive receptor, BTLA inhibits the activity of T cells and mainly plays an immunosuppressive role in more tumors (Derré et al., 2010; Fourcade et al., 2012; Zhao et al., 2018). Our data showed that BTLA had high or low abnormal expression in a variety of cancer types, and the differential expression in roughly one-quarter of tumors was statistically significant. In tumor types with a statistically significant differential expression, about half showed low expression, and the other half showed high expression. These findings confirmed the complex underlying mechanism of BTLA and its ligands having dual regulatory effects in tumors. Analysis of data from the CCLE database showed that BTLA was the most highly expressed in CLL cells. The study demonstrated that BTLA showed higher expression in B cells and T cells of CLL patients compared with healthy individuals (Karabon et al., 2020). In another study, the BTLA/HVEM axis was shown to possibly inhibit natural-killer cell-mediated tumor immune activity in CLL, and the expression of BTLA was significantly associated with a relatively short treatment time (Sordo-Bahamonde et al., 2021). The results of qRT-PCR showed that the differential expression of BTLA in colorectal cancer was consistent with the results of bioinformatics analysis at the mRNA level.
Our analysis showed that the expression of BTLA was statistically correlated with the OS of 13 types of cancer, namely BLCA, BRCA, CESC, HNSC, KIRP, LIHC, LUAD, OV, READ, SARC, UCEC, KIRC, and TGCT. The expression of BTLA was not only associated with the RFS of BLCA, CESC, LIHC, OV, UCEC, STAD, KIRP, and ESCA but also with the DSS of CESC, HNSC, SKCM, and UVM. A clinical trial involving 60 COAD patients and 15 healthy volunteers showed that BTLA expression was an independent prognostic factor for COAD and was significantly associated with a shorter OS in COAD patients. In the process of constructing the ceRNA network, our data showed that has-miR-137 was negatively correlated with the expression of BTLA in the miRNA target of BTLA. Furthermore, analysis of hsa-miR-137 in the KM prognosis of cancer patients showed that hsa-miR-137 was a relatively favorable prognostic factor for many types of cancer, although not absolute. In previous studies, hsa-miR-137 has also been shown to be a tumor suppressor in Triple-negative breast cancer (TNBC), osteosarcoma cancer, oral cancer, STAD, COAD, cholangiocarcinoma cell and OV (Dang et al., 2013; Sakaguchi et al., 2016; Chen et al., 2018; Zhang et al., 2018; Chen et al., 2020a; Chen et al., 2020b; Weng and Wang, 2022). The negative correlation between BTLA and hsa-miR-137 suggests that BTLA may promote tumor progression by inhibiting the expression of hsa-miR-137.
Clinical analysis showed that BTLA expression was significantly different in different stages of COAD, KICH, KIRC, KIRP, LUAD, and STAD. It suggests that BTLA is associated with the progression of these cancers. In recent studies, it was shown that BTLA was significantly increased at both the mRNA and protein levels in advanced gastric cancer, indicating that BTLA may promote the progression of gastric cancer by regulating tumor immunity (Azarafza et al., 2022). The expression of BTLA in elderly patients with ACC, BRCA, STAD, and TYHM is higher. The older the age, the more gene accumulation (Franco et al., 2019; Szilard, 1959); therefore, it was speculated that age may increase the expression of BTLA by cumulative mutations, which promotes the occurrence and development of cancer. At present, the clinical research on BTLA is not sufficient, but only from the existing test, the separate expression of BTLA is associated with the prognosis of patients with non-small cell lung cancer (NSCLC) and OV (Li et al., 2020; Świderska et al., 2022), which is consistent with the results of BTLA pan-cancer prognosis analysis, reflecting the potential of BTLA as a prognostic marker for cancer patients to evaluate the survival status of patients. In these cancers, the expression of BTLA is often a poor prognostic factor, which is consistent with the biological characteristics of BTLA inhibiting lymphocytes and providing some evidence for the efficacy of immune-checkpoint inhibitors targeting BTLA. Although not perfect, TMB and MSI are still the main biomarkers for evaluation (Campesato et al., 2015; Niu et al., 2014). The expression of BTLA significantly correlated with the TMB of 13 cancers and the MSI of 10 cancers, thereby indicating the potential of BTLA as a biomarker for evaluating the therapeutic effect of immune-checkpoint inhibitors.
To further understand the underlying mechanism of action of BTLA in tumors and to identify the key indicators of TME to predict the effect of CIT, a variety of algorithms were used for immune infiltration analysis (Galon et al., 2012). The data indicated that the expression of BTLA showed an obvious trend with the infiltration of various immune cells, and its expression was particularly obvious for the activation of dendritic cells, M1 macrophages, memory CD8 + T cells, and memory CD4 + T cells, and the inhibition of M0 macrophages, M2 macrophages, and resting-memory CD4 + T cells. Immune cells play a major role in tumor immunity and CIT (Rusakiewicz et al., 2013), and previous studies have shown that BTLA has complex effects on immune cells. In general, BTLA does not directly inhibit the growth of T cells and B cells but can mediate the immune tolerance of immature dendritic cells (Simon and Bromberg, 2016). When combined with its ligand HVEM, BTLA can inhibit the function of T cells and B cells. These findings provide novel ideas for the treatment of autoimmune diseases (Flynn et al., 2013; Sordo-Bahamonde et al., 2021). BTLA has a positive regulatory effect on cytokine receptor interaction, the chemokine signaling pathway, cell adhesion molecules cams, immune response regulation cell surface receptor signaling pathway, antigen binding, and other immune-related processes and pathways; BTLA affects cancer immunity by activating these immune-related pathways. Results showed the expression of BTLA in various tumors and the prognosis of patients, especially the activation and inhibition of BTLA on different immune cells in the tumor microenvironment, and explored the possible ways to specifically inhibit anti-tumor immunity.
In the analysis of the correlation between BTLA and immune regulatory genes, we found that the expression of BTLA was significantly positively correlated with the expression of immunosuppressive genes such as PDCD1, TIGIT, CTLA4, and CD96, which are members of the immunoglobulin-related receptor family. Besides, BTLA is similar to the immunosuppressive treatment targets CTLA4 and PD-1 in structure (Carter and Carreno, 2003; Watanabe et al., 2003), and the structure determines the function to a certain extent. The expression of PDCD1, TIGIT, and CTLA4 was mainly through the regulation of T cell immunity, thus hindering the progress of cancer immunity (Garapati and Lefranc, 2007; Yu et al., 2009; Yokosuka et al., 2010; Legoux et al., 2015). CIT targeting PDCD1 and CTLA4 has been successful in clinical practice (Cameron et al., 2011; Lipson and Drake, 2011; Barbee et al., 2015; Barretina et al., 2012; Antonia et al., 2016). There is growing evidence showing that it is reasonable and necessary to consider BTLA, TIGIT, and CD96 as targets for future immunotherapy. Furthermore, according to preliminary findings, CIT for BTLA may achieve a therapeutic effect by strengthening tumor immunity (Qin et al., 2019). In this study, 33 different types of tumors were thoroughly analyzed, but all data were obtained from the TCGA database. The limitations of these studies is no sufficient experiments to support the conclusion. In general, high expression of BTLA in BLCA, BRCA, CESC, HNSC, KIRP, LIHC, LUAD, OV, READ, SARC, and UCEC was significantly associated with a shorter OS. Correspondingly, the data showed that the expression of BTLA in BLCA, BRCA, CESC, HNSC, KIRP, LIHC, LUAD, OV, READ, SARC, and UCEC was also significantly positively correlated with the ImmuneScore, which may suggest that BTLA is involved in tumor progression by affecting tumor immunity. In addition, in several studies, peptides based on the binding fragment of gD protein were designed, which can prevent the combination of BTLA and HVEM and provide a new method for targeted therapy of BTLA (Kuncewicz et al., 2022). BTLA can be used as a novel target for CIT and can successfully be converted into novel clinical drugs, thereby achieving the same success as CTLA-4 or PD-1/PD-L1 blockers to benefit cancer patients.
In general, this is the first comprehensive pan-cancer analysis of BTLA. After collecting data from several databases and performing statistical analysis, the expression level of BTLA (and its expression in colon cancer at the cellular level was verified), mutation status, prognosis, and immune infiltration of BTLA in various cancer tissues were explored. This study will help to understand the role of BTLA in cancer development in multiple dimensions. Combined with the results obtained in previous studies, the data showed that BTLA has the potential as a prognostic marker for CLL, COAD, NSCLC, and OV and as a diagnostic marker for CLL, COAD, and KIRC.
Acknowledgement: This work has benefited from the aforementioned databases. The authors thank the Key Laboratory of Molecular Diagnostics and Precision Medicine for Surgical Oncology in Gansu Province and the DaVinci Surgery System Database (DSSD) for their help and support in the methodology.
Availability of Data and Materials: The datasets analyzed during the current study are available in TCGA (https://portal.gdc.cancer.gov/), Kaplan Meier plotter portal (https://kmplot.com/analysis/), cBioPortal database (http://cbioportal.org), Starbase database (https://starbase.sysu.edu.cn/) and TISIDB database (http://cis.hku.hk/TISIDB/).
Supplementary Material: The supplementary material is available online at DOI: 10.32604/biocell.2023.025157.
Author Contributions: Xianglai Jiang and Yongfeng Wang conceived the study, Xianglai Jiang, Jin He, Jiahui Liu, Xiangyang Li, and Xiangui He comprehensively collected relevant data, Xianglai Jiang and Yongfeng Wang completed the work on data analysis and completed the draft, and Hui Cai reviewed the paper.
Ethics Approval: Not applicable.
Funding Statement: This work was funded by the Central to guide local scientific and Technological Development (ZYYDDFFZZJ-1), Natural Science Foundation of Gansu Province, China (No. 18JR3RA052), Lanzhou Talent Innovation and Entrepreneurship Project Task Contract (No. 2016-RC-56), Gansu Da Vinci Robot High-End Diagnosis and Treatment Team Construction Project, and Gansu Provincial Youth Science and Technology Fund Program (20JR10RA415), and National Key Research and Development Program (No. 2018YFC1311500).
Conflicts of Interest: The authors declare that they have no conflicts of interest to report regarding the present study.
References
Aggarwal BB, Shishodia S, Ashikawa K, Bharti ACJCDT-I, Allergy (2002). The role of TNF and its family members in inflammation and cancer: Lessons from gene deletion. Current Drug Targets-Inflammation & Allergy 1: 327–341. DOI 10.2174/1568010023344571. [Google Scholar] [CrossRef]
Albertson DGJTiG (2006). Gene amplification in cancer. Trend in Genetics 22: 447–455. DOI 10.1016/j.tig.2006.06.007. [Google Scholar] [CrossRef]
Antonia S, Goldberg SB, Balmanoukian A, Chaft JE, Sanborn RE et al. (2016). Safety and antitumour activity of durvalumab plus tremelimumab in non-small cell lung cancer: A multicentre, phase 1b study. The Lancet Oncology 17: 299–308. DOI 10.1016/S1470-2045(15)00544-6. [Google Scholar] [CrossRef]
Arneth BJM (2020). Tumor microenvironment. Medicina 56: 15. DOI 10.3390/medicina56010015. [Google Scholar] [CrossRef]
Azarafza M, Tehrani M, Valadan R, Maleki I, Mohammad Mehdi Ghaffari-Hamedani S, Ghanadan A, Alizadeh-Navaei R, Ajami A (2022). Role of BTLA/HVEM network in development of gastric cancer. Human Immunology 83: 637–644. DOI 10.1016/j.humimm.2022.07.003. [Google Scholar] [CrossRef]
Barbee MS, Ogunniyi A, Horvat TZ, Dang TO (2015). Current status and future directions of the immune checkpoint inhibitors ipilimumab, pembrolizumab, and nivolumab in oncology. The Annals of Pharmacotherapy 49: 907–937. DOI 10.1177/1060028015586218. [Google Scholar] [CrossRef]
Barretina J, Caponigro G, Stransky N, Venkatesan K, Margolin AA, Kim S, Wilson CJ, Lehár J, Kryukov GV, Sonkin DJN (2012). The cancer cell line encyclopedia enables predictive modelling of anticancer drug sensitivity. Nature 483: 603–607. DOI 10.1038/nature11003. [Google Scholar] [CrossRef]
Cameron F, Whiteside G, Perry C (2011). Ipilimumab: First global approval. Drugs 71: 1093–1104. DOI 10.2165/11594010-000000000-00000. [Google Scholar] [CrossRef]
Campesato LF, Barroso-Sousa R, Jimenez L, Correa BR, Sabbaga J, Hoff PM, Reis LF, Galante PA, Camargo AA (2015). Comprehensive cancer-gene panels can be used to estimate mutational load and predict clinical benefit to PD-1 blockade in clinical practice. Oncotarget 6: 34221–34227. DOI 10.18632/oncotarget.5950. [Google Scholar] [CrossRef]
Carter LL, Carreno BM (2003). Cytotoxic T-lymphocyte antigen-4 and programmed death-1 function as negative regulators of lymphocyte activation. Immunologic Research 28: 49–59. DOI 10.1385/IR:28:1:49. [Google Scholar] [CrossRef]
Cerami E, Gao J, Dogrusoz U, Gross BE, Sumer SO et al. (2012). The cBio cancer genomics portal: An open platform for exploring multidimensional cancer genomics data. Cancer Discovery 2: 401–404. DOI 10.1158/2159-8290.CD-12-0095. [Google Scholar] [CrossRef]
Chen W, Du J, Li X, Zhi Z, Jiang S (2020b). microRNA-137 downregulates MCL1 in ovarian cancer cells and mediates cisplatin-induced apoptosis. Pharmacogenomics 21: 195–207. DOI 10.2217/pgs-2019-0122. [Google Scholar] [CrossRef]
Chen T, Lei S, Zeng Z, Pan S, Zhang J et al. (2020a). MicroRNA‐137 suppresses the proliferation, migration and invasion of cholangiocarcinoma cells by targeting WNT2B. International Journal of Molecular Medicine 45: 886–896. DOI 10.3892/ijmm.2020.4474. [Google Scholar] [CrossRef]
Chen F, Luo N, Hu Y, Li X, Zhang K (2018). MiR-137 suppresses triple-negative breast cancer stemness and tumorigenesis by perturbing BCL11A-DNMT1 interaction. Cellular Physiology and Biochemistry: International Journal of Experimental Cellular Physiology, Biochemistry, and Pharmacology 47: 2147–2158. DOI 10.1159/000491526. [Google Scholar] [CrossRef]
Dang J, Bian YQ, Sun JY, Chen F, Dong GY, Liu Q, Wang XW, Kjems J, Gao S, Wang QT (2013). MicroRNA-137 promoter methylation in oral lichen planus and oral squamous cell carcinoma. Journal of Oral Pathology & Medicine 42: 315–321. DOI 10.1111/jop.12012. [Google Scholar] [CrossRef]
Demerlé C, Gorvel L, Olive D (2021). BTLA-HVEM couple in health and diseases: Insights for immunotherapy in lung cancer. Frontiers in Oncology 11: 682007. DOI 10.3389/fonc.2021.682007. [Google Scholar] [CrossRef]
Derré L, Rivals JP, Jandus C, Pastor S, Rimoldi D, Romero P, Michielin O, Olive D, Speiser DE (2010). BTLA mediates inhibition of human tumor-specific CD8+ T cells that can be partially reversed by vaccination. Journal of Clinical Investigation 120: 157–167. DOI 10.1172/JCI40070. [Google Scholar] [CrossRef]
Flynn R, Hutchinson T, Murphy KM, Ware CF, Croft M, Salek-Ardakani S (2013). CD8 T cell memory to a viral pathogen requires trans cosignaling between HVEM and BTLA. PLoS One 8: e77991. DOI 10.1371/journal.pone.0077991. [Google Scholar] [CrossRef]
Fourcade J, Sun Z, Pagliano O, Guillaume P, Luescher IF, Sander C, Kirkwood JM, Olive D, Kuchroo V, Zarour HM (2012). CD8+ T cells specific for tumor antigens can be rendered dysfunctional by the tumor microenvironment through upregulation of the inhibitory receptors BTLA and PD-1. Cancer Research 72: 887–896. DOI 10.1158/0008-5472.CAN-11-2637. [Google Scholar] [CrossRef]
Franco I, Helgadottir HT, Moggio A, Larsson M, Vrtačnik P et al. (2019). Whole genome DNA sequencing provides an atlas of somatic mutagenesis in healthy human cells and identifies a tumor-prone cell type. Genome Biology 20: 285. DOI 10.1186/s13059-019-1892-z. [Google Scholar] [CrossRef]
Fukumura D, Kloepper J, Amoozgar Z, Duda DG, Jain RK (2018). Enhancing cancer immunotherapy using antiangiogenics: Opportunities and challenges. Nature Reviews Clinical Oncology 15: 325–340. DOI 10.1038/nrclinonc.2018.29. [Google Scholar] [CrossRef]
Galon J, Pagès F, Marincola FM, Angell HK, Thurin M et al. (2012). Cancer classification using the immunoscore: A worldwide task force. Journal of Translational Medicine 10: 205. DOI 10.1186/1479-5876-10-205. [Google Scholar] [CrossRef]
Gao J, Aksoy BA, Dogrusoz U, Dresdner G, Gross B, Sumer SO, Sun Y, Jacobsen A, Sinha R, Larsson EJSS (2013b). Integrative analysis of complex cancer genomics and clinical profiles using the cBioPortal. Science Signaling 6: pl1. DOI 10.1126/scisignal.2004088. [Google Scholar] [CrossRef]
Garapati VP, Lefranc MP (2007). IMGT Colliers de Perles and IgSF domain standardization for T cell costimulatory activatory (CD28, ICOS) and inhibitory (CTLA4, PDCD1 and BTLA) receptors. Developmental and Comparative Immunology 31: 1050–1072. DOI 10.1016/j.dci.2007.01.008. [Google Scholar] [CrossRef]
Gentleman RC, Carey VJ, Bates DM, Bolstad B, Dettling M et al. (2004). Bioconductor: Open software development for computational biology and bioinformatics. Genome Biology 5: R80. DOI 10.1186/gb-2004-5-10-r80. [Google Scholar] [CrossRef]
Györffy B, Lanczky A, Eklund AC, Denkert C, Budczies J, Li Q, Szallasi Z (2010). An online survival analysis tool to rapidly assess the effect of 22,277 genes on breast cancer prognosis using microarray data of 1,809 patients. Breast Cancer Research and Treatment 123: 725–731. DOI 10.1007/s10549-009-0674-9. [Google Scholar] [CrossRef]
Kalaora S, Nagler A, Wargo JA, Samuels Y (2022). Mechanisms of immune activation and regulation: Lessons from melanoma. Nature Reviews Cancer 22: 195–207. DOI 10.1038/s41568-022-00442-9. [Google Scholar] [CrossRef]
Karabon L, Partyka A, Ciszak L, Pawlak-Adamska E, Tomkiewicz A et al. (2020). Abnormal expression of BTLA and CTLA-4 immune checkpoint molecules in chronic lymphocytic leukemia patients. Journal of Immunology Research 2020: 6545921. DOI 10.1155/2020/6545921. [Google Scholar] [CrossRef]
Korman AJ, Garrett-Thomson SC, Lonberg N (2021). The foundations of immune checkpoint blockade and the ipilimumab approval decennial. Nature Reviews Drug Discovery 21: 509–528. DOI 10.1038/s41573-021-00345-8. [Google Scholar] [CrossRef]
Kuncewicz K, Battin C, Węgrzyn K, Sieradzan A, Wardowska A et al. (2022). Targeting the HVEM protein using a fragment of glycoprotein D to inhibit formation of the BTLA/HVEM complex. Bioorganic Chemistry 122: 105748. DOI 10.1016/j.bioorg.2022.105748. [Google Scholar] [CrossRef]
Legoux FP, Lim JB, Cauley AW, Dikiy S, Ertelt J, Mariani TJ, Sparwasser T, Way SS, Moon JJ (2015). CD4+ T cell tolerance to tissue-restricted self antigens is mediated by antigen-specific regulatory T cells rather than deletion. Immunity 43: 896–908. DOI 10.1016/j.immuni.2015.10.011. [Google Scholar] [CrossRef]
Li JH, Liu S, Zhou H, Qu LH, Yang JH (2014). starBase v2. 0: Decoding miRNA-ceRNA, miRNA-ncRNA and protein–RNA interaction networks from large-scale CLIP-Seq data. Nucleic Acids Research 42: D92–D97. DOI 10.1093/nar/gkt1248. [Google Scholar] [CrossRef]
Li X, Xu Z, Cui G, Yu L, Zhang X (2020). BTLA expression in stage I–III non-small-cell lung cancer and its correlation with PD-1/PD-L1 and clinical outcomes. OncoTargets and Therapy 13: 215–224. DOI 10.2147/OTT. [Google Scholar] [CrossRef]
Lipson EJ, Drake CG (2011). Ipilimumab: An anti-CTLA-4 antibody for metastatic melanoma. Clinical Cancer Research 17: 6958–6962. DOI 10.1158/1078-0432.CCR-11-1595. [Google Scholar] [CrossRef]
Matsui A, Ihara T, Suda H, Mikami H, Semba K (2013). Gene amplification: Mechanisms and involvement in cancer. Biomolecular Concepts 4: 567–582. DOI 10.1515/bmc-2013-0026. [Google Scholar] [CrossRef]
Meyer D, Dimitriadou E, Hornik K, Weingessel A, Leisch F, Chang C, Lin CC (2014). e1071: Misc Functions of the Department of Statistics, Probability Theory Group (Formerly: E1071TU Wien. https://CRAN.R-project.org/package=e1071. [Google Scholar]
Murphy TL, Murphy KM (2010). Slow down and survive: Enigmatic immunoregulation by BTLA and HVEM. Annual Review of Immunology 28: 389–411. DOI 10.1146/annurev-immunol-030409-101202. [Google Scholar] [CrossRef]
Murphy KM, Nelson CA, Sedý JR (2006). Balancing co-stimulation and inhibition with BTLA and HVEM. Nature Reviews Immunology 6: 671–681. DOI 10.1038/nri1917. [Google Scholar] [CrossRef]
Niu B, Ye K, Zhang Q, Lu C, Xie M, McLellan MD, Wendl MC, Ding L (2014). MSIsensor: Microsatellite instability detection using paired tumor-normal sequence data. Bioinformatics 30: 1015–1016. DOI 10.1093/bioinformatics/btt755. [Google Scholar] [CrossRef]
Ogata H, Goto S, Sato K, Fujibuchi W, Kanehisa MJNAR (1999). KEGG: Kyoto encyclopedia of genes and genomes. Nucleic Acids Research 27: 29–34. DOI 10.1093/nar/27.1.29. [Google Scholar] [CrossRef]
Paulos CM, June CH (2010). Putting the brakes on BTLA in T cell-mediated cancer immunotherapy. Journal of Clinical Investigation 120: 76–80. DOI 10.1172/JCI41811. [Google Scholar] [CrossRef]
Qin S, Xu L, Yi M, Yu S, Wu K, Luo S (2019). Novel immune checkpoint targets: Moving beyond PD-1 and CTLA-4. Molecular Cancer 18: 155. DOI 10.1186/s12943-019-1091-2. [Google Scholar] [CrossRef]
Rowshanravan B, Halliday N, Sansom DM (2018). CTLA-4: A moving target in immunotherapy. Blood 131: 58–67. DOI 10.1182/blood-2017-06-741033. [Google Scholar] [CrossRef]
Rusakiewicz S, Semeraro M, Sarabi M, Desbois M, Locher C et al. (2013). Immune infiltrates are prognostic factors in localized gastrointestinal stromal tumors. Cancer Research 73: 3499–3510. DOI 10.1158/0008-5472.CAN-13-0371. [Google Scholar] [CrossRef]
Sakaguchi M, Hisamori S, Oshima N, Sato F, Shimono Y, Sakai Y (2016). miR-137 regulates the tumorigenicity of colon cancer stem cells through the inhibition of DCLK1. Molecular Cancer Research 14: 354–362. DOI 10.1158/1541-7786.MCR-15-0380. [Google Scholar] [CrossRef]
Salmena L, Poliseno L, Tay Y, Kats L, Pandolfi PPJC (2011). A ceRNA hypothesis: The Rosetta Stone of a hidden RNA language? Cell 146: 353–358. DOI 10.1016/j.cell.2011.07.014. [Google Scholar] [CrossRef]
Siegel RL, Miller KD, Jemal A (2020). Cancer statistics, 2020. CA: A Cancer Journal for Clinicians 70: 7–30. DOI 10.3322/caac.21590. [Google Scholar] [CrossRef]
Simon T, Bromberg JS (2016). BTLA+ Dendritic cells: The regulatory T cell force awakens. Immunity 45: 956–958. DOI 10.1016/j.immuni.2016.10.030. [Google Scholar] [CrossRef]
Smyth GK (2004). Linear models and empirical bayes methods for assessing differential expression in microarray experiments. Statistical Applications in Genetics and Molecular Biology 3: Article3. DOI 10.2202/1544-6115.1027. [Google Scholar] [CrossRef]
Sordo-Bahamonde C, Lorenzo-Herrero S, Gonzalez-Rodriguez AP, Payer AR, González-García E, López-Soto A, Gonzalez S (2021). BTLA/HVEM axis induces NK cell immunosuppression and poor outcome in chronic lymphocytic leukemia. Cancers 13: 1766. DOI 10.3390/cancers13081766. [Google Scholar] [CrossRef]
Subramanian A, Tamayo P, Mootha VK, Mukherjee S, Ebert BL et al. (2005). Gene set enrichment analysis: A knowledge-based approach for interpreting genome-wide expression profiles. PNAS 102: 15545–15550. DOI 10.1073/pnas.0506580102. [Google Scholar] [CrossRef]
Świderska J, Kozłowski M, Gaur M, Pius-Sadowska E, Kwiatkowski S, Machaliński B, Cymbaluk-Płoska A (2022). Clinical significance of BTLA, CD27, CD70, CD28 and CD80 as diagnostic and prognostic markers in ovarian cancer. Diagnostics 12: 251. DOI 10.3390/diagnostics12020251. [Google Scholar] [CrossRef]
Szilard L (1959). On the nature of the aging process. PNAS 45: 30–45. DOI 10.1073/pnas.45.1.30. [Google Scholar] [CrossRef]
Watanabe N, Gavrieli M, Sedy JR, Yang J, Fallarino F et al. (2003). BTLA is a lymphocyte inhibitory receptor with similarities to CTLA-4 and PD-1. Nature Immunology 4: 670–679. DOI 10.1038/ni944. [Google Scholar] [CrossRef]
Weng XQ, Wang W (2022). miR-137 modulates human gastric cancer cell proliferation, apoptosis, and migration by targeting EZH2. Critical Reviews in Eukaryotic Gene Expression 32: 31–40. DOI 10.1615/CritRevEukaryotGeneExpr.2022041013. [Google Scholar] [CrossRef]
Wickham H (2016). Getting started with ggplot2. In: ggplot2. Springer, Cham. DOI 10.1007/978-3-319-24277-4_2. [Google Scholar] [CrossRef]
Wojciechowicz K, Spodzieja M, Lisowska KA, Wardowska A (2022). The role of the BTLA-HVEM complex in the pathogenesis of autoimmune diseases. Cellular Immunology 376: 104532. DOI 10.1016/j.cellimm.2022.104532. [Google Scholar] [CrossRef]
Wyld L, Audisio RA, Poston GJ (2015). The evolution of cancer surgery and future perspectives. Nature Reviews Clinical Oncology 12: 115–124. DOI 10.1038/nrclinonc.2014.191. [Google Scholar] [CrossRef]
Xu X, Hou B, Fulzele A, Masubuchi T, Zhao Y et al. (2020). PD-1 and BTLA regulate T cell signaling differentially and only partially through SHP1 and SHP2. The Journal of Cell Biology 219: 848. DOI 10.1083/jcb.201905085. [Google Scholar] [CrossRef]
Yang Y (2015). Cancer immunotherapy: Harnessing the immune system to battle cancer. Journal of Clinical Investigation 125: 3335–3337. DOI 10.1172/JCI83871. [Google Scholar] [CrossRef]
Yokosuka T, Kobayashi W, Takamatsu M, Sakata-Sogawa K, Zeng H, Hashimoto-Tane A, Yagita H, Tokunaga M, Saito T (2010). Spatiotemporal basis of CTLA-4 costimulatory molecule-mediated negative regulation of T cell activation. Immunity 33: 326–339. DOI 10.1016/j.immuni.2010.09.006. [Google Scholar] [CrossRef]
Yu X, Harden K, Gonzalez LC, Francesco M, Chiang E et al. (2009). The surface protein TIGIT suppresses T cell activation by promoting the generation of mature immunoregulatory dendritic cells. Nature Immunology 10: 48–57. DOI 10.1038/ni.1674. [Google Scholar] [CrossRef]
Yu G, Wang LG, Han Y, He QY (2012). clusterProfiler: An R package for comparing biological themes among gene clusters. OMICS: A Journal of Integrative Biology 16: 284–287. DOI 10.1089/omi.2011.0118. [Google Scholar] [CrossRef]
Zhang W, Chen JH, Shan T, Aguilera-Barrantes I, Wang LS, Huang TH, Rader JS, Sheng X, Huang YW (2018). miR-137 is a tumor suppressor in endometrial cancer and is repressed by DNA hypermethylation. Laboratory Investigation 98: 1397–1407. DOI 10.1038/s41374-018-0092-x. [Google Scholar] [CrossRef]
Zhao Y, Harrison DL, Song Y, Ji J, Huang J, Hui E (2018). Antigen-presenting cell-intrinsic PD-1 neutralizes PD-L1 in cis to attenuate PD-1 signaling in T cells. Cell Reports 24: 379-390.e376. DOI 10.1016/j.celrep.2018.06.054. [Google Scholar] [CrossRef]
FIGURE S1. The relationship between BTLA expression and ImmuneScore in OV, TGCT, THYM, and UCS.
FIGURE S2. The relationship between BTLA expression and immune cell infiltration in pan-cancer.
Cite This Article
 Copyright © 2023 The Author(s). Published by Tech Science Press.
This work is licensed under a Creative Commons Attribution 4.0 International License , which permits unrestricted use, distribution, and reproduction in any medium, provided the original work is properly cited.
 Downloads
 Citation Tools