
 Submit a Paper
 Propose a Special lssue
 Open Access
ARTICLE

Transcriptome analysis reveals potential genes associated with plant height in rice
Guangxi Key Laboratory of Rice Genetics and Breeding, Rice Research Institute, Guangxi Academy of Agricultural Sciences, Nanning, 530007, China
* Corresponding Authors: XINGHAI YANG. Email: ; DANTING LI. Email:
BIOCELL 2023, 47(2), 409-421. https://doi.org/10.32604/biocell.2023.023543
Received 30 April 2022; Accepted 24 September 2022; Issue published 18 November 2022
 View Full Text
 Download PDF
Abstract
Plant height (PH) is a complex trait regulated by the environment and multiple genes. PH directly affects crop yield, harvest index, and lodging resistance. From plant dwarf mutants, many genes related to PH have been identified and described. Nonetheless, the molecular mechanism of height regulation in high-culm rice mutants has not been well studied. By using transcriptome and weighted gene co-expression network analysis (WGCNA), we identified the differentially expressed genes (DEGs) between high-culm rice mutants (MUT) and wild-type (WT) and explored the key pathways and potential candidate genes involved in PH regulation. Transcriptome analysis identified a total of 2,184 DEGs, of which 1,317 were identified at the jointing stage and 1,512 were identified at the heading stage. Kyoto Encyclopedia of Genes and Genomes enrichment showed that the enrichment pathways were mainly involved in plant hormone signal transduction, ABC transportation, and steroid hormone biosynthesis. Among these metabolic pathways, LOC_Os05g43910 and LOC_Os01g35030 were auxin (IAA)-related genes, up-regulated in MUT and LOC_Os02g08500 (LEPTO1), LOC_Os11g04720, and LOC_Os12g04500 were cytokinin (CK)-related genes, down-regulated in MUT. The WGCNA identified four modules (light cyan, dark grey, grey, and pale turquoise) closely related to PH, and seven key genes were screened from these modules, of which two were up-regulated cell wall-related genes (LOC_Os01g26174 (OsWAK5), LOC_Os06g05050) in MUT, and one gibberellic acid (GA) gene (LOC_Os06g37364, OsKO2) was also up-regulated. These genes might be closely related to PH regulation. These findings help us better understand the transcriptional regulation of rice plant growth and development and provide a theoretical basis for mapping and cloning the PH regulatory genes.Keywords
Supplementary Material
Supplementary Material FileRice is an important food crop that feeds more than half of the world’s population. With the changes in farming methods and increasing labor costs, mechanized harvesting for rice production is becoming more common. Therefore, there is an urgent need to breed rice varieties resistant to dense planting and lodging, and suitable for mechanized harvesting. Semi-dwarfing is an important agronomic trait in rice breeding, which is closely related to harvest index, lodging resistance, and mechanical harvesting (Spielmeyer et al., 2002). The selection of dwarf varieties promoted the first “green revolution” of wheat and rice and led to a significant increase in crop yield (Khush, 1999). Therefore, the identification of genes related to plant height (PH) and the analysis of regulatory networks has important theoretical and practical significance in rice breeding.
Rice PH is regulated by a complex network involving multiple genes, which is mainly related to the synthesis and transduction of plant hormones, including auxin (indole acetic acid, IAA), gibberellin (gibberellic acid, GA), brassinolide (BR) and strigolactone (SL). Previous studies have summarized the phytohormone-related genes that regulate PH (Castorina and Consonni, 2020; Liu et al., 2018; Wang et al., 2017). GA is widely used in agricultural breeding and production. For example, the rice sd1 gene, wheat Rht1 gene, and plant growth regulator polyphenols are associated with GA. The GA-gibberellin insensitive dwarf (GID)-aspartic acid–glutamic acid–leucine–leucine–alanine (DELLA) is the most basic GA signaling pathway. Taking two model plants to illustrate the interaction between PH genes and plant hormones: (1) The rice model: GA is sensed by GID1 and forms a GA-GID1-DELLA complex with DELLA. This complex interacts with the subunit GID2 on the E3 ubiquitin ligase Skp1, Cullins, and F-box proteins (SCF), leading to polyubiquitination of DELLA, which is then degraded by the SCF-mediated 26S proteasome system of DELLA (Daviere and Achard, 2013). (2) The Arabidopsis model: Under GA-deficient conditions, the property-stabilized DELLA titers PIFs and BZR transcription factors (TFs) by inhibiting DNA-binding activity, while DELLA interacts with GAF1 and exhibits high transcriptional activity with GAF1. In the presence of GA, DELLA is degraded via the 26S proteasome pathway. Then PIF and BZR activate the target genes. The GAF1-TPR complex exhibit transcriptional repressive activity (Fukazawa et al., 2014).
With the continuous advancement of research techniques and the utilization of new research materials, several new PH-related genes are being localized and cloned. For example, a PH major quantitative trait locus (QTL), qph12, was identified in rice, and knockout experiments verified that LOC_Os12g40490 is the key candidate gene, which is an auxin-responsive Aux/IAA gene family member (He et al., 2022). SD8 (LOC_Os08g45030), a PH-related IAA-associated gene, was also identified, which encodes an ATP-binding cassette-B (ABCB) transporter, and the mutant lines were able to reduce PH and adjust the flag leaf angle, thereby optimizing rice structure without affecting yield (Qu et al., 2022). A PH QTL, qCL1.2, a novel allele of SD1 (LOC_Os01g66100), was identified (Zhang et al., 2020). OsNAC129 (LOC_Os11g31380) is a member of the NAC TFs gene family. A loss of function of OsNAC129 greatly increased grain length, grain weight, apparent straight-chain amylose content (AAC), and PH. Overexpression of OsNAC129 had the opposite effect, significantly decreasing grain width, grain weight, AAC, and PH. OsNAC129 negatively regulates seed development and plant growth and is involved in the BR signaling pathway (Jin et al., 2022). A PH QTL, qPH-3.1(LOC_Os03g64415), encoding a protein containing a kinesin movement structural domain, was characterized as a pleiotropic gene. The knockout lines showed reduced PH, delayed tasseling, reduced fruit set, and increased tiller number (Kong et al., 2022).
In addition to plant hormones, some TFs are also involved in PH growth and development. For example: (1) the TFs involved in the GA pathway: OsbHLH073, an atypical helix-loop-helix TF, participates in the regulation of PH and internode elongation by regulating GA biosynthesis related to Ent-kaurene oxidase (OsKO1 and OsKO2) (Lee et al., 2020). OsWRKY36 represses PH and grain size by inhibiting gibberellin signaling through stabilizing the expression of the slender rice 1 gene (SLR1) (Lan et al., 2020). sRPH1, an AP2/ERF type TF, can negatively regulate PH by modulating GA metabolism-related genes; its overexpression leads to abnormal traits such as decreased PH and reduced internode length (Ma et al., 2020). (2) the TFs involved in the IAA pathway: the number of tillers in OsSPL7 overexpressed plants decreased, while the number of tillers in OsSPL7 RNAi plants increased and the PH decreased (Dai et al., 2018). (3) the TF involved in the BR pathway: OsOFP19 belongs to the OVATE family; by interacting with DWARF, LOW-TILLERING (DLT), and Oryza sativa homeobox1 (OSH1), it negatively regulates the BR response and integrates with cell division, thereby affecting plant configuration (Yang et al., 2018), and (4) the TFs involved in the CK pathway: cytokinin signal transduction is mediated by type A and type B response regulators (RRs). OsORR2 is an Orphans-TF; compared with wild type (WT), overexpression of this gene (type-B RR) could reduce rice PH (Shi et al., 2020).
Some genes regulate rice PH through other pathways. OsWRKY55 (LOC_Os03g20550) can reduce PH by reducing cell size under normal conditions (Huang et al., 2021). Likewise, many other types of genes are involved in the process of PH growth and development. For example, OsARP6 (LOC_Os01g16414) is involved in internode elongation by regulating cell cycle-related genes. The osarp6 knockout mutants show phenotypes such as semi-dwarfism (Ikram et al., 2021). DNL-4 (LOC_Os01g01620) encodes the pfkB carbohydrate kinase protein and is involved in regulating PH and leaf growth (Bae et al., 2021).
Although many PH genes from dwarf mutants and gene-edited lines have been mapped and cloned by researchers, except for a few PH genes like sd1 and its allelic genes, mutations in most genes caused negative effects such as yield reduction, making them unfavorable for production applications. So far, only a few studies have been conducted on the genes that regulate PH but have fewer adverse effects on other agronomic traits. In this study, we identified high-culm rice mutants (MUT) in Guanghui 998 (GH998), an indica conventional rice, which can increase PH, prolong the growth period, change grain shape, and increase grain weight. To understand the molecular mechanism of MUT, we selected the leaves and culms at the jointing stage (at the end of tillering, the base of the rice culm changes from flat to cylindrical, and the internodes elongate, which lasts until the spike, which is called jointing stage, usually around 25 to 36 days) and heading stage, performed transcriptome sequencing of MUT and wild-type (WT) plants, and conducted weighted gene co-expression analysis on the transcriptome data. We explored the key genes, gene networks, and potential candidate genes that regulate PH and provide a theoretical basis for analyzing the molecular regulation network of PH.
The two rice materials used in this study were GH998 with normal PH, defined as WT, and MUT with increased PH, larger leaves, and prolonged growth period. This MUT was a natural mutation of GH998 material. In July 2015, a high-culm mutant plant of GH998 was found. In October of the same year, it was backcrossed with GH998 and then backcrossed twice the following year. The high-culm offspring were selected and then selfed for multiple generations to stabilize PH and other agronomic traits. In March 2020, WT and MUT were planted in the greenhouse of the rice research institute of Guangxi academy of agricultural sciences. The leaves and culms were sampled at the jointing stage and heading stage from three WT and MUT plants. The collected culms were from the upmost internode closed to the spike at the top. The collected leaves were those attached to the uppermost internode. We obtained a total of 24 samples (2 tissue types × 2 genotypes × 2 growth periods × 3 biological replicates = 24 samples). The collected 24 samples were snap-frozen in liquid nitrogen and stored in a −80°C freezer for further assay.
RNA extraction and library construction
Trizol (Invitrogen) was used to extract total RNA from the culms and leaves. RNA integrity and any probable DNA contamination were determined through agarose gel electrophoresis. NanoPhotometer spectrophotometer (Thermo Scientific) was used to measure RNA purity, which was further confirmed on Agilent 2100 bioanalyzer (Thermo Scientific). Magnetic beads with Oligo (dT) were used to isolate mRNA from total RNA via A-T base pairing with the 3′-poly-A tail of the mRNA. Then, mRNA was fragmented into ~300 bp fragments using a fragmentation buffer. Random primers were used for reverse transcription to synthesize the second-strand cDNA. Then, an end repair mix was added to make a blunt end, and an “A” base was added to the 3′ end to connect to the Y-shaped linker. The constructed library was sequenced using Illumina NovaSeq 6000.
Bioinformatics analysis of RNA-seq data
Clean reads were obtained by filtering the raw reads, including reads with adapters, reads containing N (the base information cannot be determined), and low-quality reads (more than 50% of the bases had Qphred ≤ 20). HISAT2 v2.0.5 was used to compare the paired-end clean reads with the Nipponbare reference genome (http://rice.uga.edu/). Feature Counts (1.5.0-p3) were used to calculate the reads mapped to each gene. Then, the fragments per kilobase of exon model per million mapped fragments (FPKM) of each gene were calculated based on the gene length, and the reads mapped to that gene. DESeq2 software (1.16.1) was used to perform differential expression analysis between the two materials. Benjamini and Hochberg method was used to adjust P-value. A corrected P-value < 0.05 and |log2 fold change| > 1 were used as thresholds for determining significantly differentially expressed genes (DEGs). The gene ontology (GO) enrichment analysis and Kyoto Encyclopedia of Genes and Genomes (KEGG) pathway enrichment analysis of DEGs were performed by clusterProfiler (3.4.4) software.
Weighted gene co-expression network analysis
The weighted gene co-expression network analysis (WGCNA) package (Version 1.61) in R was used for weighted gene co-expression network construction. First, the target gene set was screened. According to the filter criterion of FPKM <1 and coefficient of variation >1, we obtained 25,484 genes. The pickSoftThreshold function in WGCNA was called to calculate the power value of the optimal weight parameter as the soft threshold for clustering later. The blockwiseModules function was used for WGCNA clustering of the target gene set. Gene trees were constructed and pruned by dynamic shearing. Gene modules were obtained by fusing the pruned gene tree. To screen for specific modules related to PH, the correlation coefficient R and corresponding P-value between module feature vectors and traits (phenotype of mutant samples was defined as 1, and phenotype of wild-type samples was defined as 0) of each module were calculated, respectively. R > 0 was a positive correlation, and R < 0 was a negative correlation. Modules with |R| > 0.70 and P < 0.05 were further analyzed as specific modules. Cytoscape (version3.5.1) was used to visualize co-expression networks.
Quantitative real-time polymerase chain reaction (qRT-PCR)
Total RNA extraction and cDNA synthesis were carried out as described in the “RNA extraction and library construction” section. The CFX96 quantitative PCR machine (AnalytikJena qTOWERE2, Germany) was used for qPCR reactions. Each 20 µL PCR reaction contained 10 µL 2×SYBR green mix (Novizan, Q711-02), 8.2 µL ddH2O, 1 µL cDNA, and 0.4 µL each of forward and reverse primers. The thermal cycling conditions were as follows: initial denaturation at 95°C for 3 min, denaturation at 95°C for 15 s, annealing at 57°C for 15 s, extension at 72°C for 20 s, for 45 cycles. Then the melting curve was analyzed. qPCR primers are listed in Suppl. Table 1. Actin (LOC_Os03g50885) was the reference gene (Lee et al., 2020). The relative expression levels of candidate genes were determined by the 2−ΔΔCT method.
Phenotype analysis of MUT and wild-type rice materials
As shown in Fig. 1, a significant difference was noted in PH between MUT and WT. The average PH of MUT was 198 cm, while the PH of WT was only 135 cm. MUT and WT had the same number of internodes, but the internode length differed significantly. The difference in spike length was not significant. This indicates that the change of internode length caused the PH difference between MUT and WT. Other agronomic traits such as 1000-grain weight, grain length, and grain width were significantly different between MUT and WT, and MUT had longer, wider and heavier grains than WT (Suppl. Fig. 1A). We established 427 F2 populations using positive and negative hybridization between WT and MUT (F1 showed tall culm), and the frequency histogram was found to be double peaks (Suppl. Fig. 1B). The chi-square test showed that the separation ratio of tall plants (318, assuming PH ≥ 130 cm) and normal plants (109, assuming PH <130 cm) was 3:1 (χ2 = 0.0618 < χ20.05 = 3.84), which indicated that the PH traits of MUT may be regulated by a major dominant single gene.
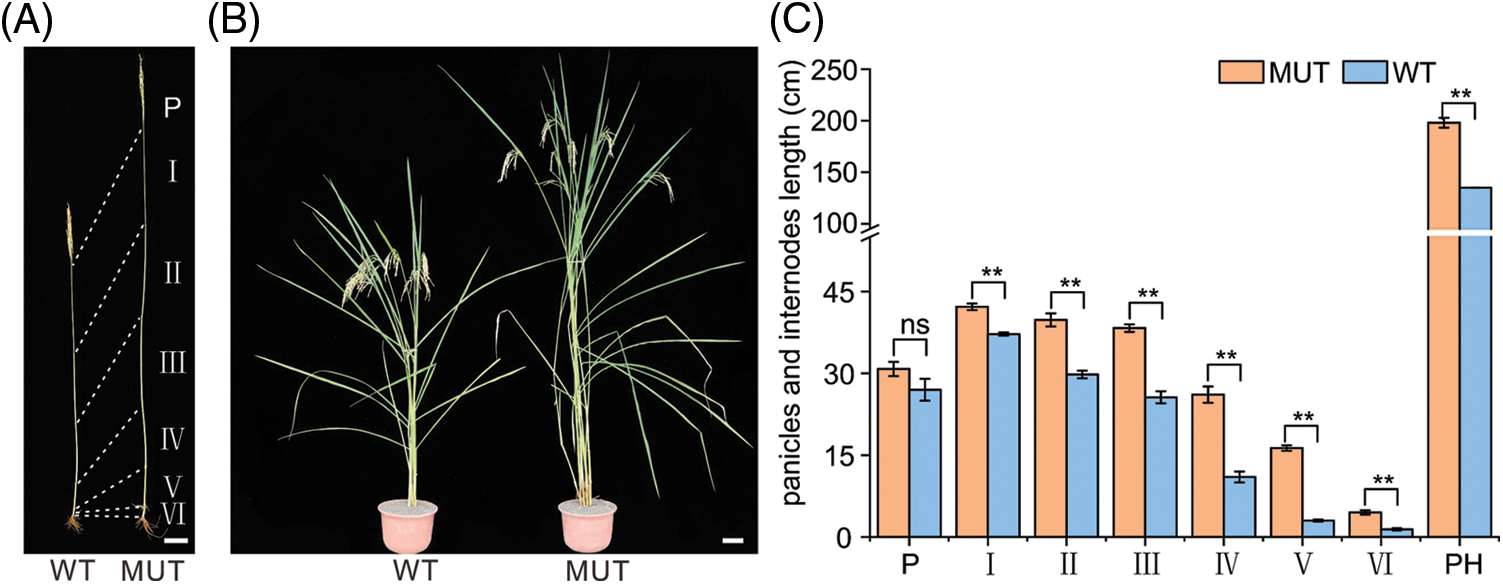
Figure 1: Gross morphology of WT and MUT rice lines. (A) Panicle and total culm of WT and MUT rice lines. P: spike length, I: uppermost internode length, II: second internode length, III: third internode length, IV: fourth internode length, V: fifth internode length, VI: lowest internode length. (B) Plant phenotypes of WT and MUT rice lines in the mature period. Bar = 10 cm. (C) PH, panicles, and internodes length of WT and MUT rice lines. n = 3, bar = SD, **P < 0.01 in Student’s t-test.
To understand the overall expression changes of rice height genes, transcriptome sequencing was performed in this study on the leaf and culm tissues of MUT and WT at two different stages (jointing stage, heading stage). Each material had three biological repeats, and a total of 24 cDNA libraries (2 × 2 × 2 × 3) were constructed. After filtering the raw reads, an average of 46,167,735 reads (ranging from 43,7675 to 50,585,552; Suppl. Table 2) were obtained from each library. The average Q20 and Q30 of the libraries were 97% and 93%, respectively. The average mapping rate with the reference genome was 86.48%, and the mapping range was 83.84%–88.44%. The correlation coefficient analysis between samples (Suppl. Fig. 2) showed a very high correlation between the two materials, and principal component analysis (PCA) could better distinguish the two materials (Suppl. Fig. 3).
Differentially expressed genes between MUT and Wild Type
A total of 2,184 DEGs (MUT/WT) were identified from the leaves and culms samples at the two stages (Fig. 2, Suppl. Table 3). A total of 1,317 DEGs were identified from the jointing stage: 947 DEGs were identified from leaves, of which 680 DEGs were up-regulated in MUT and 267 DEGs were down-regulated in MUT; 949 DEGs were identified from culms, of which 593 DEGs were up-regulated and 356 DEGs were down-regulated in MUT. A total of 1,512 DEGs were identified from the heading stage: 1,031 DEGs were identified from leaves, of which 809 DEGs were up-regulated and 222 DEGs were down-regulated in MUT. Then, 1,002 DEGs were identified from culms, of which 640 DEGs were up-regulated and 362 DEGs were down-regulated in MUT. Overall, there were more up-regulated DEGs than down-regulated ones.
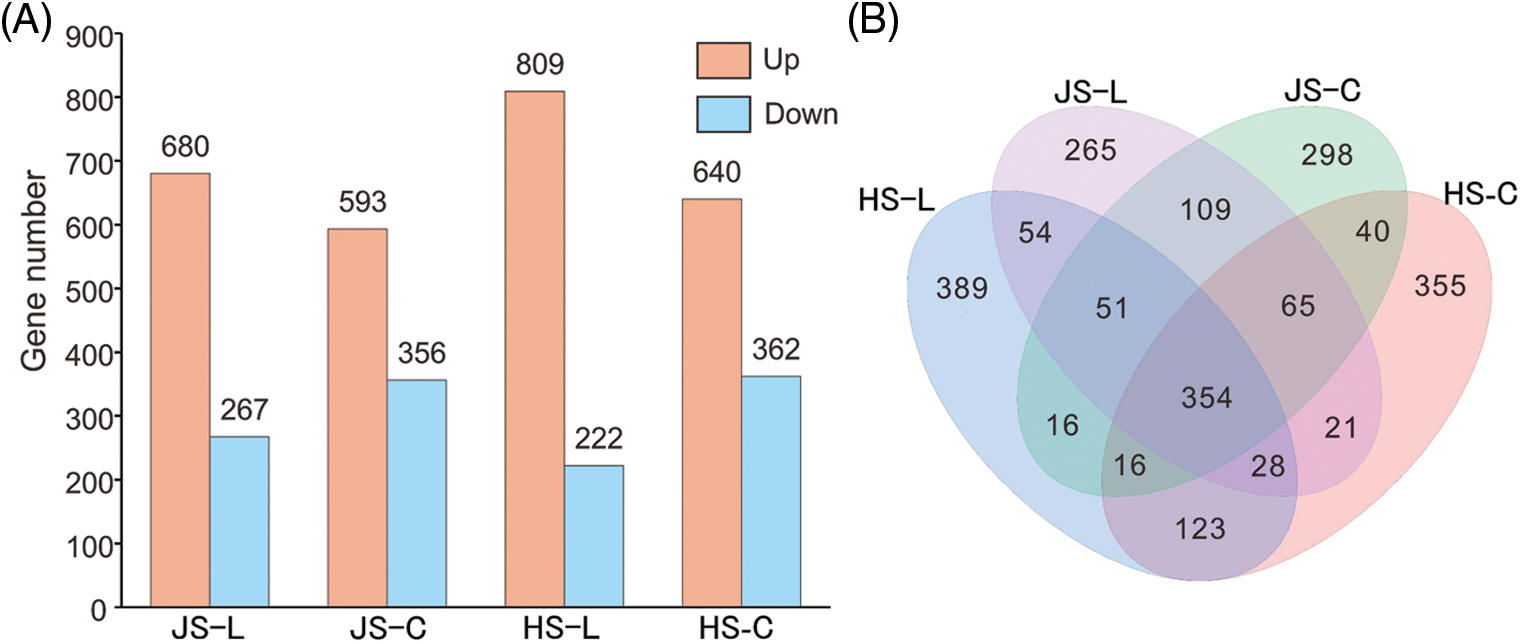
Figure 2: DEGs between MUT and WT. (A) Numbers of differentially expressed genes (DEGs) between MUT and WT. (B) Venn diagram showed the common and specific DEGs in JS-L, HS-L, JS-C, and HS-C. JS-L represents the leaf at the jointing stage, HS-L represents the leaf at the heading stage, JS-C represents the culm at the jointing stage, and HS-C represents the culm at the heading stage, the same below.
There were 579 and 521 in both leaves and culms at the jointing stage and heading stage, respectively. In leaves, 487 DEGs were expressed at both the jointing stage and heading stage, and in culms, 475 DEGs were expressed at both stages. The number of DEGs at the heading stage (1,512) was more than that at the jointing stage (1,317) and between the heading stage and the jointing stage (645 common DEGs). While the number of DEGs identified in the leaves (1,491) was similar to that in the culm (1,476) at both stages, 783 common DEGs were observed between the leaves and the culms. These findings indicated that the difference in tissue type had less influence, while the development stage had a greater impact on the number of DEGs.
Functional analysis of differentially expressed genes
We conducted GO analysis on the 1,317 DEGs at the jointing stage and 1,512 DEGs at the heading stage. GO analysis included three categories: biological process (BP), cell component (CC), and molecular function (MF). Only the top 10 terms with the largest number of DEGs were plotted (Fig. 3). In two tissues (leaf and culms) of two development stages (jointing stage and heading stage), the main terms in BP, CC, and MF were roughly the same. The metabolic process, cellular process, organic substance metabolic process, primary metabolic process, and cellular metabolic process were the BP terms with more DEGs. The membrane, membrane part, integral component of membrane, cell part, and intracellular part were the CC terms with more DEGs. The binding, organic cyclic compound binding, heterocyclic compound binding, catalytic activity, and ion binding were the MF terms with more DEGs.
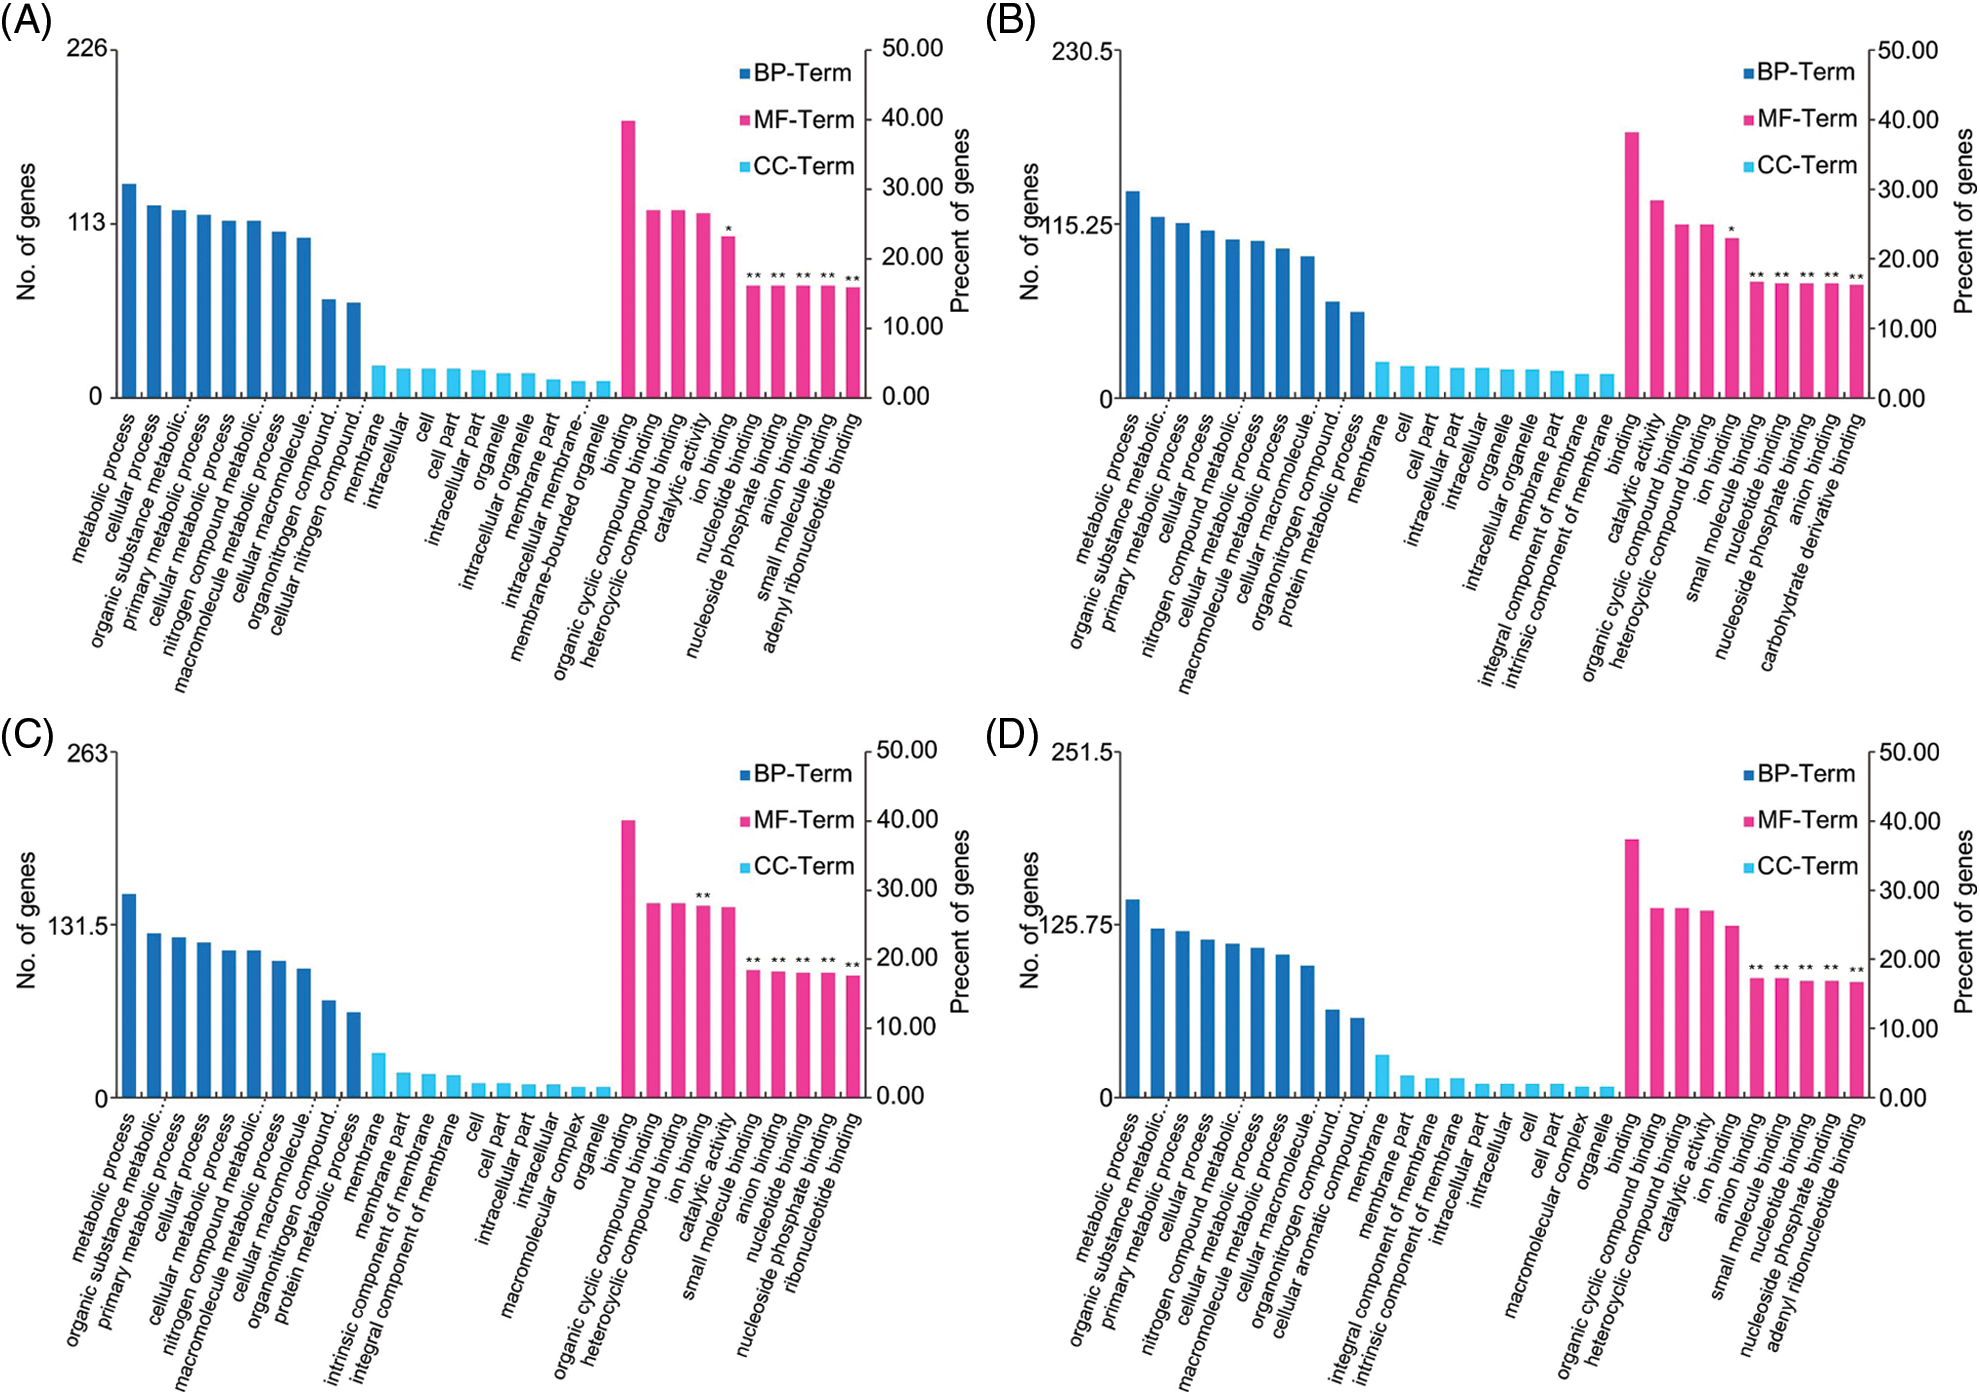
Figure 3: Gene ontology (GO) classification of differentially expressed genes (DEGs) in four treatment groups (JS-L, JS-C, HS-L, and HS-C). The X-axis represents the functional classification, the leaf of the Y-axis represents the number of DEGs annotated into the GO terms, and the right of the Y-axis represents the percent of DEGs annotated into the GO terms, **FDR (false discovery rate) < 0.01; *FDR < 0.05. (A) JS-L, (B) JS-C, (C) HS-L, (D) HS-C.
KEGG pathway enrichment analysis was performed based on the P-value (P < 0.05). Only the pathways with possible relation to PH regulation were plotted (Fig. 4). In leaf samples at the jointing stage, the ABC transporters (ko02010), plant hormone signal transduction (ko04075), and metabolic pathways such as cutin, suberin, and wax biosynthesis (ko00073) were significantly related to PH development. In culm tissues at the jointing stage, the ABC transporters (ko02010) and steroid hormone biosynthesis (ko00140) pathways were significantly related to PH development, and the ko02010 pathway was the most significantly enriched in the leaf and culm tissues at the jointing stage. In leaf tissues at the heading stage, the cutin, suberin, and wax biosynthesis (ko00073) pathways and mismatch repair (ko03430) pathway were related to PH development, while in culm tissues at the heading stage, ABC transporters (ko02010) pathway was significantly related to PH development. The above results indicated that metabolic pathways such as ko02010, ko04075, ko00140, ko00073, and ko03430 might play important roles in the regulation of PH development.
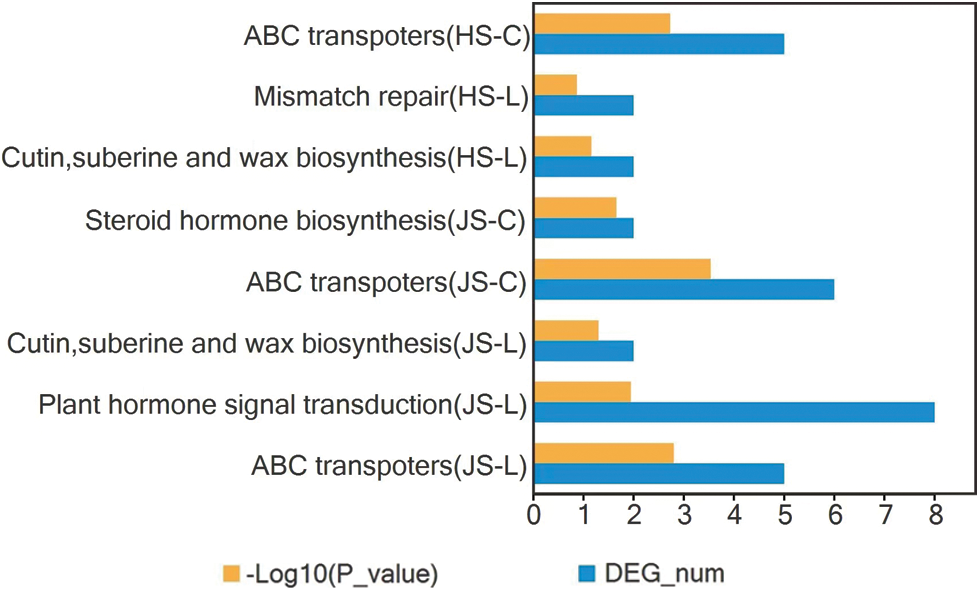
Figure 4: Kyoto Encyclopedia of Genes and Genomes (KEGG) pathway analysis associated with plant height (PH) of the differentially expressed genes (DEGs) between MUT and WT in JS-L, JS-C, HS-L, and HS-C. The abscissa represents the numbers of DEGs and its-Log10 (P-value); the ordinate represents the KEGG metabolic pathway.
Expression analysis of genes involved in plant height regulation in the Kyoto encyclopedia of genes and genomes pathway
We analyzed the expression of genes related to plant hormone synthesis and transduction pathways (Suppl. Table 4). Ten genes were involved in the synthesis and transduction of plant hormones. LOC_Os05g43910 and LOC_Os06g19550 were involved in steroid hormone synthesis. LOC_Os05g43910 belongs to the P450 gene family, and it may be a brassinosteroid gene, which was up-regulated in the leaf and culm tissues of MUT at both jointing and heading stages. LOC_Os06g19550 belongs to the oxidoreductase family and short-chain dehydrogenase/reductase family, also participates in steroid hormones biosynthesis, and was down-regulated in the culm tissues of MUT at the jointing stage.
There were nine genes involved in the plant hormone transduction pathway. Compared to WT, three TFs (LOC_Os02g08500, LOC_Os11g04720, and LOC_Os12g04500), belonging to the RRs, were down-regulated in the leaf of MUT at the jointing stage. However, three genes (LOC_Os01g62760, LOC_Os05g38290, and LOC_Os05g49730) encoding the protein phosphatase 2C, were up-regulated. Two auxin-related genes were up-regulated; LOC_Os09g26610 (OsSAUR38) belongs to the auxin-responsive SAUR gene family, and LOC_Os03g58350 (OsIAA14) belongs to the auxin-responsive Aux/IAA gene family. The above results indicate that in plant hormone biosynthesis and transduction pathways, LOC_Os02g08500, LOC_Os11g04720, and LOC_Os12g04500 negatively regulate PH, but the other six genes play a positive role in PH development.
We also analyzed the expression of genes involved in other metabolic pathways (Suppl. Table 4). Seven genes were involved in the ABC transporters pathway. Except for LOC_Os06g08560, which was down-regulated, the other six genes (LOC_Os01g35030, LOC_Os11g17390, LOC_Os02g25280, LOC_Os12g31920, LOC_Os12g34770, and LOC_Os01g25386) were all up-regulated. Among them, LOC_Os01g35030 was up-regulated in two tissues of two development stages. Two genes, LOC_Os02g40784 and LOC_Os10g33250, participated in the cutin, suberin, and wax biosynthesis pathways and were mainly up-regulated in leaves. These results show that most genes in ABC transporters and cutin, suberin, and wax biosynthesis pathways positively regulate PH. Moreover, there were two genes, LOC_Os11g47400 and LOC_Os12g07720 are involved in the mismatch repair pathway. LOC_Os11g47400 was down-regulated in two tissues of two development stages, while LOC_Os12g07720 was only down-regulated in the leaves at the heading stage.
Co-expression module of plant height genes and identification of key genes
The optimal power value, gene cluster dendrograms, and gene modules were analyzed by WGCNA (Suppl. Figs. 4 and 5). With FPKM < 1 and coefficient of variation > 0.1 as the screening conditions, we constructed a weighted gene co-expression network for 25,485 genes. A total of 36 co-expression modules were obtained (Suppl. Table 5), of which the turquoise module contained the largest number of genes (6,648), and the dark magenta and sienna3 modules contained the least genes (46). Next, we performed module-character correlation analysis at the jointing stage and the heading stage using mutant and wild type as the phenotypes (Fig. 5). At the jointing stage, the modules with a larger correlation coefficient with PH were: light cyan (R = 0.99, P = 9.417E-10), dark grey (R = 0.80, P = 0.002), and grey (R = −0.72, P = 0.008). At the heading stage, the modules having a larger correlation coefficient with PH were: light cyan (R = 0.99, P = 2.070E-09), dark grey (R = 0.75, P = 0.005), and pale turquoise (R = 0.73, P = 0.007). Correlation coefficients of light cyan and dark grey modules with PH were significantly different between jointing and heading stages.
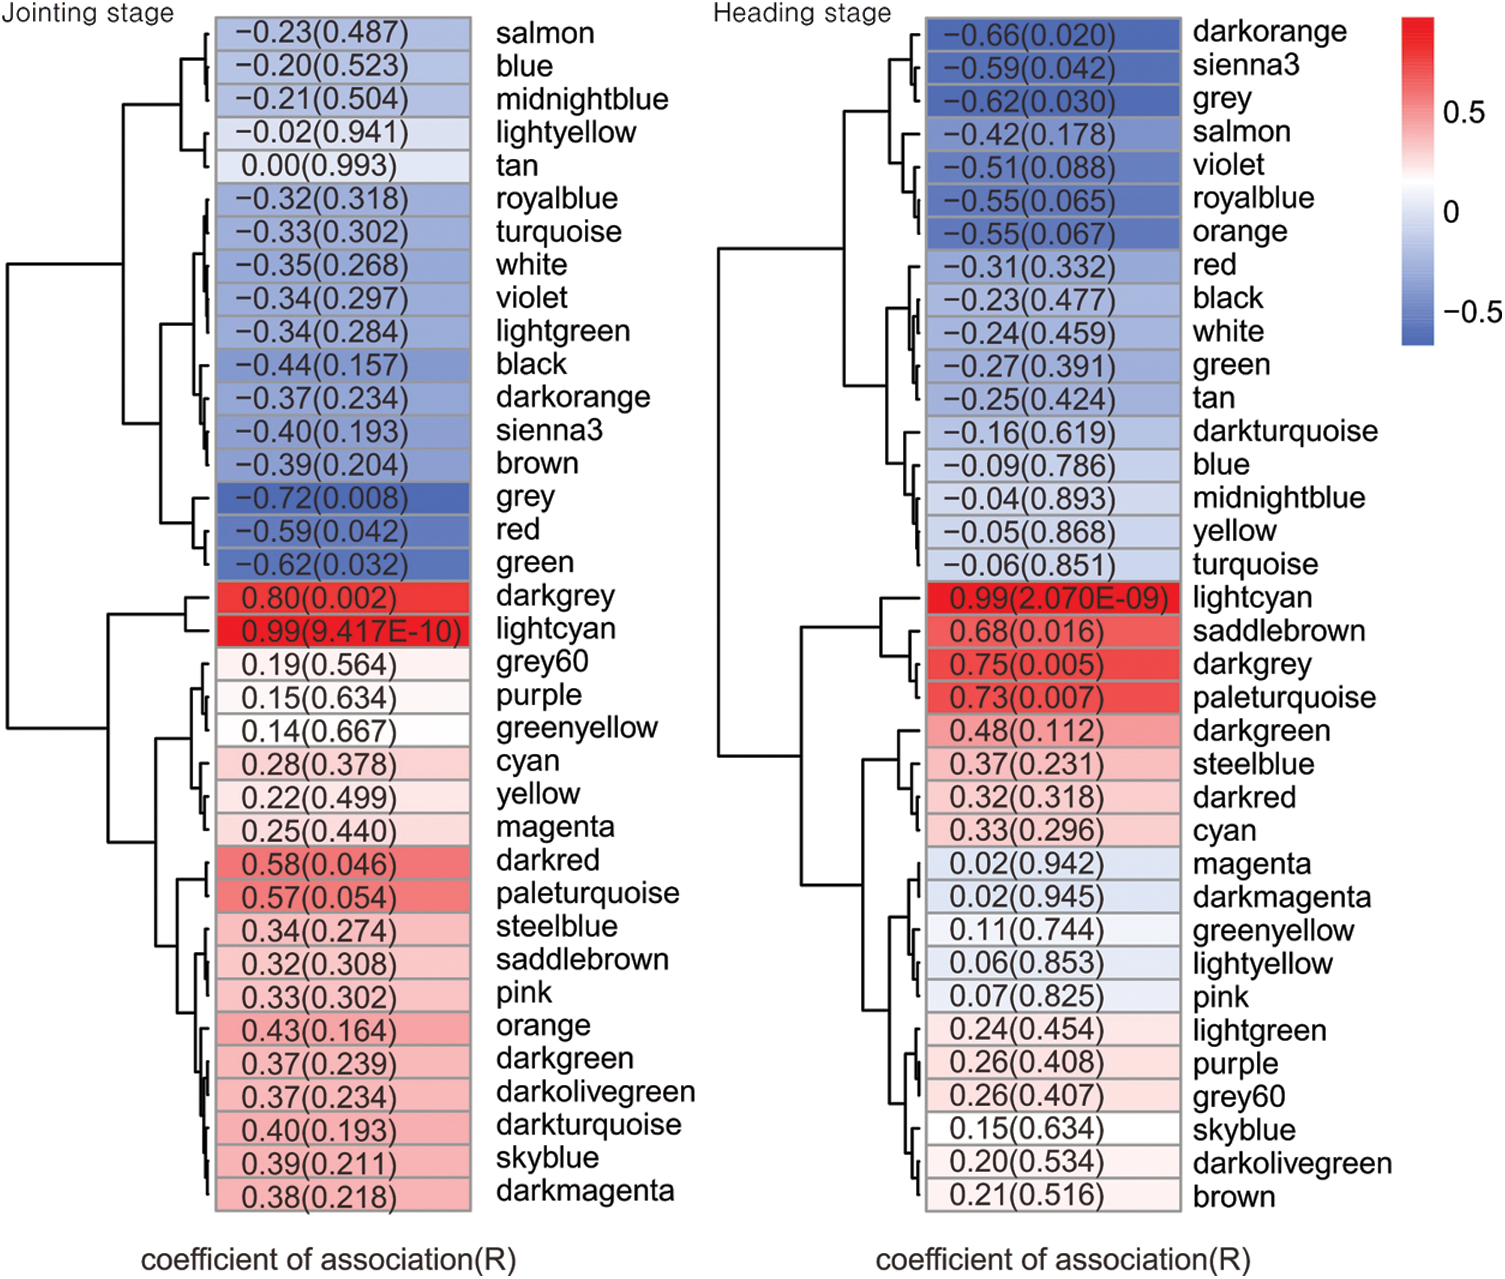
Figure 5: Module-character correlation at jointing stage and heading stage. The numbers in the figure represent the correlation coefficient between the module and plant height (PH), and the numbers in brackets represent the P-value.
We then analyzed the characteristic gene expression patterns of the above four modules (Fig. 6). At the heading stage, the characteristic gene expression patterns of dark grey and light cyan modules in MUT and WT were in opposite directions, and the MUT Module Eigengene (ME) was positive, while the ME of WT was negative. At the jointing stage, the characteristic gene expression patterns of grey, light cyan, pale turquoise modules were also in opposite directions in MUT and WT. In the grey module, most of the ME (MUT) was <0, while in light cyan, the ME (MUT) was >0. Further analysis of the characteristic gene expression patterns in other modules did not show the above trends. This result further showed that the above four modules were closely related to PH phenotypes.
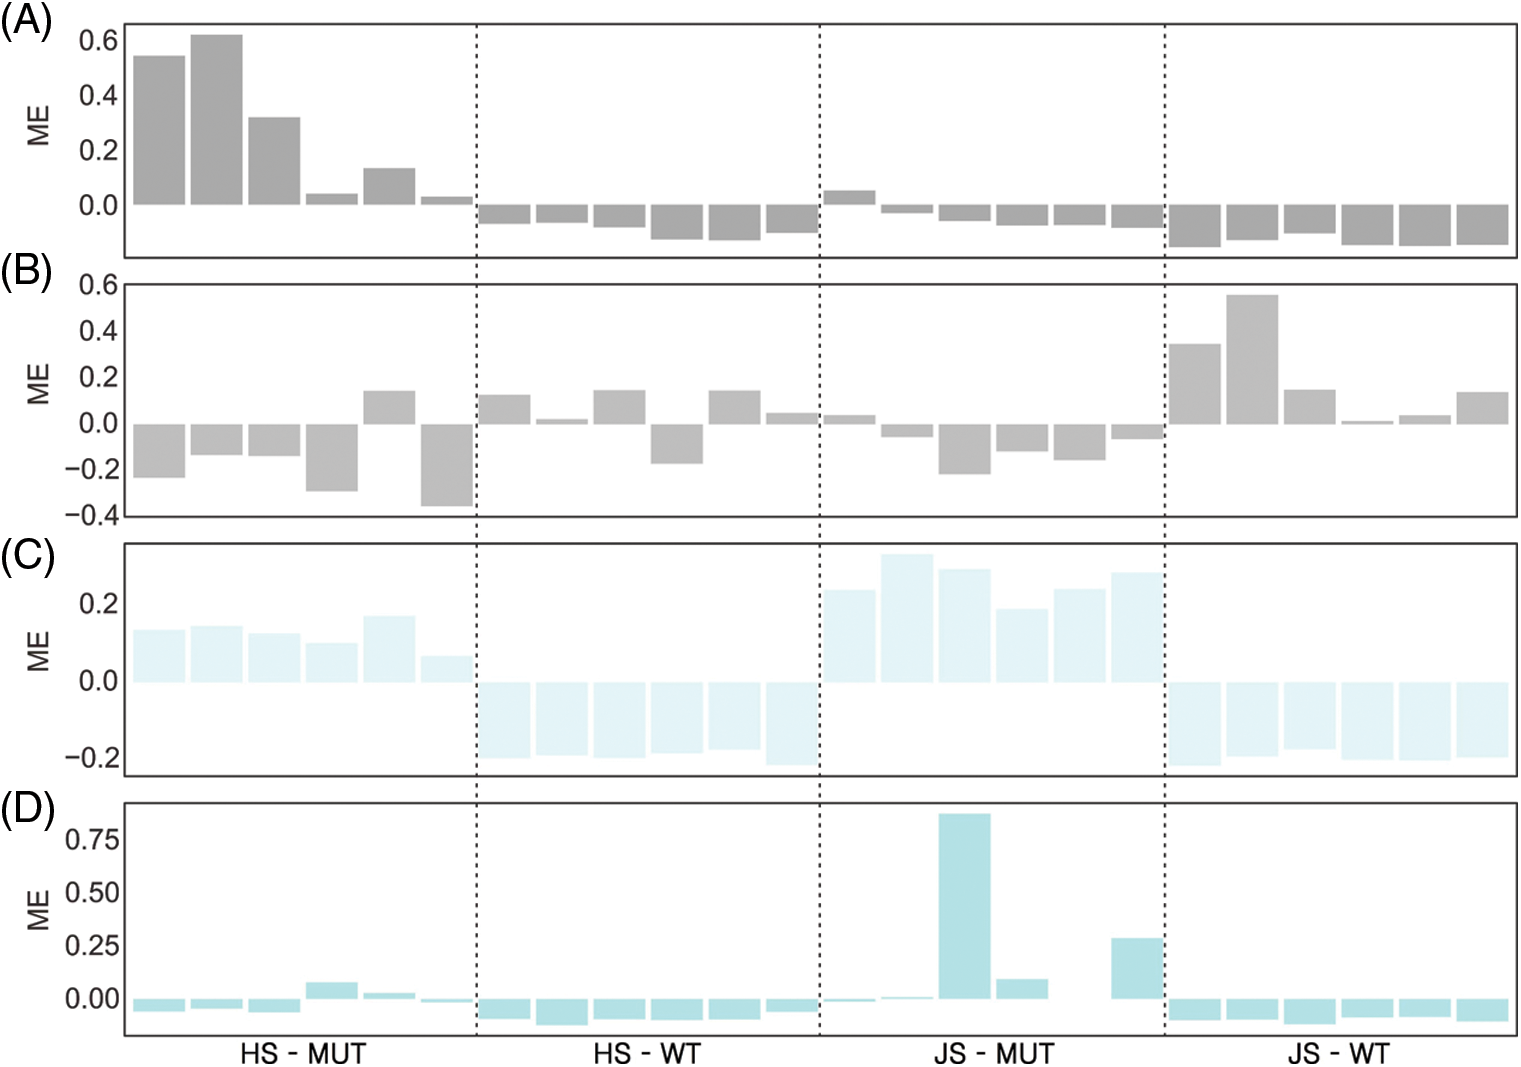
Figure 6: Expression patterns of the eigengenes and relationships of four modules (A–D). Each color represents a module. A: Dark grey module. B: Grey module. C: Light cyan module. D: Pale turquoise module. JS: Jointing stage. HS: Heading stage. The abscissa represents 24 sample numbers, and the ordinate represents module eigengene.
Using |kME| (Eigengene Connectivity) of the above four modular genes >0.8 as the screening condition (Ueda et al., 2020), we constructed a co-expression network diagram (Suppl. Fig. 6). Combined with the DEGs information and the functional annotation of the known PH genes, we screened out seven candidate genes that might regulate PH (Suppl. Table 6) from the above four modules, where LOC_Os01g26174 (OsWAK5) (Zhang et al., 2022), LOC_Os06g37364 (OsKO2) (Itoh et al., 2004) and LOC_Os06g16370 (Hd1) (Yano et al., 2000) were known cloned genes. Functional annotation of OsWAK5 and LOC_Os06g05050 is OsWAK receptor-like protein kinases, LOC_Os05g43910 belongs to a P450 family gene, LOC_Os12g12730 encodes calmodulin-related calcium sensor protein, and LOC_Os11g16540 encodes a tetratricopeptide repeat domain-containing protein. In conclusion, these genes may play a role in PH regulation.
Quantitative real-time polymerase chain reaction validation
The seven PH-related candidate DEGs were selected to verify the accuracy and reproducibility of transcriptomic data (the LOC_Os12g04500 sequence was too similar to LOC_Os11g04720, so the experiment on LOC_Os12g04500 was canceled). According to qRT-PCR and FPKM data of RNA-seq, similar expression trends were observed between MUT and WT (Suppl. Fig. 7), suggesting that the expression differences of these seven DEGs between MUT and WT were real, which may be closely related to PH regulation.
In this study, a total of 2,184 DEGs were identified from the leaves and culms samples at the two stages of MUT and WT materials of rice plants. According to the functional annotations of cloned PH-related genes in rice, many genes related to PH were identified based on transcriptome analysis and weighted gene co-expression analysis; among these genes, four were known genes (OsKO2, Hd1, LEPTO1, and OsWAK5) (Itoh et al., 2004; Yano et al., 2000; Zhao et al., 2018; Zhang et al., 2022). Several phytohormones and cell wall-related genes were identified and considered candidate genes related to PH. The results of qRT-PCR for Quantitative expression of seven PH-related candidate genes (LOC_Os01g26174, LOC_Os05g43910, LOC_Os06g37364, LOC_Os06g16370, LOC_Os06g05050, LOC_Os12g12730, and LOC_Os11g16540), were in good agreement with the RNA-seq data, indicating that the expressions of the above-mentioned seven genes were indeed different in MUT and WT.
Auxin plays a critical role in promoting cell growth and differentiation. Plants sense and respond to changes in auxin levels through auxin response genes. The reaction involves auxin-indole acetic acid (Aux/IAA), auxin response factor (ARF), small auxin regulatory RNA (SAUR), and auxin carrier (PIN) (Luo et al., 2018). Some auxin-responsive genes were identified earlier, such as OsIAA1, OsIAA10, OsSAUR45, and SAUR39. Overexpression of OsIAA1 and OsIAA10 significantly reduced PH (Jin et al., 2016; Song et al., 2009). The OsSAUR45 overexpression line was dwarfed; this gene affects auxin synthesis and transport by inhibiting the expression of OsYUCCA and OsPIN, and thus participates in plant growth (Xu et al., 2017). Overexpression of SAUR39 reduced the growth of culm and root, which in turn affected yield, while down-regulation of the genes related to auxin synthesis and transport reduced auxin level and its transport (Kant et al., 2009). This study identified two auxin-related genes, OsIAA14 and OsSAUR38, both of which were up-regulated. We hypothesize that these genes might play an important role in the positive regulation of PH development. Research has shown a primary role of ABCB21 in regulating auxin distribution supplementary to the primary ABCB auxin transporters ABCB1 and 19 (Jenness et al., 2019). Genome-wide association studies analysis on 259 rice materials identified a single nucleotide polymorphism locus on chr1, which was significantly associated with spike length. Haplotype block structural analysis indicated that LOC_Os01g35030 was one of the important candidate genes related to ABCB expression (Wang et al., 2021). In this study, LOC_Os01g35030 was up-regulated in both types of tissues at the two examined periods, and spike length was longer in MUT than in WT, suggesting that this gene may play a role in positively regulating spike length.
TFs are often shown to be widely involved in plant growth, development, and biological and abiotic stress. Some TFs participate in the regulation of plant growth and development by integrating into the plant hormone pathway. In this study, three TFs were identified, one of which was gene Hd1. Hd1 is a C2C2-CO-like TF, which has the dual functions of promoting heading under short-day conditions and delaying the heading under long-day conditions (Yano et al., 2000). This indicates that Hd1 may be involved in delaying the heading process. Type A and type B RRs mediate cytokinin signal transduction. RRs belong to Orphans TFs. Overexpression of the OsORR2 gene (type-B RR) can reduce rice PH (Shi et al., 2020). The transgenic lines with overexpression of OsRR6 showed dwarfed phenotype, with maldevelopment of root and ear and increased trans-zeatin CK content, indicating the regulation of steady-state CK levels by OsRR6 signaling (Hirose et al., 2007). LOC_Os11g04720 and LOC_Os12g04500 were down-regulated in rice mutant G123 (early flowering) compared with wild-type Gleva (Reig-Valiente et al., 2020). This study identified two Orphans TFs: LOC_Os11g04720 and LOC_Os12g04500, both of which were down-regulated, indicating that LOC_Os11g04720 and LOC_Os12g04500 are involved in regulatory processes of flowering. LOC_Os02g08500 (OsRR24, or LEPTO1) belongs to class B RRs, and this mutant lepto1 did not differ from the wild type during the nutritional growth period but was pollen sterile (Zhao et al., 2018).
Analysis of other genes related to PH showed that: (1) GA was a very important class of plant hormones, which can accelerate cell elongation and promote cell division and expansion. OsKO2 encoded kaurene oxidase, which catalyzed the early steps of GA biosynthesis and positively regulates PH (Itoh et al., 2004). This was consistent with the up-regulated expression of OsKO2 in MUT from this study, indicating that OsKO2 may be a key candidate gene involved in PH regulation; (2) Cell wall-associated receptor-like kinases (WAKs) were plasma membrane proteins whose serine/threonine kinase domain was located in the cytoplasm, and the extracellular domain was closely related to the cell wall. Compared with WT (Nipponbare), OsWAK5 (LOC_Os01g26174)-overexpressing lines were found to have increased lignin content (Zhang et al., 2022). Two up-regulated WAKs genes (OsWAK5 and LOC_Os06g05050) were identified in MUT in the present study, indicating that they might be involved in the positive regulation of cell wall biosynthesis; (3) OsAPC6 and DES4 encoded tetratricopeptide repeat domain-containing proteins. OsAPC6 responded to GA, and the insertion mutant exhibited phenotypes such as female infertility, decreased cell size, and shorter PH (Awasthi et al., 2012; Kumar et al., 2010). DES4 is involved in DNA repair, and the mutant exhibited dwarfed phenotype, narrow leaves, and less tillering (Ni et al., 2019). LOC_Os11g16540, identified in this study, encodes a tetratricopeptide repeat domain-containing protein, which may also affect the growth and development of PH.
Transcriptome analysis of MUT and WT identified a large number of DEGs closely related to PH regulation. Transcriptome combined with weighted gene co-expression analysis found two up-regulated IAA-related genes (LOC_Os01g35030, LOC_Os05g43910), three down-regulated CK-related genes (LEPTO1, LOC_Os11g04720, LOC_Os12g04500), two up-regulated cell wall-related genes (OsWAK5, LOC_Os06g05050), and one up-regulated GA-related gene (OsKO2), suggesting the potential role of these candidate genes in PH regulation.
Availability of Data and Materials: All data generated or analyzed during this study are included in this article. The data presented in the study are deposited in the NCBI Sequence Read Archive (SRA) under the accession number: PRJNA776998.
Supplementary Material: The supplementary material is available online at DOI 10.32604/biocell.2023.023543.
Author Contribution: The authors confirm contribution to the paper as follows: study conception and design: Xinghai Yang and Danting Li; data collection and analysis: Can Chen, Rui Feng, and Zongqiong Zhang. All authors revised and approved the manuscript.
Ethics Approval: Not applicable.
Funding Statement: This work was supported by the National Natural Science Foundation of China (31760428, 31860371, and 32060476), Guangxi Natural Science Foundation of China (2020GXNSFAA259041), Guangxi Science and Technology Project (Guike AB21238009), and Guangxi Academy of Agricultural Sciences Foundation (2021JM04, JM49, YT030, QN-11, 14, 20, 29, and 35).
Conflicts of Interest: The authors declare that they have no conflicts of interest to report regarding the present study.
References
Awasthi A, Paul P, Kumar S, Verma SK, Prasad R et al. (2012). Abnormal endosperm development causes female sterility in rice insertional mutant OsAPC6. Plant Science 183: 167–174. DOI 10.1016/j.plantsci.2011.08.007. [Google Scholar] [CrossRef]
Bae KD, Um TY, Yang WT, Park TH, Hong SY et al. (2021). Characterization of dwarf and narrow leaf (dnl-4) mutant in rice. Plant Signaling and Behavior 16: 1849490. DOI 10.1080/15592324.2020.1849490. [Google Scholar] [CrossRef]
Castorina G, Consonni G (2020). The role of brassinosteroids in controlling plant height in poaceae: A genetic perspective. International Journal of Molecular Sciences 21: 1191. DOI 10.3390/ijms21041191. [Google Scholar] [CrossRef]
Dai ZY, Wang J, Yang XF, Lu H, Miao XX et al. (2018). Modulation of plant architecture by the miR156f-OsSPL7-OsGH3.8 pathway in rice. Journal of Experimental Botany 69: 5117–5130. DOI 10.1093/jxb/ery273. [Google Scholar] [CrossRef]
Daviere JM, Achard P (2013). Gibberellin signaling in plants. Development 140: 1147–1151. DOI 10.1242/dev.087650. [Google Scholar] [CrossRef]
Fukazawa J, Teramura H, Murakoshi S, Nasuno K, Nishida N et al. (2014). DELLAs function as coactivators of GAI-ASSOCIATED FACTOR1 in regulation of gibberellin homeostasis and signaling in Arabidopsis. Plant Cell 26: 2920–2938. DOI 10.1105/tpc.114.125690. [Google Scholar] [CrossRef]
He NQ, Zhan GP, Huang FH, Abou-Elwafa SF, Yang DW (2022). Fine mapping and cloning of a major QTL qph12, which simultaneously affects the plant height, panicle length, spikelet number and yield in rice (Oryza sativaL.). Frontiers in Plant Science 13: 878558. DOI 10.3389/fpls.2022.878558. [Google Scholar] [CrossRef]
Hirose N, Makita N, Kojima M, Kamada-Nobusada T, Sakakibara H (2007). Overexpression of a type-A response regulator alters rice morphology and cytokinin metabolism. Plant and Cell Physiology 48: 523–539. DOI 10.1093/pcp/pcm022. [Google Scholar] [CrossRef]
Huang K, Wu T, Ma ZM, Li Z, Chen HY et al. (2021). Rice transcription factor OsWRKY55 is involved in the drought response and regulation of plant growth. International Journal of Molecular Sciences 22: 4337. DOI 10.3390/ijms22094337. [Google Scholar] [CrossRef]
Ikram AU, Ding Y, Su YH (2021). OsARP6 is involved in internode elongation by regulating cell-cycle-related genes. Biomolecules 11: 1100. DOI 10.3390/biom11081100. [Google Scholar] [CrossRef]
Itoh H, Tatsumi T, Sakamoto T, Otomo K, Toyomasu T et al. (2004). A rice semi-dwarf gene, Tan-Ginbozu (D35encodes the gibberellin biosynthesis enzyme, ent-kaurene oxidase. Plant Molecular Biology 54: 533–547. DOI 10.1023/B:PLAN.0000038261.21060.47. [Google Scholar] [CrossRef]
Jenness MK, Carraro N, Pritchard CA, Murphy AS (2019). The arabidopsis ATP-BINDING CASSETTE transporter ABCB21 regulates auxin levels in cotyledons, the root pericycle, and leaves. Frontiers in Plant Science 10: 806. DOI 10.3389/fpls.2019.00806. [Google Scholar] [CrossRef]
Jin L, Qin QQ, Wang Y, Pu YY, Liu LF et al. (2016). Rice dwarf virus P2 protein hijacks auxin signaling by directly targeting the rice OsIAA10 protein, enhancing viral infection and disease development. PLoS Pathogens 12: e1005847. DOI 10.1371/journal.ppat.1005847. [Google Scholar] [CrossRef]
Jin SK, Zhang MQ, Leng YJ, Xu LN, Jia SW et al. (2022). OsNAC129 regulates seed development and plant growth and participates in the brassinosteroid signaling pathway. Frontiers in Plant Science 13: 905148. DOI 10.3389/fpls.2022.905148. [Google Scholar] [CrossRef]
Kant S, Bi YM, Zhu T, Rothstein SJ (2009). SAUR39, a small auxin-up RNA gene, acts as a negative regulator of auxin synthesis and transport in rice. Plant Physiology 151: 691–701. DOI 10.1104/pp.109.143875. [Google Scholar] [CrossRef]
Khush GS (1999). Green revolution: Preparing for the 21st century. Genome 42: 646–655. DOI 10.1139/g99-044. [Google Scholar] [CrossRef]
Kong WL, Deng XX, Yang J, Zhang CH, Sun T et al. (2022). High-resolution bin-based linkage mapping uncovers the genetic architecture and heterosis-related loci of plant height in indica-japonica derived populations. Plant Journal 110: 814–827. DOI 10.1111/tpj.15705. [Google Scholar] [CrossRef]
Kumar M, Basha PO, Puri A, Rajpurohit D, Randhawa GS et al. (2010). A candidate gene OsAPC6 of anaphase-promoting complex of rice identified through T-DNA insertion. Functional and Integrative Genomics 10: 349–358. DOI 10.1007/s10142-009-0155-6. [Google Scholar] [CrossRef]
Lan J, Lin QB, Zhou CL, Ren YK, Liu X et al. (2020). Small grain and semi-dwarf 3, a WRKY transcription factor, negatively regulates plant height and grain size by stabilizing SLR1 expression in rice. Plant Molecular Biology 104: 429–450. DOI 10.1007/s11103-020-01049-0. [Google Scholar] [CrossRef]
Lee J, Moon S, Jang S, Lee S, An G et al. (2020). OsbHLH073 negatively regulates internode elongation and plant height by modulating GA homeostasis in rice. Plants (Basel) 9: 547. DOI 10.3390/plants9040547. [Google Scholar] [CrossRef]
Liu F, Wang PD, Zhang XB, Li XF, Yan XH et al. (2018). The genetic and molecular basis of crop height based on a rice model. Planta 247: 1–26. DOI 10.1007/s00425-017-2798-1. [Google Scholar] [CrossRef]
Luo J, Zhou JJ, Zhang JZ (2018). Aux/IAA gene family in plants: Molecular structure, regulation, and function. International Journal of Molecular Sciences 19: 259. DOI 10.3390/ijms19010259. [Google Scholar] [CrossRef]
Ma ZM, Wu T, Huang K, Jin YM, Li Z et al. (2020). A novel AP2/ERF transcription factor, OsRPH1, negatively regulates plant height in rice. Frontiers in Plant Science 11: 709. DOI 10.3389/fpls.2020.00709. [Google Scholar] [CrossRef]
Ni S, Li ZZ, Ying JC, Zhang J, Chen HQ (2019). Decreased spikelets 4 encoding a novel tetratricopeptide repeat domain-containing protein is involved in DNA repair and spikelet number determination in rice. Genes 10: 214. DOI 10.3390/genes10030214. [Google Scholar] [CrossRef]
Qu RH, Zhang PX, Liu Q, Wang YF, Guo WJ et al. (2022). Genome-edited ATP BINDING CASSETTE B1 transporter SD8 knockouts have optimized rice architecture without yield penalty. Plant Communications 3: 100347. DOI 10.1016/j.xplc.2022.100347. [Google Scholar] [CrossRef]
Reig-Valiente JL, Borreda C, Talon M, Domingo C (2020). The G123 rice mutant, carrying a mutation in SE13, presents alterations in the expression patterns of photosynthetic and major flowering regulatory genes. PLoS One 15: e0233120. DOI 10.1371/journal.pone.0233120. [Google Scholar] [CrossRef]
Shi FL, Wang M, An YX (2020). Overexpression of a B-type cytokinin response regulator (OsORR2) reduces plant height in rice. Plant Signaling and Behavior 15: 1780405. DOI 10.1080/15592324.2020.1780405. [Google Scholar] [CrossRef]
Song YL, You J, Xiong LZ (2009). Characterization of OsIAA1 gene, a member of rice Aux/IAA family involved in auxin and brassinosteroid hormone responses and plant morphogenesis. Plant Molecular Biology 70: 297–309. DOI 10.1007/s11103-009-9474-1. [Google Scholar] [CrossRef]
Spielmeyer W, Ellis MH, Chandler PM (2002). Semidwarf (sd-1“green revolution” rice, contains a defective gibberellin 20-oxidase gene. PNAS 99: 9043–9048. DOI 10.1073/pnas.132266399. [Google Scholar] [CrossRef]
Ueda Y, Ohtsuki N, Kadota K, Tezuka A, Nagano AJ et al. (2020). Gene regulatory network and its constituent transcription factors that control nitrogen-deficiency responses in rice. New Phytologist 227: 1434–1452. DOI 10.1111/nph.16627. [Google Scholar] [CrossRef]
Wang AJ, Jiang YQ, Shu XY, Zha ZP, Yin DS et al. (2021). Genome-wide association study-based identification genes influencing agronomic traits in rice (Oryza sativa L.). Genomics 113: 1396–1406. DOI 10.1016/j.ygeno.2021.03.016. [Google Scholar] [CrossRef]
Wang YJ, Zhao J, Lu WJ, Deng DX (2017). Gibberellin in plant height control: Old player, new story. Plant Cell Reports 36: 391–398. DOI 10.1007/s00299-017-2104-5. [Google Scholar] [CrossRef]
Xu YX, Xiao MZ, Liu Y, Fu JL, He Y et al. (2017). The small auxin-up RNA OsSAUR45 affects auxin synthesis and transport in rice. Plant Molecular Biology 94: 97–107. DOI 10.1007/s11103-017-0595-7. [Google Scholar] [CrossRef]
Yang C, Ma YM, He Y, Tian ZH, Li JX (2018). OsOFP19 modulates plant architecture by integrating the cell division pattern and brassinosteroid signaling. Plant Journal 93: 489–501. DOI 10.1111/tpj.13793. [Google Scholar] [CrossRef]
Yano M, Katayose Y, Ashikari M, Yamanouchi U, Monna L et al. (2000). Hd1, a major photoperiod sensitivity quantitative trait locus in rice, is closely related to the Arabidopsis flowering time gene CONSTANS. Plant Cell 12: 2473–2484. DOI 10.1105/tpc.12.12.2473. [Google Scholar] [CrossRef]
Zhang F, Fang H, Wang M, He F, Tao H et al. (2022). APIP5 functions as a transcription factor and an RNA-binding protein to modulate cell death and immunity in rice. Nucleic Acids Research 50: 5064–5079. DOI 10.1093/nar/gkac316. [Google Scholar] [CrossRef]
Zhang LZ, Huang JF, Wang YY, Xu R, Yang ZY et al. (2020). Identification and genetic analysis of qCL1. 2, a novel allele of the “green revolution” gene SD1 from wild rice (Oryza rufipogon) that enhances plant height. BMC Genetics 21: 62. DOI 10.1186/s12863-020-00868-w. [Google Scholar] [CrossRef]
Zhao TT, Ren LJ, Chen XJ, Yu HX, Liu CJ et al. (2018). The OsRR24/LEPTO1 Type-B response regulator is essential for the organization of leptotene chromosomes in rice meiosis. Plant Cell 30: 3024–3037. DOI 10.1105/tpc.18.00479. [Google Scholar] [CrossRef]
Supplementary Materials
Table S1. Information of primers used for a quantitative real-time polymerase chain reaction.
Table S2. Summary of RNA sequencing data and comparison.
Table S3. Details of identified differentially expressed genes between MUT and WT.
Table S4. The expression of genes involved in plant height regulation in the Kyoto Encyclopedia of Genes and Genomes pathway.
Table S5. The number of genes in modules.
Table S6. The screened plant height genes based on weighted gene co-expression network.
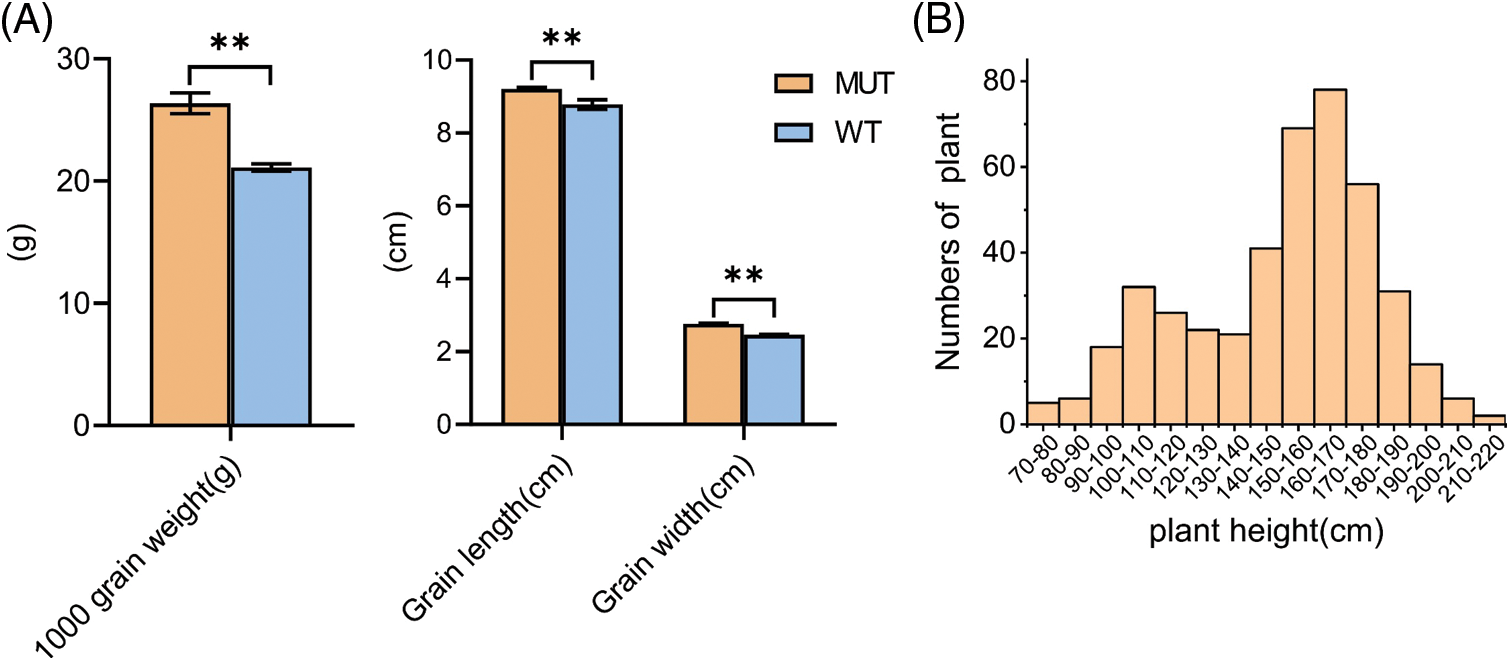
Figure S1: Grains traits characterization of MUT and WT and distribution of their hybrid F2 population. (A) Traits grains of MUT and WT. n = 3, bar = SD, **P < 0.01 in Student’s t-test. (B) Frequency histogram of F2 population of MUT and WT hybrid.
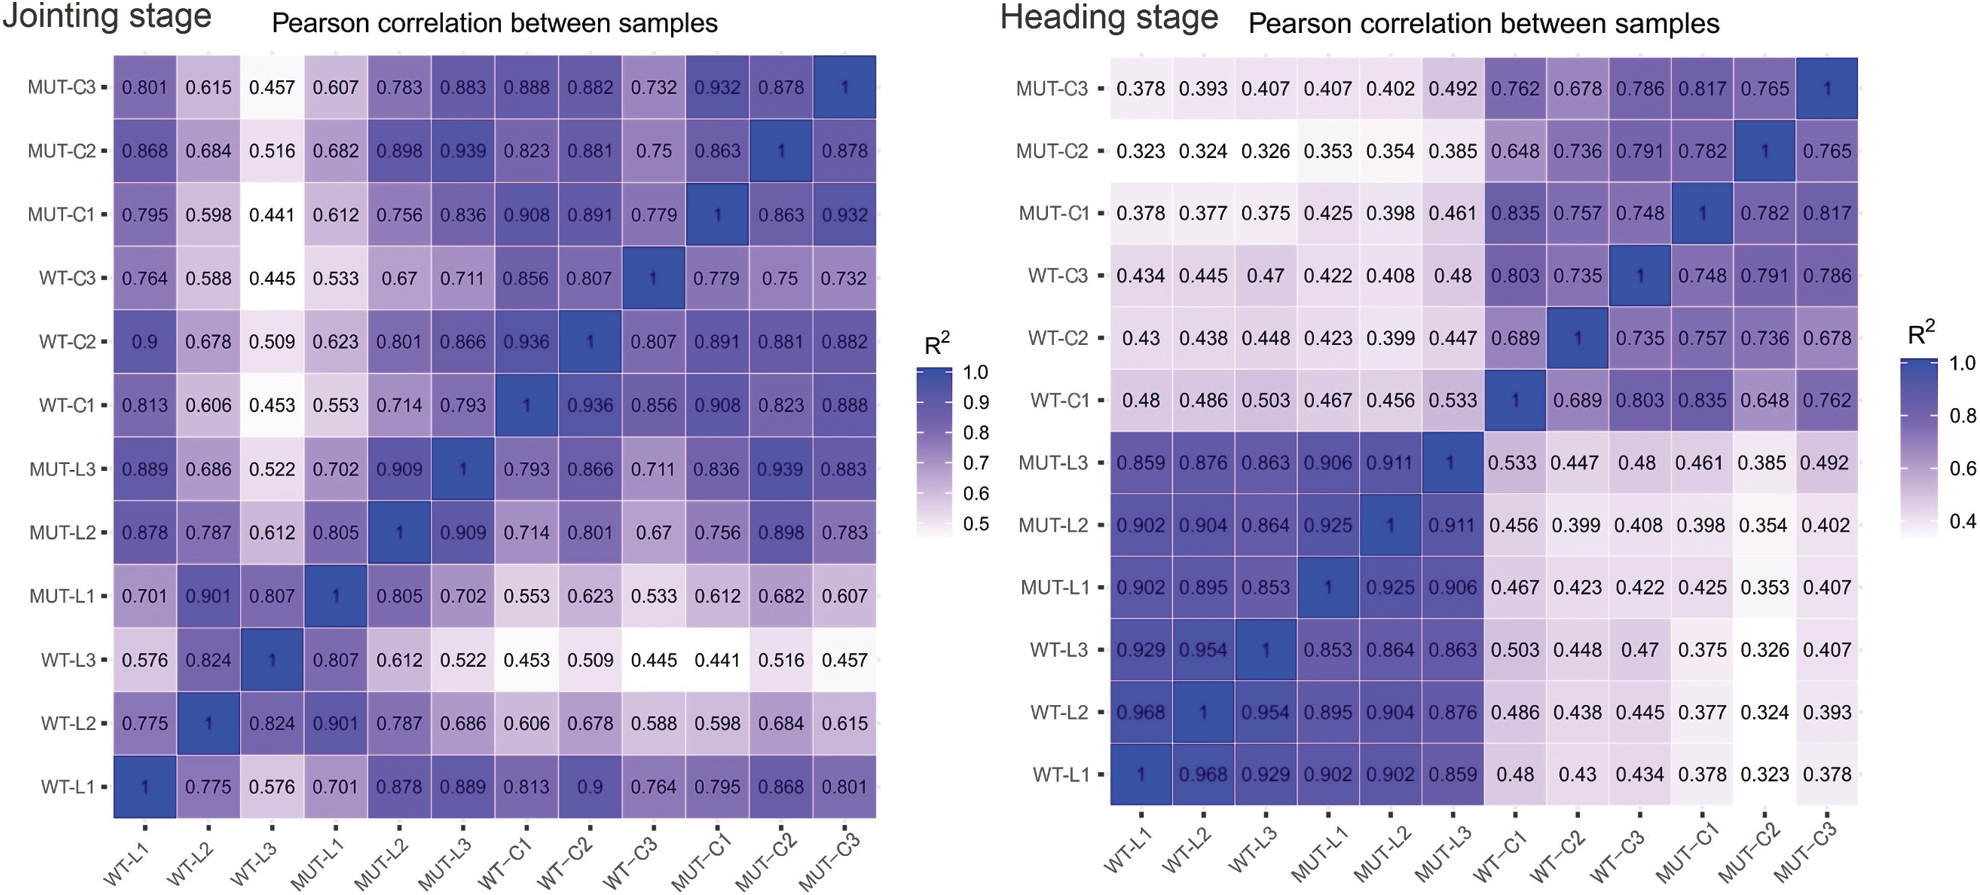
Figure S2: The analysis of the correlation coefficient between samples at two growth stages. The abscissa and ordinate represent 12 sample numbers. L: Leaf, C: culm, 1-3: Sample number.
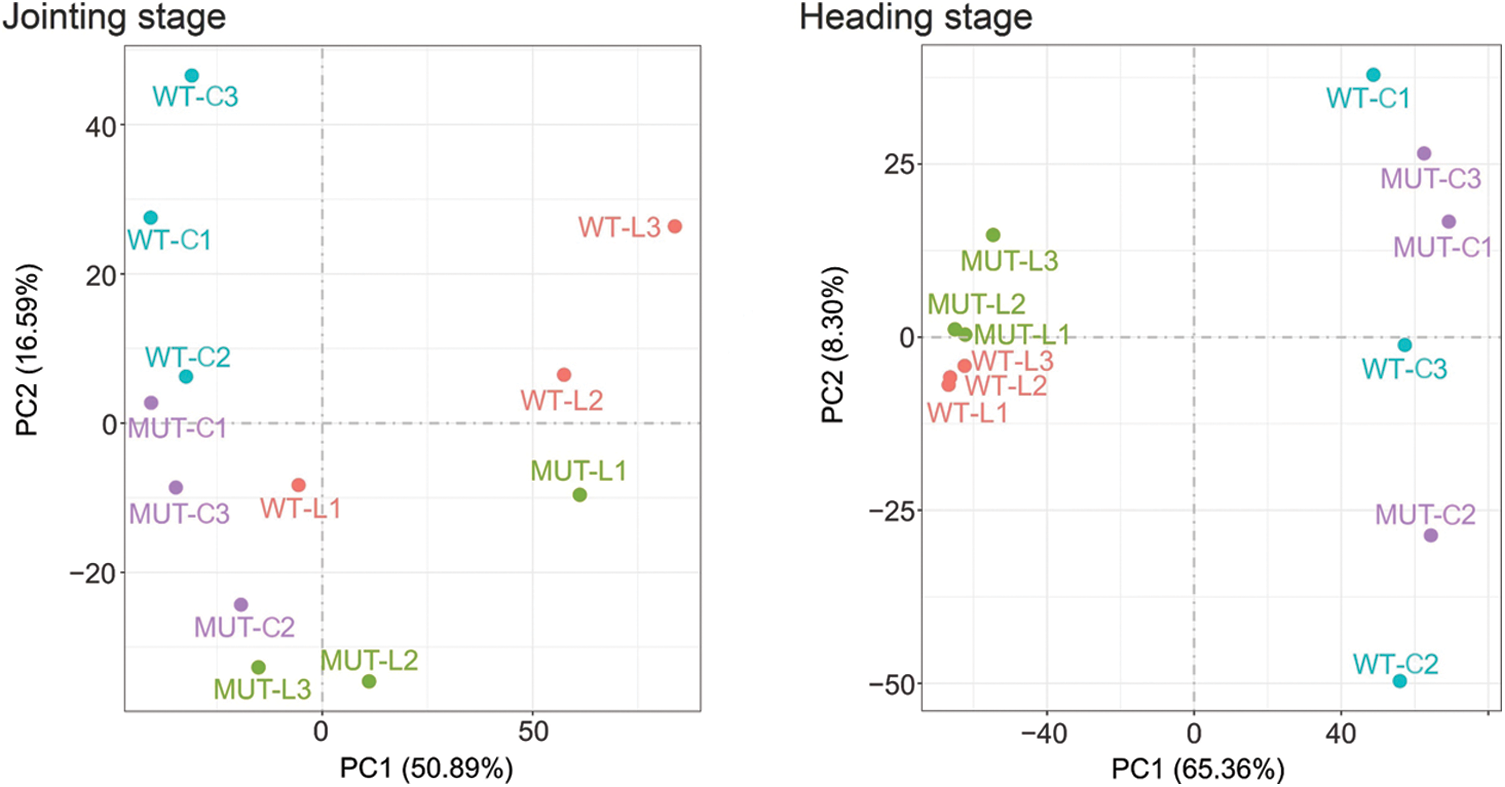
Figure S3: Principal component analysis between samples at two growth stages. The X-axis represents principal component 1 and the Y-axis represents principal component 2. L: Leaf, C: Culm, 1-3: Sample number.
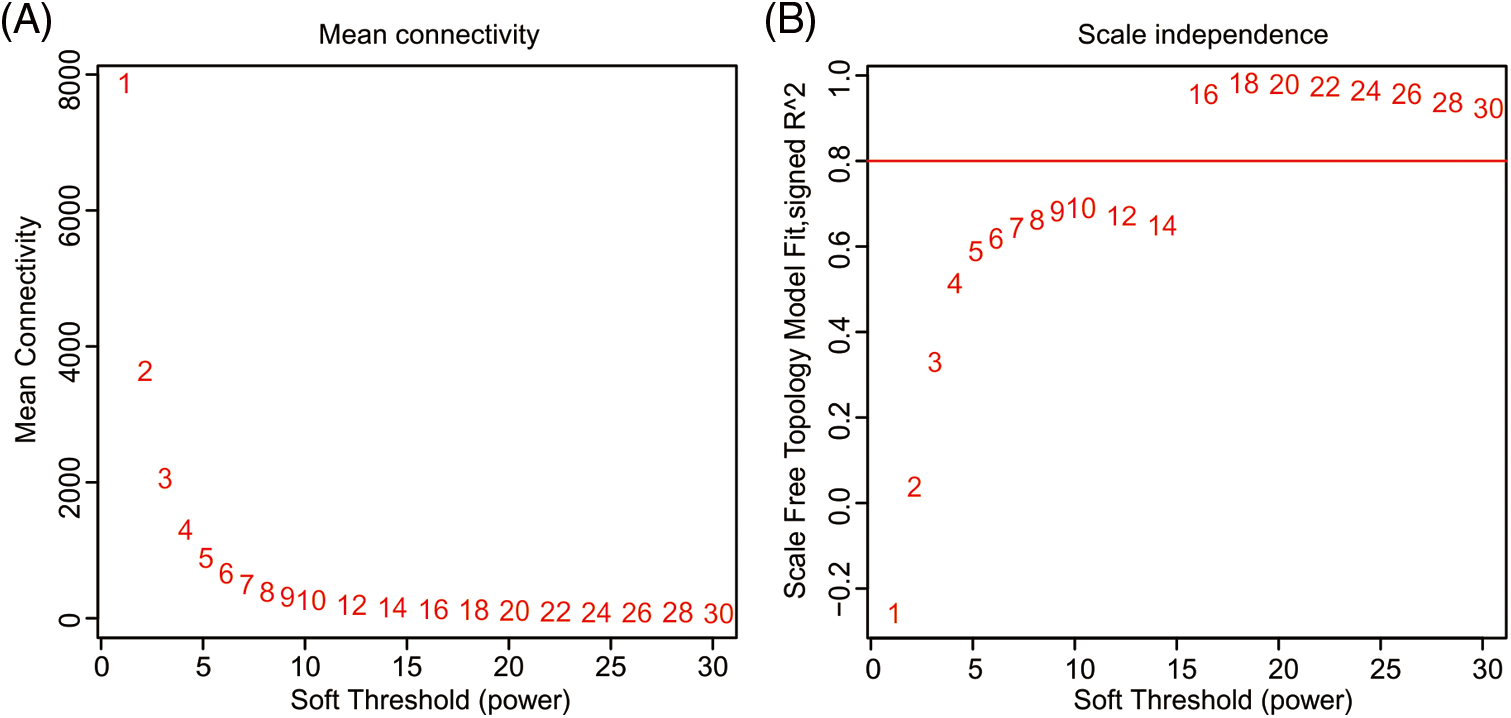
Figure S4: Determination of soft threshold. (A) Average connectivity at different soft thresholds. (B) Scale-free topology fit index as a function of the soft-thresholding power.
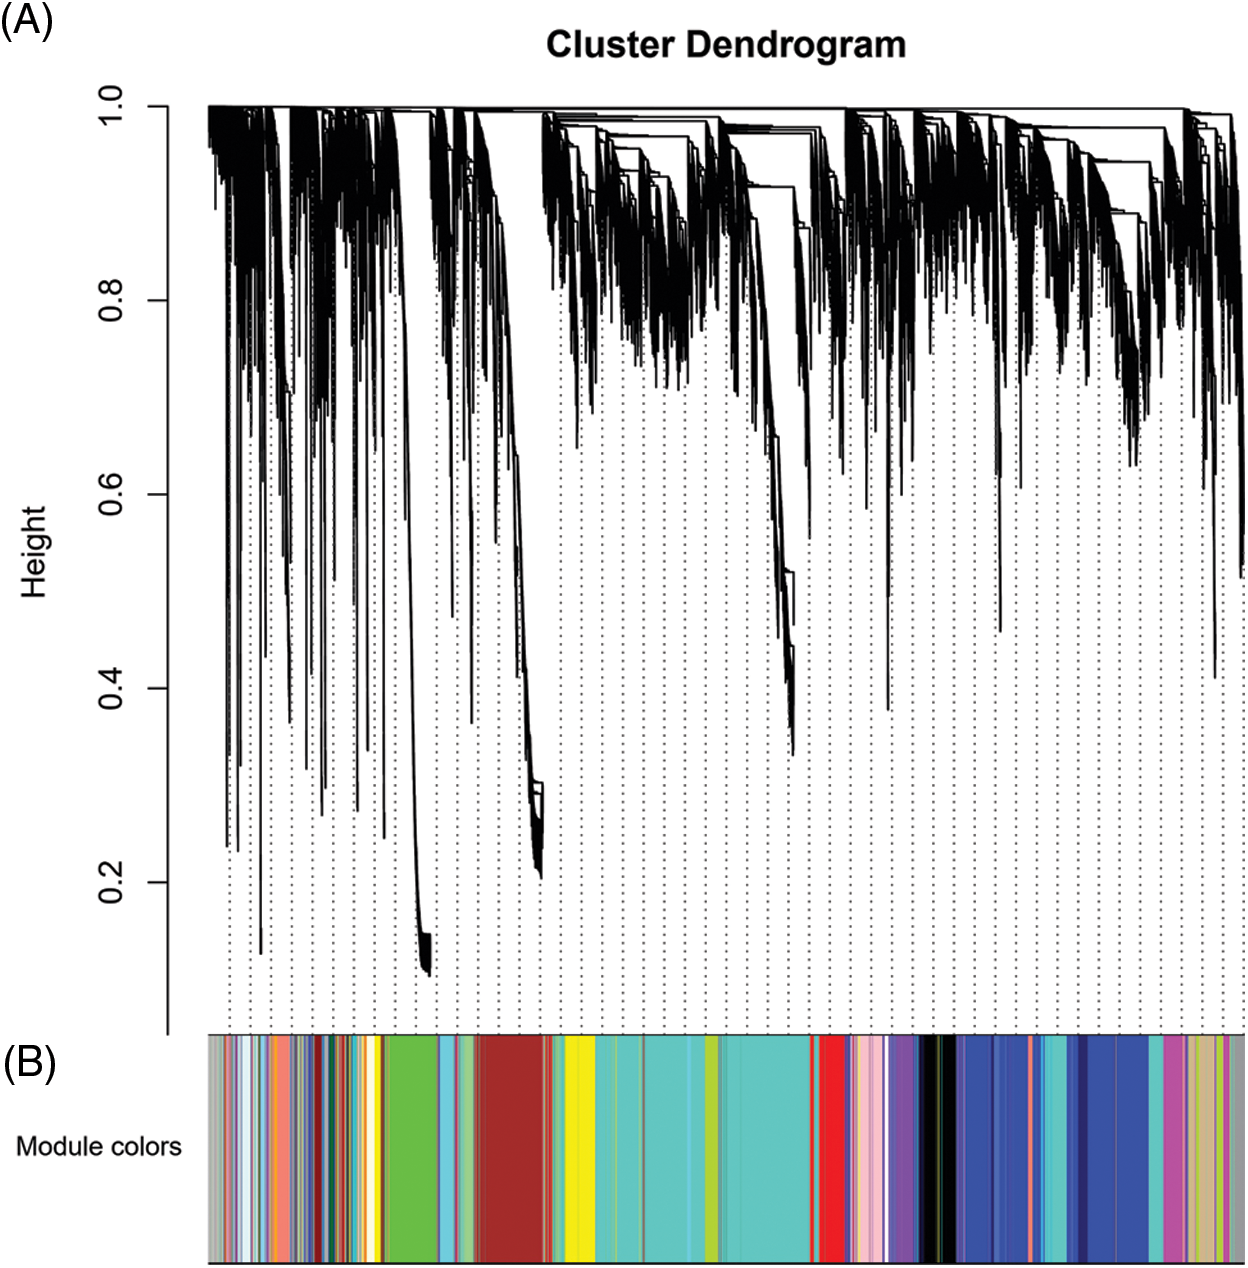
Figure S5: Gene cluster dendrograms and module detecting. (A) Gene clustering on topological overlap matrix (TOM)-based dissimilarity. (B) Module division by dynamic tree cut. Different colors represent different modules.
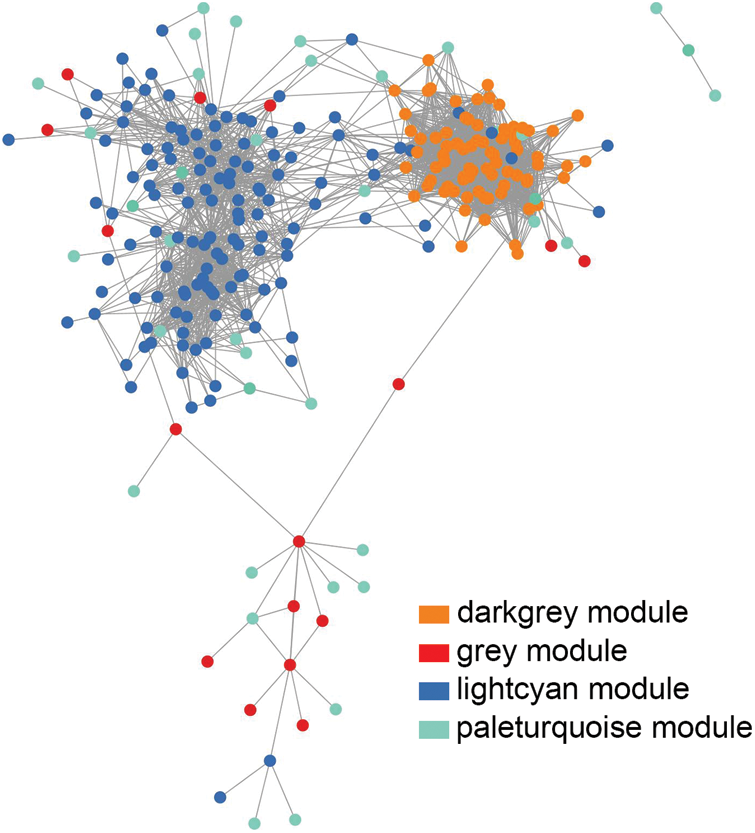
Figure S6: Co-expression network diagram of core genes in the module. The dots indicate genes. Orange: dark grey module. Red: grey module. Dark blue: light cyan module. Green: pale turquoise module. In the network, genes connected by gray lines have similar expression patterns.
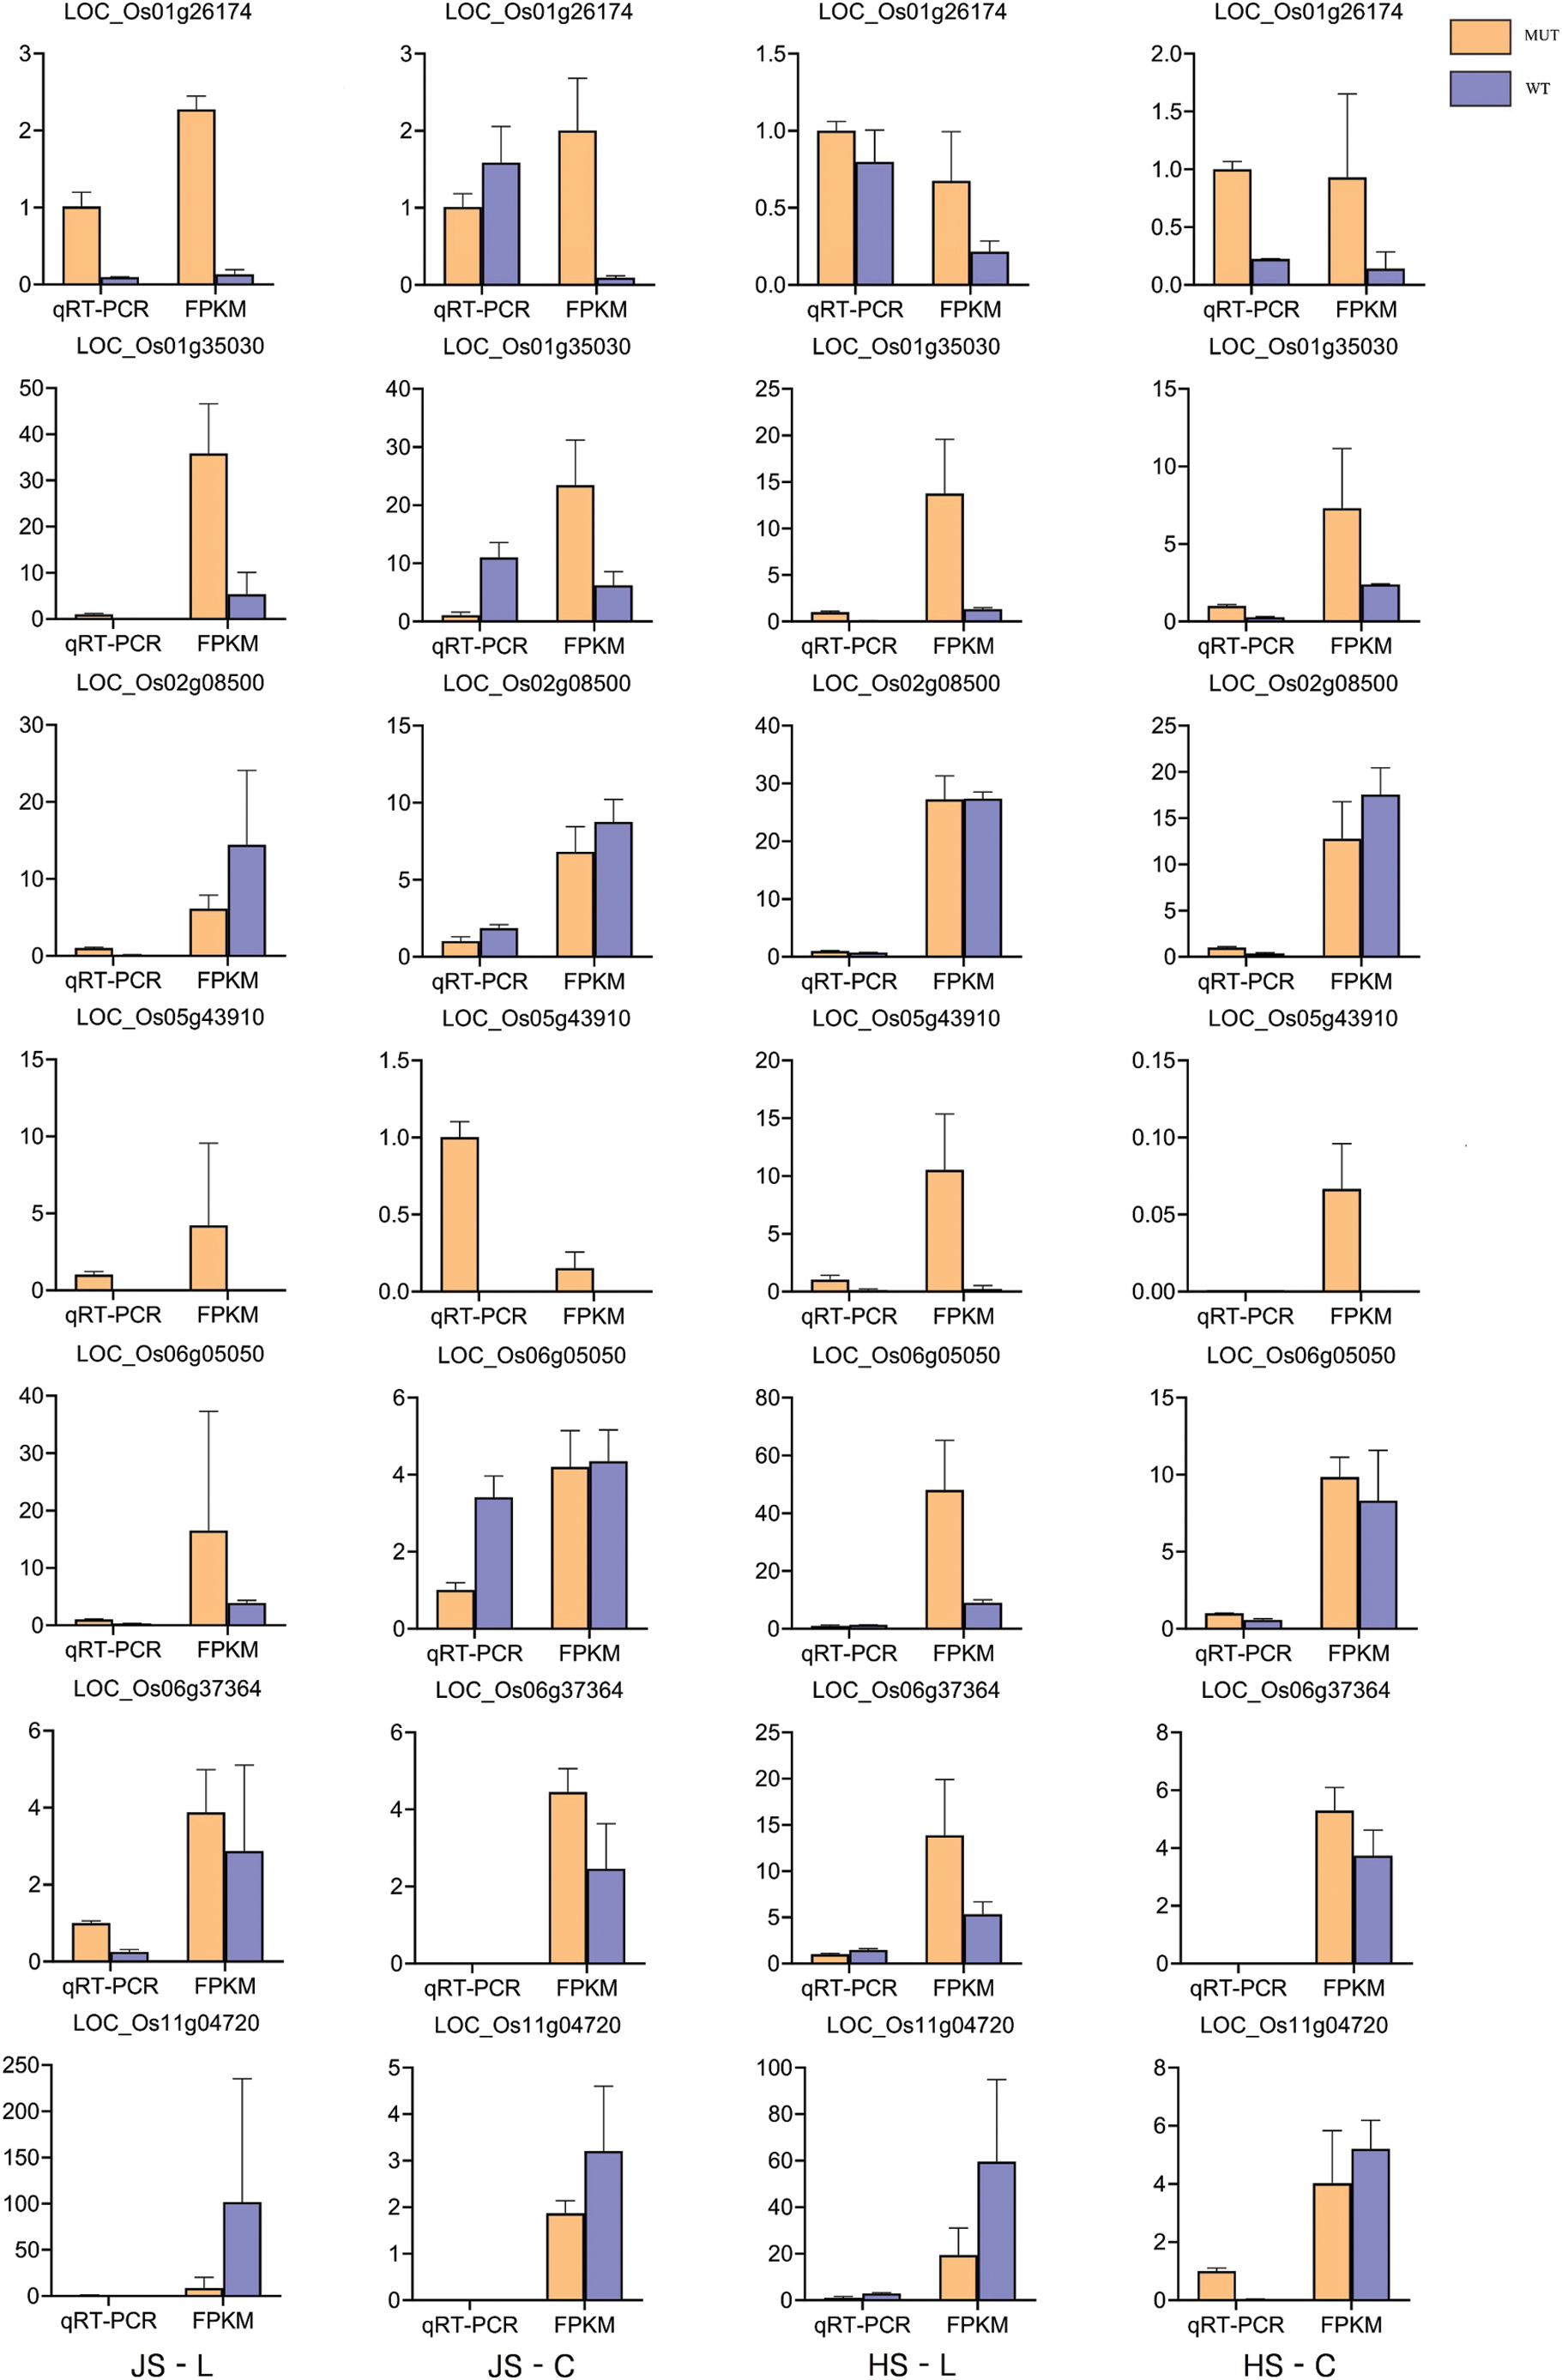
Figure S7: Quantitative real-time polymerase chain reaction (qRT-PCR) validation of plant height candidate genes. JS-L, JS-C, HS-L, and HS-C in the base of the figure represent four treatment groups. Gene names are written in front of the histogram.
Cite This Article
 Copyright © 2023 The Author(s). Published by Tech Science Press.
This work is licensed under a Creative Commons Attribution 4.0 International License , which permits unrestricted use, distribution, and reproduction in any medium, provided the original work is properly cited.
 Downloads
 Citation Tools