DOI:10.32604/biocell.2022.020512
| BIOCELL DOI:10.32604/biocell.2022.020512 | |
| Article |
Transcriptome analysis combined with metabolome analysis reveals the significant functions of CesA genes in cotton (Gossypium hirsutum) fiber length development
1College of Agronomy, Henan Agricultural University, Zhengzhou, 450002, China
2Jiangxi Agricultural Engineering Vocational College, Zhangshu, 331200, China
*Address correspondence to: Zhenkui Cui, czkhenau@126.com; Guiqin Sun, sunguiqin2006@163.com
#Zhenkui Cui and Guiqin Sun contributed equally to this work
Received: 28 November 2021; Accepted: 17 January 2022
Abstract: Cotton is widely distributed worldwide, and improving the quality of its fiber is one of the most important tasks in cotton breeding. Cotton fibers are primarily composed of cellulose, which is synthesized by CesA complexes (CSCs). However, the functions of CesA genes in cotton fiber development have not been comprehensively analysed. In this study, the cotton transcriptome and metabolome were used to investigate the function of CesA genes in fiber development. Finally, 321 metabolites were obtained, 84 of which were associated with the corresponding genes. Interestingly, a target gene named Gh_A08G144300, one of the CesA gene family members, was closely correlated with the development of cotton fibers. The target CesA gene Gh_A08G144300 was analysed to determine its specific function in cotton fiber development. High-level gene expression of Gh_A08G144300 was found at different fiber development stages by RNA-seq analysis, and the silencing of Gh_A08G144300 visibly inhibited the growth of cotton fibers, showing that it is critical for their growth. This study provides an important reference for research on the gene function of Gh_A08G144300 and the regulatory mechanism of fiber development in cotton.
Keywords: Transcriptome; Metabolome; CesA; Cotton fiber; VIGS
Cotton, an economic crop, is widely distributed all over the world (Hu et al., 2019). Cotton fiber is considered to be the most valuable part of this plant and primarily consist of cellulose (Krakhmalev and Zakirov, 2000). Cotton fiber is a relatively effective system for synthesizing cellulose and fibers compared with other plants. Thus, cotton can be used as a model to study the mechanisms of cellulose production (Hu et al., 2019).
Cotton fiber development consist of five continuous and overlapping stages, which is fiber initiation, fiber elongation, transition, SCW thickening, dehydration and maturation (Chen et al., 2019). The two periods are arranged in chronological order (Gou et al., 2007). SCW thickening is closely related to the quality of the cotton fiber, which merits further study. These developmental stages are regulated by the expression of a series of genes (Hande et al., 2017). Zhang et al. (2021) analysed the cellulose synthase (CesA) gene family in four Gossypium species (diploid Gossypium arboreum and Gossypium raimondii, as well as tetraploid Gossypium hirsutum (‘TM-1’) and Gossypium barbadense (‘Hai-7124’ and ‘3–79’). They reported their phylogenetics, sequence variation and gene expression in relation to fiber quality in Upland cotton. They found that the CesA gene family plays a central role in this process (Poppenberger et al., 2011). Li et al. (2013) performed phylogenetic analysis and gene coexpression profiling of CesAs, and the results revealed that CESA1, CESA2, CESA7, and CESA8 were the major isoforms for secondary cell wall biosynthesis, whereas CESA3, CESA5, CESA6, CESA9 and CESA10 should be involved in primary cell wall formation for cotton fiber initiation and elongation. A better understanding of CesA physiological functions and evolutionary history is of vital significance. Previous research reported that there are at least 32 CesA family genes in allotetraploid cotton, which is twice as many as in G.raimondii (Zhang et al., 2015). Documents also showed that the CesA gene family has adapted differentially temporal expression patterns from At and Dt subgenomes (Yuan et al., 2015). Although many studies have reported the CesA genes in cotton, the functions of CesA genes in cotton fiber development have not been comprehensively performed.
With its rapid development, the large-scale application of next-generation sequencing (NGS) technology has helped decipher a substantial amount of genetic and transcriptomic information (Goodwin et al., 2016). NGS technology has been a powerful tool in the research of many plants, including Arabidopsis (Loraine et al., 2013), rice (Kawahara et al., 2013), soybean (Chaudhary et al., 2015) and sesame (Wang et al., 2014). Cotton fiber development of Upland cotton (Gossypium hirsutum) and chromosome segment substitution lines from G. hirsutum x G. barbadense have been studied using a comparative transcriptome analysis method (Li et al., 2017). A major role for ethylene in cotton fiber cell elongation was revealed with transcriptome profiling, molecular and physiological studies (Shi et al., 2006). The respective transcriptomes and metabolite profiles were compared and analysed to reveal features of cotton fiber cells at the fast elongation and secondary cell wall synthesis stages (Gou et al., 2007). Metabonomics takes organisms as a dynamic research target, establishes related metabolic models through scientific data analysis techniques and makes joint analysis with transcriptome, proteomics and other data to truly reflect change at the organismal level (Rai et al., 2017; Riano-Pachon et al., 2009). In recent years, omics-based approaches have provided a deeper and broader perspective for the study of static and dynamic changes in organisms (Deshmukh et al., 2014; Moreno-Risueno et al., 2010; Rai et al., 2016). Multiple omics could be used to identify and analyse the interpunctions of one or more genes in metabolic pathways (Shen et al., 2016).
At present, the transcriptome combined with the metabolome is widely used to explain the regulatory mechanism of plant growth (Huang et al., 2019; Lou et al., 2014; Wang et al., 2018). In this study, two omics approaches, transcriptomics and metabolomics, were used to investigate the significant function of CesA genes in cotton fiber development. Finally, a representative target CesA gene, Gh_A08G144300, was selected and functionally studied, providing a reference from which to expand our understanding of cotton CesA genes at the molecular level.
Evaluation of metabolome results
Six samples were selected and used for metabolic analysis at two stages (three replicates), including 5DPA (days post flowering) and 15DPA. Generally, Cotton fibers initiate near the day of flower opening, and 5DPA is the fiber elongation stage while 15DPA is transition stage from primary cell wall to secondary cell wall thickening, suggesting that they are two important stages of fiber development. Finally, 321 metabolites were obtained (Fig. 1a), including 204 Pos metabolites and 161 Neg metabolites, among which 84 metabolites with protein were identified (Supplementary Table 1). Differentially expressed analysis was conducted based on all metabolites detected, and the results can be found in (Figs. 1b and 1c).
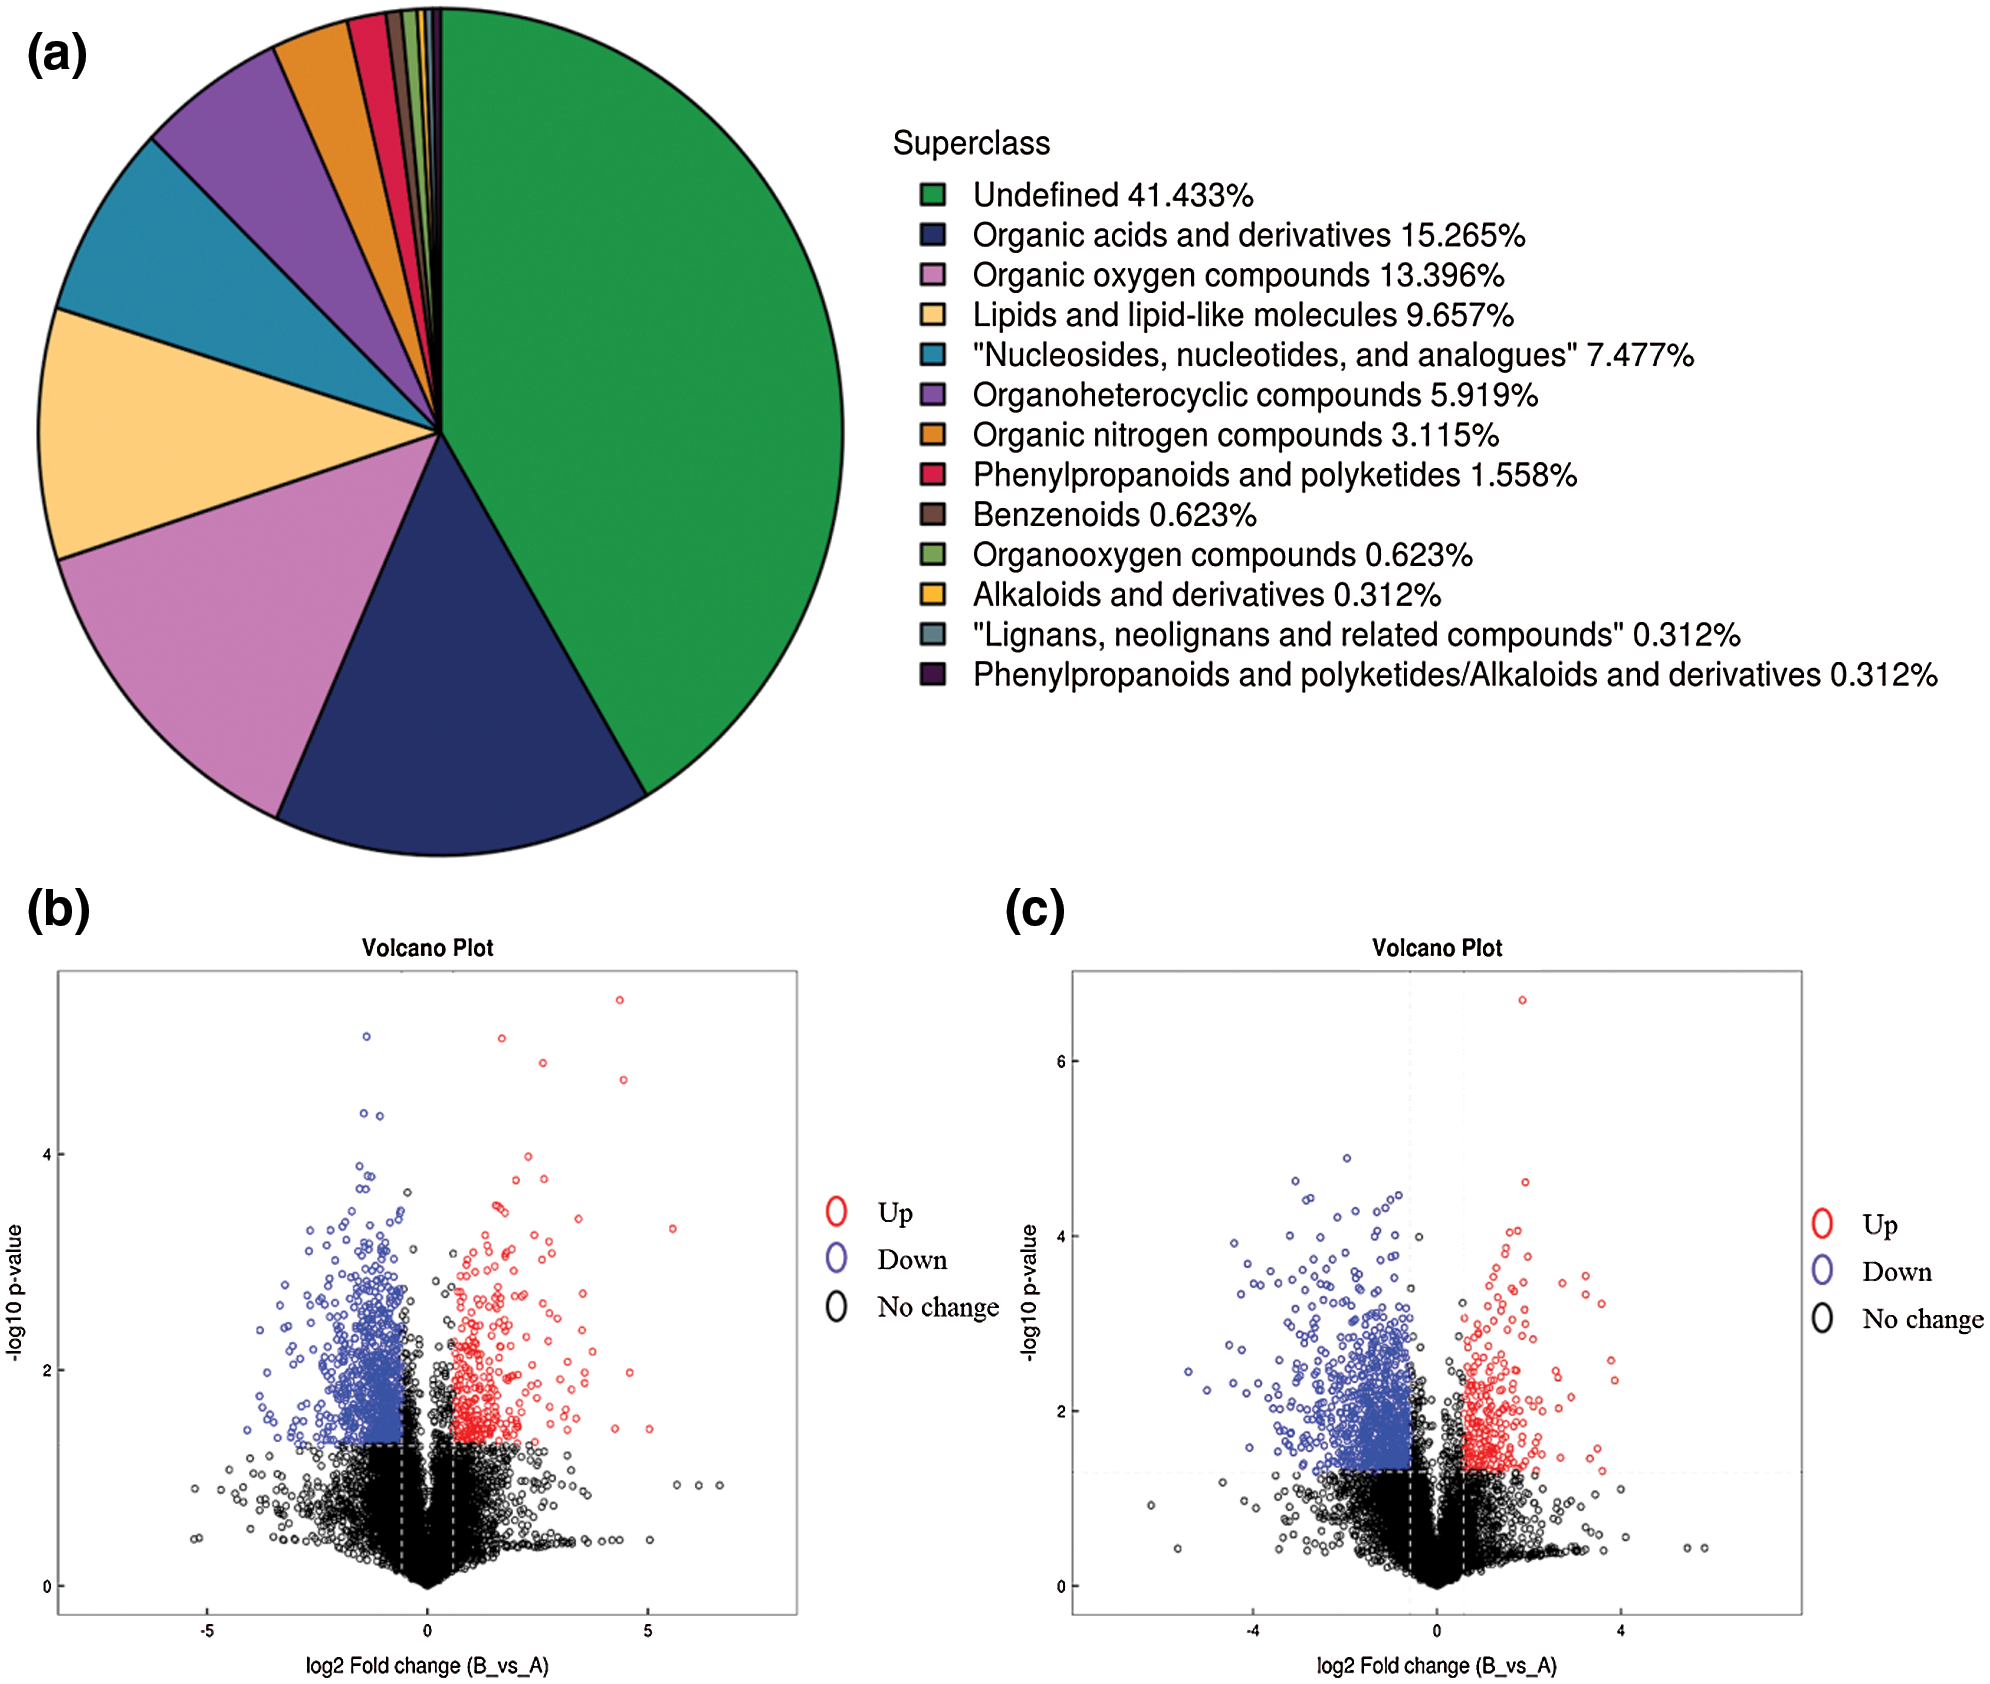
Figure 1: Analysis of main metabolites classification and expressions. a, Classification of main metabolites. Red circle represents up-regulated metabolites, blue circle represents down-regulated metabolites while black circle represents metabolites with no significant expression differences. b, Volcano plot of pos metabolites; c, Volcano plot of neg metabolites. Red circle represents up-regulated metabolites, blue circle represents down-regulated metabolites while black circle represents metabolites with no significant expression differences.
Partial least squares discrimination analysis (PLS-DA) was an effective method to compare significant differential metabolites, and OPLS-DA was an analysis tool that could be used to modify PLS-DA by filtering the noise unrelated to the classification information to improve the analytical ability and effectiveness of the model. The results suggest that this model was stable and reliable (Fig. 2, Supplementary Table 2).
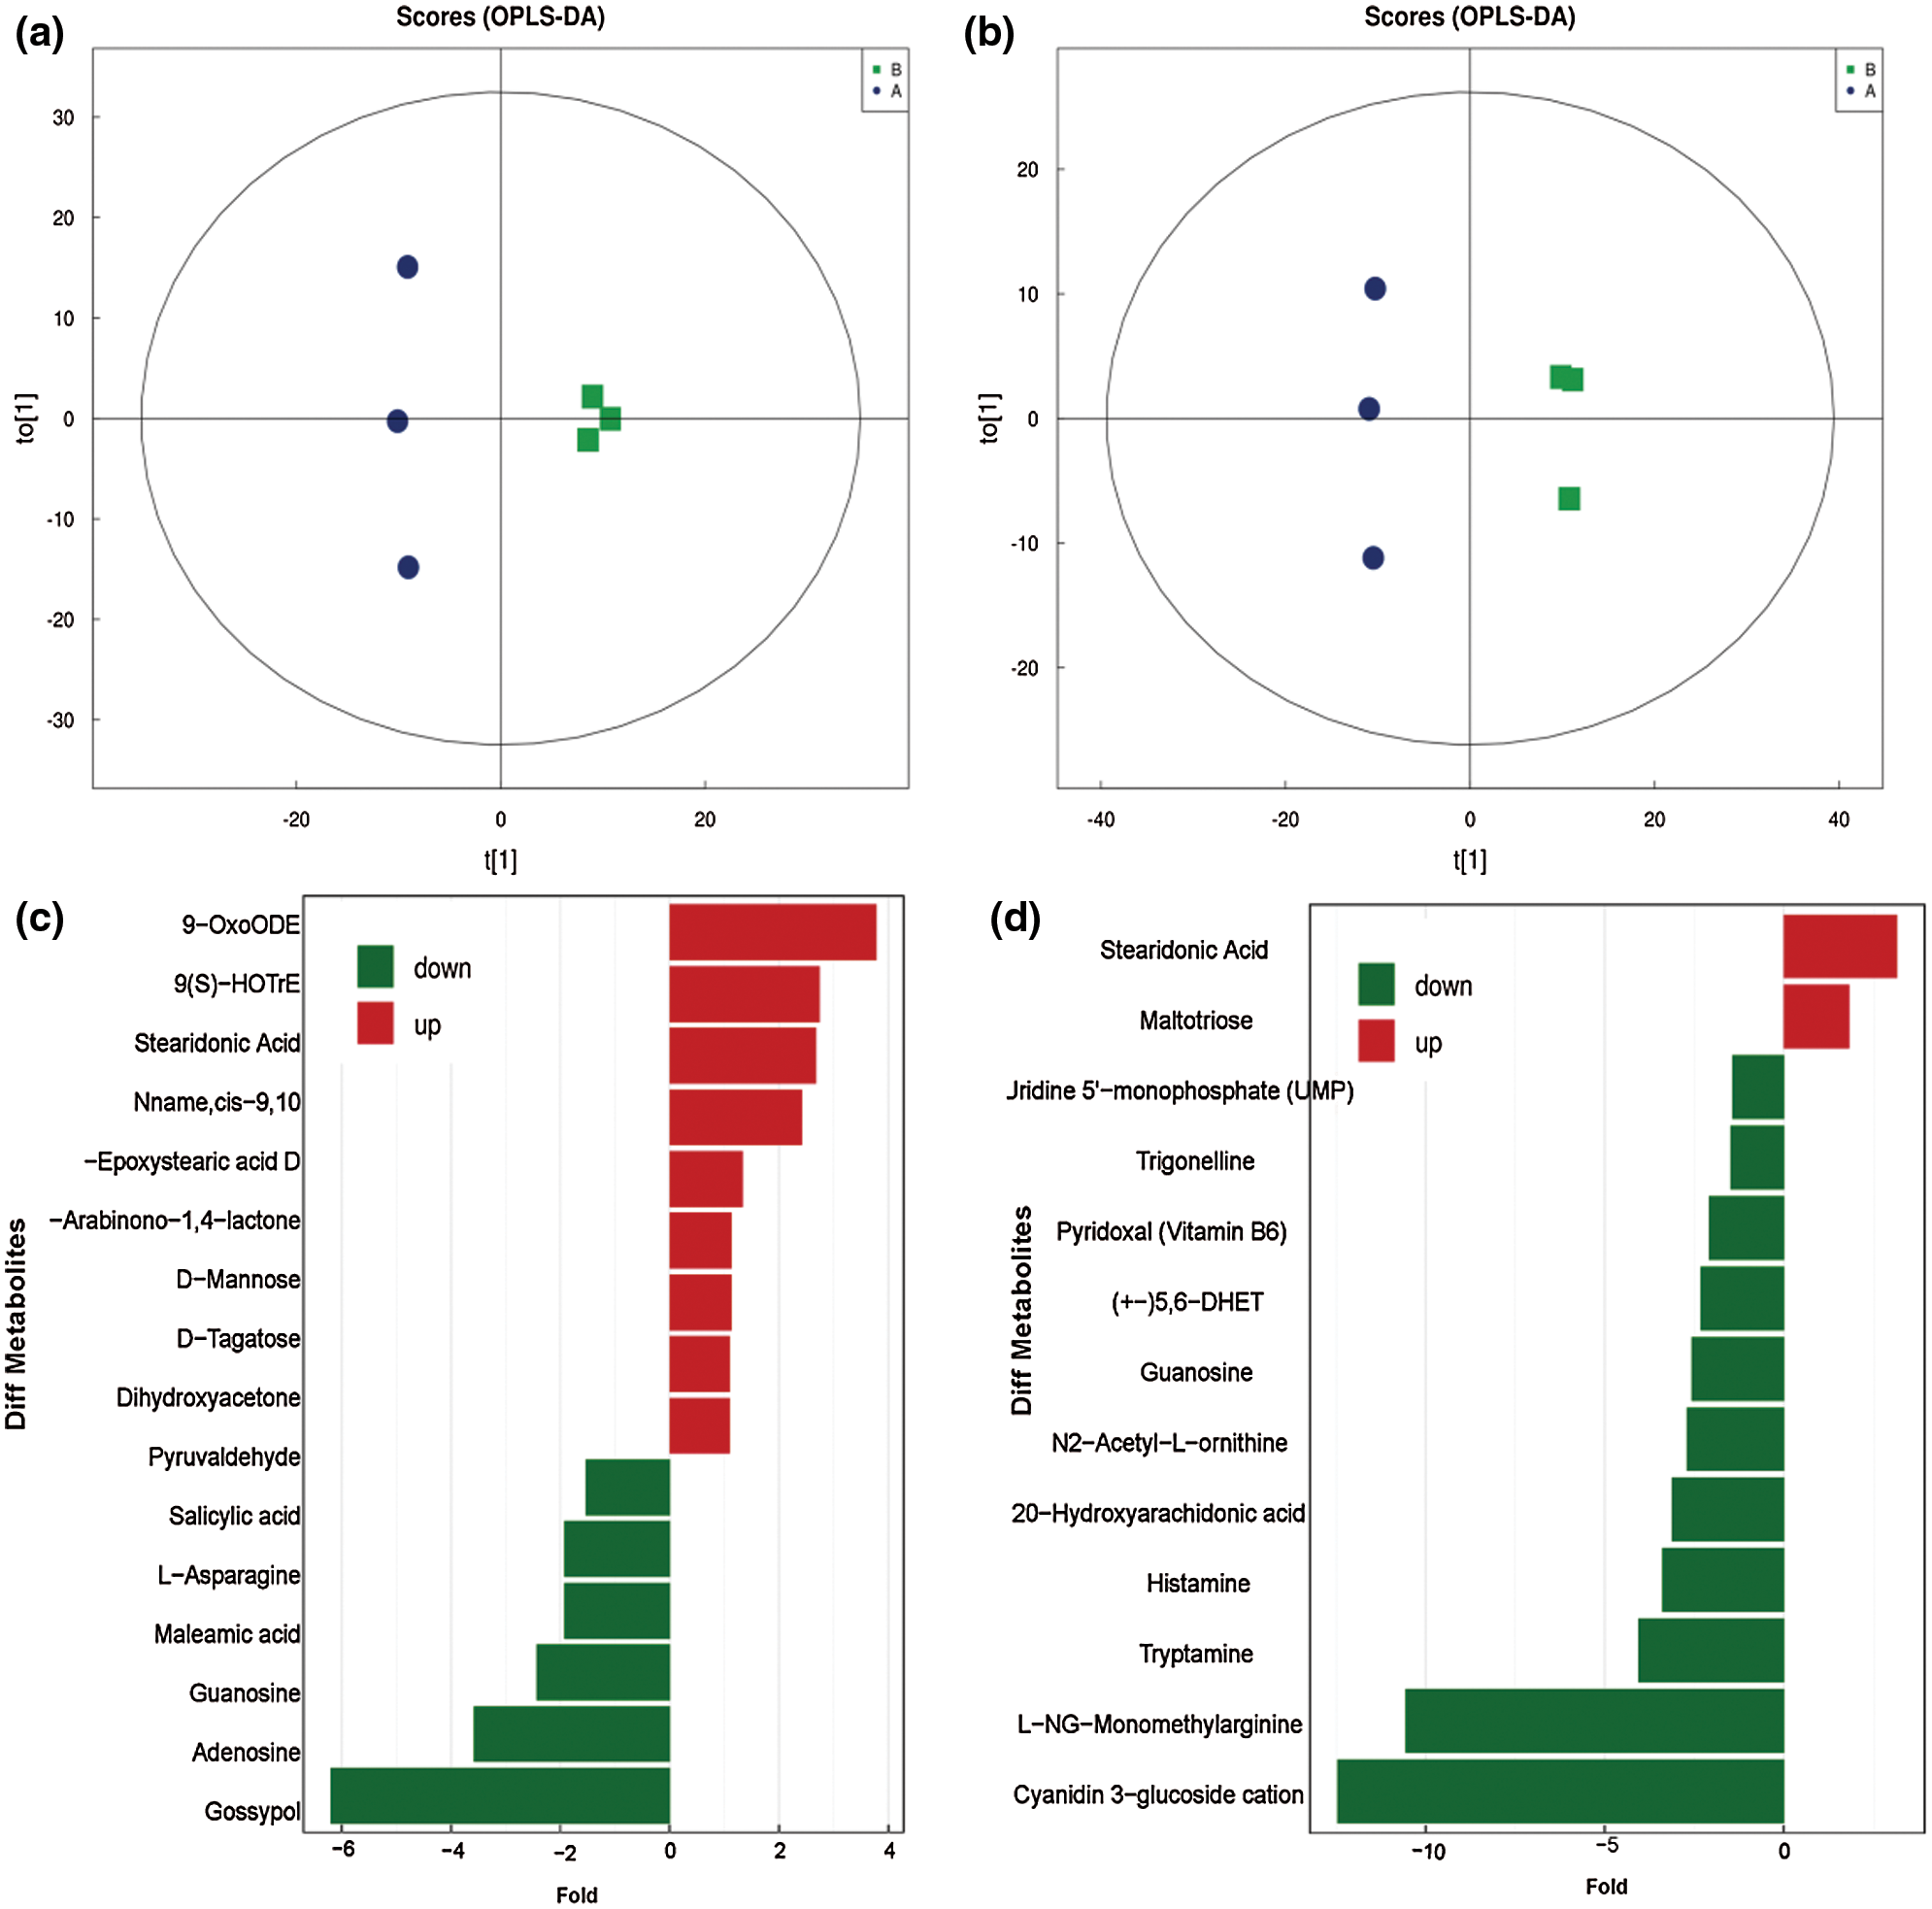
Figure 2: Analysis of significantly differential metabolites. a, Score of metabolites with the pos-model; b, Score of metabolites with neg-model; c, Differential expression multiple analysis of metabolites with neg-model; d, Differential expression multiple analysis of metabolites with pos-model.
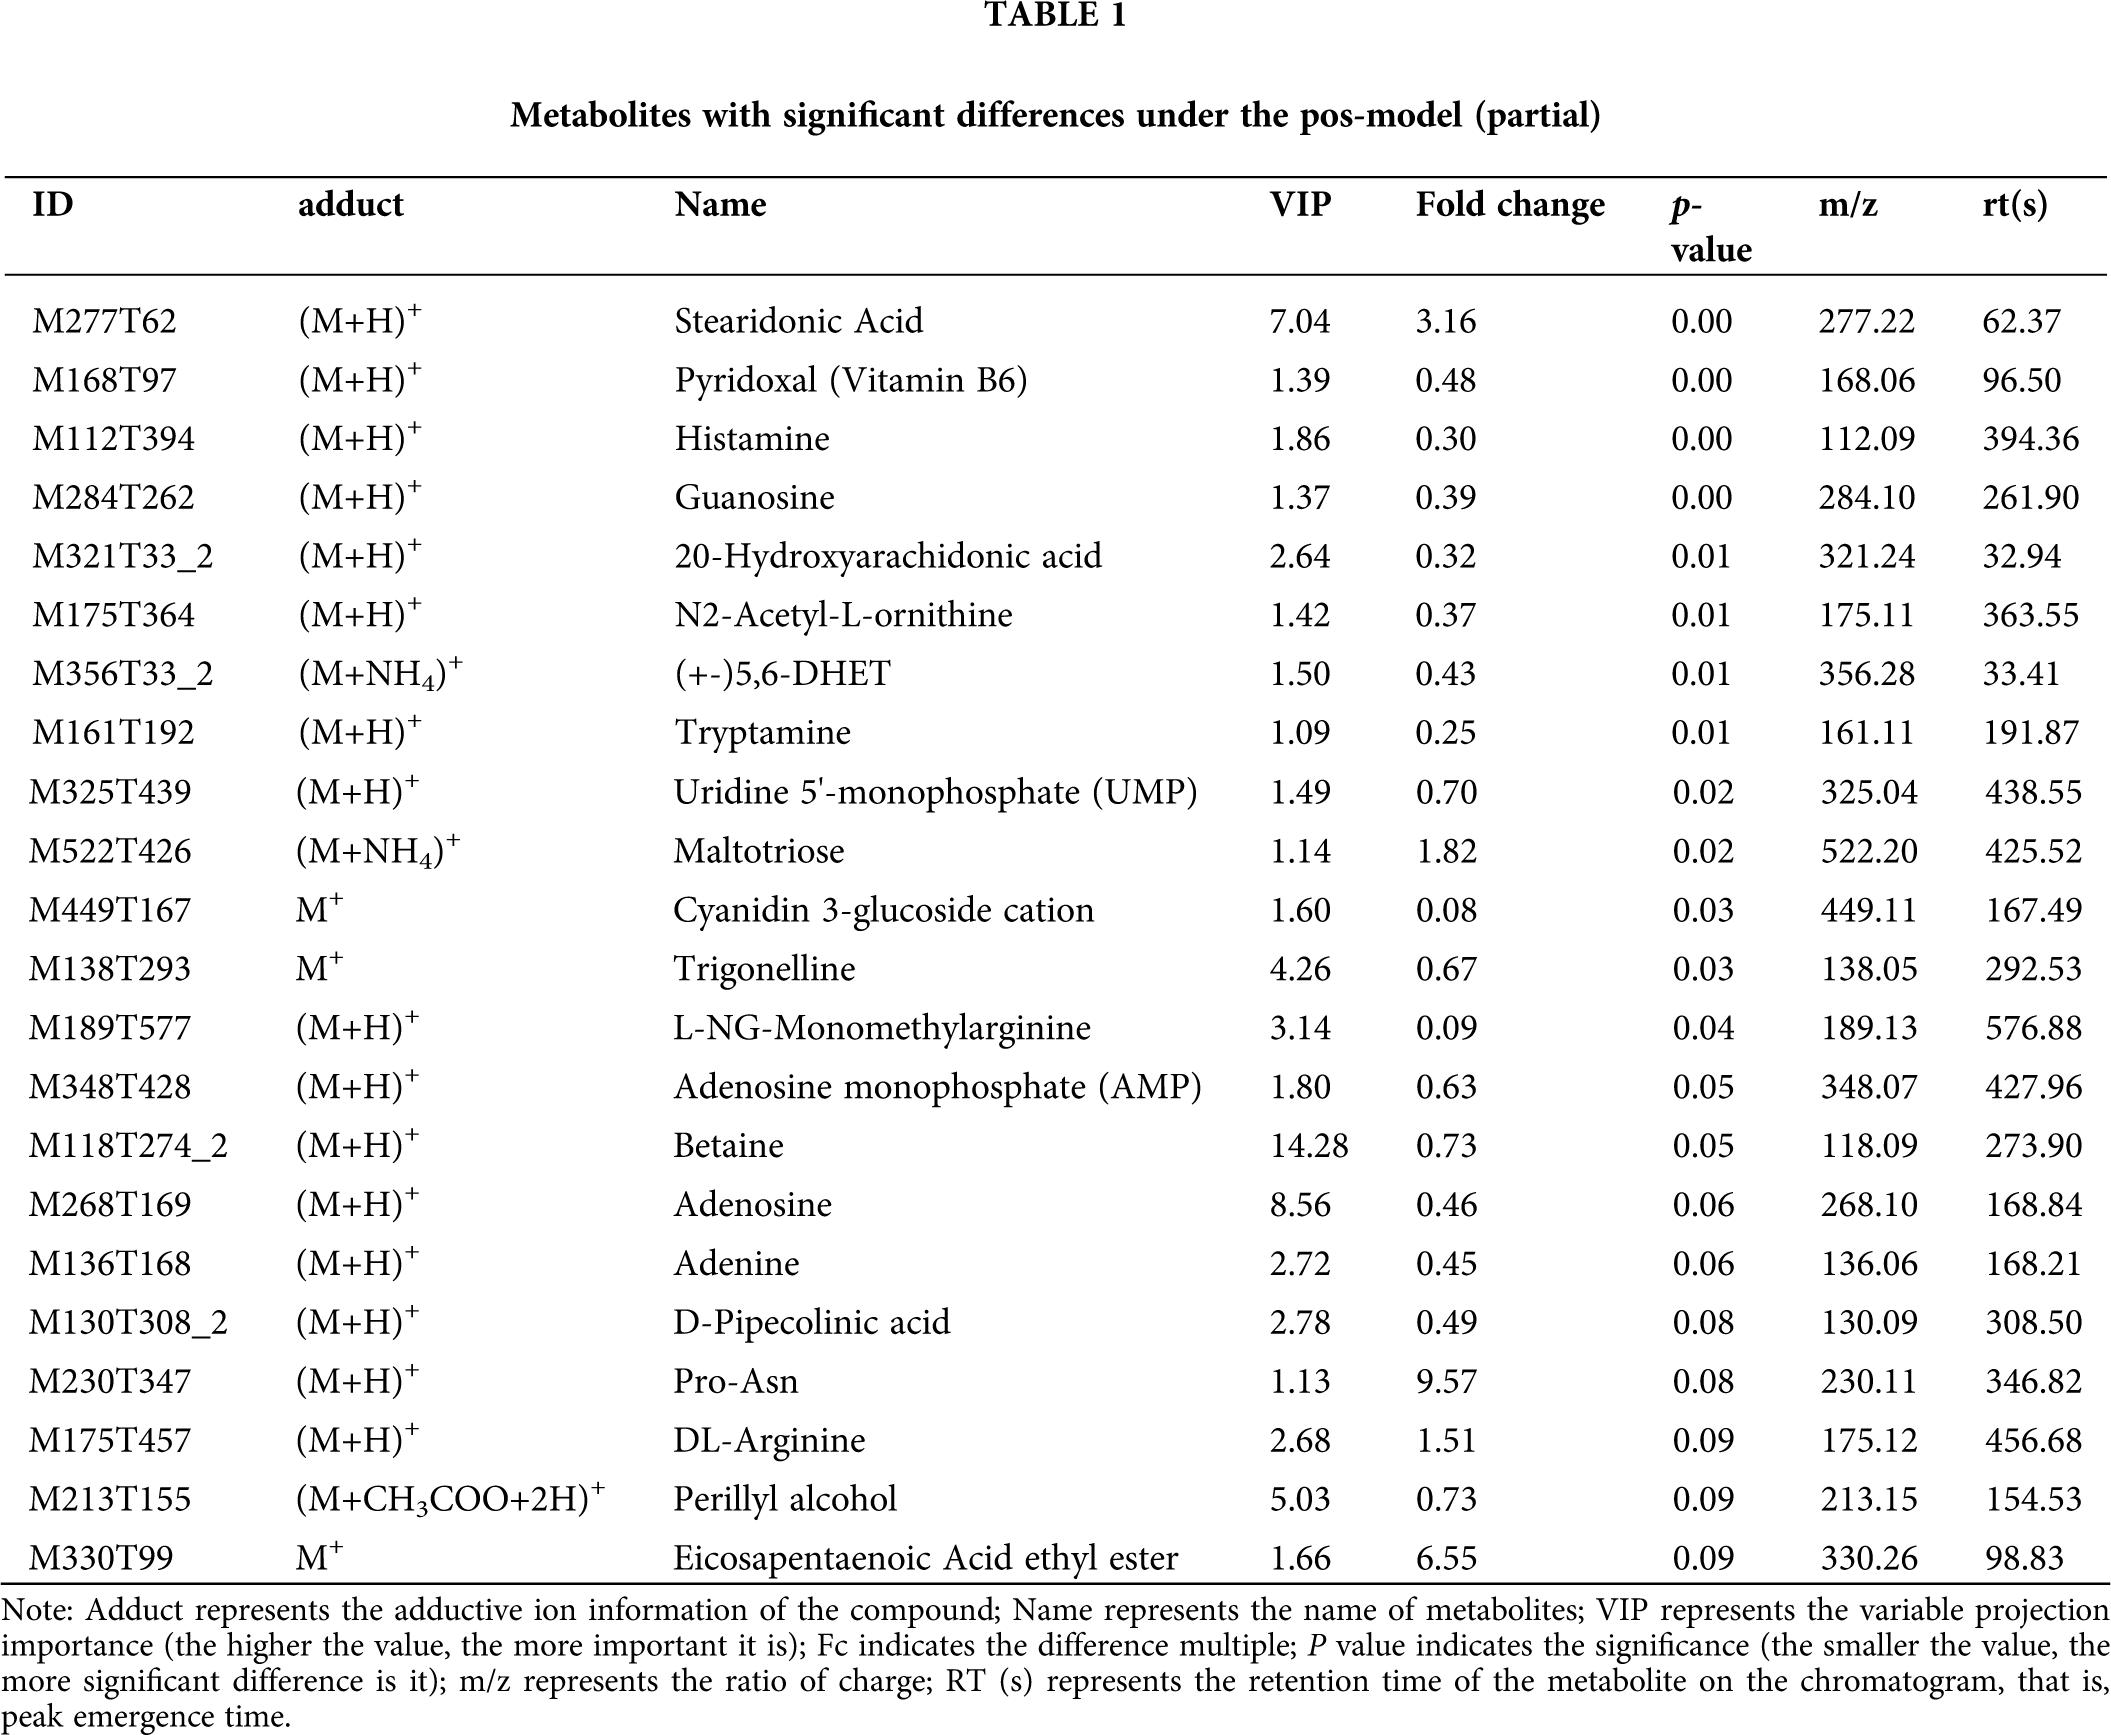
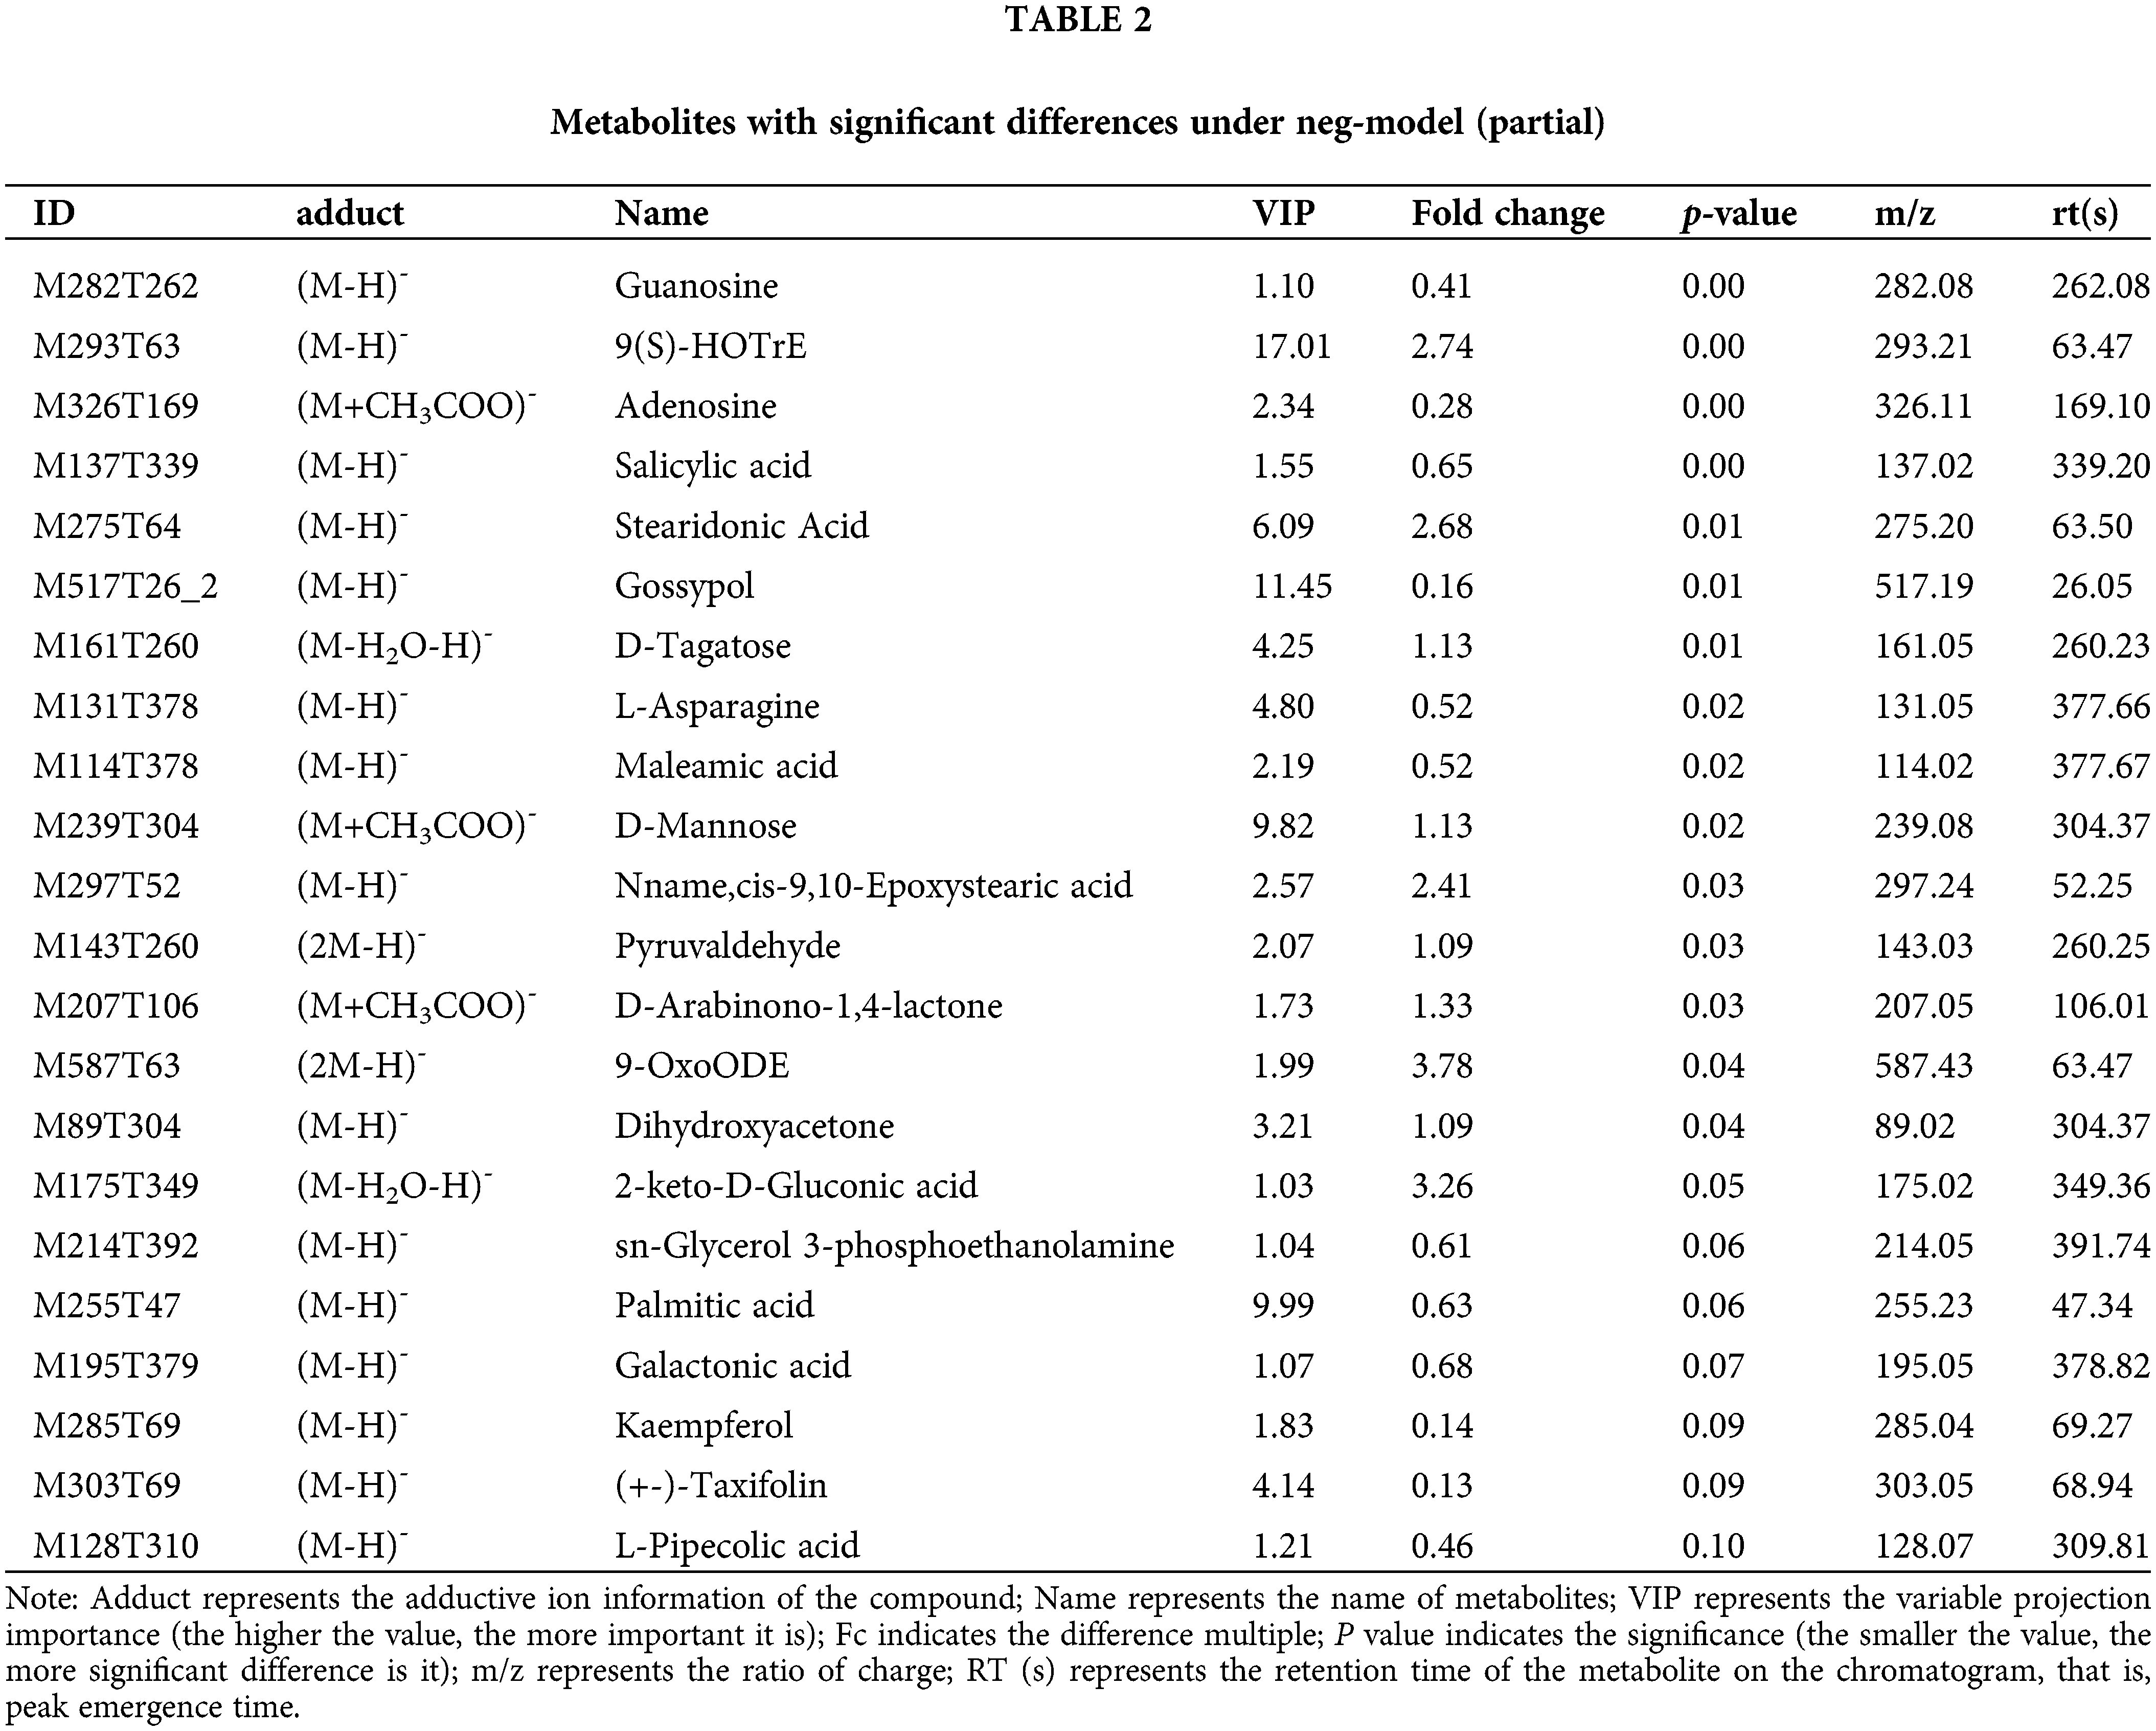
This model could be used to evaluate the quantity of each metabolite and identify significantly differential metabolite molecules at biological level. Analysis of metabonomics was always performed based on the strict standard of OPLS-DA VIP > 1 and P value < 0.05, which were also the standard for selecting the significantly differential metabolites. In our study, 11627 and 8630 metabolites were obtained with pos-model and neg-model, respectively. We list several metabolites with significant differences (orange) based on the value of OPLS-DA VIP > 1 and P value < 0.05 in (Tables 1 and 2). Subsequent analyses mainly focused on these metabolites, including 13 metabolites with pos-model and 15 metabolites with neg-model.
Transcriptome analysis of two important stages in fiber development
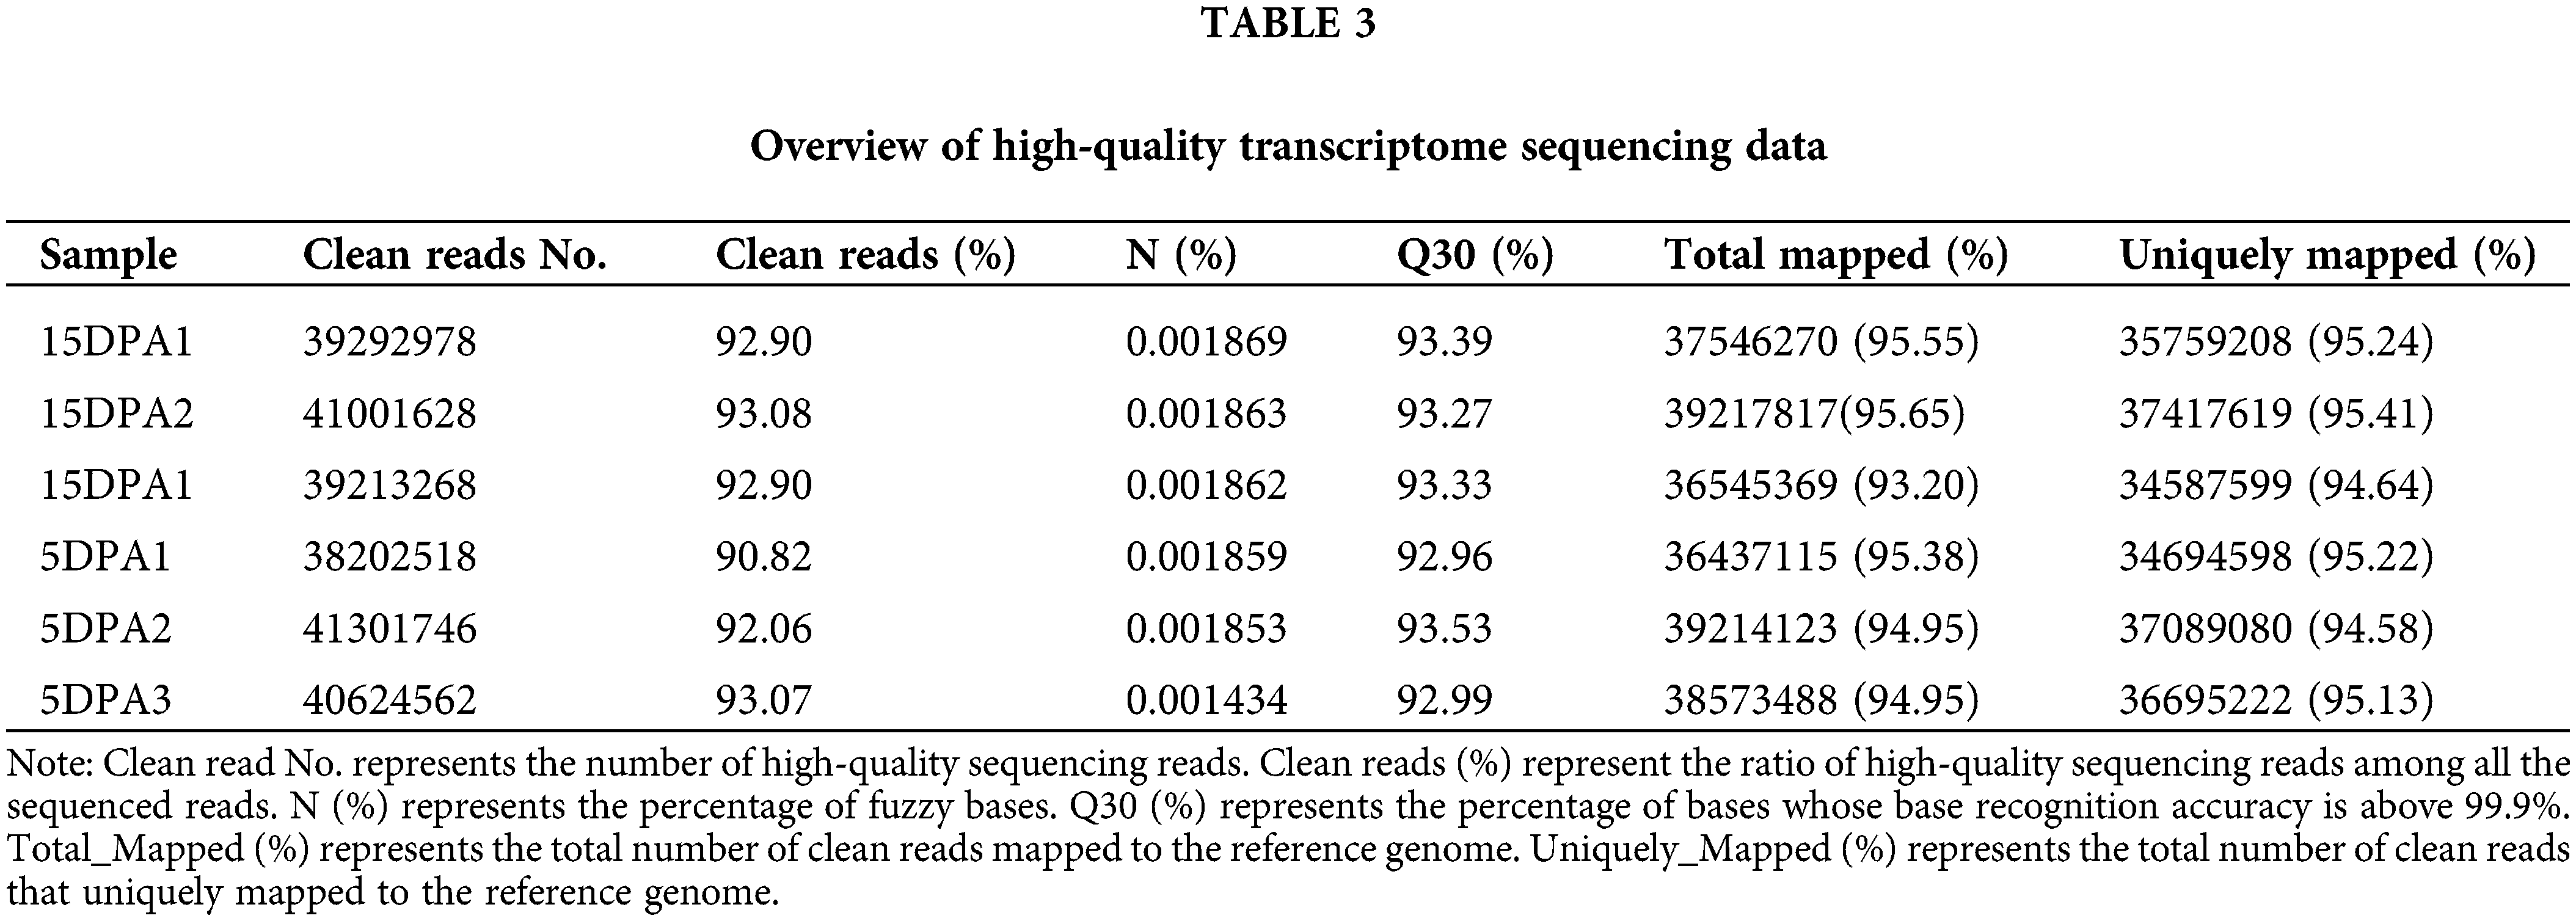
In our transcriptome data, six different fiber samples, including three 5DPA and three 15DPA samples, were obtained using Illumina sequencing technology (San Diego, CA, USA), and the statistical results of the transcriptomes are shown in Table 3. The ratio of clean reads and the total mapped rate were 90.0% and 93.0%, respectively. A total of 36 G of data were obtained after quality control, and the Q30 base ratio was above 92.0%. In addition, the uniquely mapped rate was higher than 94.0%. All these indicators demonstrated that the transcriptomic data were highly accurate for subsequent analyses.
DESeq was used to analyse the differentially expressed genes (DEGs) based on the criteria of |log2FoldChange| > 1. Finally, 7175 DEGs were obtained, including 3351 that were upregulated and 3824 that were downregulated. The transcriptional results are shown in Fig. 3. The correlation coefficients among all samples were between 0.8–1, indicating that the gene expression level among samples reflects that the samples we selected are reasonable (Fig. 3a). The majority of genomic DEGs were located on the A05 and D05 chromosomes, suggesting that these two chromosomes are closely related to fiber development (Fig. 3b). These DEGs were mainly enriched in ATP binding, pyrophosphatase activity, nucleoside-triphosphatase activity and hydrolase activity (Fig. 3c). In addition, we found that four differentially expressed CesA genes were identified from the transcriptome data (Supplementary Table 3). One target gene belong to CESA3 member named Gh_A08G144300 (GO: 0005524 and KEGG: K08900) with high expression were obtained in the process of cotton fiber length development (Fig. 4b).
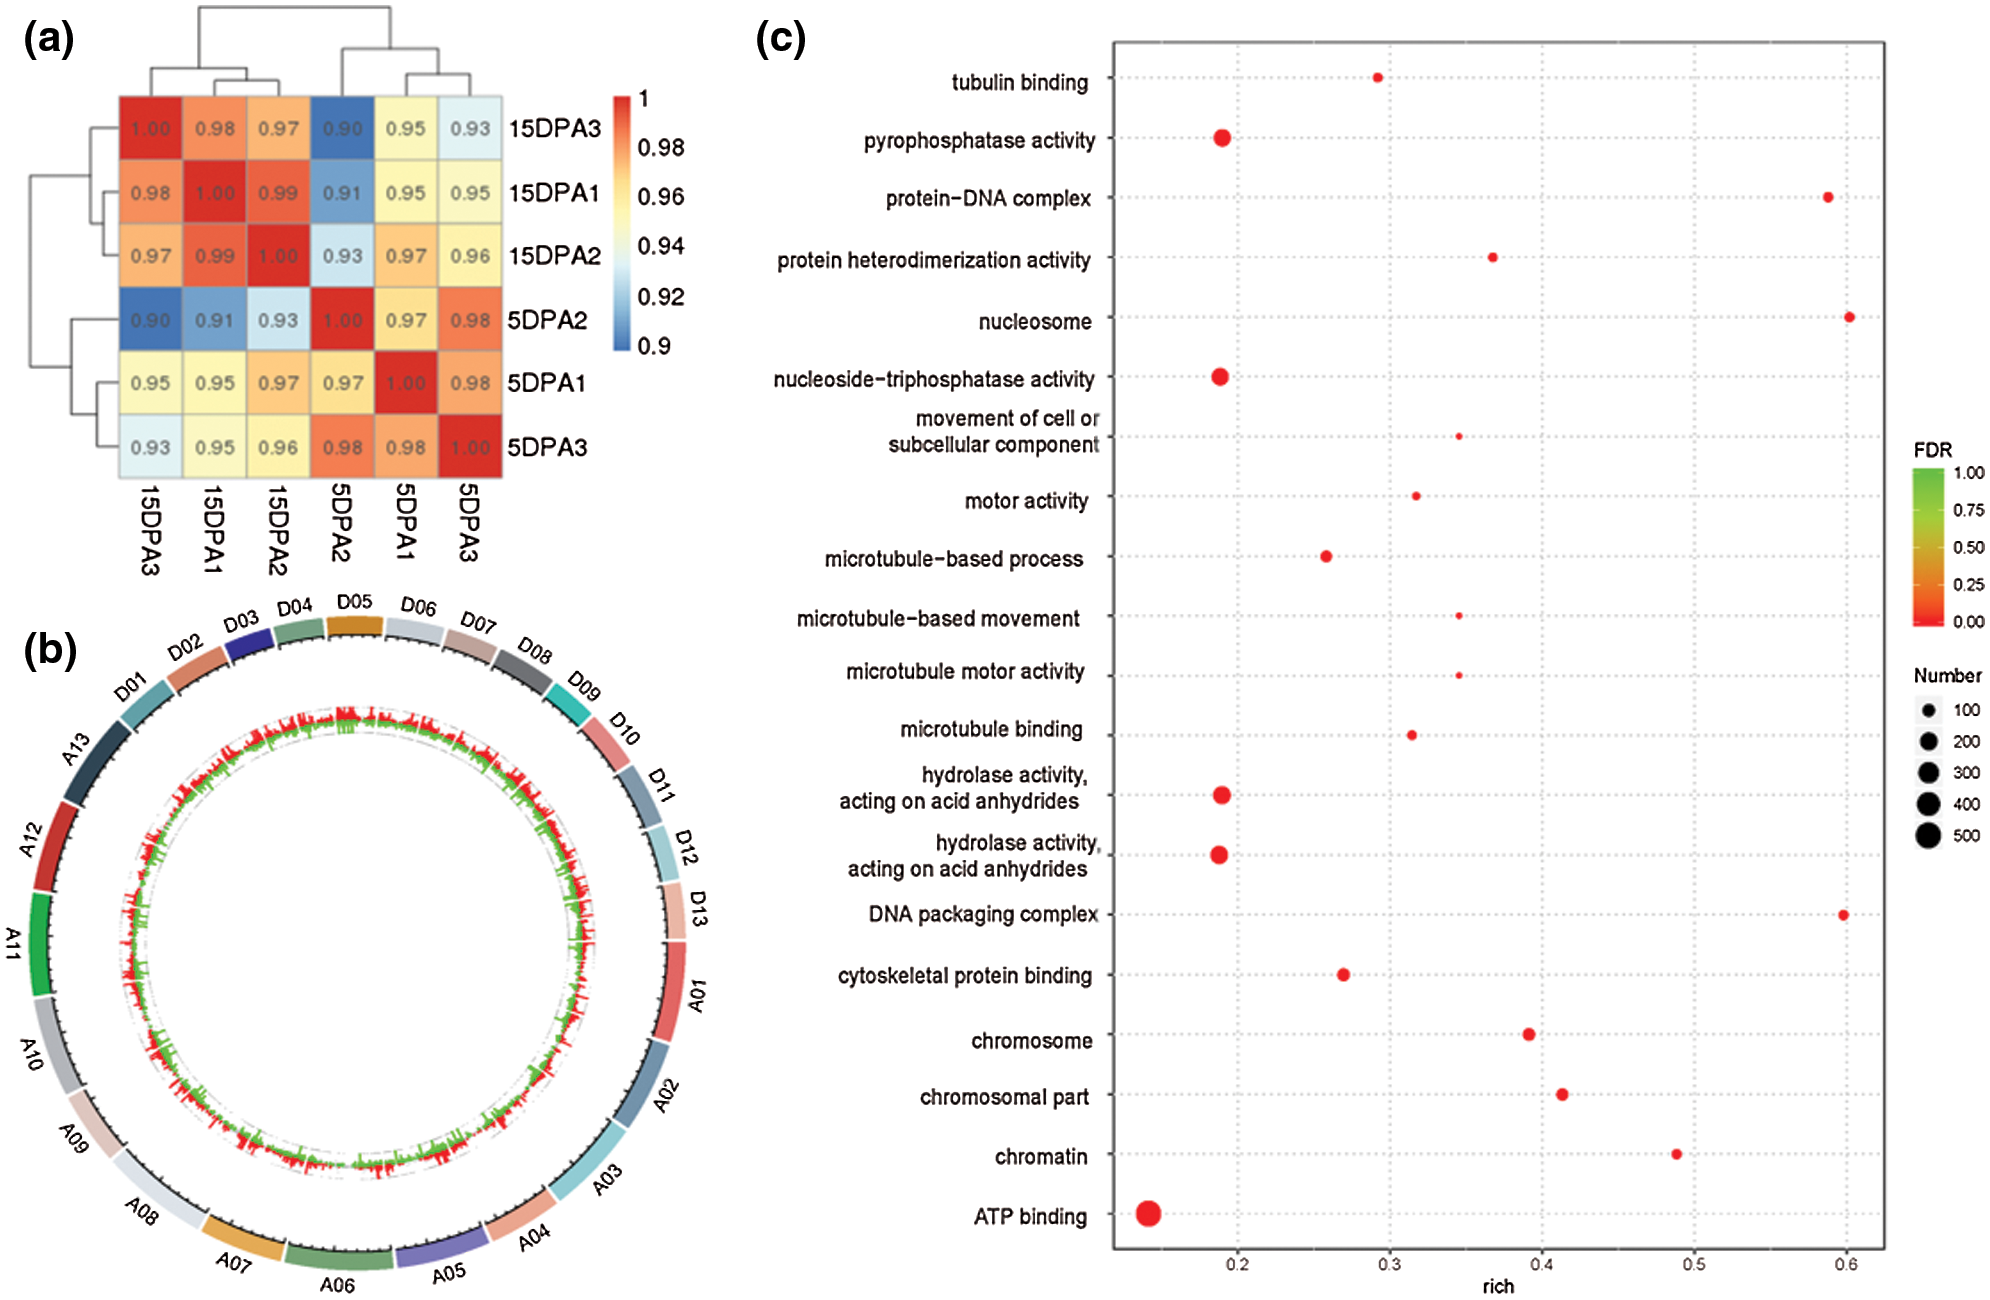
Figure 3: Differentially expressed genes based on transcriptome analysis. a, Correlation analysis of different samples. The left and upper sides are sample clustering, the right and lower sides of the figure are sample names, and squares with different colors represent the correlation between the two samples. b, Distribution analysis of DEGs in the genome. The outermost circle is the chromosomal band. The histogram of log2FoldChange values of up-regulated and down-regulated genes are shown in red and green respectively, and the scatter diagram of log2FoldChange values of genes with no differentially expressed genes is shown in gray. c, GO analysis of DEGs. The larger the Rich factor, the greater the degree of enrichment. FDR generally ranges from 0 to 1. The closer it is to zero, the more significant the enrichment is.
Expression analysis of the target gene Gh_A08G144300
Based on the results of significantly differential metabolites and DEGs, conjoint analysis was conducted. A total of 84 metabolites with corresponding genes and enzymes were obtained, including 36 metabolites with pos-model and 48 metabolites with neg-model (Supplementary Tables 4 and 5). In addition, fold changes in expression were also investigated, and the results are shown in (Supplementary Tables 6 and 7). To further investigate the function of the target gene Gh_A08G144300 in more detail, the expression levels in different tissues and fiber development stages were detected at 5, 10, 15, 20 and 25DPA using a fluorescence quantification method. The results indicated that the expression level of this gene in the fiber was significantly higher than that in other tissues (Fig. 4). In addition, the expression levels of this gene at different fiber development stages were analysed. However, the Gh_A08G144300 gene reached a peak at 10 and 15DPA in fiber development and then decreased significantly. This gene was highly expressed throughout the entire fiber period. In addition, the metabolite contents and correlation network of the two genes were also analysed (Fig. 4c), indicating their important regulatory roles in fiber development.
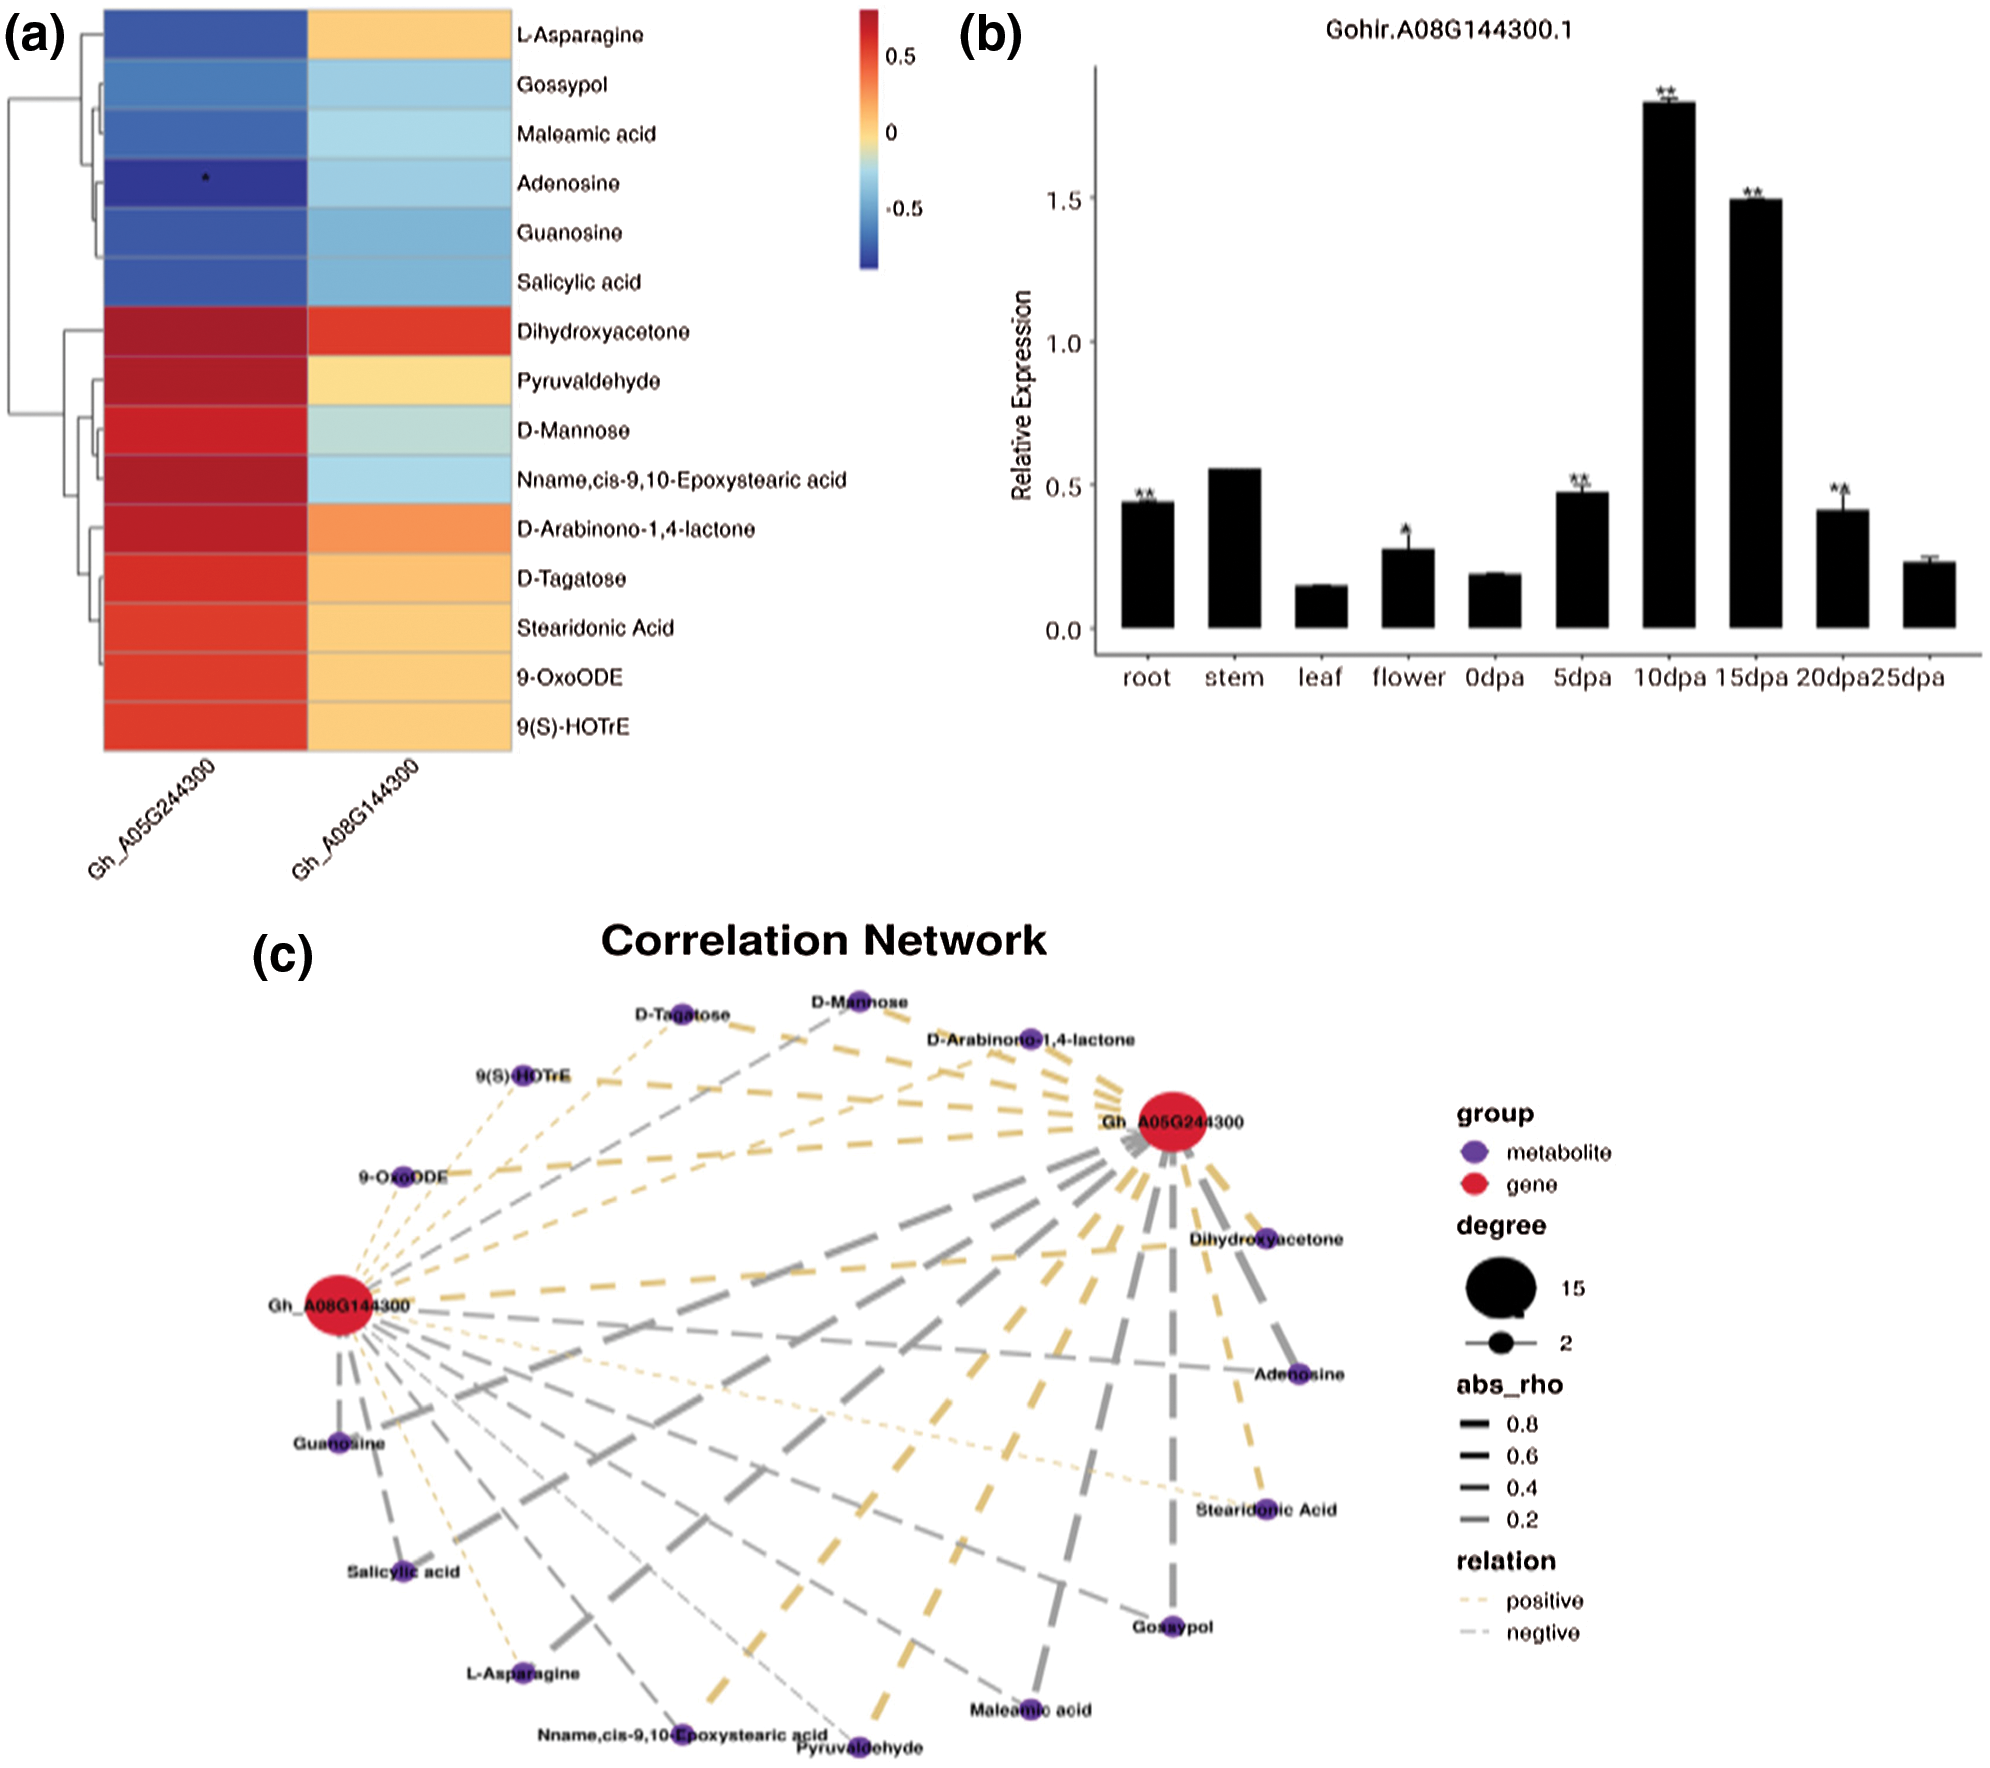
Figure 4: Expression patterns analysis of Gh_A08G144300 at different growth stages and its correlation analysis. a, Heatmap of Gh_A08G144300 with the negative model. b, Expression analysis of Gh_A08G144300 at different growth stages. c, Correlation network analysis of Gh_A08G144300.
The Gh_A08G144300 gene plays an important role cotton fiber development
To study the possible biological functions of CesA genes during the process of plant growth, we selected Gh_A08G144300 to construct the CesA plant interference vector (Wu et al., 2011) and quantified the results of the cotton phenotype (Fig. 5). Paraffin section method of the fiber cell was used to study the cause of reduced fibers. Significant differences in cell volume and number and fiber length were observed between silencing plants, in which the target gene Gh_A08G144300 was silenced, and normal plants. This method was used to study the cause of reduced fibers of the TRV-Ch _CesA knockout, and the film was observed under a 200X optical microscope (Figs. 5a–5d). Fiber growth was inhibited significantly in Gh_A08G144300-silenced plants compared with that of the control plants (CK) (Figs. 5e and 5f). The number and size of cotton bolls was reduced with the average length decreasing by 20% from 35 mm (wild type, wt) to 28 mm (Fig. 5h). The average length decreased by 13% from 25 mm to 18 mm (Fig. 5i). The variations in cotton fibers may be caused by changes in the cell volume and number. In addition, the relative gene expression of Gh_A08G144300 was also investigated, and the results indicated that the target gene Gh_A08G144300 was significantly downregulated, verifying the vital function of this gene. In addition, the cellulose content of silencing plants and normal plants was measured and the results showed the cellulose content in silencing plants (5.02 mg/g) was significantly lower than the normal (9.15 mg/g) according the method described by Updegraff (1969). All results suggested that this gene plays an important role in fiber growth.
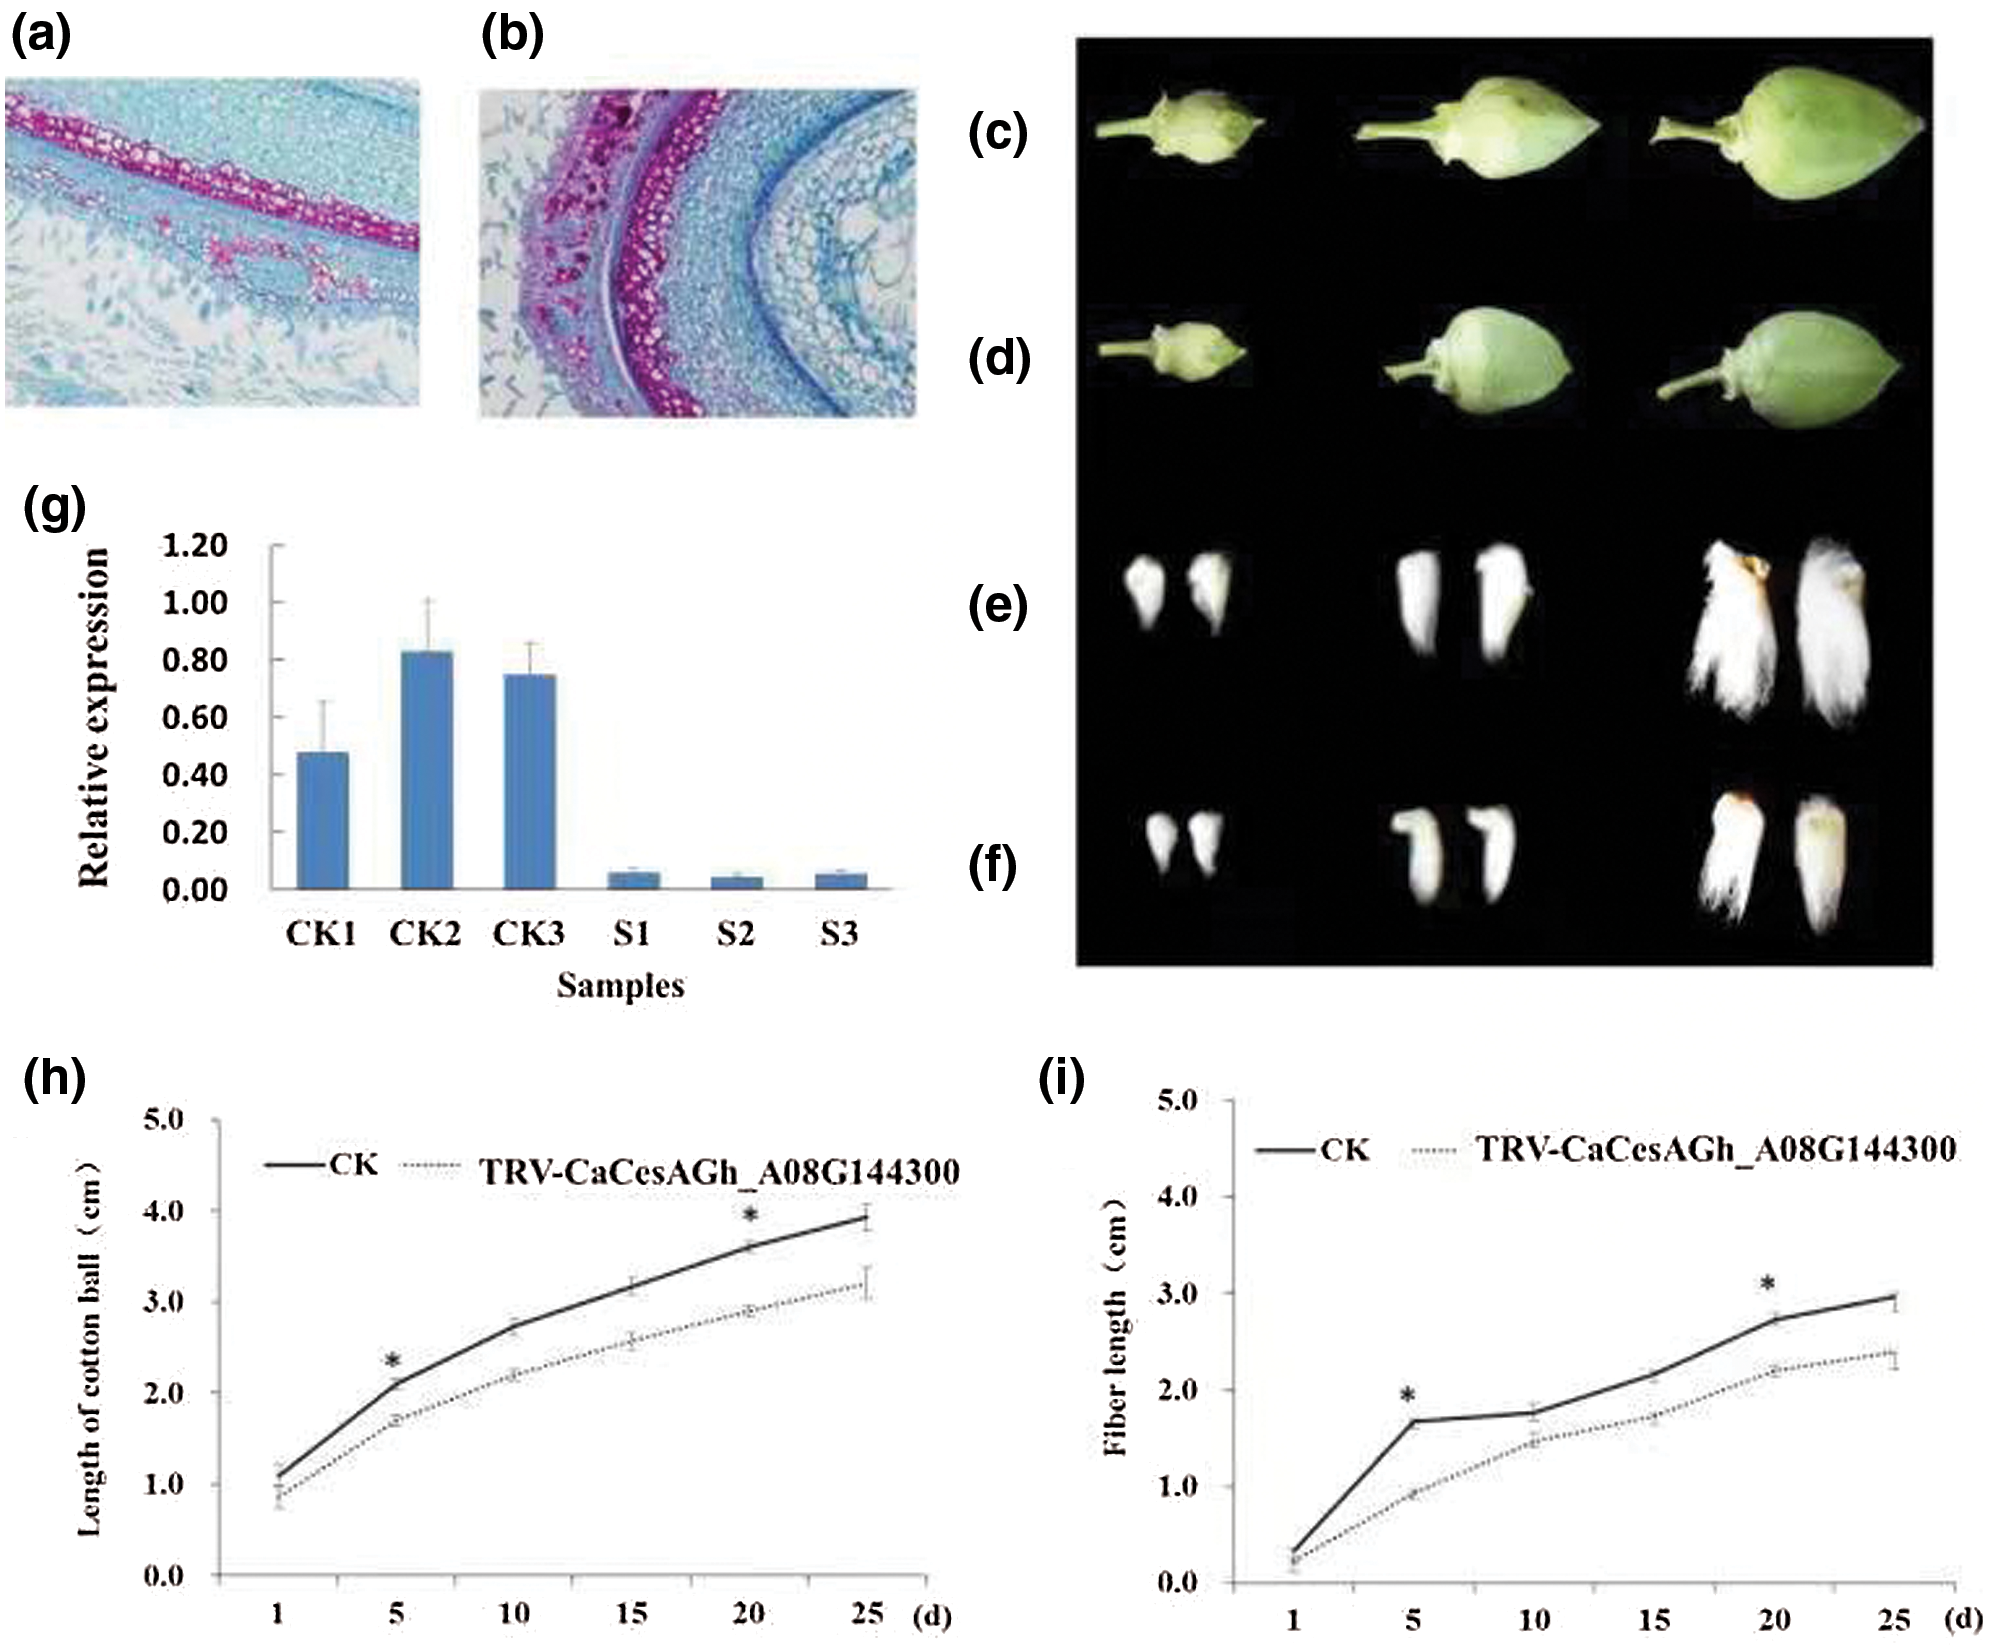
Figure 5: Functional analysis of Gh_A08G144300. a, The results of Paraffin section of normal cells of three days. b, Paraffin section results of gene silencing (Gh_A08G144300) cells of three days . c, Morphology of normal cotton bolls. From left to right are 5, 10 and 15 days of cotton bolls, respectively. d, Morphology of gene-silenced (Gh_A08G144300) cotton bolls. From left to right are 5, 10 and 15 days of cotton bolls, respectively. e, The length of normal cotton fiber. From left to right are 5, 10 and 15 days of cotton bolls, respectively. f, The cotton fiber length of gene-silenced (Gh_A08G144300) plants was obviously shorter than that of normal plants. From left to right are 5, 10 and 15 days of cotton bolls, respectively. g,Gene expression analysis in gene-silenced plants and normal plants. CK1, CK2 and CK3 represent three normal plants, and S1, S2 and S3 represent three gene-silenced plants of Gh_A08G144300. h, Length analysis of cotton boll observed in gene-silenced plants. *represents the significant difference. i, Fiber length analysis of gene-silenced plants. *represents the significant difference.
Cotton is a highly valuable resource plant species. Improving the yield and quality of its fibers is one of the essential issues in the field of cotton breeding. In recent years, gradual improvements in technology have resulted in substantial progress in the study of developmental mechanisms for cotton fibers (Kim et al., 2015; Shan et al., 2014; Zou et al., 2016). This has been made possible by new technologies such as RNA-Seq and metabonomics, which enable studies of the regulation of transcriptomes, proteomes, metabolomes and transcription and translation. The mechanism of cotton fiber development has been analysed from many different perspectives (He et al., 2021; Zhang et al., 2015), and a large number of fiber-related genes have been identified (Wan et al., 2016; Wu et al., 2018).
In this study, we used the transcriptome and metabolome to investigate the regulatory mechanism of fiber development, and 321 metabolites were obtained, from which one gene, Gh_A08G144300, belonging to the CesA gene family, was selected for its specific functions. Previous studies have reported that the CesA gene family is an essential component of cellulose synthase and is simultaneously directly responsible for the process of cotton fiber. In this study, we analysed the cotton fiber transcriptome and found that CesA genes are widely involved in the process of cotton fiber development. We also identified other CesA genes in cotton (G. hirsutum) and selected Gh_A08G144300 as the target gene to investigate the specific functions.
We constructed Gh_A08G144300 gene interference vectors and found that the length of fibers of TRV-CesA Gh_A08G144300 knockout strains were significantly reduced compared with those of the TRV control group. The fiber length visually appears significantly shorter. Similar results have been observed in other species; for example, when the CesA gene is mutated in Arabidopsis (Burton et al., 2006; Desprez et al., 2007), the synthesis of cellulose is hindered, which leads to a decrease in the thickness of the cell wall, causing a series of changes in cell morphology. This could result in a new perspective on the study of signalling pathways of Gh_A08G144300. In addition, the Gh_A08G144300 gene was found to be highly expressed in the fiber. Correlation network analysis showed that the two genes may interact with each other to regulate fiber development (Fig. 4c). In silencing plants (Gh_A08G144300), cell volume and number and the fiber length were significantly reduced, which implies that this gene play a vital role in fiber growth. This was not reported before. We will present an advanced analysis of their detailed functions in a future report. Generally, this study would provide more valuable information for the future research of cotton fiber development.
In this study, the transcriptome and metabolome were both used to identify the function of CesA genes, and the function of the representative gene Gh_A08G144300 was investigated. The target gene Gh_A08G144300 plays a vital role in cotton fiber development, as determined by functional analysis, providing insight into the function of CesA genes in cotton. Although we obtained primary functional information on the genes, more experimental and computational evidence is needed to fully elucidate the function of the genes and the process of cotton fiber growth.
We used Gossypium hirsutum (‘TM-1’) as the material, a standard system for genetics provided by the Institute of Cotton Research of Chinese Academy of Agricultural Sciences (Anyang, China). New roots, stems, young leaves, flowers (during the flowering period) and different stages of fibers during development were frozen in liquid nitrogen and stored at –80°C until RNA was extracted for tissue expression analysis. The flowering day of cotton was labeled as 0 day and the next was labeled as 1st day, and so on. Samples of cotton fibers were obtained at the same position of cotton plant depending on the flowering time. The cotton tissues (80 mg leaves or flower tissue) were quickly frozen in liquid nitrogen immediately after collection and ground into fine powder with a mortar and pestle. Then, 1000 μL methanol/acetonitrile/H2O (2:2:1, v/v/v) was prepared and added to the homogenized solution for metabolite extraction before the mixture was centrifuged for 15 min (14000 g, 4°C). The supernatant was dried in a vacuum centrifuge. For LC–MS analysis, the samples were redissolved in 100 μL acetonitrile/water (1:1, v/v) solvent. Three replications were performed for the transcriptome and metabolome analysis.
Analyses were performed using an UHPLC (1290 Infinity LC, Agilent Technologies) coupled to a quadrupole time-of-flight (AB Sciex TripleTOF 6600) at Shanghai Applied Protein Technology Co., Ltd. For HILIC separation, samples were analysed using a 2.1 mm × 100 mm ACQUIY UPLC BEH 1.7 μm column (Waters, Ireland). In both ESI positive and negative modes, the mobile phase contained A = 25 mM ammonium acetate and 25 mM ammonium hydroxide in water and B = acetonitrile. The gradient was 85% B for 1 min and was linearly reduced to 65% in 11 min, reduced to 40% in 0.1 min and kept for 4 min, and then increased to 85% in 0.1 min, with a 5 min re-equilibration period employed. For RPLC separation, a 2.1 mm × 100 mm ACQUIY UPLC HSS T3 1.8 μm column (Waters, Ireland) was used. In ESI positive mode, the mobile phase contained A = water with 0.1% formic acid and B = acetonitrile with 0.1% formic acid; in ESI negative mode, the mobile phase contained A = 0.5 mM ammonium fluoride in water and B = acetonitrile. The gradient was 1% B for 1.5 min and was linearly increased to 99% in 11.5 min and kept for 3.5 min. It was then reduced to 1% in 0.1 min, and a 3.4 min re-equilibration period was employed. The gradients were at a flow rate of 0.3 mL/min, and the column temperatures were kept constant at 25°C. A 2 μL aliquot of each sample was injected.
The ESI source conditions were set as follows: Ion Source Gas1 (Gas1) as 60, Ion Source Gas2 (Gas2) as 60, curtain gas (CUR) as 30, source temperature: 600°C, and IonSpray Voltage Floating (ISVF) ± 5500 V. In MS only acquisition, the instrument was set to acquire over the m/z range 60–1000 Da, and the accumulation time for TOF MS scan was set at 0.20 s/spectra. In auto MS/MS acquisition, the instrument was set to acquire over the m/z range of 25–1000 Da, and the accumulation time for the product ion scan was set at 0.05 s/spectra. The product ion scan was acquired using information-dependent acquisition (IDA) with high sensitivity mode selected. The parameters were set as follows: the collision energy (CE) was fixed at 35 V with ± 15 eV; declustering potential (DP), 60 V (+) and −60 V (−); excluding isotopes within 4 Da, candidate ions to monitor per cycle: 10.
The raw MS data (wiff.scan files) were converted into MzXML files by using roteoWizard MSConvert before they were imported into freely available XCMS software (Tautenhahn et al., 2012). For metabolite peak picking, the following parameters were used: centWave m/z = 25 ppm, peak width = c (10, 60) and prefilter = c (10, 100). For peak grouping, bw = 5, mzwid = 0.025 and minfrac = 0.5 were used. CAMERA (Collection of Algorithms of MEtabolite pRofile Annotation) was used for annotation of isotopes and adducts. In the extracted ion features, only the variables having more than 50% of the nonzero measurement values in at least one group were kept. Compound identification of metabolites was performed by comparing the accuracy m/z value (<25 ppm) and MS/MS spectra with an in-house database established with available authentic standards.
After normalization to the total peak intensity, the processed data were analysed using the R package ropls and subjected to multivariate data analysis, including Pareto-scaled principal component analysis (PCA) and orthogonal partial least-squares discriminant analysis (OPLS-DA). Sevenfold cross-validation and response permutation testing were used to evaluate the robustness of the model. The variable importance in the projection (VIP) value of each variable in the OPLS-DA model was calculated to indicate its contribution to the classification. Metabolites with a VIP value > 1 were further applied to Student’s t-test at the univariate level to measure the significance of each metabolite, and P values less than 0.05 were considered statistically significant.
Data filtration and blat analysis of transcriptome sequencing
Sequencing data were retained by removing the reads with adaptations and low quality, which would cause great interference to the subsequent information analysis, and the filter criteria were as follows: a) remove the sequences with adapters at the 3’ end using the CutAdapt tool; b) remove the reads with an average mass score below Q20. Upgraded TopHat2 HISAT2 (http://ccb.jhu.edu/software/hisat2/index.shtml) software was used to blast the filtered reads onto the reference genome. HISAT2 uses an improved BWT algorithm (Siren et al., 2014) to achieve faster speeds and a lower resource footprint. For HisAT2 alignment, default parameters are used for nonstrand-specific libraries, which need to specify the library type (i.e., first use--RNA-Strandness RF, second use--RNA-Strandness FR). If the reference genome is selected properly and there is no pollution in the relevant experiments, the mapping ratio of the sequencing sequence is generally higher than 70%. The reasons for the low mapping ratio may be as follows: 1) The reference genome was poorly assembled, or the species tested had a distant relationship with the reference genome; 2) The special pretreatment of the sample or the variation of the sample itself was too large relative to the reference genome, resulting in a relatively low mapping rate. High-quality assembled TM-1 genome was used as the reference genome in the study (Zhang et al., 2015). We used FPKM value for the Nosrmalization of the expression quantity. We generally consider that genes with the FPKM value > 1 are expressed. This threshold is generally used and is a good indicator of gene expression levels.
Conjoint analysis of transcriptome sequencing and metabolomics
Based on transcriptome sequencing and metabolomics, we first obtained quantitative results and extracted the differentially expressed metabolites and transcripts. We then downloaded the corresponding transcripts of corresponding enzymes from the KEGG database (https://www.kegg.jp/dbget-bin/www_bfind?compound). The metabolites and related transcripts were then mapped onto corresponding metabolic pathways.
To determine the relationship between different metabolites and related enzymes in the KEGG database (P < 0.05), we first obtained relevant information on metabolites and transcripts. For metabolites, we obtained information from the small molecule database of KEGG (https://www.kegg.jp/dbget-bin/www_bfind?compound). For each transcript, additional annotation information can be obtained by searching their homologous genes in the KEGG database (https://www.kegg.jp/kegg/ko.html).
The cotton plant was split into several parts, including the root, shoot, leaves, flowers and fibers. Fibers were also collected at different stages (5, 10, 15, 20 and 25DPA) after flowering. Each fiber sample was taken from bolls in the same position on the plant. The RNA was extracted separately. A quantitative real-time PCR experiment was conducted using TIANGEN RealUniversal Colour PreMix (SYBR Green) (QKD-201, Tiangen Biotech, Beijing, China) following the manufacturer’s instructions. GhHistone3 was used as the reference gene. A total of 50 μL reaction solution was used, which included 10 ng of cNDA, 0.4 μL of forward primer, 0.4 μL of reverse primer, 10 μL of qPCR supremix and ddH2O. Primer sequences of Gh_A08G144300 (forward primer: GTGCATTTCCTGTCTGCCGC; reverse primer: ATCAGCATCACCATCCTCTTCTC) were designed using an online program (NCBI). The relative expression of target Gh_A08G144300 was obtained with the 2−ΔΔCT method (Eid et al., 2009).
Three-day-old cotton fibers were fixed in a fixing solution that contained 4% FAA (formaldehyde-glacial acetic acid-absolute ethanol) for 24 h, dried under vacuum and then incubated overnight at 4°C. The samples were dehydrated using a series of gradient concentrations of ethanol (50%, 70%, 85%, 95% and 100%); samples were soaked in each gradient for 30 min. The soaked tissues were embedded in liquid paraffin and then cooled at –20°C. The samples were cut into 4 μm-thick sections with a paraffin section base. The sections were suspended in a 40°C water bath to flatten them before their placement on a glass slide. They were completely dried overnight at 37°C. The sections were then stained with safranin and Fast Green and photographed with a digital camera under a microscope.
Virus-induced gene silencing (VIGS) experiments
Full-length Gh_A08G144300 was amplified from G. hirsutum (‘TM-1’) cDNA. The EcoRI and KpnI sites of pTRV:RNA2 were used as cloning sites, and the target sequences were inserted. The recombinant vectors were transformed into Agrobacterium GV3101 competent cells following the manufacturer’s instructions. The Agrobacterium transformant was cultivated in liquid Luria-Bertani (LB) medium containing 25 μg/mL rifampicin to an OD600 from 1.8 to 2.2. The OD600 of the medium was adjusted to 1.5 using buffer that contained 0.5 mol/L MES, 200 mmol/L acetosyringone and 1.0 mol/L MgCl2 for transfection. Liquid medium containing pTRV:RNA2-Gh_A08G144300 and pTRV:RNA2 was mixed with pTRV at an equimolar ratio. They were then injected into cotton cotyledons at the three-leaf stage. Each group had 10 replications. The cotton plants were exposed to negative pressure and subsequently grown in the dark for 48 h. The plants were then moved to a greenhouse and grown under a 16-hour photoperiod for 30 days. Finally, they were grown under an 8-hour photoperiod to trigger the differentiation of flower buds.
Acknowledgement: The authors appreciate Personalbio’s data analyses.
Availability of Data: The raw sequence data of RNA-Seq were submitted to NCBI with an accession number of GSE 182982.
Author Contributions: Conceived and designed the experiments: Z.C., G.S. and Q.Z. Performed the experiments: Z.C. Analysed the data and wrote the paper: Z.C.
Funding Statement: This project was supported by the Special Fund for Modern Agriculture of Jiangxi Province (JXARS-22) and Science and Technology Research Project of Education Department of Jiangxi Province (181366).
Conflicts of Interests: The authors declare that they have no conflicts of interest to report regarding the present study.
Burton RA, Wilson SM, Hrmova M, Harvey AJ, Shirley NJ et al. (2006). Cellulose synthase-like CslF genes mediate the synthesis of cell wall (1,3;1,4)-beta-D-glucans. Science 311: 1940–1942. DOI 10.1126/science.1122975. [Google Scholar] [CrossRef]
Chaudhary J, Patil GB, Sonah H, Deshmukh RK, Vuong TD et al. (2015). Expanding omics resources for improvement of soybean seed composition traits. Frontiers in Plant Science 6: 1021. DOI 10.3389/fpls.2015.01021. [Google Scholar] [CrossRef]
Chen Q, Chen QJ, Sun GQ, Zheng K, Yao ZP et al. (2019). Genome-wide identification of cyclophilin gene family in cotton and expression analysis of the fibre development in Gossypium barbadense. International Journal of Molecular Sciences 20: 2. DOI 10.3390/ijms20020349. [Google Scholar] [CrossRef]
Deshmukh R, Sonah H, Patil G, Chen W, Prince S et al. (2014). Integrating omic approaches for abiotic stress tolerance in soybean. Frontiers in Plant Science 5: 244. DOI 10.3389/fpls.2014.00244. [Google Scholar] [CrossRef]
Desprez T, Juraniec M, Crowell EF, Jouy H, Pochylova Z et al. (2007). Organization of cellulose synthase complexes involved in primary cell wall synthesis in Arabidopsis thaliana. Proceedings of the National Academy of Sciences of the United States of America 104: 15572–15577. DOI 10.1073/pnas.0706569104. [Google Scholar] [CrossRef]
Eid J, Fehr A, Gray J, Luong K, Lyle J et al. (2009). Real-time DNA sequencing from single polymerase molecules. Science 323: 133–138. DOI 10.1126/science.1162986. [Google Scholar] [CrossRef]
Goodwin S, McPherson JD, McCombie WR (2016). Coming of age: Ten years of next-generation sequencing technologies. Nature Reviews Genetics 17: 333–351. DOI 10.1038/nrg.2016.49. [Google Scholar] [CrossRef]
Gou JY, Wang LJ, Chen SP, Hu WL, Chen XY (2007). Gene expression and metabolite profiles of cotton fiber during cell elongation and secondary cell wall synthesis. Cell Research 17: 422–434. DOI 10.1038/sj.cr.7310150. [Google Scholar] [CrossRef]
Hande AS, Katageri IS, Jadhav MP, Adiger S, Gamanagatti S et al. (2017). Transcript profiling of genes expressed during fibre development in diploid cotton (Gossypium arboreum L.). BMC Genomics 18: 675. DOI 10.1186/s12864-017-4066-y. [Google Scholar] [CrossRef]
He SP, Sun GF, Geng XL, Gong WF, Dai PH et al. (2021). The genomic basis of geographic differentiation and fiber improvement in cultivated cotton. Nature Genetics 53: 916. DOI 10.1038/s41588-021-00844-9. [Google Scholar] [CrossRef]
Hu Y, Chen J, Fang L, Zhang Z, Ma W et al. (2019). Gossypium barbadense and Gossypium hirsutum genomes provide insights into the origin and evolution of allotetraploid cotton. Nature Genetics 51: 739–748. DOI 10.1038/s41588-019-0371-5. [Google Scholar] [CrossRef]
Huang JP, Fang C, Ma X, Wang L, Yang J et al. (2019). Tropane alkaloids biosynthesis involves an unusual type III polyketide synthase and non-enzymatic condensation. Nature Communications 10: 4036. DOI 10.1038/s41467-019-11987-z. [Google Scholar] [CrossRef]
Kawahara Y, Bastide M, Hamilton JP, Kanamori H, McCombie WR et al. (2013). Improvement of the Oryza sativa Nipponbare reference genome using next generation sequence and optical map data. Rice 6: 4. DOI 10.1186/1939-8433-6-4. [Google Scholar] [CrossRef]
Kim HJ, Hinchliffe DJ, Triplett BA, Chen ZJ, Stelly DM et al. (2015). Phytohormonal networks promote differentiation of fiber initials on pre-anthesis cotton ovules grown in vitro and in planta. PLoS One 10: e0125046. DOI 10.1371/journal.pone.0125046. [Google Scholar] [CrossRef]
Krakhmalev VA, Zakirov TA (2000). In vivo observations on the structure and growth of cotton ovule hairs. Russian Journal of Plant Physiology 47: 249–255. [Google Scholar]
Li A, Xia T, Xu W, Chen TT, Li XL et al. (2013). An integrative analysis of four CESA isoforms specific for fiber cellulose production between Gossypium hirsutum and Gossypium barbadense. Planta 237: 1585–1597. DOI 10.1007/s00425-013-1868-2. [Google Scholar] [CrossRef]
Li PT, Wang M, Lu QW, Ge Q, Rashid MH et al. (2017). Comparative transcriptome analysis of cotton fiber development of Upland cotton (Gossypium hirsutum) and Chromosome Segment Substitution Lines from G. hirsutum x G. barbadense. BMC Genomics 18: 705. DOI 10.1186/s12864-017-4077-8. [Google Scholar] [CrossRef]
Loraine AE, McCormick S, Estrada A, Patel K, Qin P (2013). RNA-seq of Arabidopsis pollen uncovers novel transcription and alternative splicing. Plant Physiology 162: 1092–1109. DOI 10.1104/pp.112.211441. [Google Scholar] [CrossRef]
Lou Q, Liu YL, Qi YY, Jiao SZ, Tian FF et al. (2014). Transcriptome sequencing and metabolite analysis reveals the role of delphinidin metabolism in flower colour in grape hyacinth. Journal of Experimental Botany 65: 3157–3164. DOI 10.1093/jxb/eru168. [Google Scholar] [CrossRef]
Moreno-Risueno MA, Busch W, Benfey PN (2010). Omics meet networks-using systems approaches to infer regulatory networks in plants. Current Opinion in Plant Biology 13: 126–131. DOI 10.1016/j.pbi.2009.11.005. [Google Scholar] [CrossRef]
Poppenberger B, Rozhon W, Khan M, Husar S, Adam G et al. (2011). CESTA, a positive regulator of brassinosteroid biosynthesis. Embo Journal 30: 1149–1161. DOI 10.1038/emboj.2011.35. [Google Scholar] [CrossRef]
Rai A, Saito K, Yamazaki M (2017). Integrated omics analysis of specialized metabolism in medicinal plants. Plant Journal 90: 764–787. DOI 10.1111/tpj.13485. [Google Scholar] [CrossRef]
Rai A, Yamazaki M, Takahashi H, Nakamura M, Kojoma M et al. (2016). RNA-seq transcriptome analysis of Panax japonicus, and its comparison with other Panax species to identify potential genes involved in the saponins biosynthesis. Frontiers in Plant Science 7: e0144. DOI 10.3389/fpls.2016.00481. [Google Scholar] [CrossRef]
Riano-Pachon DM, Nagel A, Neigenfind J, Wagner R, Basekow R et al. (2009). GabiPD: the GABI primary database--A plant integrative ‘omics’ database. Nucleic Acids Research 37: D954–959. DOI 10.1093/nar/gkn611. [Google Scholar] [CrossRef]
Shan CM, Shangguan XX, Zhao B, Zhang XF, Chao LM et al. (2014). Control of cotton fibre elongation by a homeodomain transcription factor GhHOX3. Nature Communications 5: 5519. DOI 10.1038/ncomms6519. [Google Scholar] [CrossRef]
Shen Q, Fu L, Dai F, Jiang L, Zhang G et al. (2016). Multi-omics analysis reveals molecular mechanisms of shoot adaption to salt stress in Tibetan wild barley. BMC Genomics 17: 889. DOI 10.1186/s12864-016-3242-9. [Google Scholar] [CrossRef]
Shi YH, Zhu SW, Mao XZ, Feng JX, Qin YM et al. (2006). Transcriptome profiling, molecular biological, and physiological studies reveal a major role for ethylene in cotton fiber cell elongation. Plant Cell 18: 651–664. DOI 10.1105/tpc.105.040303. [Google Scholar] [CrossRef]
Siren J, Valimaki N, Makinen V (2014). Indexing graphs for path queries with applications in genome research. IEEE/ACM Transactions on Computational Biology and Bioinformatics 11: 375–388. DOI 10.1109/TCBB.2013.2297101. [Google Scholar] [CrossRef]
Tautenhahn R, Patti GJ, Rinehart D, Siuzdak G (2012). XCMS online: A web-based platform to process untargeted metabolomic data. Analytical Chemistry 84: 5035–5039. DOI 10.1021/ac300698c. [Google Scholar] [CrossRef]
Updegraff DM (1969). Semimicro determination of cellulose in biological materials. Analytica Biochemistry 32: 420–424. DOI 10.1016/S0003-2697(69)80009-6. [Google Scholar] [CrossRef]
Wan Q, Guan XY, Yang NN, Wu HT, Pan MQ et al. (2016). Small interfering RNAs from bidirectional transcripts of GhMML3_A12 regulate cotton fiber development. New Phytologist 210: 1298–1310. DOI 10.1111/nph.13860. [Google Scholar] [CrossRef]
Wang H, Zhang Y, Zhou W, Noppol L, Liu T (2018). Mechanism and enhancement of lipid accumulation in filamentous oleaginous microalgae Tribonema minus under heterotrophic condition. Biotechnology for Biofuels 11: 328. DOI 10.1186/s13068-018-1329-z. [Google Scholar] [CrossRef]
Wang L, Yu S, Tong C, Zhao Y, Liu Y et al. (2014). Genome sequencing of the high oil crop sesame provides insight into oil biosynthesis. Genome Biology 15: R39. DOI 10.1186/gb-2014-15-2-r39. [Google Scholar] [CrossRef]
Wu C, Jia L, Goggin F (2011). The reliability of virus-induced gene silencing experiments using tobacco rattle virus in tomato is influenced by the size of the vector control. Molecular Plant Pathology 12: 299–305. DOI 10.1111/j.1364-3703.2010.00669.x. [Google Scholar] [CrossRef]
Wu HT, Tian Y, Wan Q, Fang L, Guan XY et al. (2018). Genetics and evolution of MIXTA genes regulating cotton lint fiber development. New Phytologist 217: 883–895. DOI 10.1111/nph.14844. [Google Scholar] [CrossRef]
Yuan D, Tang Z, Wang M, Gao W, Tu L et al. (2015). The genome sequence of Sea-Island cotton (Gossypium barbadense) provides insights into the allopolyploidization and development of superior spinnable fibres. Scientific Reports 5: 17662. DOI 10.1038/srep17662. [Google Scholar] [CrossRef]
Zhang SJ, Jiang ZX, Chen J, Han ZF, Chi JA et al. (2021). The cellulose synthase (CesA) gene family in four Gossypium species: Phylogenetics, sequence variation and gene expression in relation to fiber quality in Upland cotton. Molecular Genetics and Genomics 296: 355–368. DOI 10.1007/s00438-020-01758-7. [Google Scholar] [CrossRef]
Zhang T, Hu Y, Jiang W, Fang L, Guan X et al. (2015). Sequencing of allotetraploid cotton (Gossypium hirsutum L. acc. TM-1) provides a resource for fiber improvement. Nature Biotechnology 33: 531–537. DOI 10.1038/nbt.3207. [Google Scholar] [CrossRef]
Zou C, Wang Q, Lu C, Yang W, Zhang Y et al. (2016). Transcriptome analysis reveals long noncoding RNAs involved in fiber development in cotton (Gossypium arboreum). Science China-Life Sciences 59: 164–171. DOI 10.1007/s11427-016-5000-2. [Google Scholar] [CrossRef]
Supplementary Materials
Supplementary Table 1 Information of important metabolics obtained
Supplementary Table 2 The evaluation parameter for OPLS-DA model
Supplementary Table 3 4CesA genes were obtained from transcriptome data
Supplementary Table 4 Metabolites and corresponding genes with pos-model
Supplementary Table 5 Metabolites and corresponding genes with neg-model
Supplementary Table 6 Metabolites and corresponding genes with pos-model
Supplementary Table 7 Metabolites and corresponding genes with neg-model
 | This work is licensed under a Creative Commons Attribution 4.0 International License, which permits unrestricted use, distribution, and reproduction in any medium, provided the original work is properly cited. |