DOI:10.32604/biocell.2022.019300
| BIOCELL DOI:10.32604/biocell.2022.019300 | |
| Article |
An integrated bioinformatics analysis and experimental study identified key biomarkers CD300A or CXCL1, pathways and immune infiltration in diabetic nephropathy mice
1Division of Nephrology, Renmin Hospital of Wuhan University, Wuhan, China
2Nephrology and Urology Research Institute of Wuhan University, Wuhan, China
3The First College of Clinical Medical Science, China Three Gorges University, Yichang, China
4Department of Engineering Structure and Mechanics, Wuhan University of Technology, Wuhan, China
5School of Life Science and Engineering, Southwest Jiaotong University, Chengdu, 610000, China
*Address correspondence to: Wei Liang, liangweiwhu@gmail.com
#Qiang Luo and Zongwei Zhang contribute equally to the study
Received: 24 September 2021; Accepted: 05 January 2022
Abstract: Diabetic nephropathy (DN) is a common microvascular complication that easily leads to end-stage renal disease. It is important to explore the key biomarkers and molecular mechanisms relevant to diabetic nephropathy (DN). We used high-throughput RNA sequencing to obtain the genes related to DN glomerular tissues and healthy glomerular tissues of mice. Then we used LIMMA to analyze differentially expressed genes (DEGs) between DN and non-diabetic glomerular samples. And we performed KEGG, gene ontology functional (GO) enrichment, and gene set enrichment analysis to reveal the signaling pathway of the disease. The CIBERSORT algorithm based on support vector machine was used to determine the immune infiltration score. Random forest algorithm and Cytoscape obtained hub genes. Finally, we applied co-staining, immunohistochemical staining, RT-qPCR and western blotting to validate the protein and mRNA expression of both hub genes. We obtained 913 DEGs mainly related to inflammatory factors and immunity. GSEA results showed that differential genes were mainly enriched in IL-17 signaling pathway, lipid and atherosclerosis, rheumatoid arthritis, TNF signaling pathway, neutrophil extracellular trap formation, Staphylococcus aureus infection and other pathways. The intersection of the random forest algorithm and Cytoscape revealed both hub genes of CD300A and CXCL1. Experiments have shown that the both key genes of CD300A and CXCL1 shown increased expression in glomerular podocytes, and are related to the inflammation of diabetic nephropathy. And immunohistochemical staining and RT-qPCR further confirmed that the protein and mRNA expression level of CD300A or CXCL1 in glomeruli tissue in DN mice were increased. The expression levels of CD300A and CXCL1 increased significantly under HG (high glucose) stimulation, further confirming that diabetes can lead to increased levels of CD300A and CXCL1 at the cellular level. Through bioinformatics analysis, machine learning algorithms, and experimental research, CD300A and CXCL1 are confirmed as both potential biomarkers in diabetic nephropathy. And we further revealed the main pathways of differential genes and the differentially distributed immune infiltrating cells in diabetic nephropathy.
Keywords: Diabetic nephropathy; Immune infiltration; Machine learning; Bioinformatics; Biomarkers
Abbreviations
| AGE: | advanced glycation end |
| AI: | allergic inflammation |
| DEGs: | differentially expressed genes |
| DN: | diabetic nephropathy |
| GO: | gene ontology |
| GSEA: | gene set enrichment analysis |
| HG: | high glucose |
| HPCs: | human podocytes |
| KEGG: | kyoto encyclopedia of genes and genomes |
| PPI: | protein-protein interaction |
| qRT-PCR: | real-time quantitative PCR |
| RF: | random forest |
Diabetes is a chronic metabolic disorder characterized by hyperglycemia. It affects the kidneys and tubules, leading to debilitating end-stage renal disease and diabetic nephropathy (DN) (Bonnet and Scheen, 2018; Maiti, 2021; Cefalu et al., 2016). Diabetes, characteristic of high blood sugar, mainly includes type 1, type 2, and monogenic and fibrocalculous pancreatic diabetes (Bloomgarden, 2016; Vendhan et al., 2014). And type 2 diabetes is the most common form of diabetes in humans. Prolonged high blood sugar causes chronic damage to various tissues, especially eyes, kidneys, heart, blood vessels, and nerves. Including “microvascular disease” (small blood vessel damage) and “macrovascular disease” (arterial damage) (Forbes and Cooper, 2013). Diabetic nephropathy (DN) is a microvascular complication that commonly leads to end-stage renal disease and even kidney failure in severe cases. Diabetic nephropathy has a complex pathogenic basis due to various intertwined risk factors. There are no definite drugs and treatments that can prevent diabetic nephropathy. Therefore, it is important to explore the key biomarkers and molecular mechanisms relevant to diabetic nephropathy.
Hypertension and micro-inflammation play an essential role in diabetic nephropathy (Tomino and Gohda, 2015). Inflammatory mediators interact with multiple tissues to promote the development of diabetic complications (Bonnet and Scheen, 2018). Acute inflammation is a component of innate immunity that may promote tissue damage. Studies have found that inflammatory markers increase in diabetic patients to promote the inflammatory microenvironment, in which infiltrating cells and inflammatory cytokines demonstrated an active role (Chow et al., 2004; Russell and Kanthimathinathan, 2018).
Diabetic nephropathy involves inflammatory, genetic, and epigenetic modification. For example, some genetic mutations increase disease risk by regulating B cells and insulin (Dang et al., 2013). In addition, diabetic nephropathy increases advanced glycation end (AGE) products (Stitt et al., 1997; Horie et al., 1997). And studies have shown that its receptors act on pleiotropic transcription factors, leading to pathological changes in gene expression (Ishii et al., 1996). Thus, genetic modifications and signaling pathways affect the progress of diabetic nephropathy.
The leading cause of diabetic nephropathy is glomerular damage. The prominent feature is that collagen in patients with diabetic nephropathy accumulates in the kidney compartment, and renal tubules and glomeruli will be hypertrophy, thickening, and fibrosis (Kato and Natarajan, 2019). The glomerular basement membrane thickens, and the glomerular mesangial area expands during diabetic nephropathy (Ban and Twigg, 2008; Meza et al., 2017). Hyperperfusion and increased internal pressure in the glomerulus lead to the pathogenesis of diabetic nephropathy (Flyvbjerg, 2017). In addition, damaged glomerular mesangium and podocytes produced cytokines to activate immune cells (Elmarakby and Sullivan, 2012). At present, reducing the internal pressure of the glomerulus serves as an effective treatment for diabetic nephropathy. Therefore, studying key glomerular genes and the relevant signaling would be helpful to explore the prognosis and treatment of diabetic nephropathy.
There is a lack of early diagnosis and prevention methods in clinical diabetic nephropathy. Therefore, the paper combines experimental and bioinformatics approaches to study the potential biomarkers and signaling pathways in diabetic nephropathy, providing references for targeted prevention and treatment of diabetic nephropathy.
RNA sequencing of mice glomeruli
24-week-old male db/m mice and db/db mice were randomly selected and sacrificed by cervical dislocation. The mouse kidney was taken out and chopped up, filtered with 100 um, 80 um, and 40 um filters to obtain glomeruli. The kidneys of 9 mice in each group were used to extract glomeruli, and then the glomeruli of 3 mice were mixed as independent samples. The RNA transcriptome sequencing was completed by Myhalic Biotechnological Co., Ltd. (Wuhan, China). Each group sequenced three independent biological replicate samples. The original RNA-seq data and processed data have been uploaded to the GEO database (GSE184836; https://www.ncbi.nlm.nih.gov/geo/; May 2020).
Identification of differentially expressed genes
Differentially expressed genes (DEGs) and data preprocessing between DN and non-diabetic glomerulus were analyzed. Glomerular genes whose expression significantly differed were defined as DEGs and used for further analyses: | log2 (fold change) | >1 and P-value < 0.05. Gene ontology (GO) enrichment analysis of DEGs were carried out by using DAVID (https://david.ncifcrf.gov/; May 2020) online tools. Gene Set Enrichment Analysis (GSEA) was used to screen significantly enriched signalling pathways with appropriate parameters.
DAVID performs gene ontology (GO) and Kyoto Encyclopedia of Genes and Genomes (KEGG) pathway enrichment analysis on differential genes. P < 0.05 was used as the screening condition, and the chord diagram was visually analyzed to display the description of gene function, the pathway and the range of logFC. R program packages such as “clusterProfiler” perform gene set enrichment analysis (GSEA). Mainly study the functionally similar genomes and related signal pathways among different genes.
Analysis of differential genes in the immune microenvironment
The CIBERSORT (https://cibersort.stanford.edu/; May 2020) algorithm analyzes the expression of differential genes in samples. First, we use LM22 cells and 1000 permutations to run the algorithm to infer the composition ratio of immune cells. Then we use the abundance map to visually analyze the proportion of different cells in each sample.
Analysis of protein-protein interaction and key genes
We construct a protein-protein interaction (PPI) network and select genes with a confidence score greater than 0.9. Then, we use String and Cytoscape to screen different genes for hub genes. Finally, we filtered out the top 50 key genes of degree according to degree calculation.
Based on R program packages such as “randomForest” (Le et al., 2017), we performed random forest ensemble learning algorithm analysis on differential genes. The classification is based on whether it is a diabetic complication, the differential gene and the classification are based on this mapping relationship to screen the genes. 50 key genes were screened out according to the MeanDecreaseGini value.
RIPA buffer containing protease and phosphatase inhibitors was used to extract proteins from the separated glomeruli and human podocyte (HPCs). The protein concentration is quantified by BCA determination. Separate equal amounts of protein by 10% SDS-PAGE and transfer to PVDF membrane (Millipore Corp, USA). Incubate the membrane overnight at 4°C with primary antibodies: GAPDH (Proteintech, China, dilution: 1:1000), CXCL1 (Proteintech, China, dilution: 1:1000), CD300A (Proteintech, China, dilution: 1:1000). Then the membrane was incubated with goat anti-mouse/goat anti-rabbit secondary antibody IgG H+L (1:10,000) for 2 h and detected by the Odyssey system (LI-COR Biosciences). All experimental protocols for animal studies were approved by the Animal Care Committee of Wuhan University (Ethical permission number: WDRM20200603).
The paraffin-embedded kidney sections were deparaffinized and sealed. Incubated the section with a mixture of anti-synapsin antibody (1:100, Santa cruz, USA) and anti-CXCL1 antibody (1:100, Proteintech, China) or anti-CD300A antibody (1:100, Proteintech, China) in Overnight at 4°C. Then, the sections were washed 3 times with PBS and incubated with anti-rabbit and anti-mouse fluorescent secondary antibodies (1:200, Thermo Fisher Scientific, USA) for 60 min. The nuclei were counterstained with DAPI (Antgene, China) for 5 min. We observed the glass slide through a microscope (Olympus, Japan).
Real-time quantitative PCR (qRT-PCR)
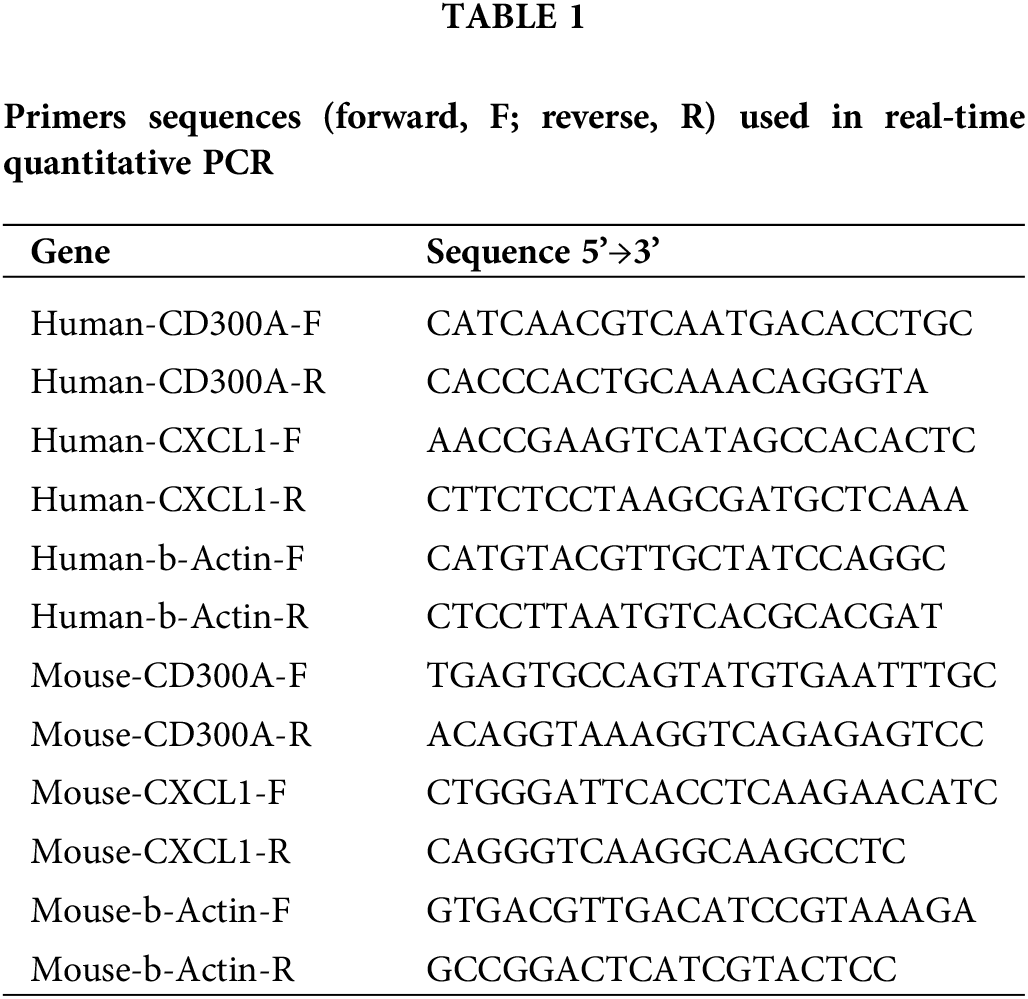
We used Trizol reagent (Takaro, Japan) to extract total RNA from frozen kidney sections or HPC. Then we used RevertAid First Strand cDNA Synthesis Kit (Thermo, USA) to transcribe RNA into cDNA. RT-qPCR was performed by SYBR Green Master Mix (Bio-Rad, USA). The 2-ΔΔCt method was used to normalize relative gene expression to β-actin. The primers were synthesized by Sangon Biotech (Sangon Biotech, China), and the primer sequence is shown in Table 1.
The statistical analysis of this study uses R software (version 3.6.1). Both “clusterProfiler” and “GOplot” were used to identify differential genes’ essential functions and signal pathways (Yu et al., 2012). PPI and random forest were used to distinguish the essential genes in the differential genes, overlapping the hub genes of both methods. The P < 0.05 was considered to be statistically significant. All experiments were repeated at least 3 times. Quantitative data is expressed as mean ± SD, and statistical analysis is performed using Graphpad. The student’s t test was used for statistical comparison of groups.
Differentially expressed genes
Bioinformatics analysis of differential genes between diabetic and non-diabetic glomerular samples was performed after data standardizing (P < 0.01 and |logFC| > 1). The results showed a total of 913 DEGs, including 615 up-regulated genes and 298 down-regulated genes (Fig. 1A). In addition, heat maps represent differential genes, and gene cluster analysis was performed to show the difference in expression of up-regulated and down-regulated genes in different tissue samples (Fig. 1B).
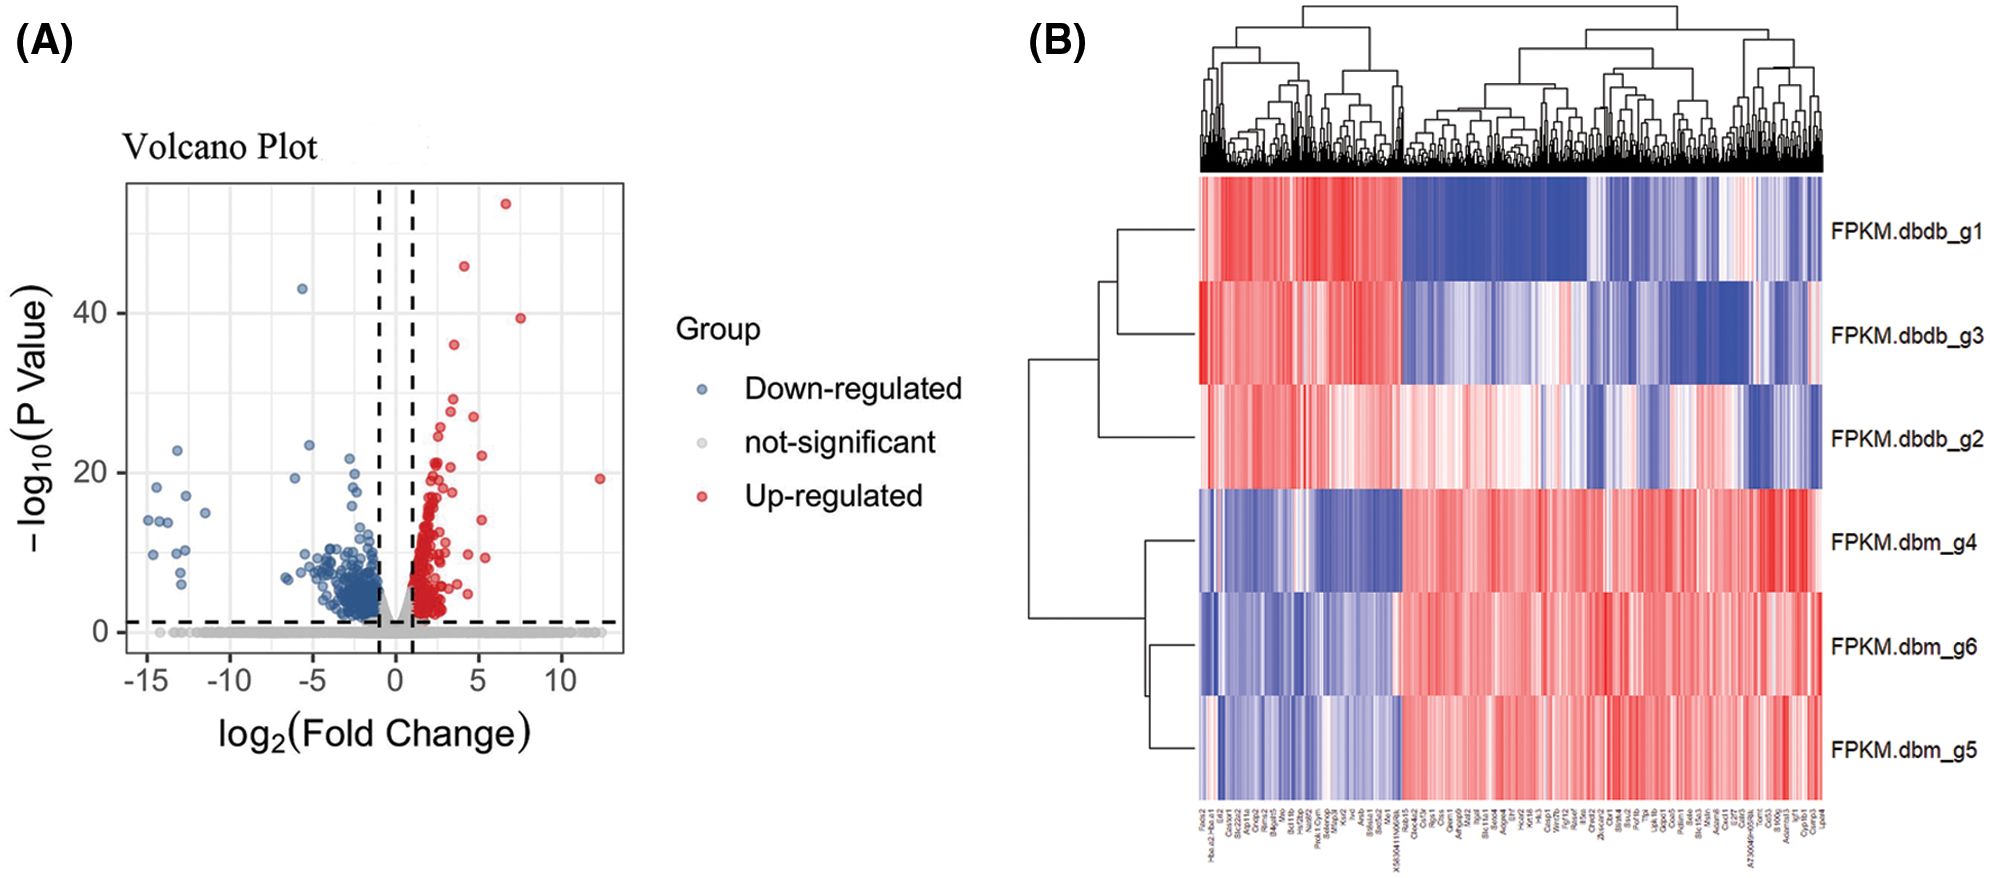
Figure 1: Identification of differential genes. (A) Volcano plot between diabetic and non-diabetic glomeruli. The red node represents the up-regulated DEG, and the green node represents the down-regulated DEG. (|logFC| > 1 and P < 0.05) (B) Heat map of all differential genes. Each row represents a data set, and each column represents a gene. The color changing from blue to red represents a change in the expression of ups and downs.
We further used GSEA to study potential biological processes and pathways. GSEA results showed that differential genes were mainly enriched in IL-17 signaling pathway, lipid and atherosclerosis, rheumatoid arthritis, TNF signaling pathway, neutrophil extracellular trap formation, Staphylococcus aureus infection and other pathways (Figs. 2A and 2B).
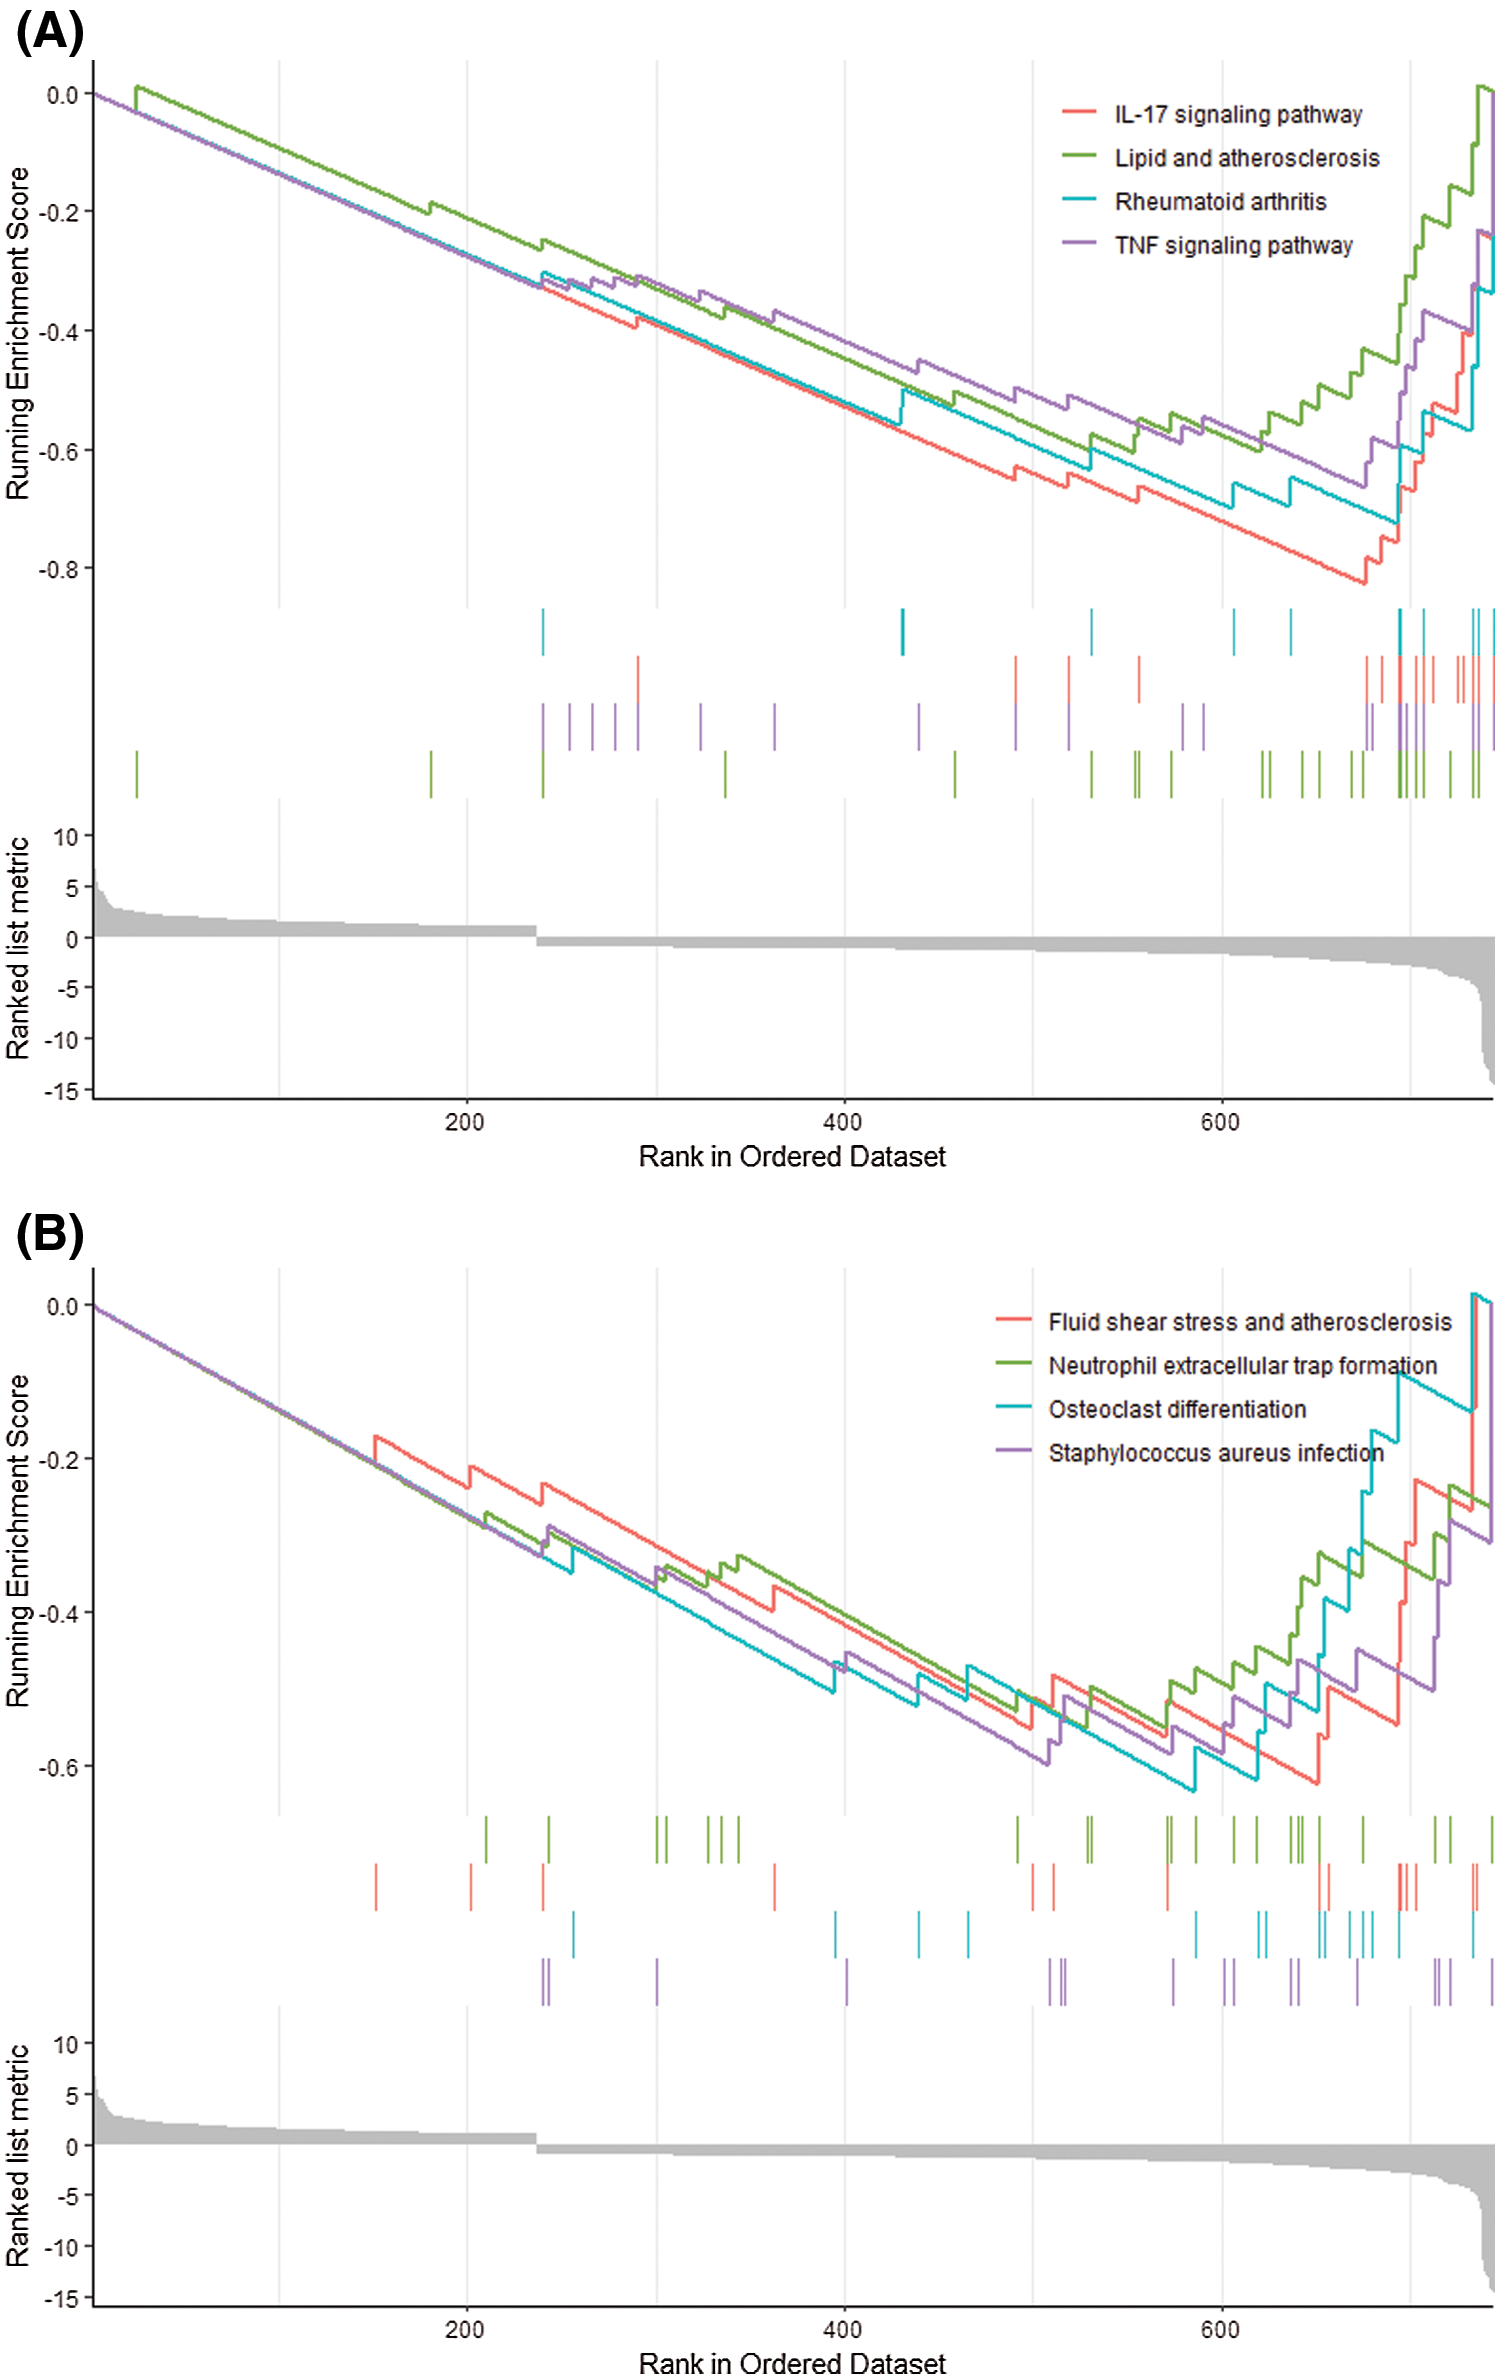
Figure 2: GSEA analysis. (A, B) The expression of DEGs in GSEA results in IL-17 signaling pathway, lipid and atherosclerosis, rheumatoid arthritis, tumor necrosis factor signaling pathway, fluid shear stress and atherosclerosis, medium Extracellular traps of neutrophils, osteoclast differentiation, Staphylococcus aureus infection.
GO and KEGG enrichment analysis
The gene ontology and pathway analysis results showed that the biological processes of 913 differential genes involved chemotaxis, inflammatory response, immune response, etc. (Fig. 3A). The cell components were mainly plasma membrane, extracellular space, extracellular zone, plasma membrane components, cell surface, anchoring components of membrane, extracellular exosomes (Fig. 3B). Molecular functions mainly include chemokine activity, serine endopeptidase activity, chemokine receptor, receptor binding, CXCR chemokine receptor binding, non-transmembrane protein tyrosine kinase activity, cytokine activity, etc. (Fig. 3C). KEGG pathway analysis mainly involves Staphylococcus aureus infection, cytokine-cytokine receptor interaction, complement and coagulation cascade, TNF signaling pathway, neuroactive ligand-receptor interaction, etc. (Fig. 3D).
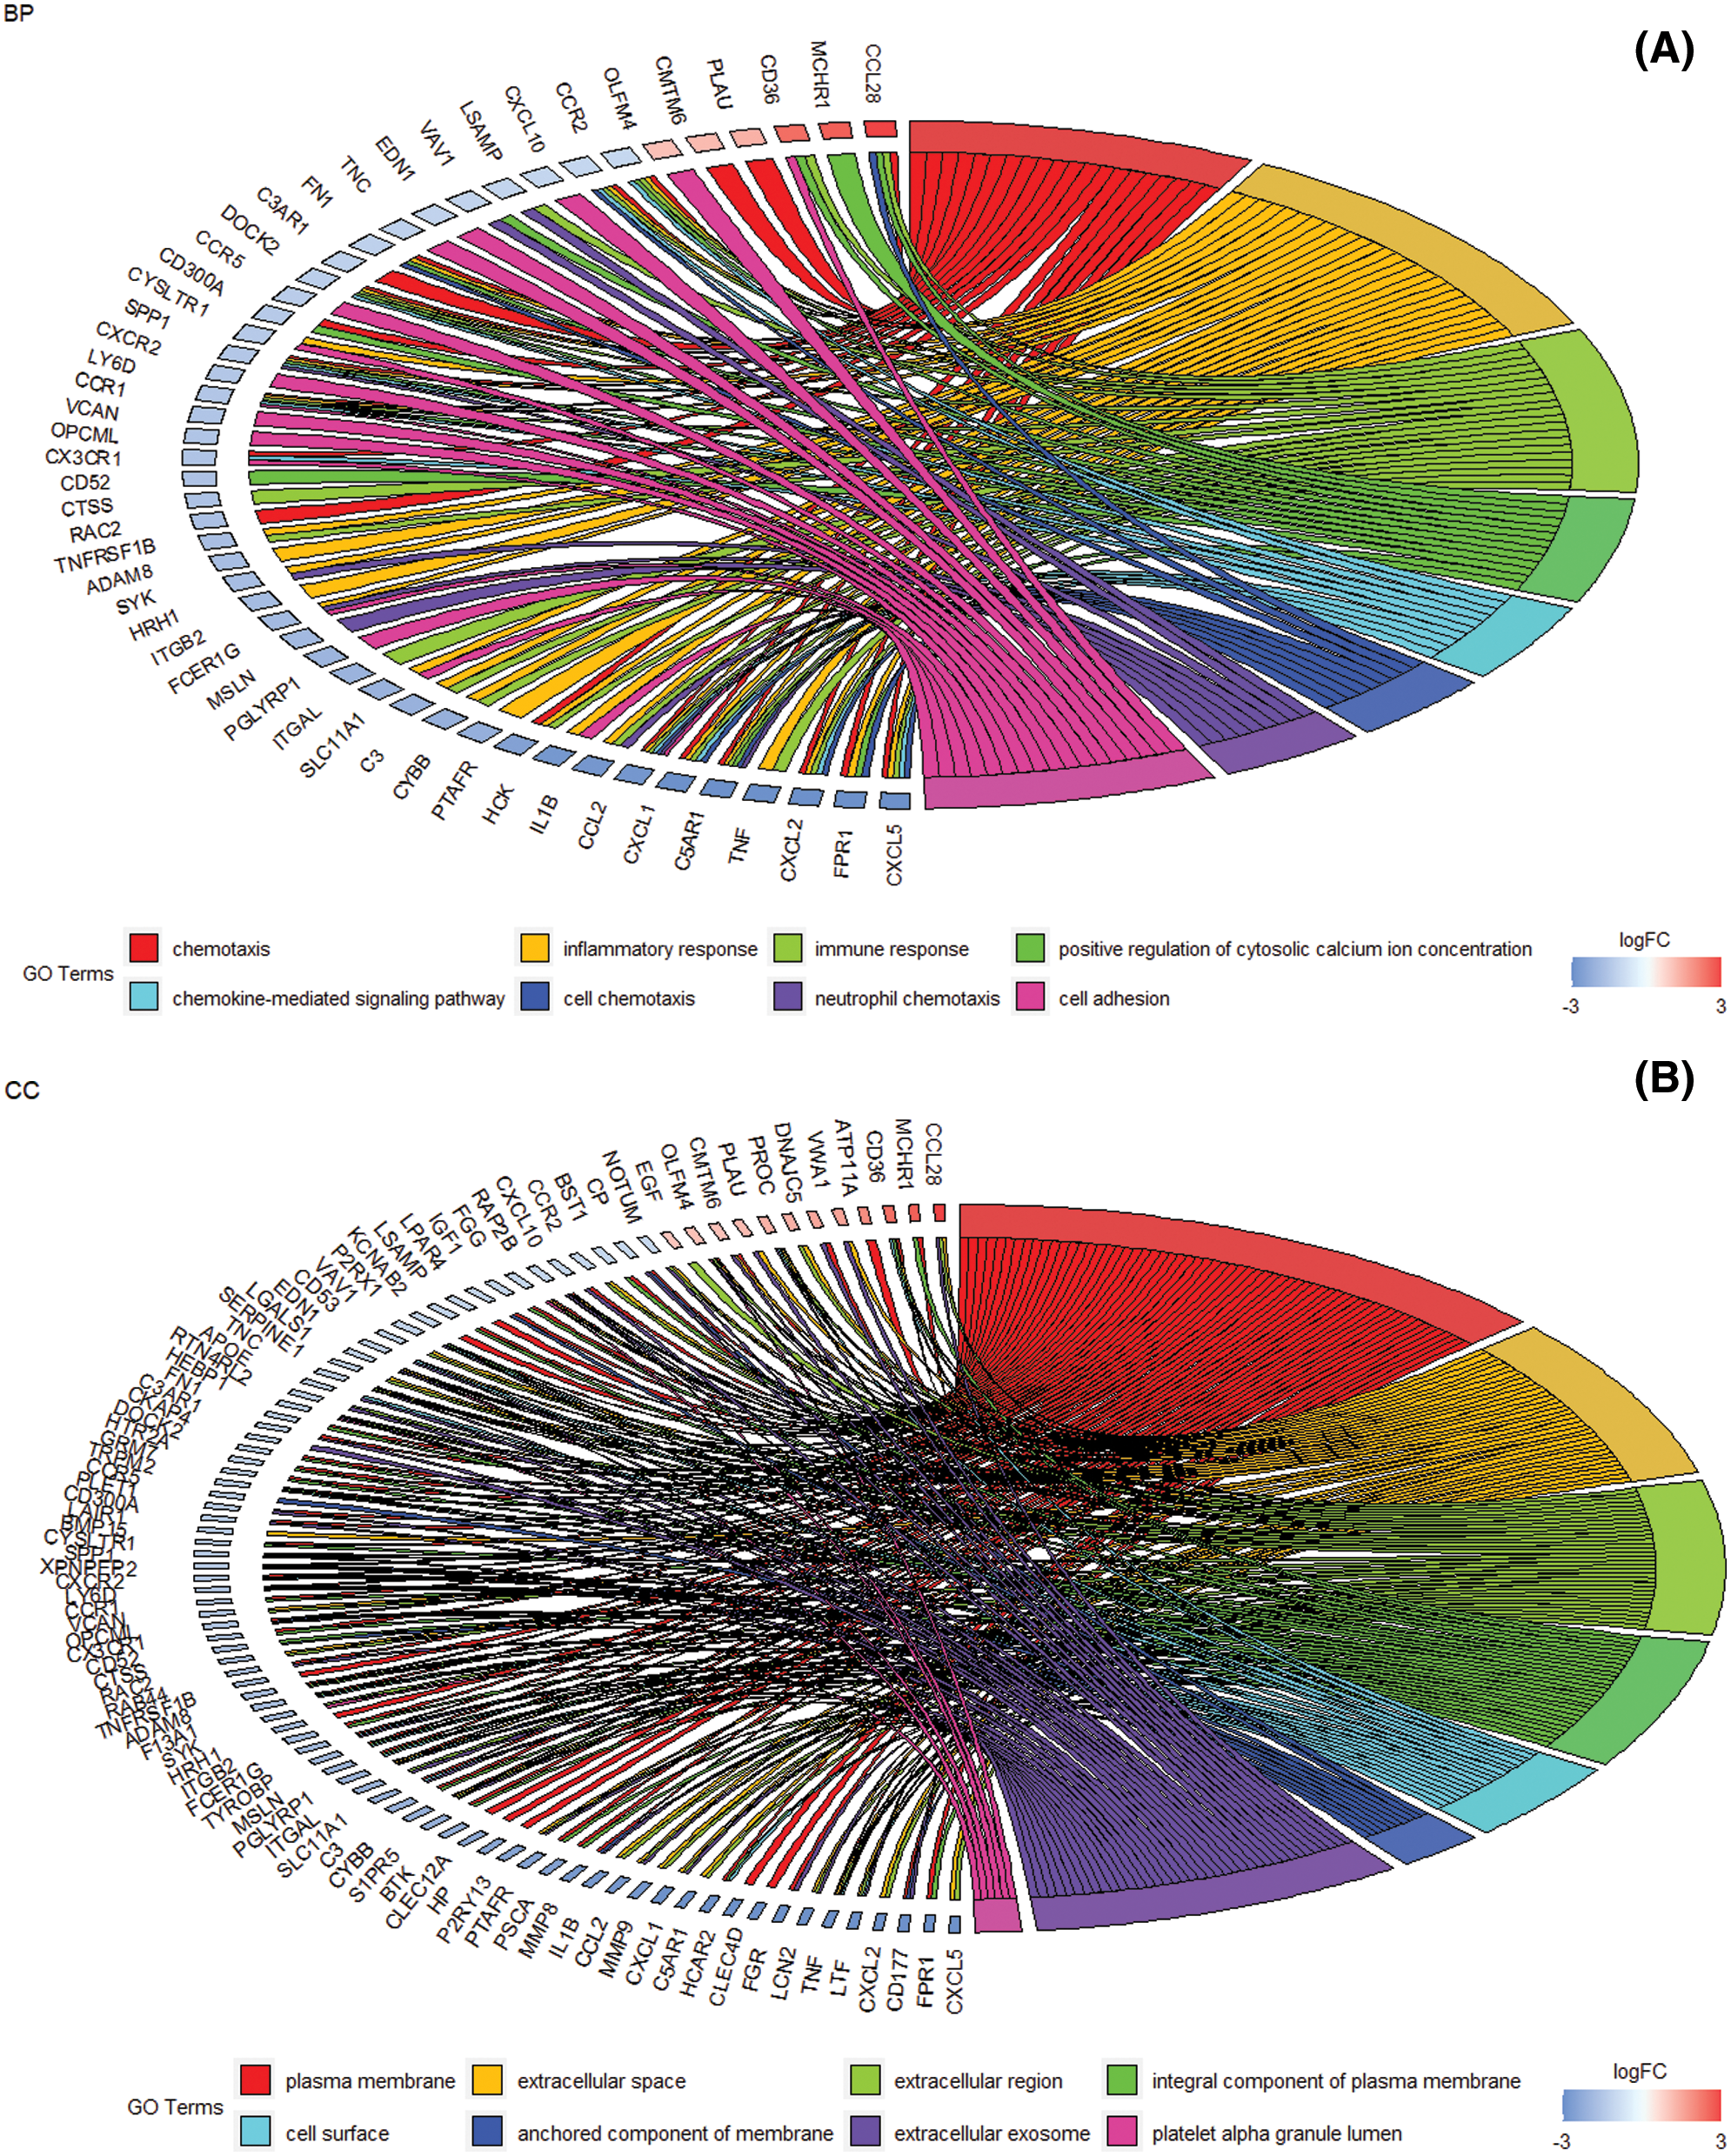
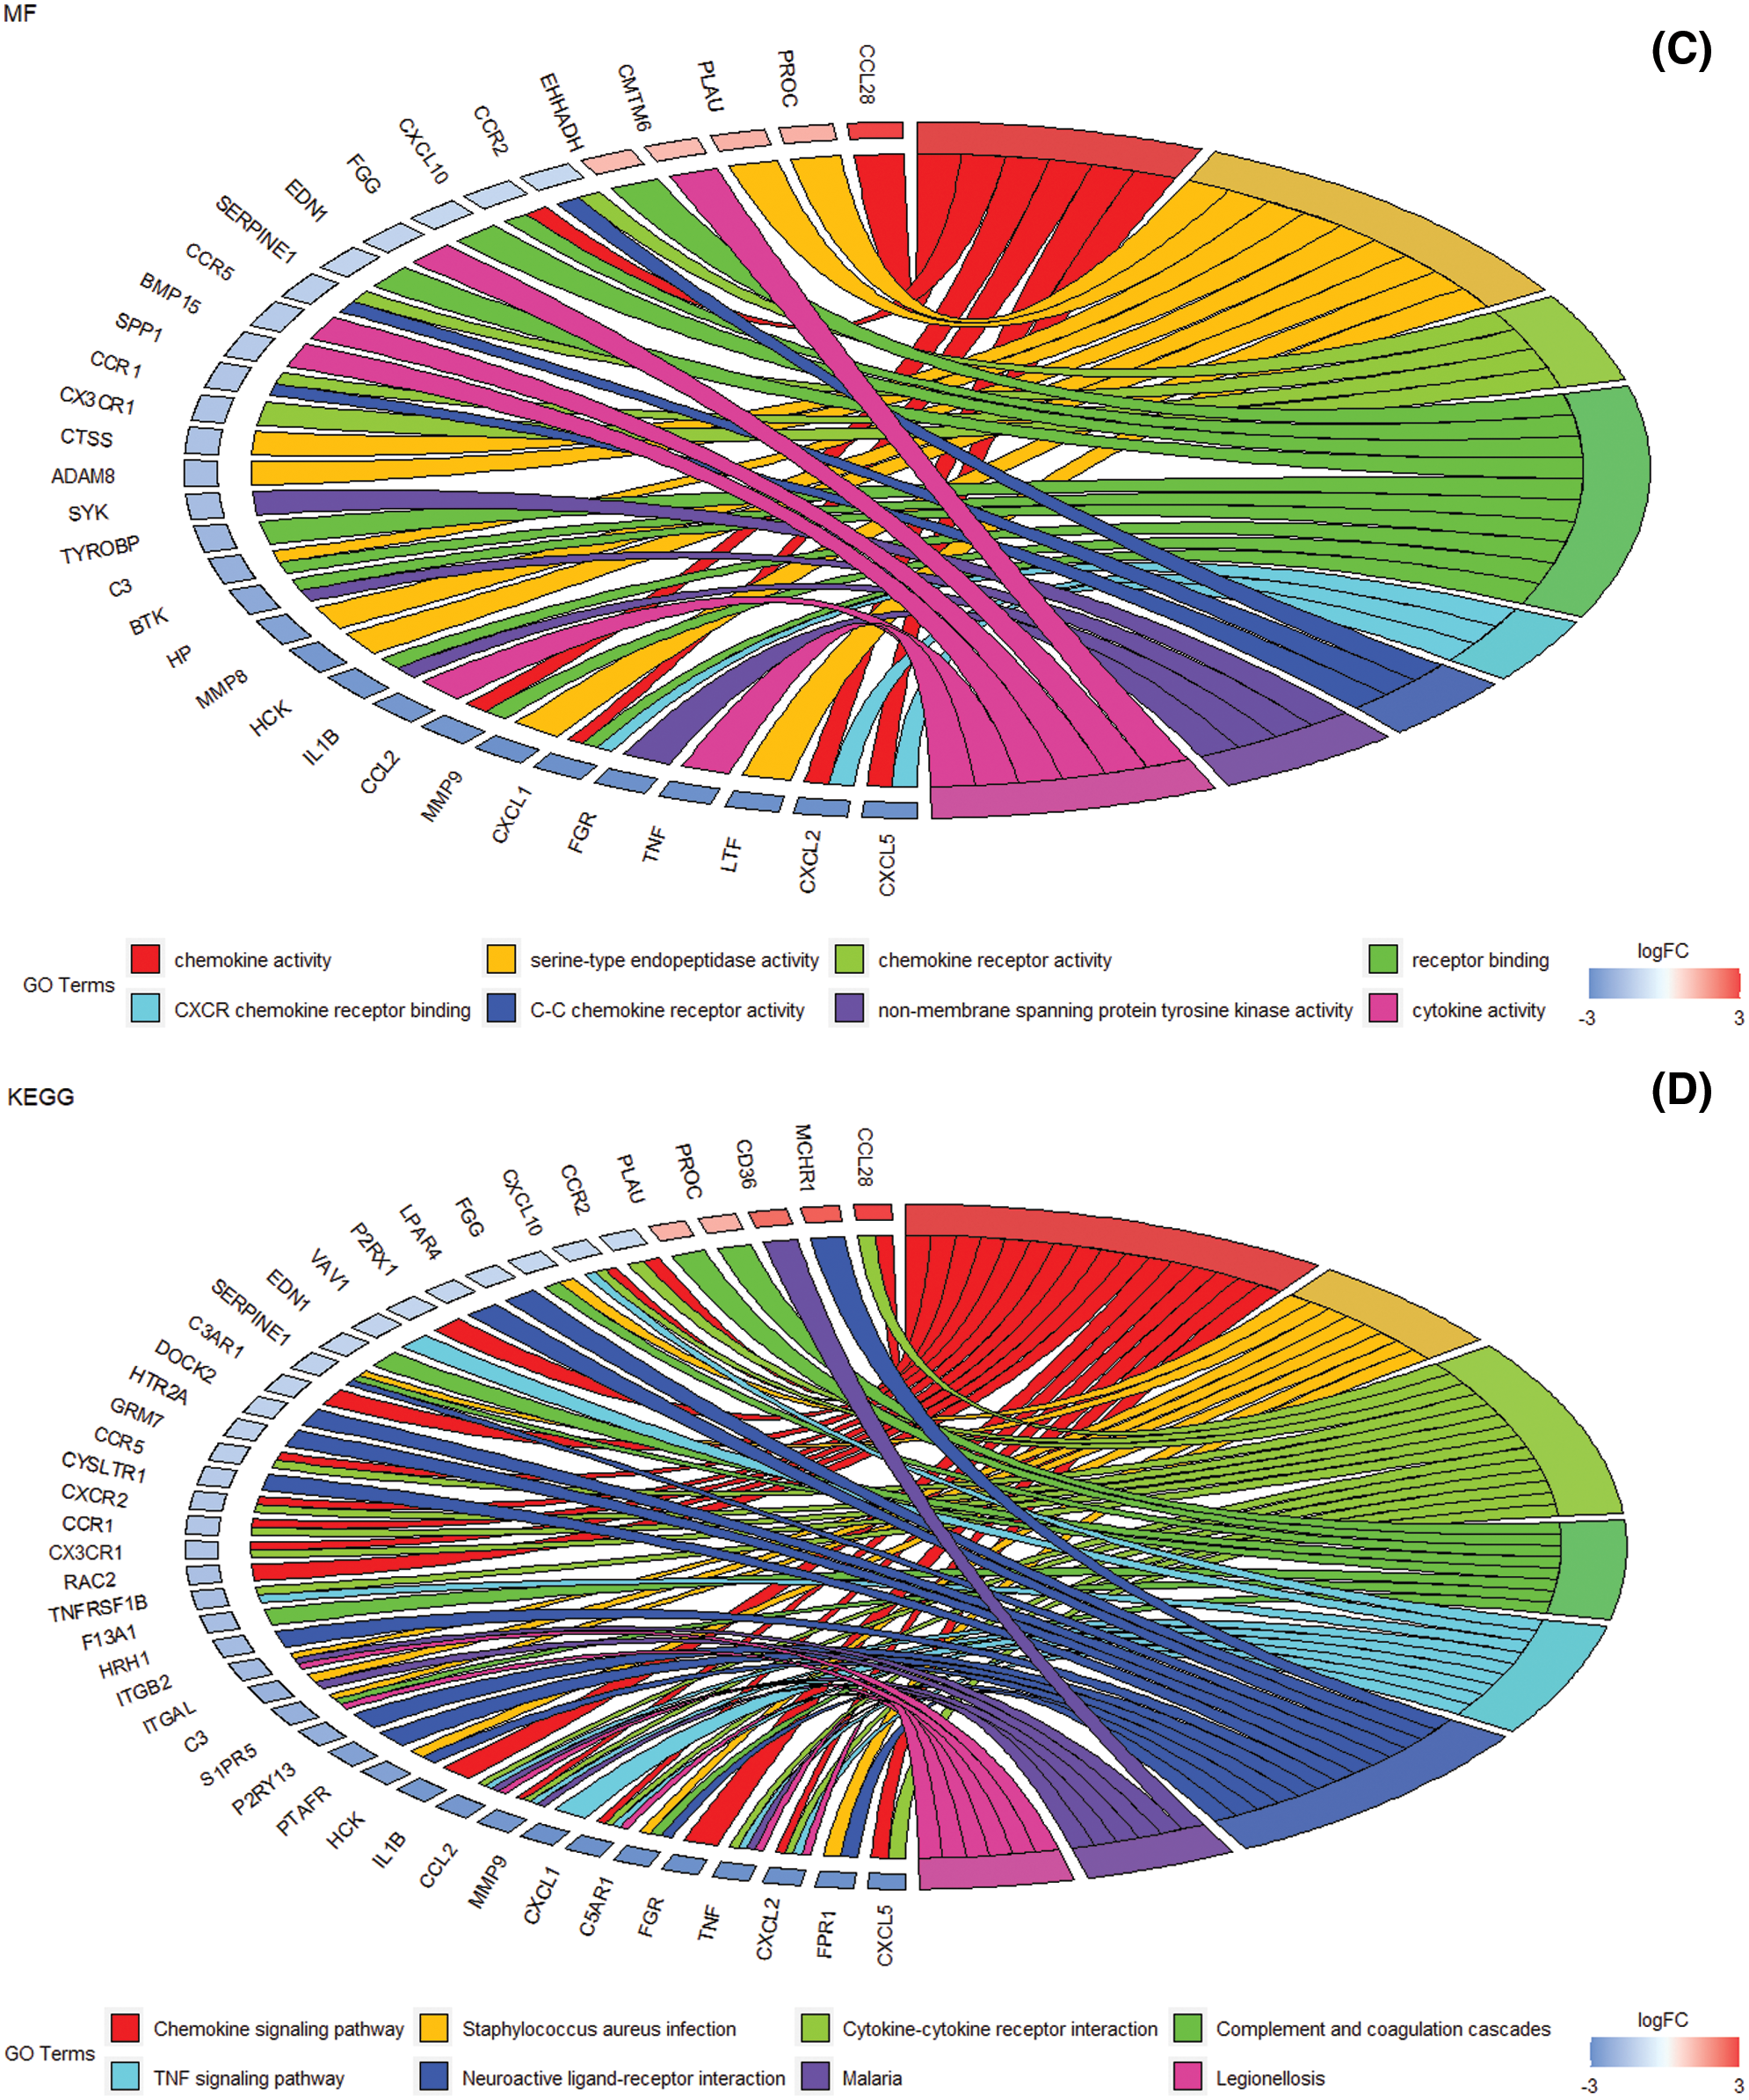
Figure 3: The enrichment analysis of GO and KEGG pathways of differential genes. (A) DEG at the biological process level mainly involves chemotaxis, chemokine-mediated signaling pathways, inflammatory response, cell chemotaxis, immune response, neutrophil chemotaxis, and positive regulation of cytoplasmic calcium ion concentration, cell adhesion (B) Cell composition level DEG mainly involves plasma membrane, extracellular space, extracellular zone, plasma membrane composition, cell surface, membrane anchoring composition, and extracellular exosomes. (C) Molecular function level DEG mainly involves the activity of chemokines, serine endopeptidase activity, chemokine receptor, receptor binding, CXCR chemokine receptor binding, non-membrane transprotein tyrosine kinase activity, Cytokine activity, etc. (D) DEG enrichment analysis of biological pathways. Staphylococcus aureus infection, cytokine-cytokine receptor interaction, complement and coagulation cascade, TNF signaling pathway, neuroactive ligand-receptor interaction, etc.
We used CIBERSORT to perform deconvolution algorithm analysis on 913 differential gene expression data. The immune abundance landscape displays difference in immune infiltration of the 22 immune infiltrating cells between DN and non-diabetic glomerular samples. Compared with healthy tissues, T cell follicular helper cells, T cell CD4 memory, resting mast cells, and monocytes have significant different proportions in the DN glomerular samples (Fig. 4).
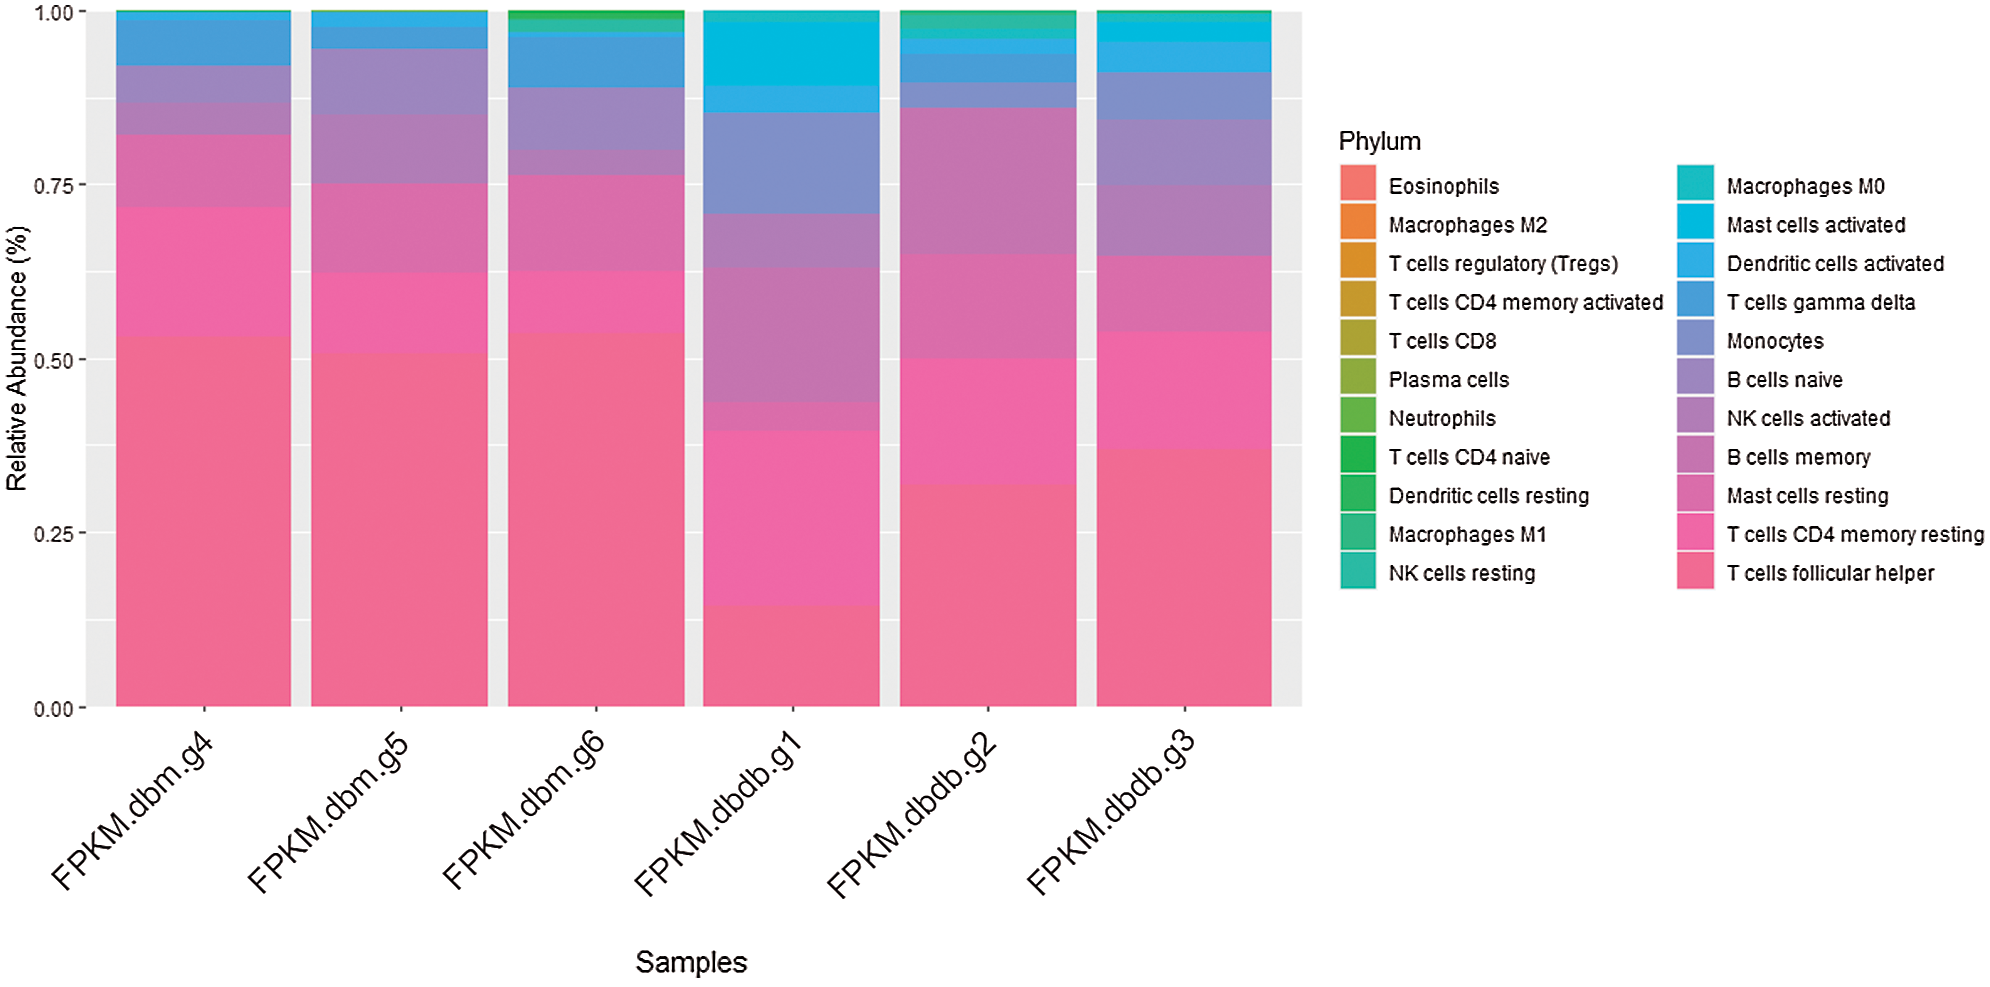
Figure 4: Abundance graph, the expression of immune infiltrating cells in different sample groups is different. The ratio of 22 types of immune infiltrating cells in each diabetic and non-diabetic glomerular sample.
PPI and random forest algorithm determine key genes
The PPI network contains 753 nodes and 1323 edges, with an average node degree of 3.51, and PPI enrichment is statistically significant (P = 1.0e-16) (Fig. 5A). Then 50 important genes with high scores were screened out according to the degree (Fig. 5B). Besides, the genes are screened according to the mapping relationship between the differential gene and whether it is DN. The decision tree is 25, and the results show differences between samples and the distribution between samples (Figs. 5C and 5D). Finally, we overlap the PPI and the random forest results to determine hub genes’ intersection CD300A and CXCL1 (Fig. 5E). The expression of both genes was significantly increased in DN glomerular samples.
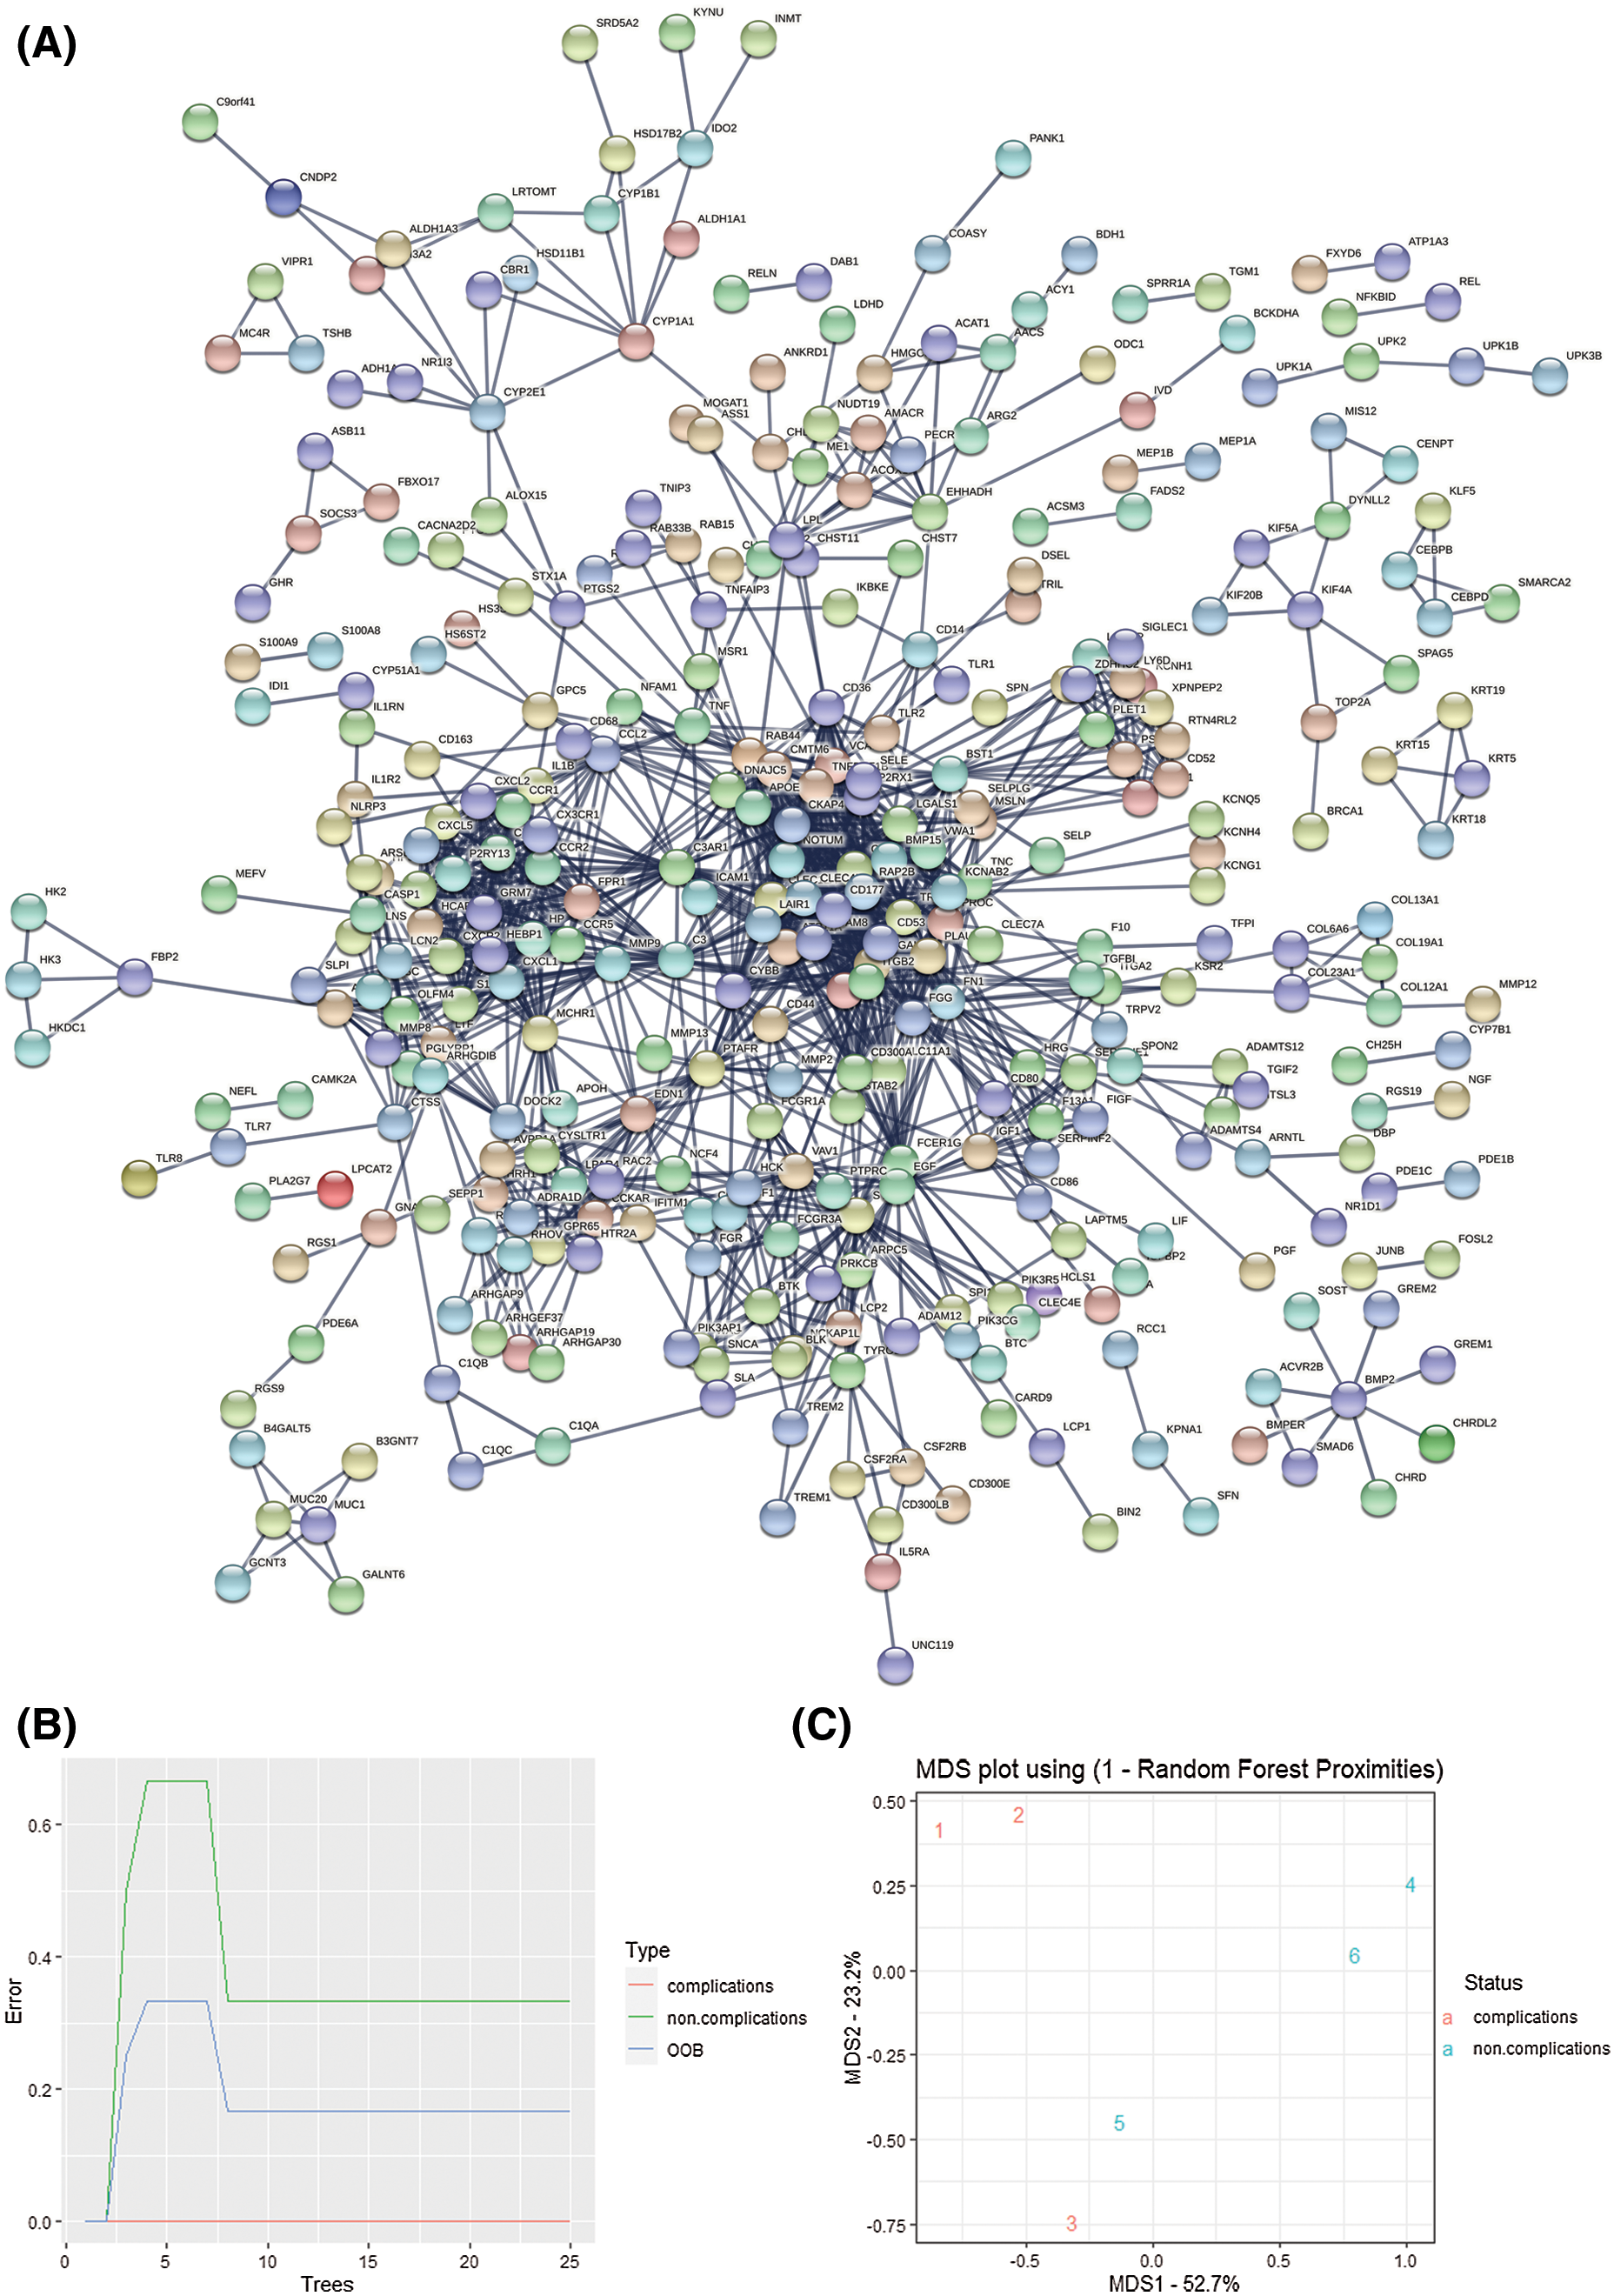
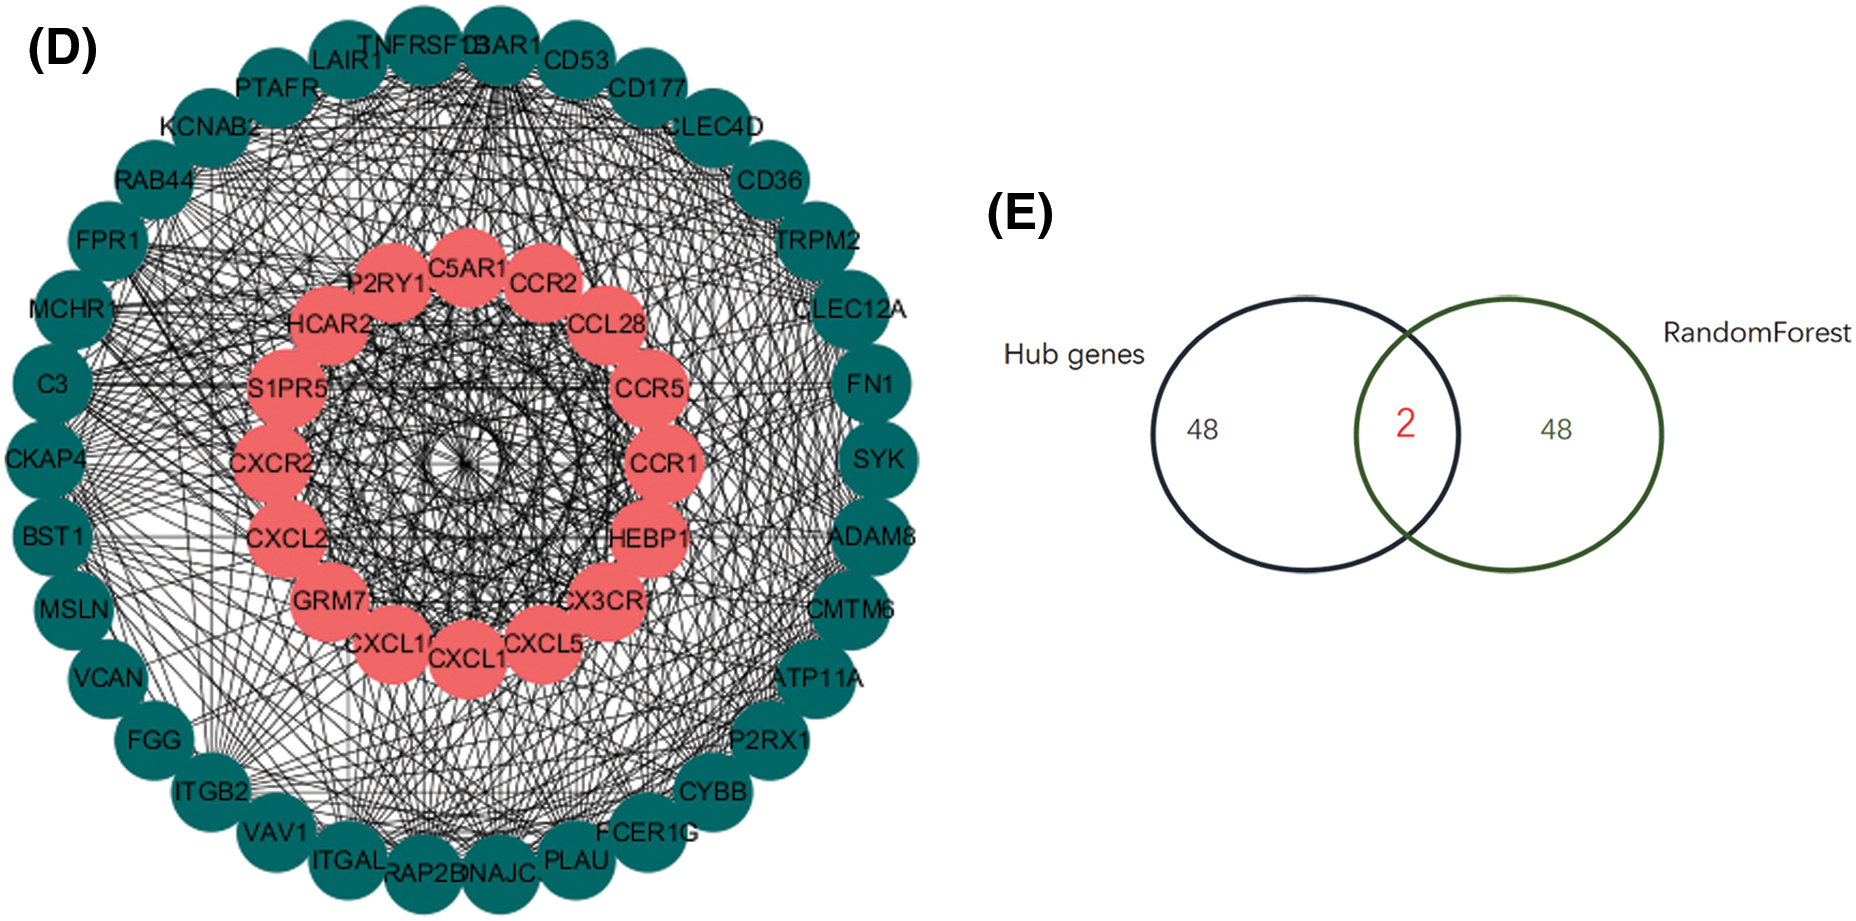
Figure 5: Screening of key genes A. String database is used to predict 913 differentially expressed genes. B. The protein-protein interaction network diagram screens the 50 most important hub genes. Use custom R to calculate the degree score of each gene. C–D. Random forest analysis. According to the MeanDecreaseGini value, 50 key genes were screened out. E. Venn diagram. An important intersection gene between random forest and PPI. These genes may mediate the role of diabetic nephropathy.
Increased expression of CD300A and CXCL1 in podocytes of DN mice
In the glomerulus of mice, Synaptopodin is a specific synaptic junction protein of podocytes, which is mainly expressed on the cell membrane and can be used as a marker of podocytes. We observed the expression of CD300A or CXCL1 in podocytes by co-staining Synaptopodin with CD300A or CXCL1 by immunofluorescence. In Figs. 6A and 6B, it was found that the expression of CD300A or CXCL1 was increased in podocytes. Through immunohistochemical staining and RT-qPCR, it was further confirmed that the expression level of CD300A or CXCL1 protein and mRNA expression level in glomeruli tissue were increased (Figs. 6C–6F). The results indicate that the glomerular inflammation level of DN mice is increased.
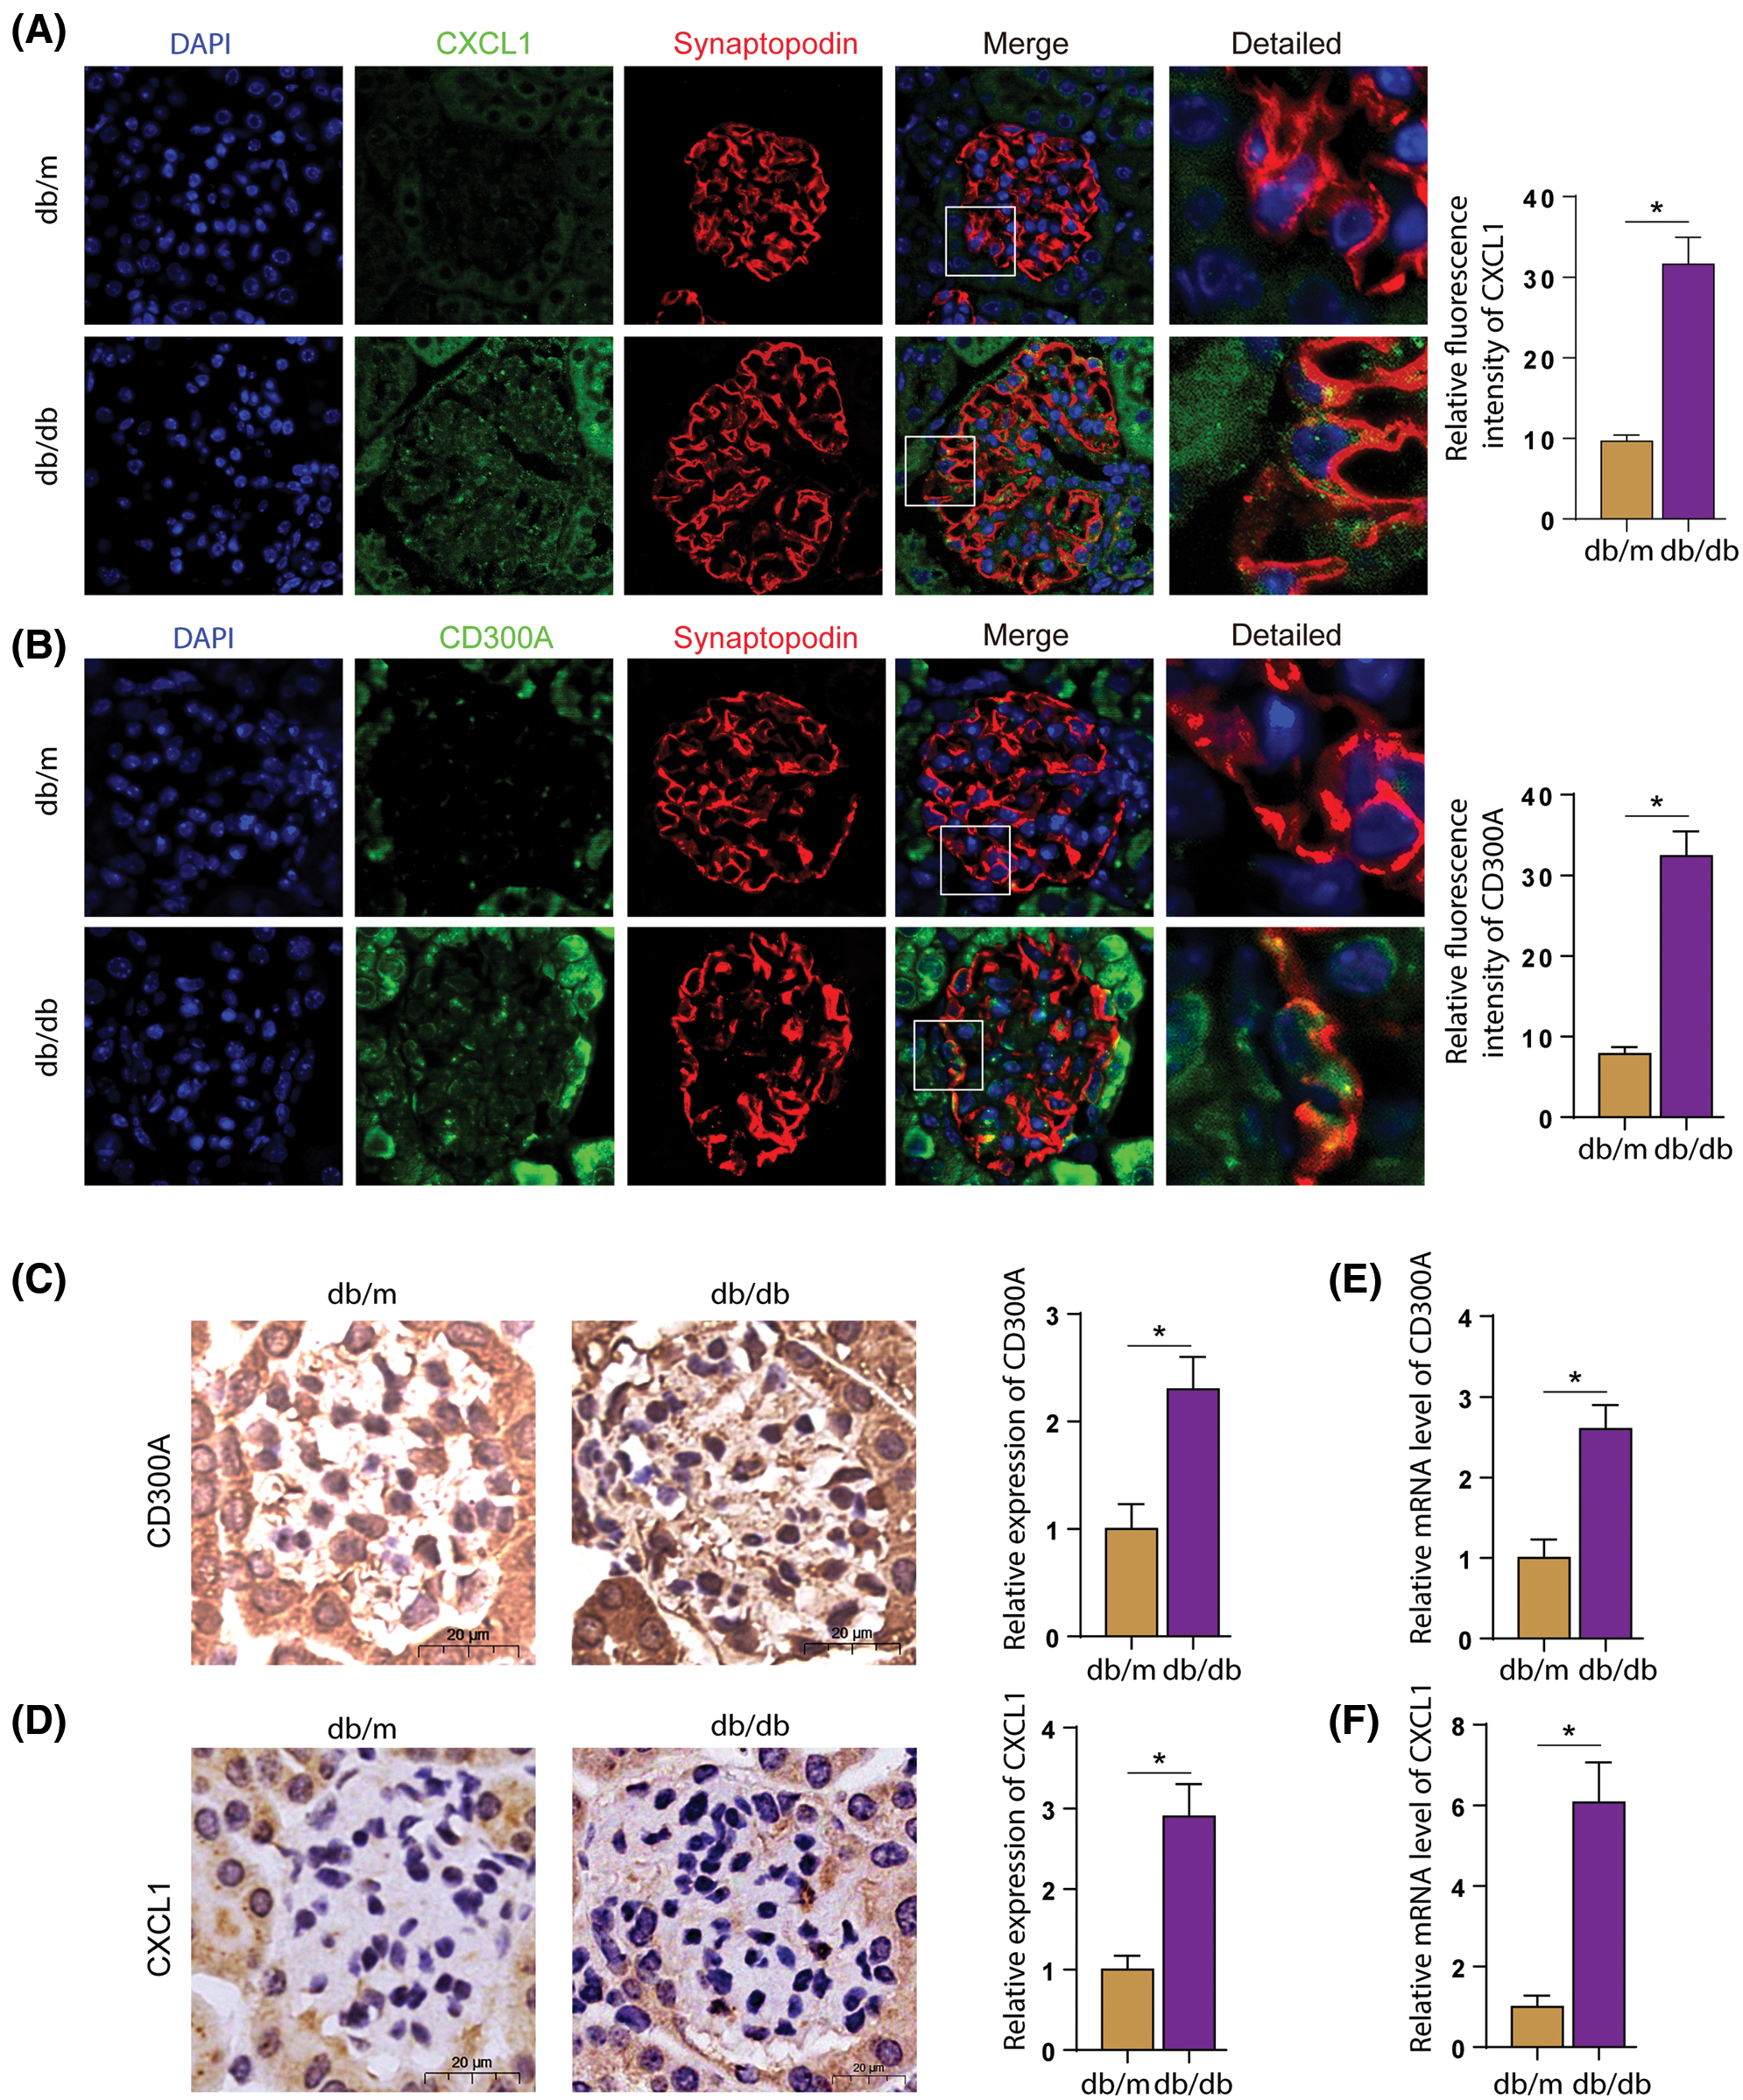
Figure 6: In DN mice, the expression levels of CD300A and CXCL1 in podocytes increased. A. Immunofluorescence co-staining of CXCL1 and Synaptopodin in kidney sections. B. Immunofluorescence co-staining of CXCL1 and Synaptopodin in kidney sections. C. CD300A immunohistochemical staining in kidney sections. D. Immunohistochemical staining of CXCL1 in kidney sections. E. Detect the level of CD300A mRNA in the kidney tissue of each group. F. Detect the level of CXCL1 mRNA in the kidney tissue of each group.
HG stimulation lead to increased expression of CD300A and CXCL1 in podocytes
We incubated HPC cells with high glucose to observe the changes in the expression levels of CD300A and CXCL1. To confirm whether the increase of CD300A and CXCL1 in podocytes in the DN is caused by diabetes. Since high sugar has an effect on osmotic pressure, we added a mannitol group as a control. Western blotting, RT-qPCR and immunofluorescence detection, found that the expression levels of CD300A (Figs. 7A–7C) and CXCL1 (Figs. 7D–7F) were significantly increased under HG stimulation. This is further confirmed at the cellular level that diabetes can lead to increased expression of CD300A and CXCL1.
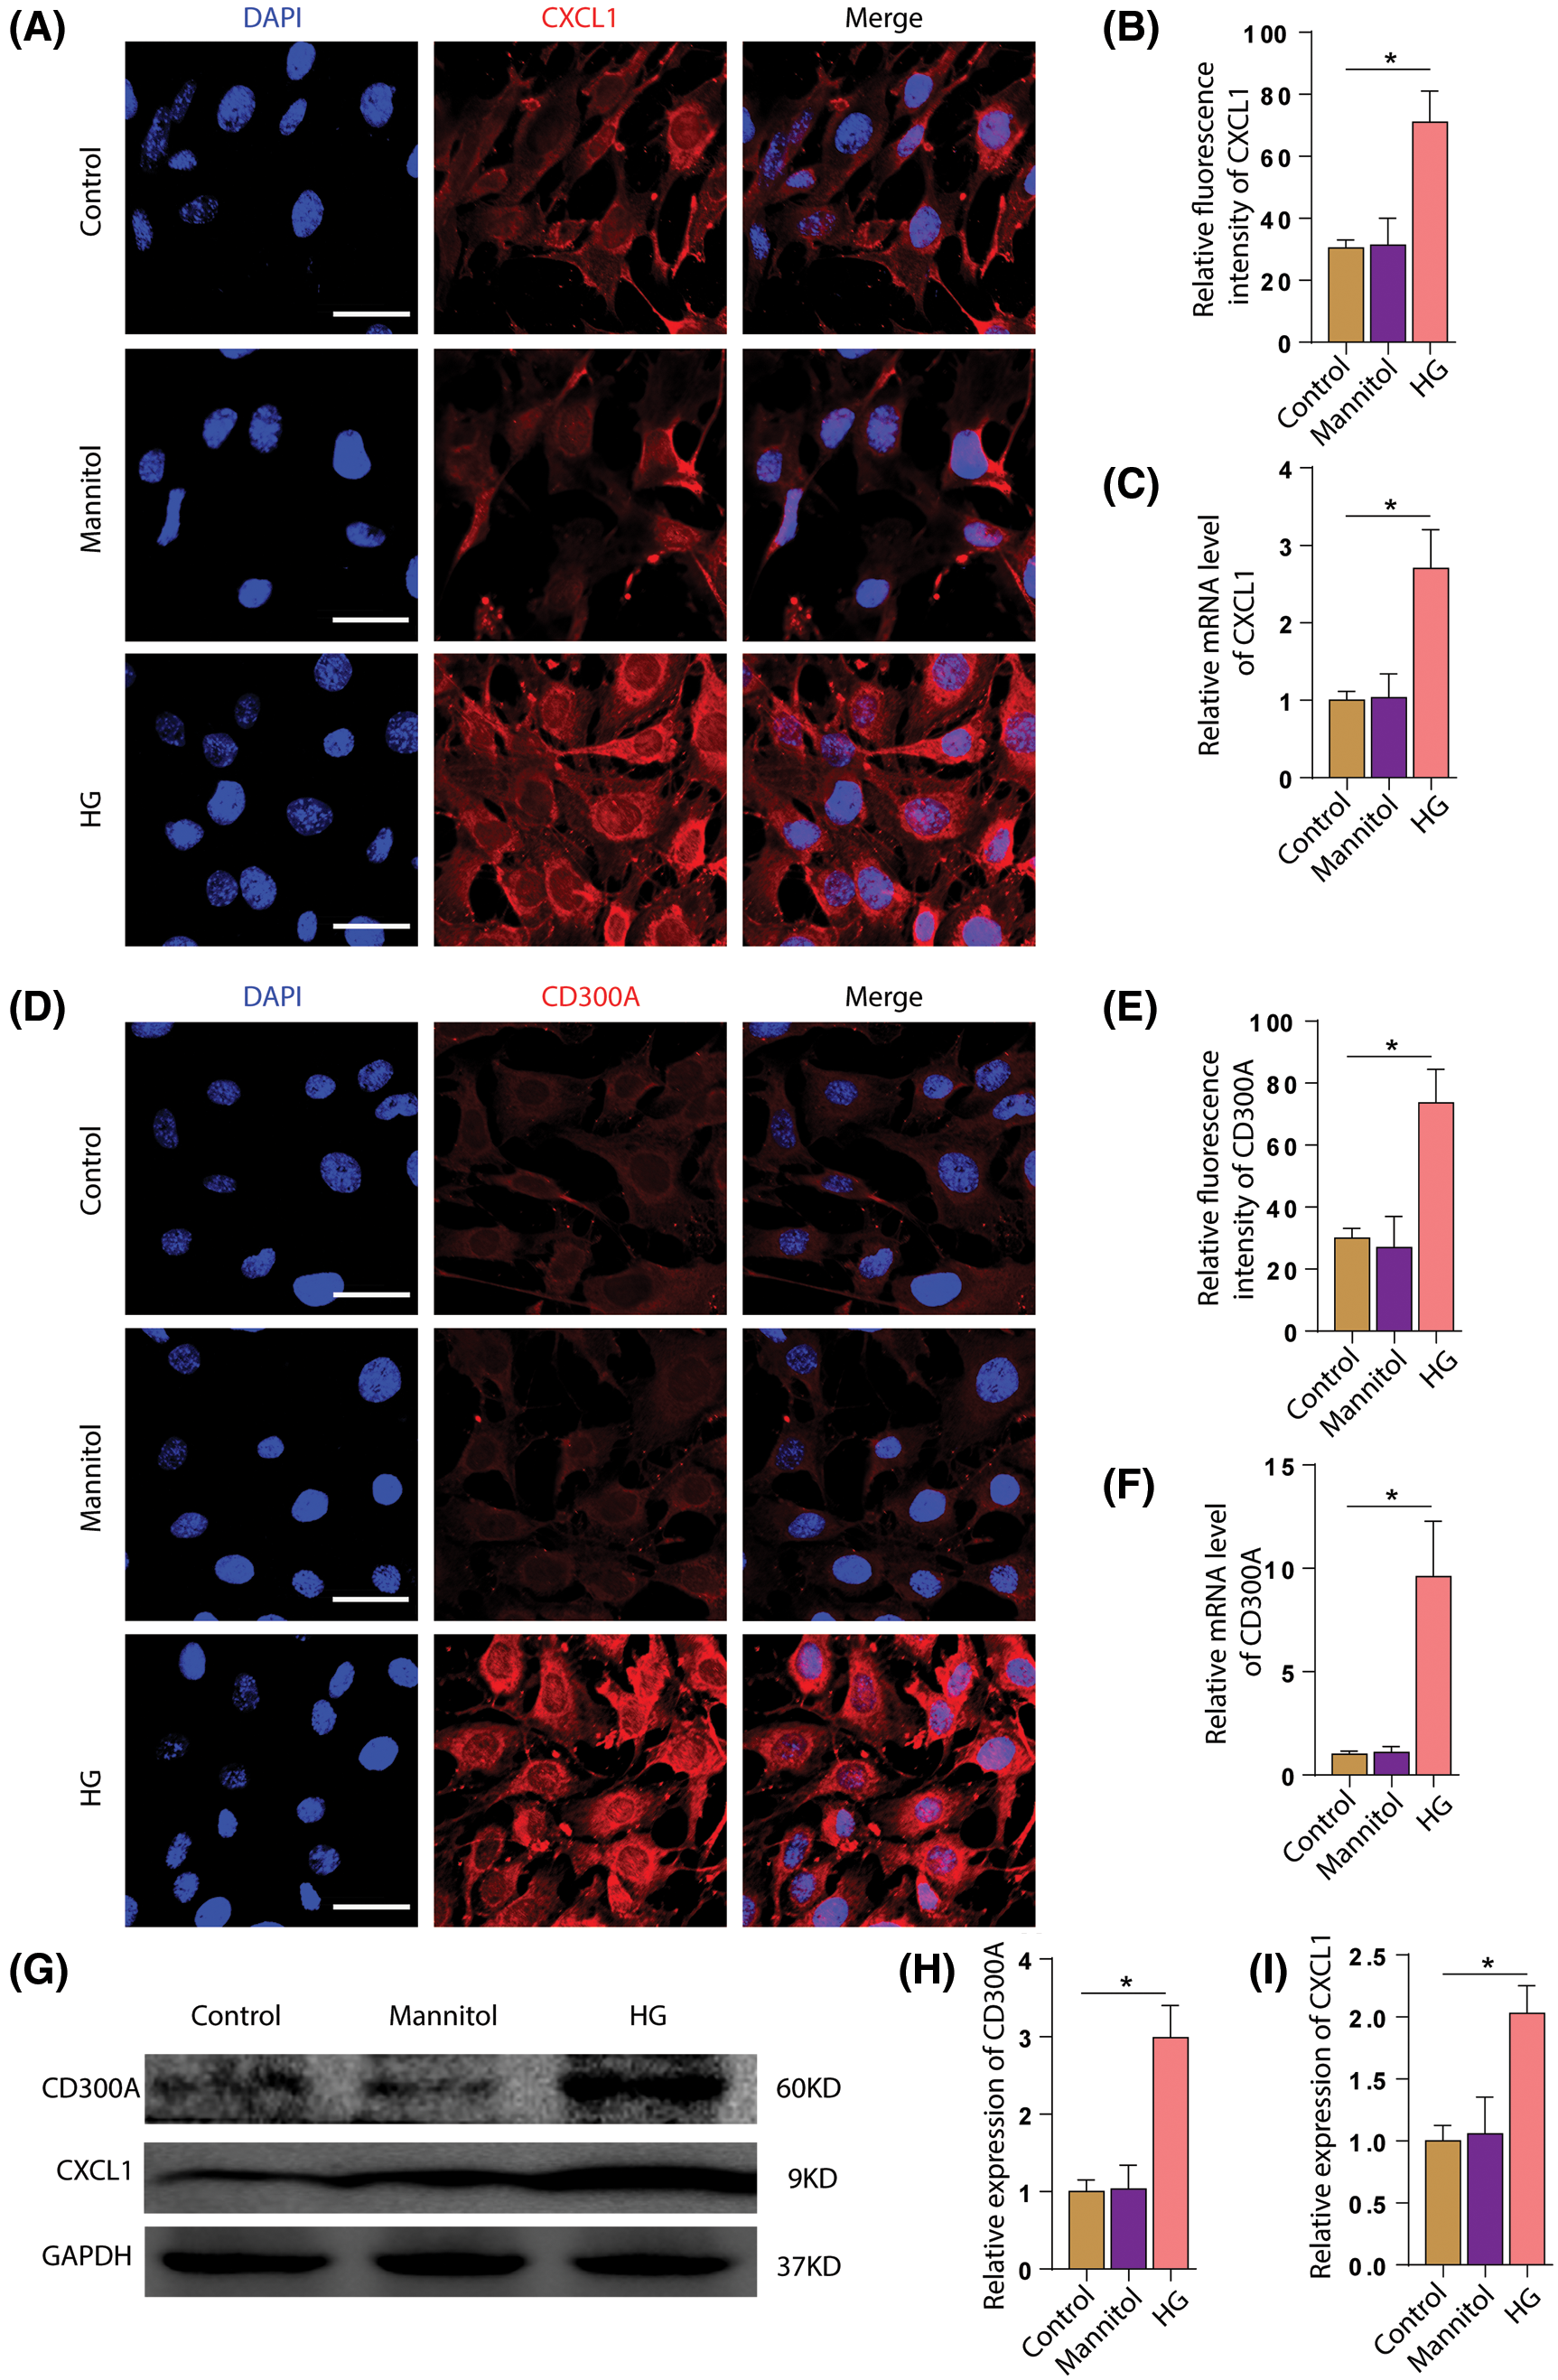
Figure 7: HG stimulation increase the expression of CD300A and CXCL1 in podocytes. A. Immunofluorescence staining of CXCL1 in each group of HPC. B. Quantitative analysis of fluorescence intensity of CXCL1. C. Quantitative analysis of the changes in CXCL1 mRNA expression levels in each group. D. Immunofluorescence staining of CD300A in HPCs of each group. E. Quantitative analysis of CD300A fluorescence intensity. F. Quantitative analysis of changes in CD300A mRNA expression levels in each group. G. Representative Western blot images of each group of CD300A and CXCL1. H. Quantitative analysis of changes in the expression level of CD300A protein in each group. I. Quantitative analysis of changes in CXCL1 protein expression levels in each group.
Diabetes has acute and chronic diabetic complications, including retinopathy, nephropathy, and atherosclerosis [5]. Diabetic nephropathy is the leading cause of death in diabetic patients. However, the current diagnosing methods for diabetic nephropathy are still limited (Cefalu et al., 2016; Harding et al., 2019). Therefore, it is of great significance to study the key genes of diabetic nephropathy and the biological functions and pathways relevant to the disease. Diabetic nephropathy is a kidney disease caused by angiopathy of the capillaries in the glomeruli (Volker and Scott, 2020). Therefore, we obtained gene expression profiles in glomeruli through RNA sequencing and obtained 319 differential genes through differential analysis. Then we used machine learning algorithms to identify hub genes (CD300A, CXCL1), and analyze the biological functions and signal pathways involved.
Random Forest (RF) is an algorithm that integrates multiple trees through ensemble learning. The main idea is to obtain a series of decision trees, which captures complex interactions, and then obtain a set of average characteristics. RF randomly processes data (randomness): guide many patients on each tree and select a subset of variables to grow each node. In growing decision trees, binary split recursion is performed on each region (called a node) of a specific predictor variable to maximize the difference between child nodes. When certain conditions are met, the split ends (these nodes are called terminals). The most commonly used splitting criterion is the log-rank test. RF can also handle data with a large number of samples and a large number of predictors. In addition, combining the results of many tree branches achieve remarkable stability.
The KEGG signaling pathway of differential genes mainly includes staphylococcus aureus infection, cytokine-cytokine receptor interaction, TNF signaling pathway, and neural active ligand-receptor interaction. The pathology of diabetic nephropathy involves multiple signal pathways and cytokines. The cytokine-cytokine receptor signaling pathway is related to insulin secretion (Xu et al., 2017). TNF-α is an inflammatory factor marker to change insulin sensitivity. And sugar participates in diabetic kidney injury through TNF-α signaling pathways (Dewanjee et al., 2018; Bastard et al., 2006; Yang et al., 2019). GSEA analysis also showed that differential genes are related to immune inflammation. It plays an essential role in the IL-17 signaling pathway, lipid and atherosclerosis, rheumatoid arthritis, and tumor necrosis factor signaling pathway. Studies have shown that IL-17A affects diabetic nephropathy by affecting pro-inflammatory factors and kidney damage (Lavoz et al., 2019). The complement and coagulation cascade are significantly enriched in DN and play an essential role in DN development (Lo and Woodruff, 2020). Complement system activation (C3 and C5) is related to the pathogenesis of DN (Lo and Woodruff, 2020). Complement system activation (C3 and C5) is associated with the pathogenesis of DN (Ricklin et al., 2010), and recruits inflammatory and immunocompetent cells and kills tumor cells as a mediator of innate immunity. However, excessive complement activation can lead to kidney failure if left untreated. Therefore, both KEGG and GSEA data indicate that these differential genes play an essential role in the development of diabetes.
GO function enrichment analysis revealed that differential genes are mainly involved in many immune responses and immune cell chemotaxis. Molecular functions mainly involve chemokines and their receptors, CXCR chemokine receptor binding and cytokines. The evident biological processes are neutrophil chemotaxis, inflammatory response, immune response. For example, in the pathogenesis of painful diabetic neuropathy, chemokines and cell signaling molecules connect signal pathways inside and outside the cell, leading to increased production and release of inflammatory factors (TNF-α, IL-6) (Liu et al., 2019). In addition, the CXCR4 axis plays a crucial role in kidney development, and the high expression of chemokine receptor binding is associated with a poor prognosis of kidney cancer (Siddiqi et al., 2015). Diabetic nephropathy (DN) kidney damage inflammatory cells play a key role. Tubular interstitial injury is the main feature of DN and a significant predictor of renal dysfunction (Mezzano et al., 2003). The genes encoding inflammatory cytokines and chemokines influence the development of DN. -511 C/T in interleukin-1β (IL-1β), tandem repeat in IL-1 receptor antagonist (IL-1Ra), -308 in tumor necrosis factor-α (TNF-α) G/A is significantly associated with an increased risk of kidney failure (Lee et al., 2005).
The protein-protein interaction network (PPl) system uses a scoring mechanism to give a certain weight to the results obtained from these different methods (gene adjacent, gene fusion, phylogenetic profiling and gene co-expression based on chip data). Based on the type and intensity of interaction between coding genes, the degree of contribution of a node in the entire network can be judged by the number of connections between a certain node and other nodes. This study used PPI analysis of differentially expressed genes to obtain the connection value of the interaction between the differentially expressed genes. The hub gene can be screened according to the PPI results.
We found two key genes CD300A and CXCL1 based on machine learning algorithms and key gene screening. Western blot results, immunofluorescence and PCR showed that CD300A and CXCL1 in diabetic nephropathy increased. CD300A is an inhibitory receptor of mast cells and eosinophils in allergic inflammation (AI), and has anti-inflammatory activity (Karra et al., 2018). As an essential regulator in rheumatoid arthritis, CD300A inhibits the production of the inflammatory factor CXCL1 (Valiate et al., 2019). CXCL1 chemokines play a role with G protein-coupled receptors and are involved in hypersensitivity and inflammation (Peters et al., 2015; Zhang et al., 2013). Active inflammatory substances produce pro-inflammatory mediators (macrophages, etc.), and the proliferation and infiltration of macrophages in diabetes is significantly increased. CXCL1 is mainly enriched in the chemokine signaling pathway, cytokine-cytokine receptor interaction signaling pathway and TNF signaling pathway. Studies have shown that the cytokine-cytokine receptor interaction signaling pathway is significantly enriched in tacrolimus-induced nephrotoxicity and can increase the expression level of CXCL1 (Bachelet et al., 2005). CXCL1 and CD300A are mainly enriched in inflammation, extracellular space, chemokine-active plasma, exosomal membrane, and cell adhesion. The pancreatic islets of diabetic patients will show increased expression of pro-inflammatory cytokines and chemokines. TWEAK-induced chemokine CXCL1/KC may be involved in the positive feedback loop that promotes glomerular inflammation (Campbell et al., 2006).
Immune cell infiltration plays a vital role in diabetic nephropathy. Hyperglycemia activates macrophages and mast cells to increase the accumulation of immune cells in the kidney tissue of diabetic patients. In turn, it promotes diabetic kidney inflammation and fibrosis (Wada and Makino, 2013; Perlman et al., 2015; Yang et al., 2018). The development of microalbuminuria into persistent proteinuria cause kidney damage (Anders et al., 2018). The activation of cytokines and the immune system continue to cause irreversible kidney damage (Tesch, 2017). Diabetic nephropathy (DN) is a progressive kidney disease characterized by proteinuria (Packham et al., 2012). T lymphocytes play an essential role in kidney injury in early DN due to their cytotoxic effects and by activating tissue macrophages. T follicular helper (Tfh) cells can regulate the humoral immune response. In the study of diabetic nephropathy, early glomerular regulatory genes are primarily involved in metabolic pathways. The late-stage is mainly signal pathways such as immune response complement regulation and extracellular matrix deposition (Sangartit et al., 2021). There is a positive feedback effect between the glomerulus and immune cells (Yao et al., 2021). The paper applied the CIBERSORT algorithm to analyze the proportion of different genes in immune cells in the immune microenvironment (Li et al., 2021). Studies have found that the expression levels of T cells, mast cells and monocytes are quite different in different groups of glomeruli. For instance, the level of CD4+CXCR5+PD-1+T follicular helper cells increases (Zhang et al., 2016). Monocytes cause podocyte damage to patients with DN through various ways, reducing monocytes and alleviating hyperglycemia (Niu et al., 2016). The level of serum creatinine affects mast cells in patients with diabetic nephropathy. This is consistent with our research.
Although we have analyzed the key genes of diabetes complications through bioinformatics methods, our research still has limitations. Fewer samples are used in data analysis and screening, and a larger population needs to be analyzed and processed for verification. The study used RT-qPCR, Western blotting and immunofluorescence to analyze the expression of key genes. However, the clinical information is lacked, restricting the study of the impact of hub genes on the progression of the disease.
In the study, we identified both hub genes CD300A and CXCL1 as potential biomarkers for diabetic nephropathy through bioinformatics analysis, machine learning and experimental study. The celluar and tissue expression of both hub genes was validated by RT-qPCR, western blot and immunofluorescence experiments. And we further revealed the pathways and immune infiltration cells in diabetic nephropathy.
Availability of Data and Materials: All data in the study are available from the corresponding author in response to a reasonable request.
Author Contribution: Qiang Luo, Zongwei Zhang, Ankang Yang–Planning and execution of research work. Keju Yang–Data analysis. Qingjia Chi, Huan Hu–Bioinformatics analysis. Wei Liang–Experimental design and statistical analysis of research work, supervision and interpretation. All authors read and approved the final manuscript.
Ethics Approval: All experimental protocols for animal studies were approved by the Laboratory Animal Welfare And Ethics Committee (Ethical permission number of Renmin Hospital of Wuhan University: WDRM20200603).
Funding Statement: These studies were supported by grants from the National Natural Science Foundation of China (Grant No: 81970631 to W.L.) and the Fund of Biosecurity Specialized Project of PLA (No. 19SWAQ18).
Conflicts of Interest: The authors declare that they have no conflicts of interest to report regarding the present study.
Anders HJ, Huber TB, Isermann B, Schiffer M (2018). CKD in diabetes: Diabetic kidney disease vs. nondiabetic kidney disease. Nature Reviews Nephrology 14: 361–377. DOI 10.1038/s41581-018-0001-y. [Google Scholar] [CrossRef]
Bachelet I, Munitz A, Moretta A, Moretta L, Levi-Schaffer F (2005). The inhibitory receptor IRp60 (CD300a) is expressed and functional on human mast cells. Journal of Immunology 175: 7989–7995. DOI 10.4049/jimmunol.175.12.7989. [Google Scholar] [CrossRef]
Ban CR, Twigg SM (2008). Fibrosis in diabetes complications: Pathogenic mechanisms and circulating and urinary markers. Vascular Health and Risk Management 4: 575–596. DOI 10.2147/VHRM. [Google Scholar] [CrossRef]
Bastard JP, Maachi M, Lagathu C, Kim MJ, Caron M et al. (2006). Recent advances in the relationship between obesity, inflammation, and insulin resistance. European Cytokine Network 17: 4–12. [Google Scholar]
Bloomgarden Z (2016). Questioning glucose measurements used in the International Diabetes Federation (IDF) Atlas. Journal of Diabetes 8: 746–747. DOI 10.1111/1753-0407.12453. [Google Scholar] [CrossRef]
Bonnet F, Scheen AJ (2018). Effects of SGLT2 inhibitors on systemic and tissue low-grade inflammation: The potential contribution to diabetes complications and cardiovascular disease. Diabetes & Metabolism 44: 457–464. DOI 10.1016/j.diabet.2018.09.005. [Google Scholar] [CrossRef]
Campbell S, Burkly LC, Gao HX, Berman JW, Su L et al. (2006). Proinflammatory effects of TWEAK/Fn14 interactions in glomerular mesangial cells. Journal of Immunology 176: 1889–1898. DOI 10.4049/jimmunol.176.3.1889. [Google Scholar] [CrossRef]
Cefalu WT, Rosenstock J, LeRoith D, Blonde L, Riddle MC (2016). Getting to the “Heart” of the matter on diabetic cardiovascular disease: “Thanks for the memory”. Diabetes Care 39: 664–667. DOI 10.2337/dc16-0405. [Google Scholar] [CrossRef]
Chow F, Ozols E, Nikolic-Paterson DJ, Atkins RC, Tesch GH (2004). Macrophages in mouse type 2 diabetic nephropathy: Correlation with diabetic state and progressive renal injury. Kidney International 65: 116–128. DOI 10.1111/j.1523-1755.2004.00367.x. [Google Scholar] [CrossRef]
Dang MN, Buzzetti R, Pozzilli P (2013). Epigenetics in autoimmune diseases with focus on type 1 diabetes. Diabetes-Metabolism Research and Reviews 29: 8–18. DOI 10.1002/dmrr.2375. [Google Scholar] [CrossRef]
Dewanjee S, Das S, Das AK, Bhattacharjee N, Dihingia A et al. (2018). Molecular mechanism of diabetic neuropathy and its pharmacotherapeutic targets. European Journal of Pharmacology 833: 472–523. DOI 10.1016/j.ejphar.2018.06.034. [Google Scholar] [CrossRef]
Elmarakby AA, Sullivan JC (2012). Relationship between oxidative stress and inflammatory cytokines in diabetic nephropathy. Cardiovascular Therapeutics 30: 49–59. DOI 10.1111/j.1755-5922.2010.00218.x. [Google Scholar] [CrossRef]
Flyvbjerg A (2017). The role of the complement system in diabetic nephropathy. Nature Reviews Nephrology 13: 311–318. DOI 10.1038/nrneph.2017.31. [Google Scholar] [CrossRef]
Forbes JM, Cooper ME (2013). Mechanisms of diabetic complications. Physiological Reviews 93: 137–188. DOI 10.1152/physrev.00045.2011. [Google Scholar] [CrossRef]
Harding JL, Pavkov ME, Magliano DJ, Shaw JE, Gregg EW (2019). Global trends in diabetes complications: A review of current evidence. Diabetologia 62: 3–16. DOI 10.1007/s00125-018-4711-2. [Google Scholar] [CrossRef]
Horie K, Miyata T, Maeda K, Miyata S, Sugiyama S et al. (1997). Immunohistochemical colocalization of glycoxidation products and lipid peroxidation products in diabetic renal glomerular lesions. Implication for glycoxidative stress in the pathogenesis of diabetic nephropathy. Journal of Clinical Investigation 100: 2995–3004. DOI 10.1172/JCI119853. [Google Scholar] [CrossRef]
Ishii H, Jirousek MR, Koya D, Takagi C, Xia P et al. (1996). Amelioration of vascular dysfunctions in diabetic rats by an oral PKC beta inhibitor. Science 272: 728–731. DOI 10.1126/science.272.5262.728. [Google Scholar] [CrossRef]
Karra L, Singh GR, Shamri R, Puzzovio PG, Cohen-Mor S et al. (2018). Leukocyte CD300a contributes to the resolution of murine allergic inflammation. Journal of Immunology 201: 2998–3005. DOI 10.4049/jimmunol.1801000. [Google Scholar] [CrossRef]
Kato M, Natarajan R (2019). Epigenetics and epigenomics in diabetic kidney disease and metabolic memory. Nature Reviews Nephrology 15: 327–345. DOI 10.1038/s41581-019-0135-6. [Google Scholar] [CrossRef]
Lavoz C, Matus YS, Orejudo M, Carpio JD, Droguett A et al. (2019). Interleukin-17A blockade reduces albuminuria and kidney injury in an accelerated model of diabetic nephropathy. Kidney International 95: 1418–1432. DOI 10.1016/j.kint.2018.12.031. [Google Scholar] [CrossRef]
Le TT, Simmons WK, Misaki M, Bodurka J, White BC et al. (2017). Differential privacy-based evaporative cooling feature selection and classification with relief-F and random forests. Bioinformatics 33: 2906–2913. DOI 10.1093/bioinformatics/btx298. [Google Scholar] [CrossRef]
Lee SH, Lee TW, Ihm CG, Kim MJ, Woo JT et al. (2005). Genetics of diabetic nephropathy in type 2 DM: Candidate gene analysis for the pathogenic role of inflammation. Nephrology 10 Suppl: S32–S36. DOI 10.1111/j.1440-1797.2005.00454.x. [Google Scholar] [CrossRef]
Li W, Jin X, Guo S, Xu F, Su X et al. (2021). Comprehensive analysis of prognostic immune-related genes in the tumor microenvironment of colorectal cancer. Aging 13: 5506–5524. DOI 10.18632/aging.202479. [Google Scholar] [CrossRef]
Liu S, Liu X, Xiong H, Wang W, Liu Y et al. (2019). CXCL13/CXCR5 signaling contributes to diabetes-induced tactile allodynia via activating pERK, pSTAT3, pAKT pathways and pro-inflammatory cytokines production in the spinal cord of male mice. Brain Behavior and Immunity 80: 711–724. DOI 10.1016/j.bbi.2019.05.020. [Google Scholar] [CrossRef]
Lo MW, Woodruff TM (2020). Complement: Bridging the innate and adaptive immune systems in sterile inflammation. Journal of Leukocyte Biology 108: 339–351. DOI 10.1002/JLB.3MIR0220-270R. [Google Scholar] [CrossRef]
Maiti AK (2021). Development of biomarkers and molecular therapy based on inflammatory genes in diabetic nephropathy. International Journal of Molecular Sciences 22: 9985. DOI 10.3390/ijms22189985. [Google Scholar] [CrossRef]
Meza LC, San MOC, Ruiz PJ, Frugone ZC (2017). Pathophysiology of diabetic nephropathy: A literature review. Medwave 17: e6839. DOI 10.5867/medwave.2017.01.6839. [Google Scholar] [CrossRef]
Mezzano S, Droguett A, Burgos ME, Ardiles LG, Flores CA et al. (2003). Renin-angiotensin system activation and interstitial inflammation in human diabetic nephropathy. Kidney International Supplements 64: S64–S70. DOI 10.1046/j.1523-1755.64.s86.12.x. [Google Scholar] [CrossRef]
Niu S, Bian Z, Tremblay A, Luo Y, Kidder K et al. (2016). Broad infiltration of macrophages leads to a proinflammatory state in streptozotocin-induced hyperglycemic mice. Journal of Immunology 197: 3293–3301. DOI 10.4049/jimmunol.1502494. [Google Scholar] [CrossRef]
Packham DK, Alves TP, Dwyer JP, Atkins R, de Zeeuw D et al. (2012). Relative incidence of ESRD versus cardiovascular mortality in proteinuric type 2 diabetes and nephropathy: Results from the DIAMETRIC (Diabetes Mellitus Treatment for Renal Insufficiency Consortium) database. American Journal of Kidney Diseases 59: 75–83. DOI 10.1053/j.ajkd.2011.09.017. [Google Scholar] [CrossRef]
Perlman AS, Chevalier JM, Wilkinson P, Liu H, Parker T et al. (2015). Serum inflammatory and immune mediators are elevated in early stage diabetic nephropathy. Annals of Clinical and Laboratory Science 45: 256–263. [Google Scholar]
Peters KM, Jayabalan N, Bui D, Killinger K, Chancellor M et al. (2015). Effect of sacral neuromodulation on outcome measures and urine chemokines in interstitial cystitis/painful bladder syndrome patients. Lower Urinary Tract Symptoms 7: 77–83. DOI 10.1111/luts.12054. [Google Scholar] [CrossRef]
Ricklin D, Hajishengallis G, Yang K, Lambris JD (2010). Complement: A key system for immune surveillance and homeostasis. Nature Immunology 11: 785–797. DOI 10.1038/ni.1923. [Google Scholar] [CrossRef]
Russell MJ, Kanthimathinathan HK (2018). Is there an optimum duration of fluid bolus in pediatric septic shock? A critical appraisal of “Fluid bolus over 15–20 versus 5–10 minutes each in the first hour of resuscitation in children with septic shock: A randomized controlled trial” by Sankar et al. (Pediatr Crit Care Med 2017; 18: e435-e445). Pediatric Critical Care Medicine 19: 369–371. DOI 10.1097/PCC.0000000000001459. [Google Scholar] [CrossRef]
Sangartit W, Ha KB, Lee ES, Kim HM, Kukongviriyapan U et al. (2021). Tetrahydrocurcumin ameliorates kidney injury and high systolic blood pressure in high-fat diet-induced type 2 diabetic mice. Endocrinology and Metabolism 36: 810–822. DOI 10.3803/EnM.2021.988. [Google Scholar] [CrossRef]
Siddiqi FS, Chen LH, Advani SL, Thai K, Batchu SN et al. (2015). CXCR4 promotes renal tubular cell survival in male diabetic rats: Implications for ligand inactivation in the human kidney. Endocrinology 156: 1121–1132. DOI 10.1210/en.2014-1650. [Google Scholar] [CrossRef]
Stitt AW, Li YM, Gardiner TA, Bucala R, Archer DB et al. (1997). Advanced glycation end products (AGEs) co-localize with AGE receptors in the retinal vasculature of diabetic and of AGE-infused rats. American Journal of Pathology 150: 523–531. [Google Scholar]
Tesch GH (2017). Diabetic nephropathy-is this an immune disorder? Clinical Science 131: 2183–2199. DOI 10.1042/CS20160636. [Google Scholar] [CrossRef]
Tomino Y, Gohda T (2015). The prevalence and management of diabetic nephropathy in Asia. Kidney Diseases 1: 52–60. DOI 10.1159/000381757. [Google Scholar] [CrossRef]
Valiate B, Alvarez RU, Karra L, Queiroz-Junior CM, Amaral FA et al. (2019). The immunoreceptor CD300a controls the intensity of inflammation and dysfunction in a model of Ag-induced arthritis in mice. Journal of Leukocyte Biology 106: 957–966. DOI 10.1002/JLB.3A1018-389R. [Google Scholar] [CrossRef]
Vendhan R, Amutha A, Anjana RM, Unnikrishnan R, Mohan V (2014). Clinical profile of nonalcoholic Fatty liver disease among young patients with type 1 diabetes mellitus seen at a diabetes speciality center in India. Endocrine Practice 20: 1249–1257. DOI 10.4158/EP14044.OR. [Google Scholar] [CrossRef]
Volker V, Scott CT (2020). The tubular hypothesis of nephron filtration and diabetic kidney disease. Nature Reviews Nephrology 16: 317–336. [Google Scholar]
Wada J, Makino H (2013). Inflammation and the pathogenesis of diabetic nephropathy. Clinical Science 124: 139–152. DOI 10.1042/CS20120198. [Google Scholar] [CrossRef]
Xu W, Niu T, Xu B, Navarro G, Schipma MJ, Mauvais-Jarvis F (2017). Androgen receptor-deficient islet beta-cells exhibit alteration in genetic markers of insulin secretion and inflammation. A transcriptome analysis in the male mouse. Journal of Diabetes and Its Complications 31: 787–795. DOI 10.1016/j.jdiacomp.2017.03.002. [Google Scholar] [CrossRef]
Yang H, Xie T, Li D, Du X, Wang T et al. (2019). Tim-3 aggravates podocyte injury in diabetic nephropathy by promoting macrophage activation via the NF-kappaB/TNF-alpha pathway. Molecular Metabolism 23: 24–36. DOI 10.1016/j.molmet.2019.02.007. [Google Scholar] [CrossRef]
Yang W, Luo Y, Yang S, Zeng M, Zhang S et al. (2018). Ectopic lipid accumulation: Potential role in tubular injury and inflammation in diabetic kidney disease. Clinical Science 132: 2407–2422. DOI 10.1042/CS20180702. [Google Scholar] [CrossRef]
Yao X, Shen H, Cao F, He H, Li B et al. (2021). Bioinformatics analysis reveals crosstalk among platelets, immune cells, and the glomerulus that may play an important role in the development of diabetic nephropathy. Frontiers in Medicine 8: 657918. DOI 10.3389/fmed.2021.657918. [Google Scholar] [CrossRef]
Yu G, Wang L, Han Y, He Q (2012). ClusterProfiler: An R package for comparing biological themes among gene clusters. OMICS: A Journal of Integrative Biology 16: 284–287. DOI 10.1089/omi.2011.0118. [Google Scholar] [CrossRef]
Zhang N, Tai J, Qu Z, Zhang Z, Zhao S et al. (2016). Increased CD4+CXCR5+T follicular helper cells in diabetic nephropathy. Autoimmunity 49: 405–413. DOI 10.1080/08916934.2016.1196677. [Google Scholar] [CrossRef]
Zhang ZJ, Cao DL, Zhang X, Ji RR, Gao YJ (2013). Chemokine contribution to neuropathic pain: Respective induction of CXCL1 and CXCR2 in spinal cord astrocytes and neurons. Pain 154: 2185–2197. DOI 10.1016/j.pain.2013.07.002. [Google Scholar] [CrossRef]
 | This work is licensed under a Creative Commons Attribution 4.0 International License, which permits unrestricted use, distribution, and reproduction in any medium, provided the original work is properly cited. |