DOI:10.32604/biocell.2022.018023
| BIOCELL DOI:10.32604/biocell.2022.018023 | |
| Article |
Weighted gene co-expression network analysis identifies a novel immune-related gene signature and nomogram to predict the survival and immune infiltration status of breast cancer
1Department of Oncology, Yongchuan Hospital of Chongqing Medical University, Chongqing, China
2Department of Geriatrics, Yongchuan Hospital of Chongqing Medical University, Chongqing, China
*Address correspondence to: Fei He, 700416@hospital.cqmu.edu.cn
Received: 26 June 2021; Accepted: 16 August 2021
Abstract: Breast cancer is one of the most common cancers in the world and seriously threatens the health of women worldwide. Prognostic models based on immune-related genes help to improve the prognosis prediction and clinical treatment of breast cancer patients. In the study, we used weighted gene co-expression network analysis to construct a co-expression network to screen out highly prognostic immune-related genes. Subsequently, the prognostic immune-related gene signature was successfully constructed from highly immune-related genes through COX regression and LASSO COX analysis. Survival analysis and time receiver operating characteristic curves indicate that the prognostic signature has strong predictive performance. And we developed a nomogram by combing the risk score with multiple clinical characteristics. CIBERSORT and TIMER algorithms confirmed that there are significant differences in tumor-infiltrating immune cells in different risk groups. In addition, gene set enrichment analysis shows 6 pathways that differ between high- and low-risk group. The immune-related gene signature effectively predicts the survival and immune infiltration of breast cancer patients and is expected to provide more effective immunotherapy targets for the prognosis prediction of breast cancer.
Keywords: Immune-related genes; Prognostic model; Breast cancer; WGCNA; Nomogram
Breast cancer is a biologically heterogeneous disease (Desantis et al., 2011). Breast cancer is the most common cancer affecting women worldwide, and its incidence and mortality are expected to increase significantly (Greaney et al., 2015). In developing countries, the incidence of these cancers is expected to increase proportionally and is estimated to grow 55% and the mortality rate of 58% within 20 years (Villarreal-Garza et al., 2013). Breast cancer is mainly classified into 4 major subtypes based on the presence/absence of critical molecular biomarkers estrogen receptor (ER), progesterone receptor (PR), and human epidermal growth factor 2 (HER2), namely ER+/PR+/HER2− (luminal A), ER+/PR+/HER2+ (luminal B), and ER−/PR−/HER2+, and triple-negative breast cancer (TNBC) (Abubakar et al., 2019). Extensive research on breast cancer has promoted cytotoxic and targeted therapies, improving survival rates (Sledge et al., 2014). Although related treatment has improved, there are still challenges in combating tumor heterogeneity due to prognostic prediction difficulty (Eisenstein, 2015). Therefore, the paper outlines the relevant immune signatures for the prognostic diagnosis of breast cancer.
The immune microenvironment of breast cancer can be considered at the local (intratumor), regional (in the breast) and distant (metastatic) levels (Coleman et al., 2013). Abnormal gene expression in immune microenvironment cells affected the progression of the disease (Finak et al., 2008; Hu et al., 2005). The impact of the immune environment on breast cancer progression depends on the cancer phenotype and inflammatory cell subsets in the breast cancer microenvironment (Desantis et al., 2011). Breast cancer may be an immunogenic tumor. Immune escape is mainly caused by histocompatibility complex (MHC) class I, abnormal antigen signaling mechanism, immunosuppressive components (such as HLA-G), Fas and its ligands to activate apoptosis and overexpression of other immunosuppressive molecules, such as lymphocyte activation gene 3 (LAG-3), T cell immunoglobulin and mucin domain 3 (TIM-3) (Steven and Seliger, 2018). Immune cell infiltration plays a critical role in regulating breast cancer development and serves as an independent indicator for the treatment (Choi et al., 2017).
Sequencing technology is widely used with the updating of bioinformatics methods. Molecular markers have shown excellent prognostic performance with the development of genome sequencing technology. Multiple biomarker signatures are developing rapidly to enhance the prognostic prediction of tumors and demonstrated better performance than a single biomarker (Kaanane et al., 2019). For example, the 2-gene signature strongly predicted distant metastasis-free survival and breast cancer-specific survival (Alsaleem et al., 2020). The signature served as a genetic marker for predicting breast cancer patient’s prognosis and may guide clinical management (Ibrahim et al., 2017). Moreover, the 12-gene prognostic signature identifies a high risk of death of breast cancer effectively (Xie et al., 2020). The 17-gene signature effectively divided breast cancer patients into different survival groups and served as a candidate prognostic indicator clinically (Qian et al., 2020). However, the application of gene signatures is currently controversial and requires more clinical trials to verify. And immune dysfunction may be why the difference in survival observed between the patient groups defined by the gene signature (Ren et al., 2013).
Immune-related gene (IRGs) signature has the potential to improve the prognosis prediction of breast cancer patients. For example, the 10-IRG in breast cancer immune infiltration and tumor-immune interaction has been established based on the TCGA database (Ren et al., 2013). The IRGs contribute to longer overall survival (OS) by changing the abundance and checkpoint expression of tumor-infiltrating lymphocytes (TIL) in breast cancer (Li et al., 2020). The 130-IRGs helps to stratify luminal breast tumors patients further to benefit from checkpoint immunotherapy (Zhu et al., 2019). IRGs-based gene signatures served as prognostic biomarkers and potential therapeutic targets for breast cancer (Gordon and Gadi, 2020). Therefore, it is essential to establish an IRG based gene signature to predict the survival and immune infiltration status.
The paper screened out the common immune genes in TCGA, GEO, and Immport databases. And we use weighted gene co-expression network analysis (WGCNA) technology to construct a co-expression network of these overlapping genes. We applied univariate COX regression and LASSO COX regression to build gene signatures based on risk scores to improve breast cancer survival prediction. Next, the nomogram is constructed to improve the prediction of patient survival. The TCGA and GEO data sets were used to evaluate and verify gene signatures and to predict the survival of patients. The deconvolution method based on CIBERSORT obtained the proportion of 22 immune cells in patient samples. And we used TIMER algorithm to observe the infiltration changes of signature genes and 7 immune cells. Finally, we used the gene set enrichment analysis (GSEA) to analyze IRGs and obtained the different pathways between high- and low-risk patients.
We obtained transcriptome sequencing and clinical data of breast cancer patients from TCGA (https://cancergenome.nih.gov) and GEO (https://www.ncbi.nlm.nih.gov/geo/). The micro-array data set GSE42568 is queried from the GEO database for subsequent external study. The cohort contains mRNA expression data of 1097 cases of tumor tissues and 120 cases of adjacent tissues. Moreover, breast cancer patients’ clinical data included survival time, survival status, age, gender, tumor grade, pathological stage, etc. In addition, 2483 IRGs are obtained from the ImmPort database (https://immport.niaid.nih.gov). The intersection IRGs were determined between TCGA, GEO, and ImmPort databases through Venn diagrams.
Weighted gene co-expression network analysis
We used WGCNA implemented in the R platform program package to construct a co-expression network of IRGs. WGCNA is an efficient method for analyzing association patterns between genes. First, we performed a cluster analysis on the expression profile to calculate the Pearson correlation coefficient of the genes and established a correlation matrix:
Next, the adjacency matrix was built:
Finally, we constructed the topological adjacency matrix:
Finally, IRGs in the most significant modules are selected for subsequent analysis.
Development of the prognostic model
The IRGs in the significant WGCNA modules are analyzed further to obtain gene signatures highly correlated with the patient’s prognosis. We excluded samples with zero survival time or missing visit information in the clinical data. First, univariate COX regression was performed to initially identify IRGs related to the patient’s survival (P < 0.05). Then we used the LASSO COX model to construct a penalty function to get a more refined prognosis model. LASSO COX regularization can be expressed as:
We constructed a risk scoring formula by linear fitting with the obtained IRGs, which is expressed as:
where Exp is the expression value of IRGs in the sample in the model, and P is the regression analysis coefficient of each IRG after multivariate LASSO COX regression analysis.
Validation of the prognostic model
We take the median of the risk score (RS) value as the cut-off value and divide the samples into high and low-risk groups. And we use the tROC curve to evaluate the predictive ability of 1-year, 3-year and 5-year survival period, and further use Kaplan–Meier method to draw survival curves of high and low-risk groups (P < 0.05). The R package “pheatmap” was used to draw a heat map, and the R package “timeROC” was used to draw a time-dependent ROC curve.
Establishment of a prognostic nomogram
The patient’s risk score and various clinical information were used as analysis variables, univariate and multivariate COX regression were performed, and the model C index was calculated to calculate the patient’s prognosis (P < 0.05). The R package “rms” was used to construct a nomogram and a calibration chart to score the patients’ 1-year, 3-year, and 5-year survival prognosis and fit and calibrate it with the real survival situation.
Tumor-infiltrating immune cell analysis
The expression of 22 immune cells in patients was calculated through CIBERSORT. The immune infiltration differences between the high- and low-risk groups were analyzed by comparing the expression differences of immune cells between both groups. The correlation between prognostic IRGs and various immune cell infiltration is analyzed and visualized through the TIMER database.
We used “high” and “low” as phenotypic labels based on the expression value of RS predicted by patients. The R package “limma” was used to calculate the logFC value of the high and low-risk group genes. The R package “clusterprofiler” was used to perform GSEA analysis on the whole genome and run 1,000 genome permutations to obtain a standardized enrichment score (NES). P < 0.05 was used as the cut-off value for determining a significantly enriched gene set. The pathways enriched by differentially expressed genes in samples of high- and low-risk patients were obtained and visualized.
All R language packages for statistical analysis are implemented on the “R v4.0.2” platform. P < 0.05 is statistically significant in the study. TCGA data source (https://cancergenome.nih.gov/), GEO data source (https://www.ncbi.nlm.nih.gov/geo), ImmPort data source (https://immport.niaid.nih.gov); CIBERSORT website (https://CIBERSORT.stanford.edu/); TIMER website (https://cistrome.shinyapps.io/timer/).
The identification of prognostic-related IRGs modules
1279 overlapping IRGs expression data were screened for WGCNA analysis (Fig. 1A). By clustering the samples (Fig. 1B), we constructed a scale-free network in WGCNA with β = 3 (Fig. 1C). Six IRGs modules were identified (Fig. 1D). The module correlation analysis showed that blue and brown had a strong correlation (Fig. 2A). Fig. 2B is a network heat map based on hierarchical clustering of IRGs and sample data. Correlation analysis of 6 modules and multiple clinical phenotypic parameters found that the blue module strongly correlates with status (cor = 0.3, P = 0.002) (Fig. 2C). The IRGs significance average of all IRGs is used to characterize the correlation between the module and the cancer phenotype. The relationship between the blue module and each phenotype is the most significant (P = 4.7e−24) (Fig. 2D). The blue module (N = 160) was identified as a collection of IRGs related to the prognosis of breast cancer.
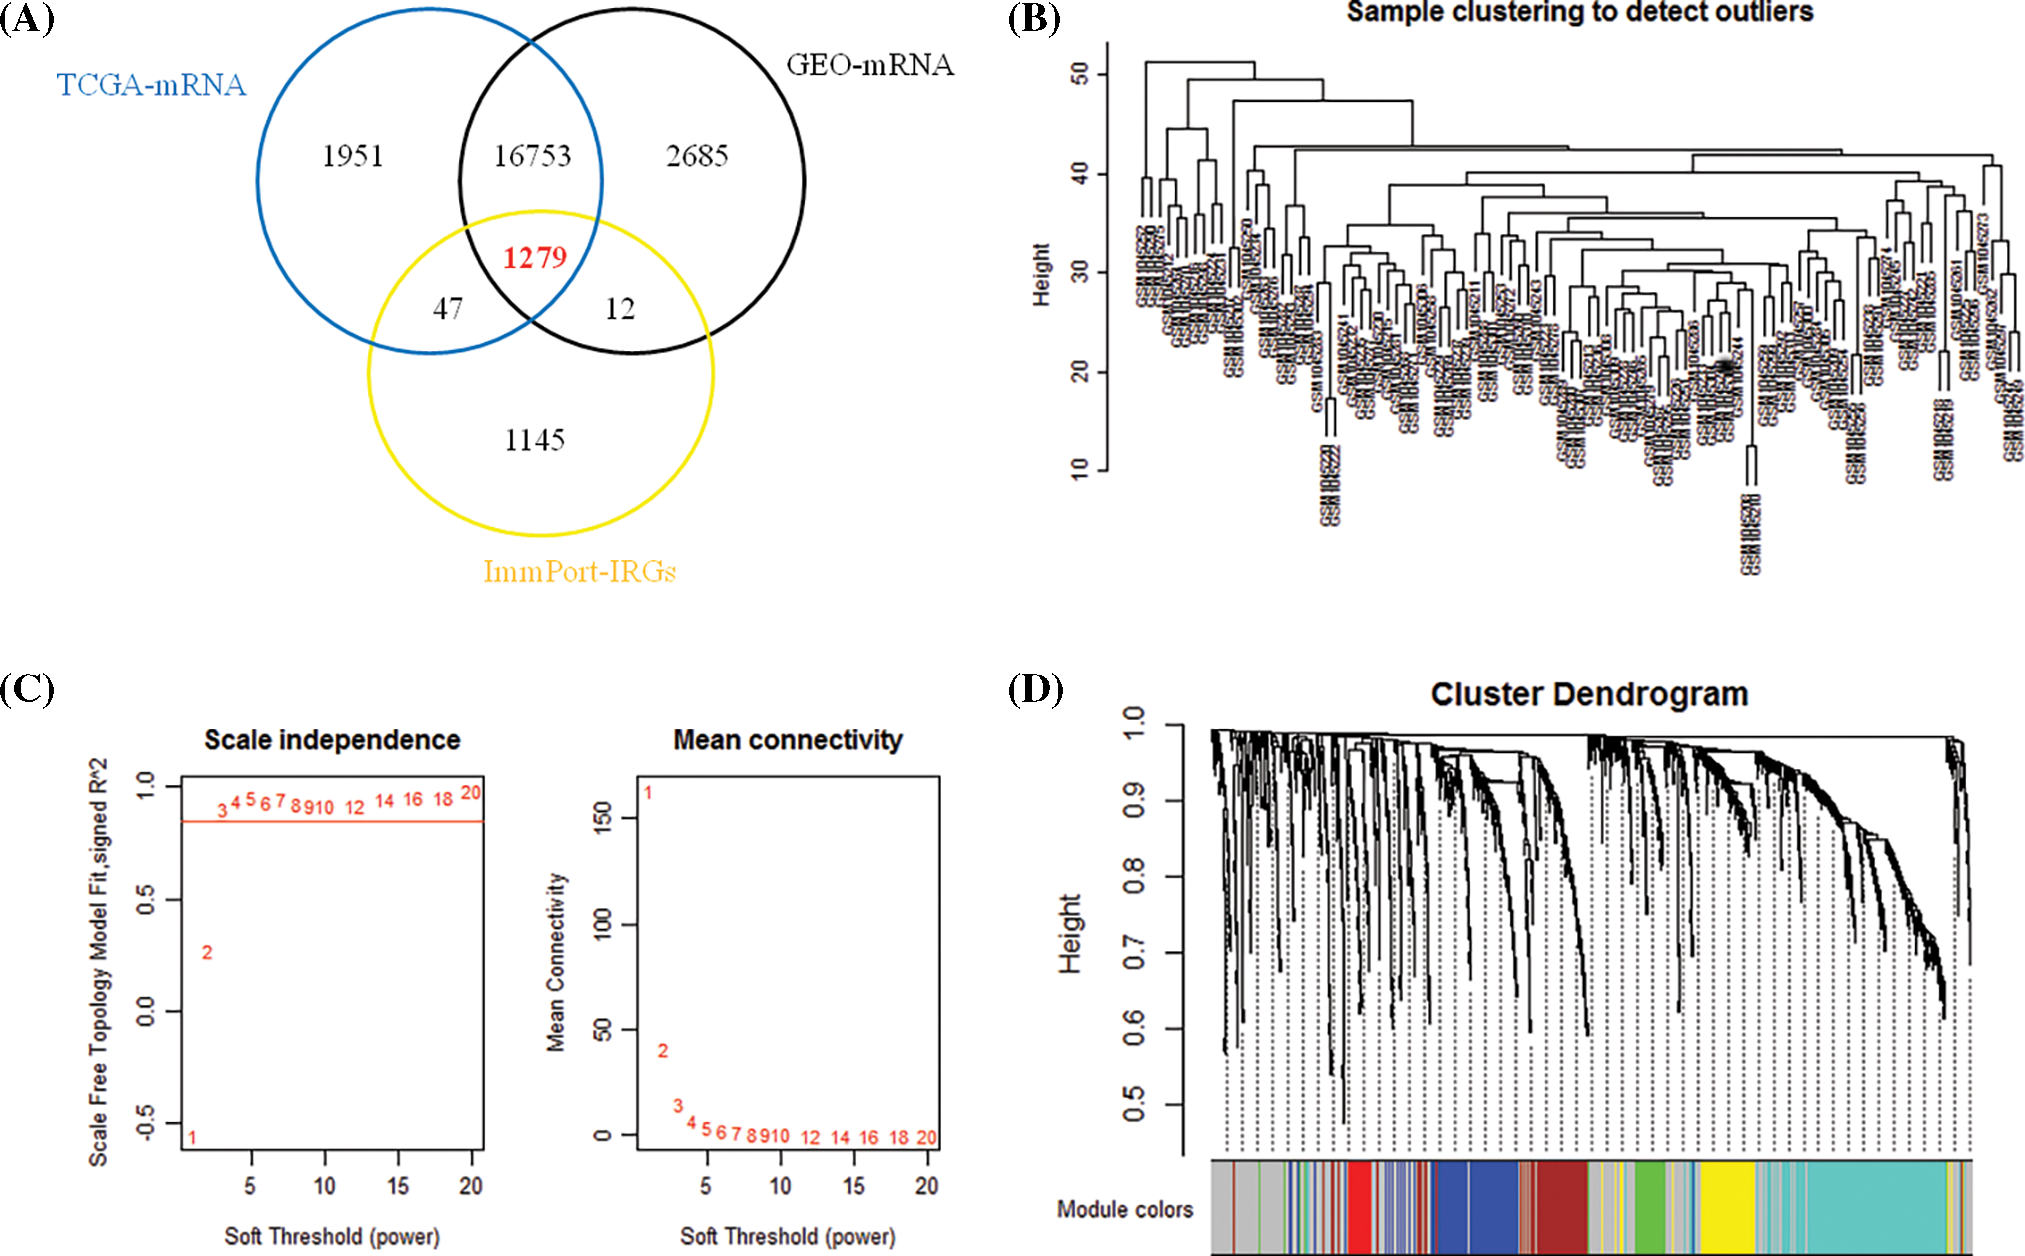
Figure 1: Determination of immune genes. (A) 1279 immune genes overlapped by the three databases of TCGA, GEO and Immport. (B) Clustering of immune genes. (C) Determining the weighted value β that satisfies the scale-free network. (D) IRGs dendrogram of gene modules, including gray modules (genes not classified as modules).
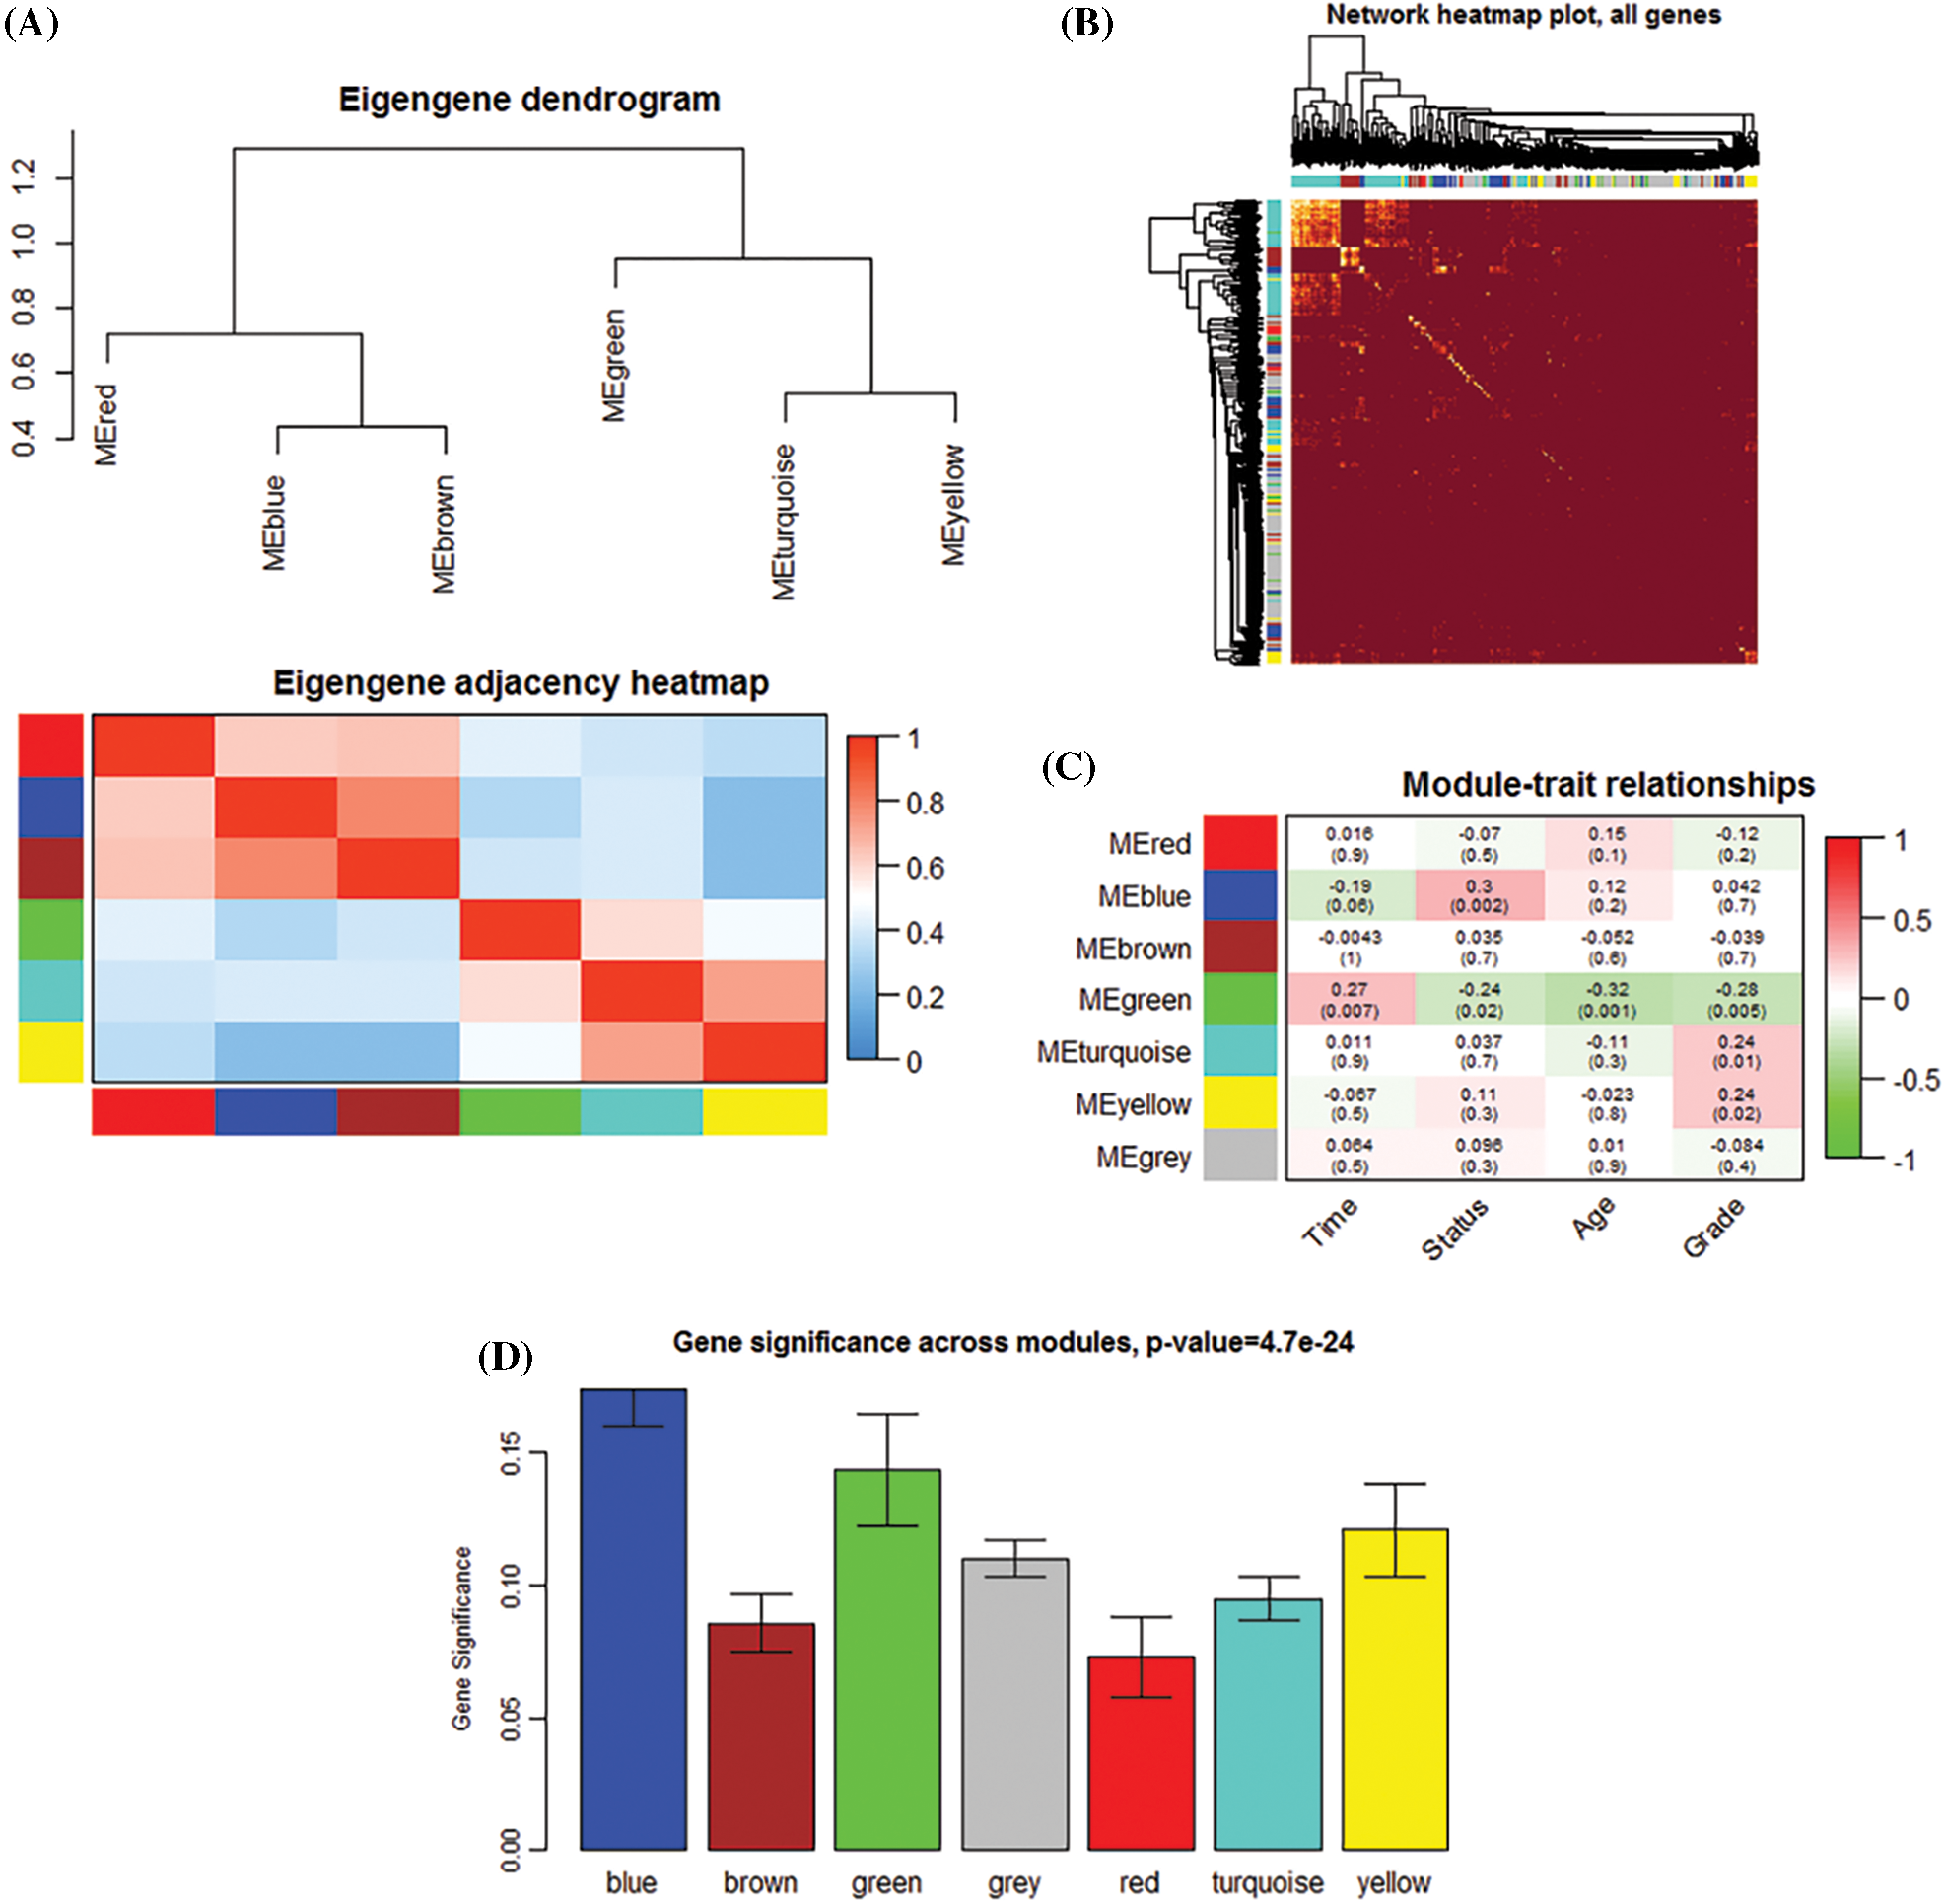
Figure 2: The establishment of a co-expression network to determine the key immune genes. (A) Module clustering and module-module correlation analysis diagram. (B) Topological overlap matrix diagram of immune genes. (C) Module and clinical traits (time, survival status, age, and grade) traits. The blue modules show a significant correlation. (D) Distribution of the gene significance of 7 modules.
Prognosis model performance in both training and validation cohort
69 IRGs significantly related to patient survival in the GEO training set were identified (P < 0.05) through univariate COX regression. The results were further optimized using LASSO COX analysis to obtain a 5-IRGs signature (IL6ST, PLCG1, PLXNA1, TBK1, and VAV3) that significantly affected the survival of patients (Table 1; Figs. 3A and 3B). Thus, the signature-based prognosis model was established. The model formula is RS = (−0.096) × IL6ST+ 0.3352 × PLCG1+ 0.3200 × PLXNA1+ (−0.1694) × TBK1+ −0.0418 × VAV3.
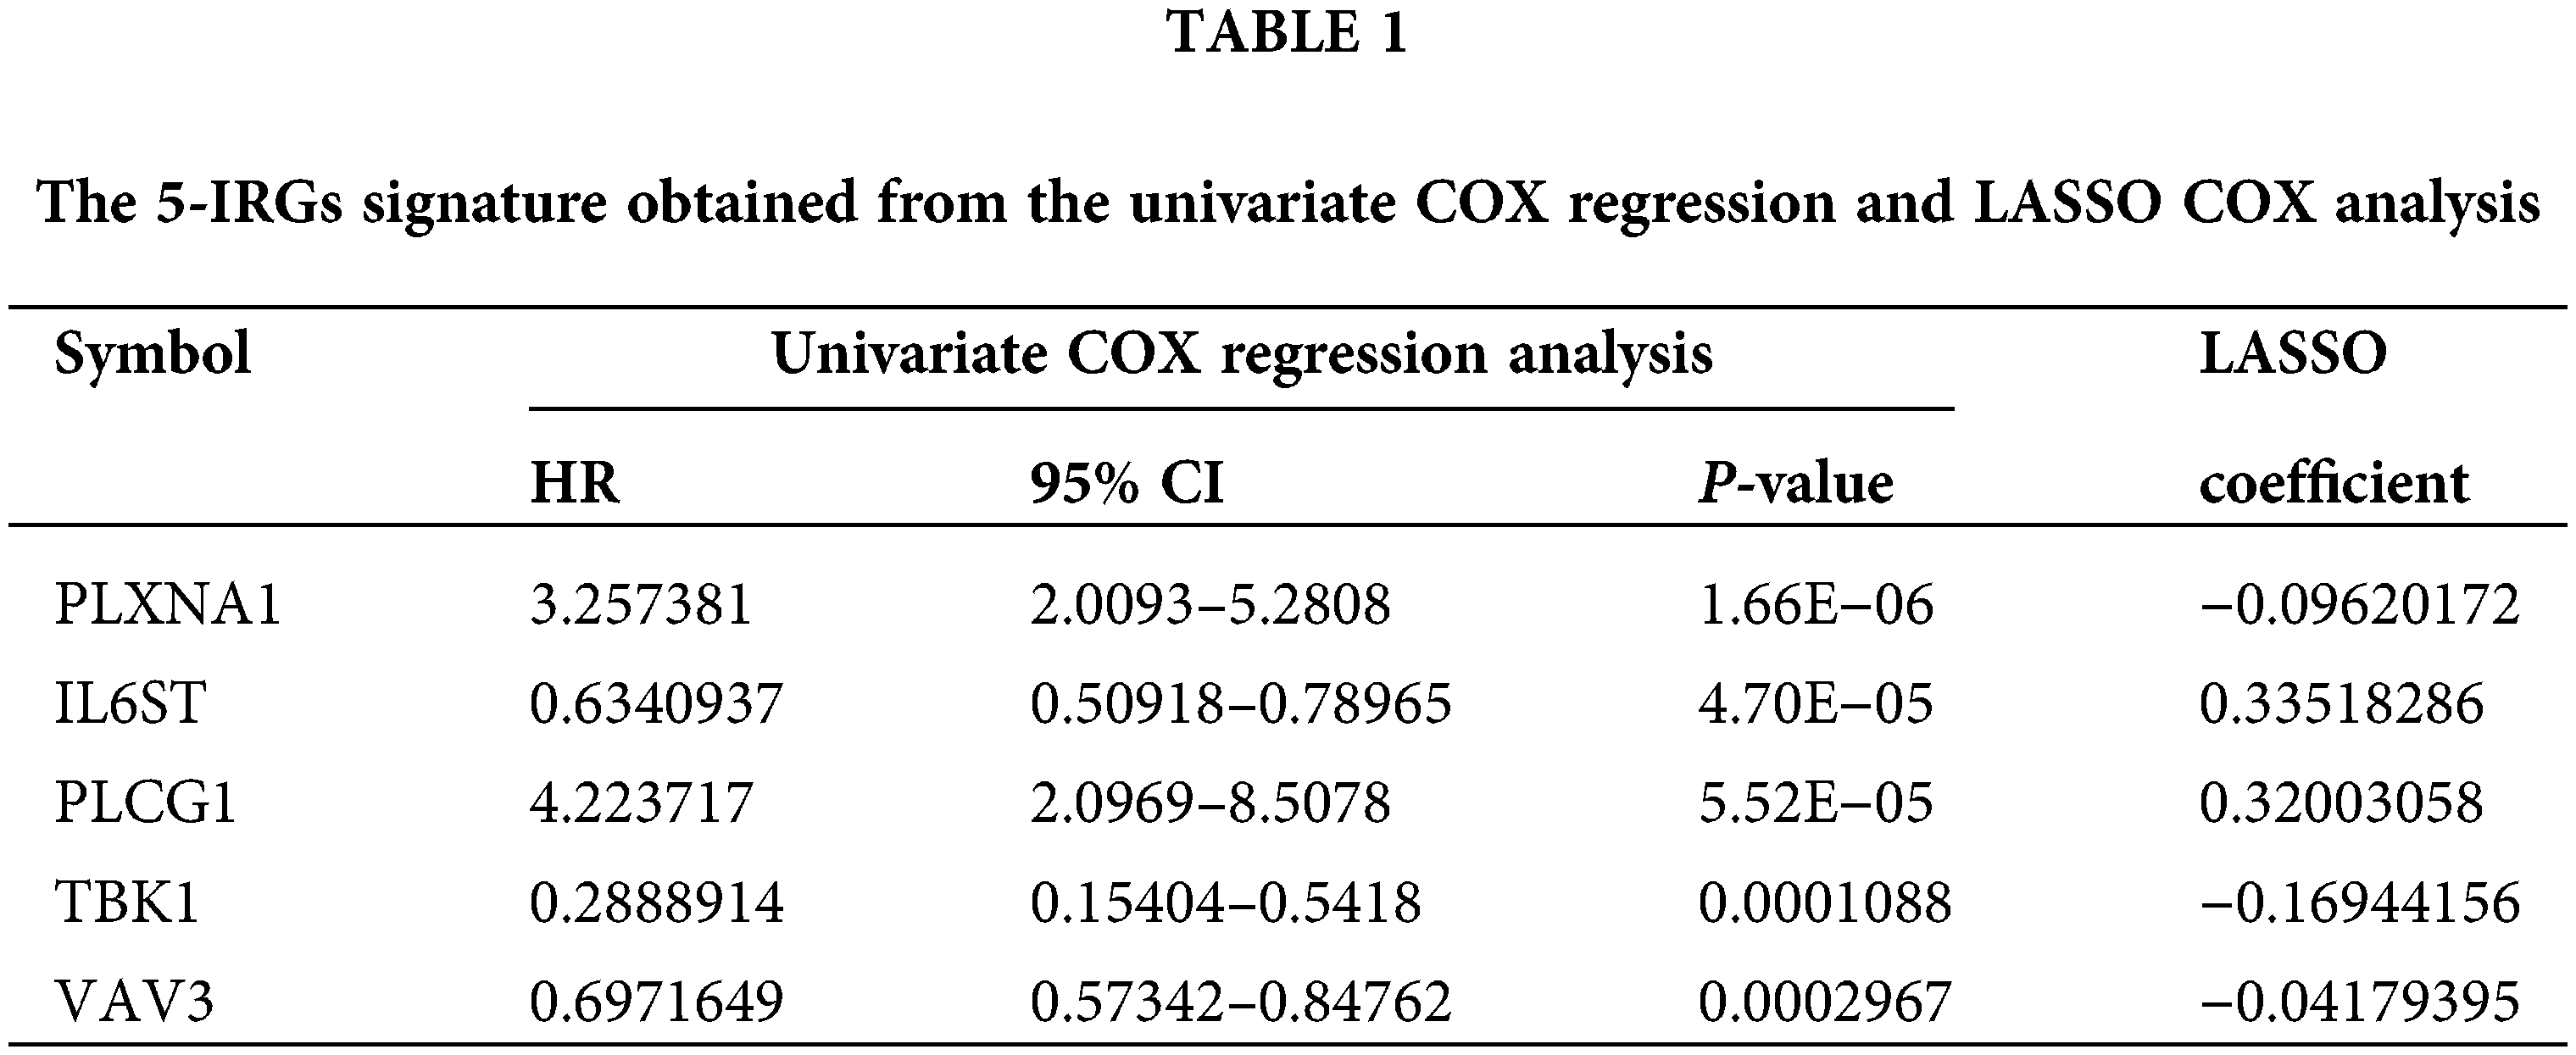
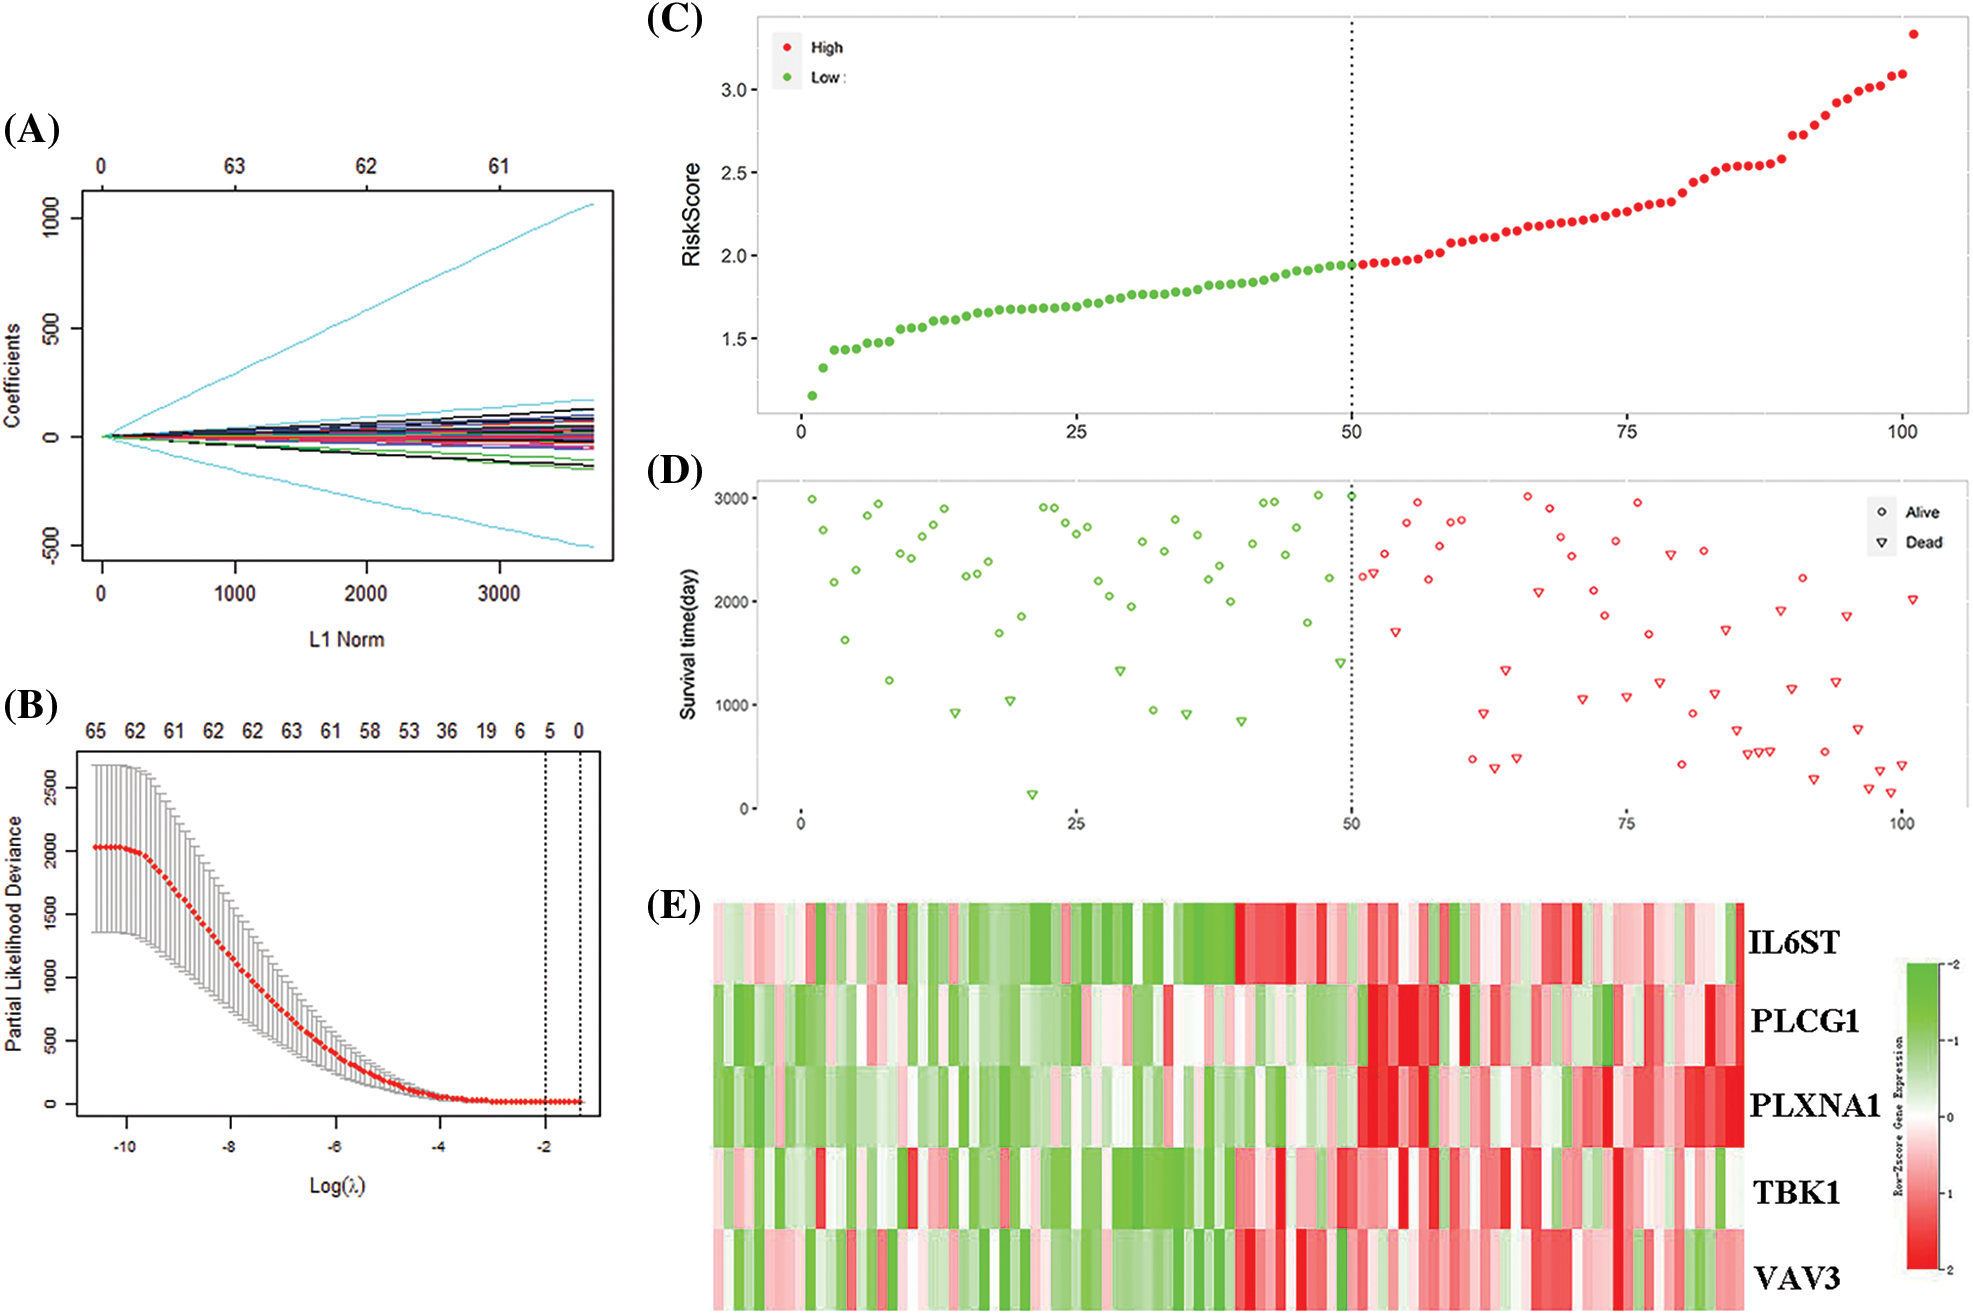
Figure 3: Model construction for predicting immune gene signatures. (A) Distribution of the coefficient in the LASSO COX model. (B) LASSO COX algorithm identified 5 gene signatures related to survival based on the ten-fold cross-coefficient verification. (C) Classification of 101 patients based on risk scores. (D) The distribution of patient survival status in the high-risk and the low-risk group. (E) The expression distribution of five important gene signatures in 101 patients.
The 101 patients in the training set were divided into low- and high-risk group by calculating the patients’ risk score (50 vs. 51, Figs. 3C and 3D). Correspondingly, the 1,037 patients fell into low- and high-risk patients in the validation set (519 vs. 518). Compared with low-risk patients, the expression of 5 IRGs signatures in high-risk patients in the training and validation cohort showed a significant up-regulation (Figs. 3E and 4). The results based on the GEO training set clarified that low-risk significantly improved patient survival compared with high-risk one (P < 0.0001; Fig. 5A). Time receiver operating characteristic (tROC) analysis shows that the risk model has outstanding predictive capability, and its 1-, 3-, and 5-year AUCs are 0.776, 0.739, and 0.765 (Fig. 5B). Moreover, the K–M curve analysis based on the TCGA validation set (P = 0.0016; Fig. 5C) and the time-dependent ROC analysis results confirmed the above results. In the TCGA validation set, the risk model predicts the AUCs of the 1-year, 3-year, and 5-year patient survival rates to be 0.657, 0.641, and 0.663, respectively (Fig. 5D).
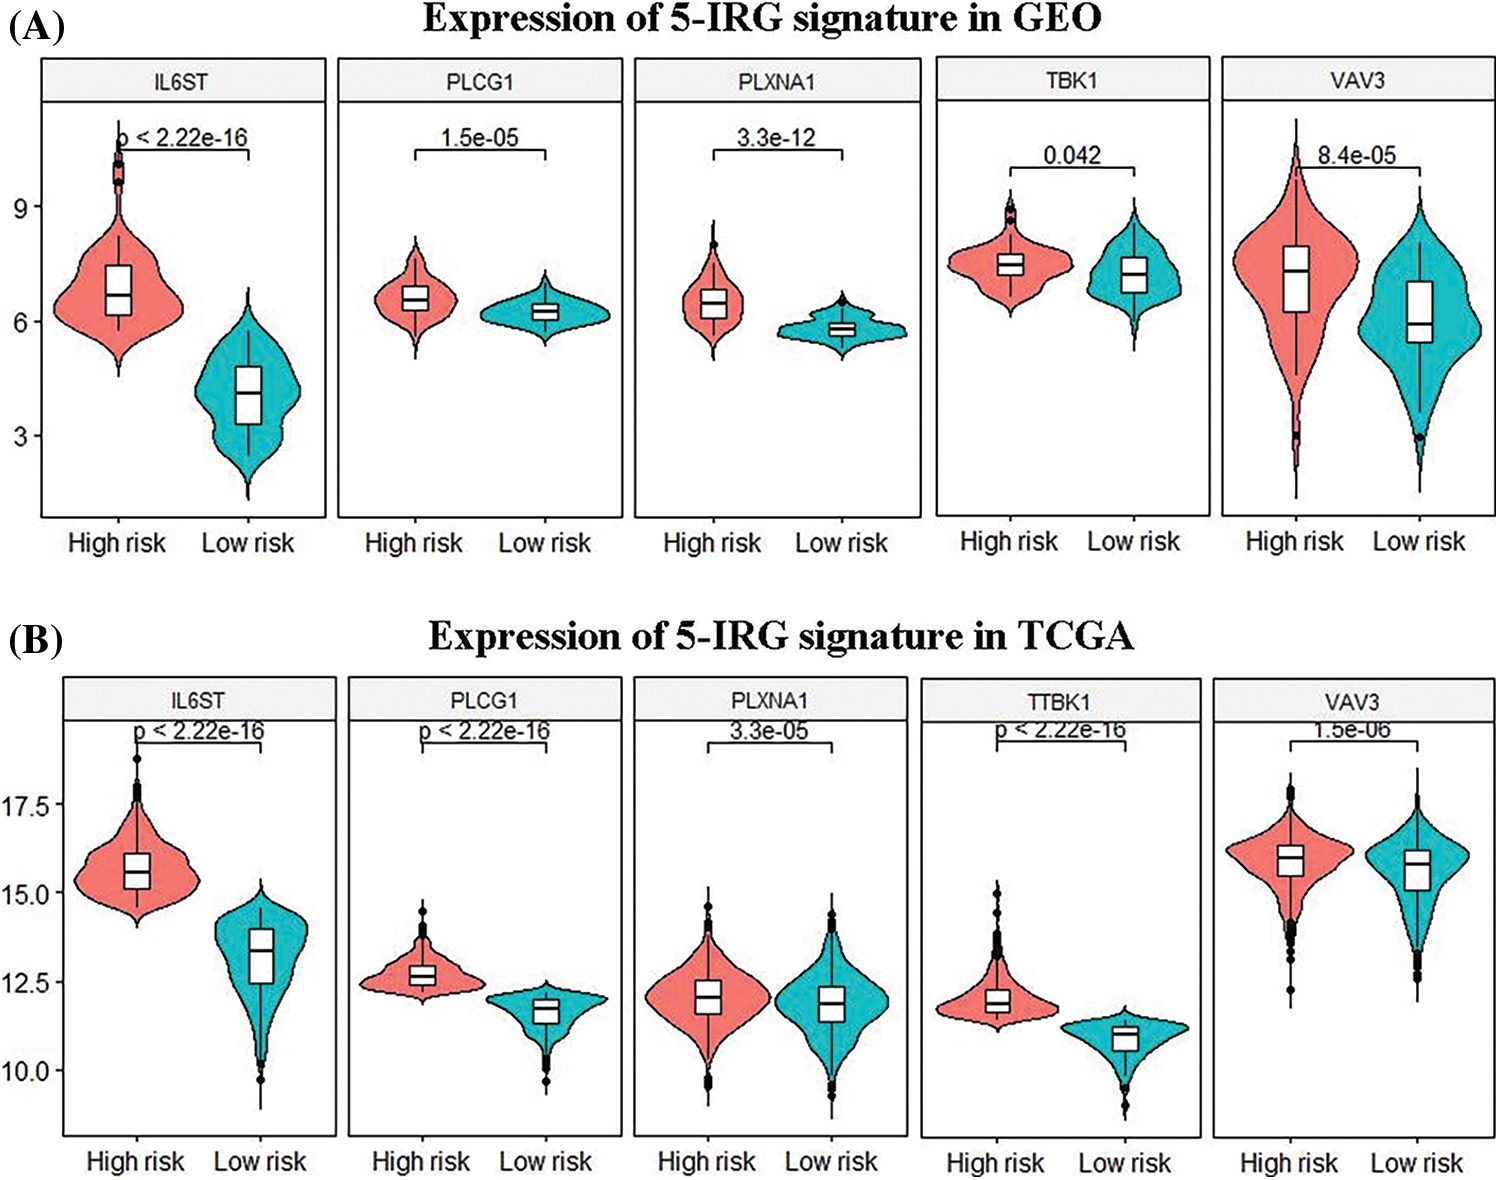
Figure 4: Differences in the expression patterns of 5 immune gene signatures in the high-risk and the low-risk group. (A, B) Based on the gene expression data in the TCGA and GEO databases, the 5 immune gene signatures in the high-risk and the low-risk group. There are significant differences between both group (P < 0.05).
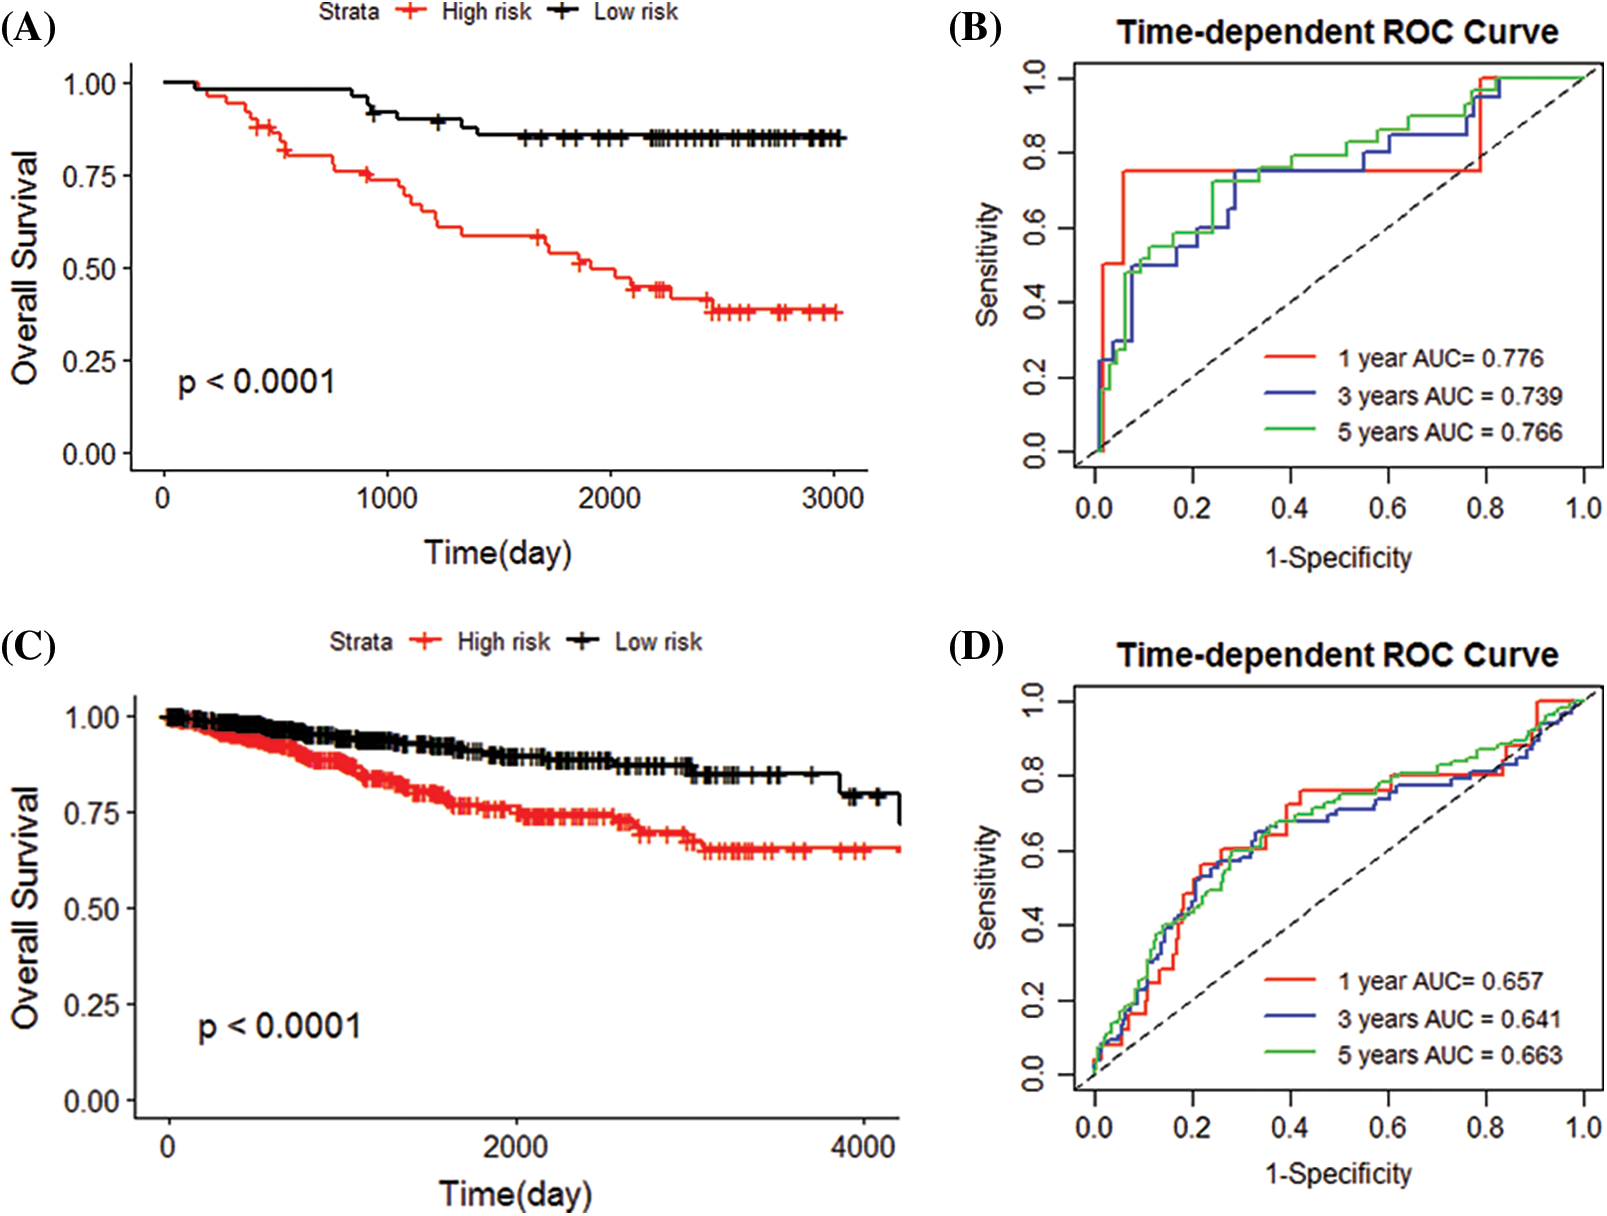
Figure 5: Evaluating the accuracy of the prediction model. (A) In the GEO cohort, the survival curve (Kaplan–Meier curve) of the high-risk and low-risk groups grouped according to the median value of the risk score showed that the survival rate of patients in the high-risk and low-risk groups was significantly different (P < 0.0001). (B) ROC curve of GEO cohort, 0.776, 0.739, 0.766 for 1, 3 and 5 years, respectively, showing that the risk score can predict patient survival. (C) The survival curve showed that the survival rate of patients in the high-risk and low-risk groups was significantly different in the TCGA cohort (P < 0.0001). (D) The AUCs of ROC curves of the TCGA cohort for 1, 3 and 5 years were 0.657, 0.641, and 0.663, respectively. The risk score shown good performance in predicting patient survival.
Incorporation of critical clinical features into the nomogram
Next, we performed univariate and multivariate COX regression on the patients’ risk score and various clinical features. The results show that risk score, grade, and stage in the training and validation set significantly correlate with the patients’ overall survival (Table 2). Subsequently, risk score and grade were incorporated into the nomogram. The training group-based nomogram (C-index = 0.82; Fig. 6A) provided a better survival prediction than that using risk score (C-index = 0.76) and grade (C-index = 0.67). The overall survival of 1-, 3- and 5-year survival rate predicted by the nomogram closely matches the best performance prediction (Fig. 6B). Consistent with the above results, in the validation set, the prognostic factor risk score (C-index = 0.64) and stage (C-index = 0.63) were compared with the risk score (C-index = 0.63), and the nomogram (C-index = 0.65) established by combining the two prognostic factors; Fig. 6C) has a better ability to predict prognosis. Simultaneously, the validation group-based calibration curve verified the prognostic prediction ability of the nomogram (Fig. 6D).
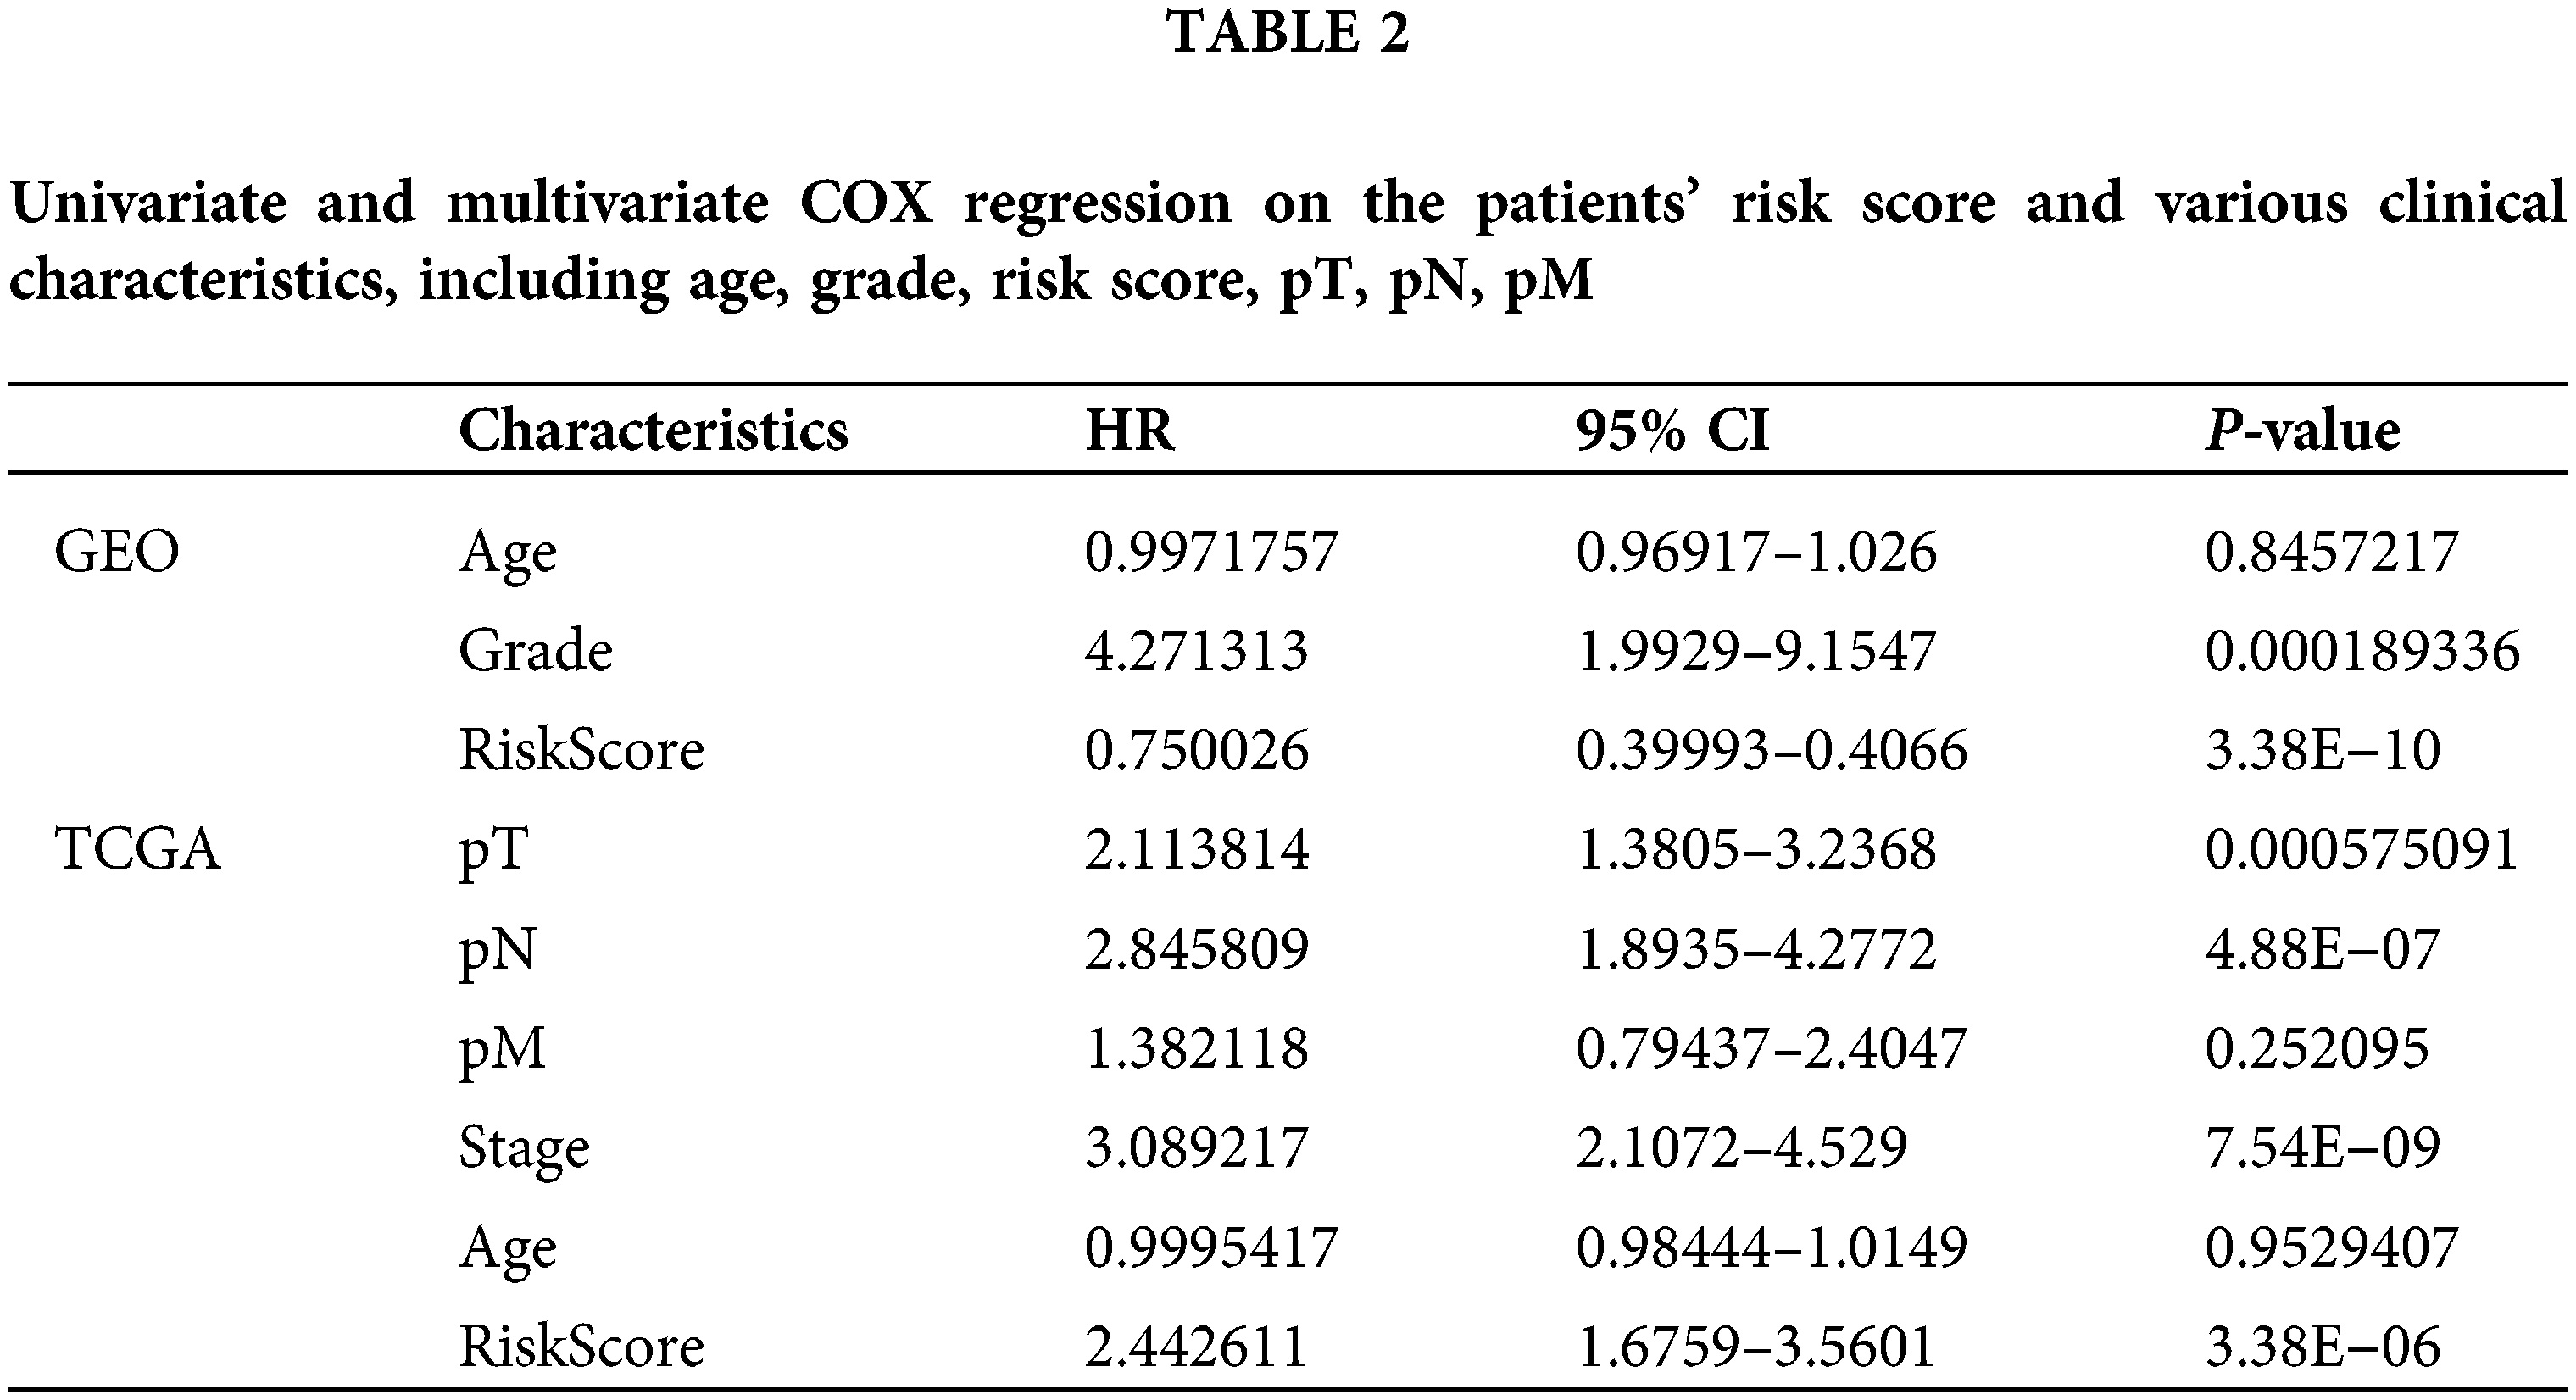
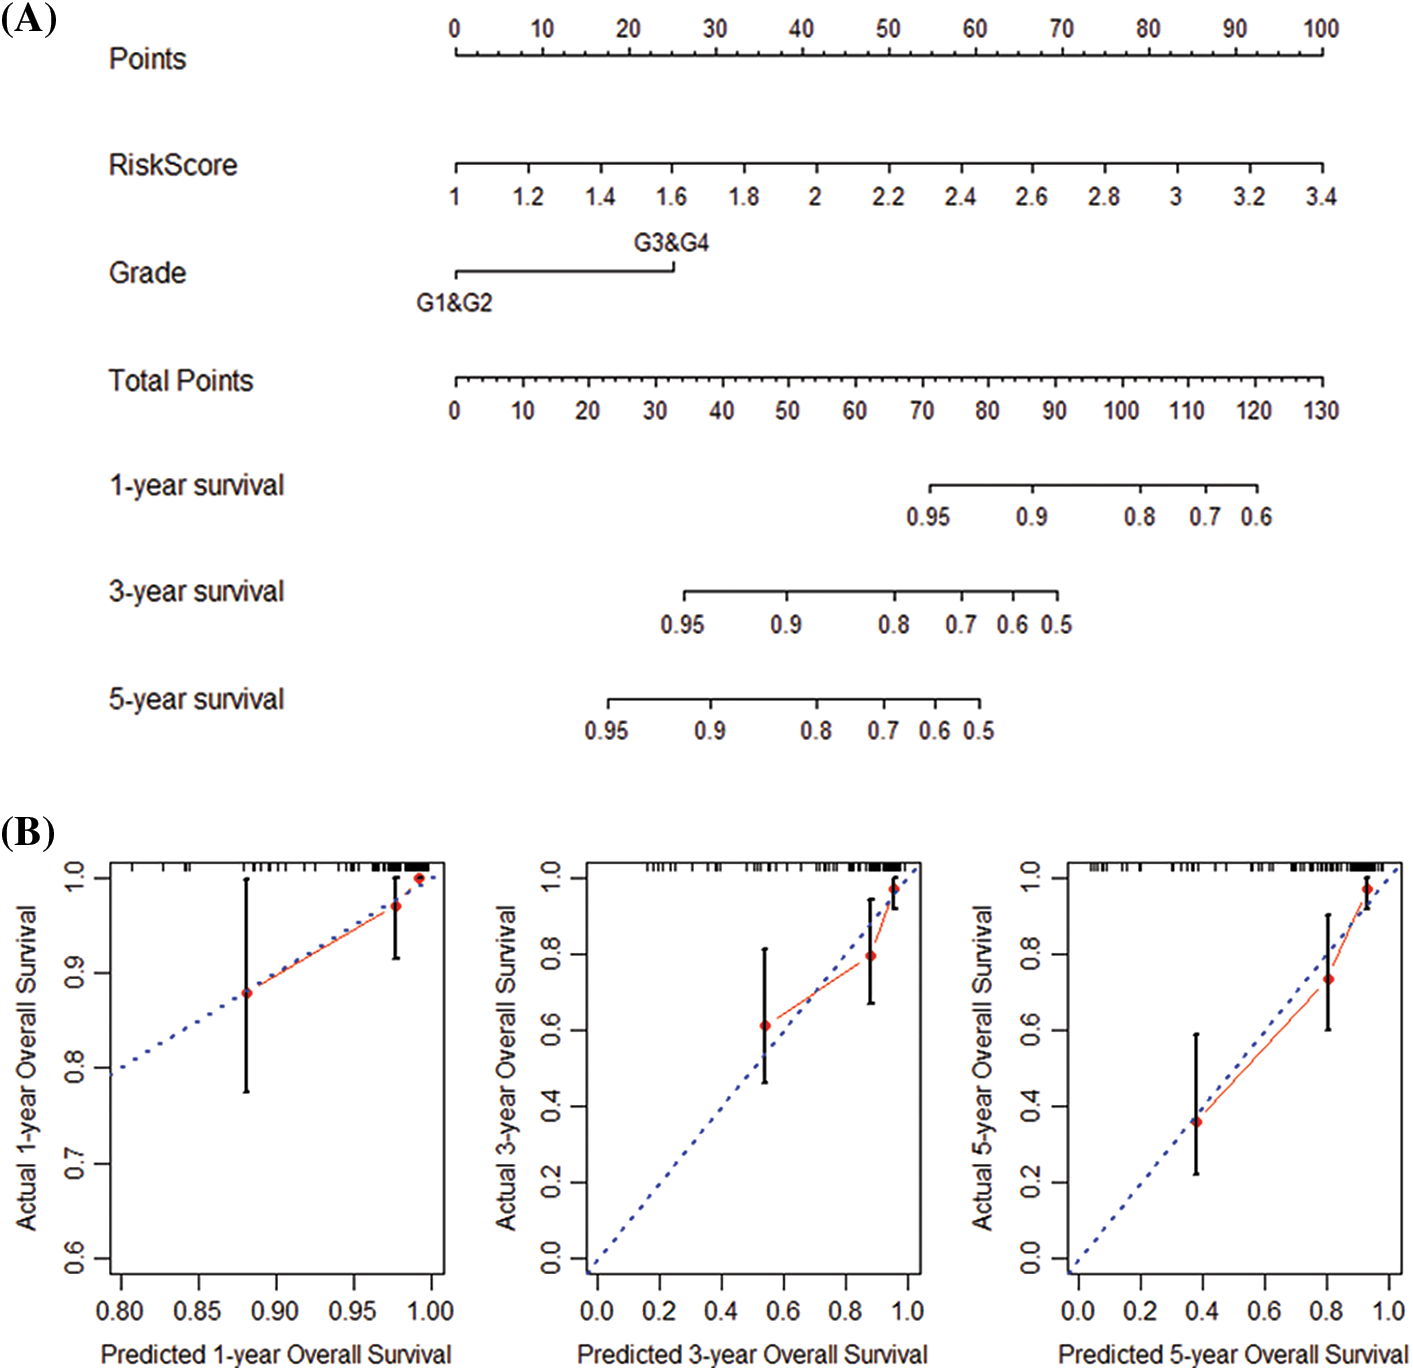
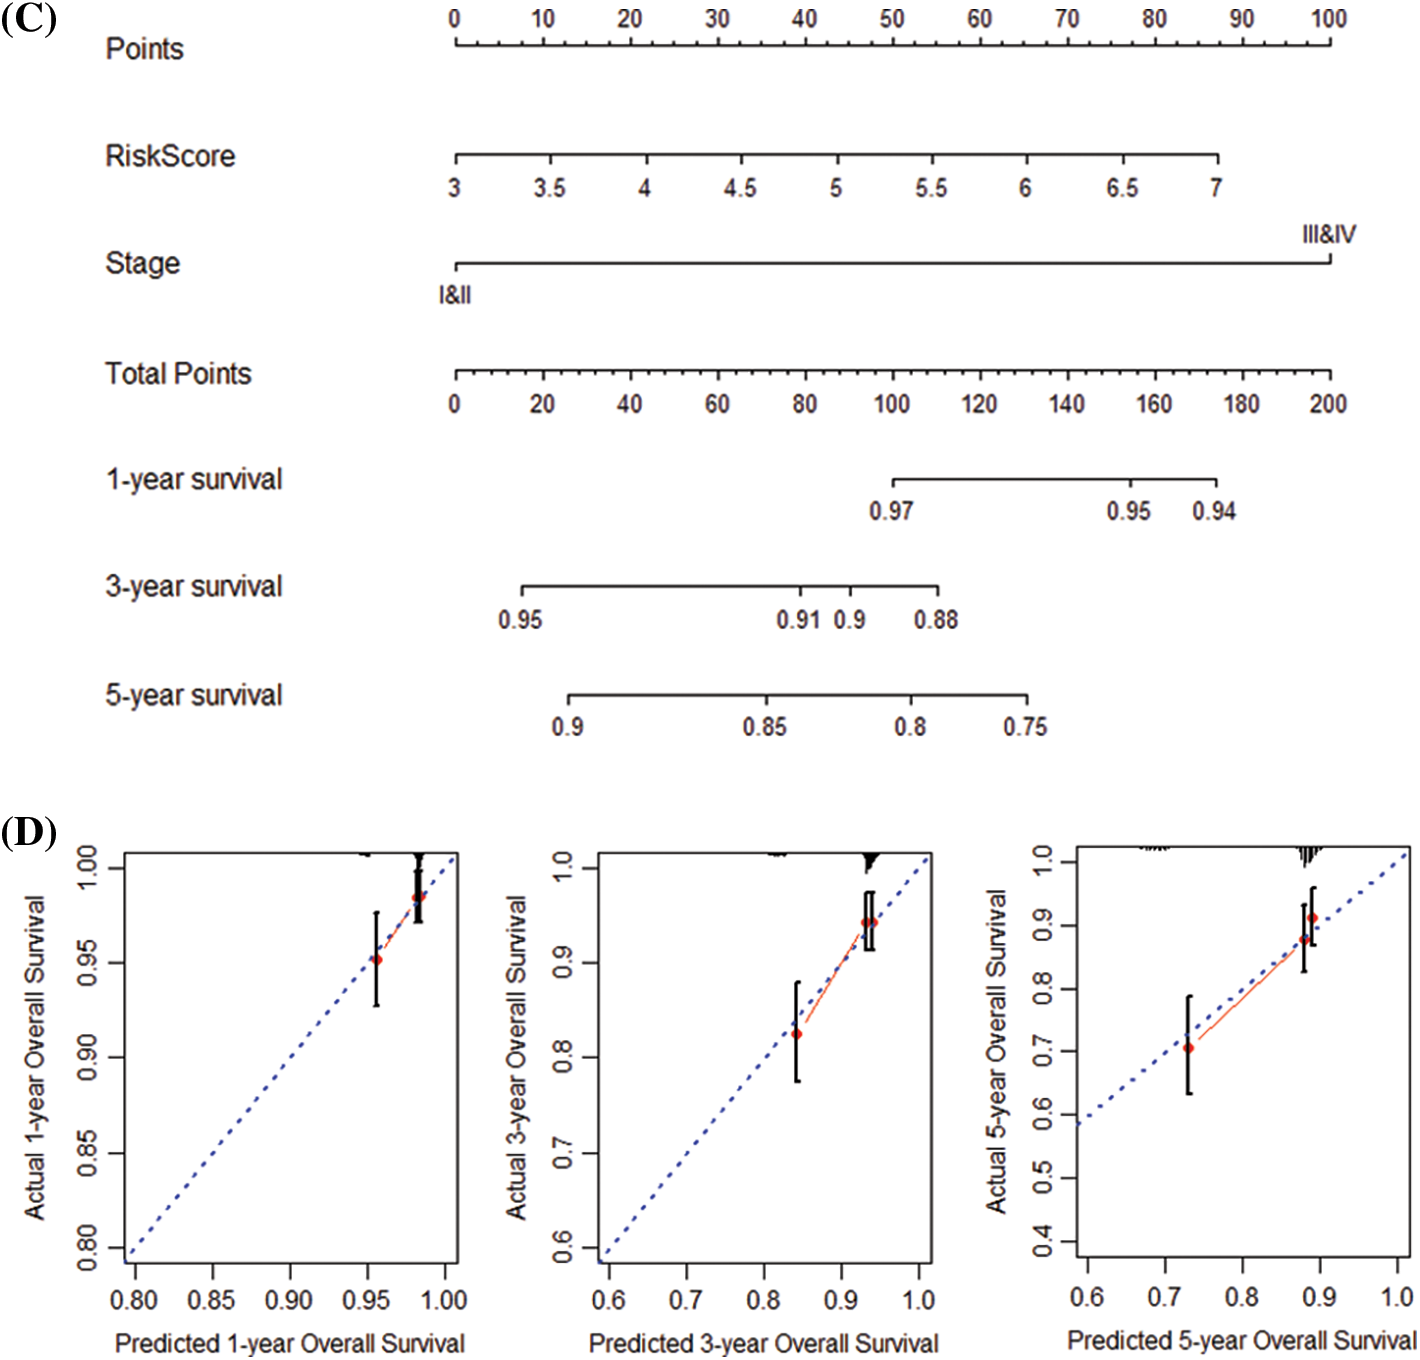
Figure 6: Construction and verification of nomogram. (A) Construction a nomogram based on the risk score and grade in GEO. (B) Prediction of the survival of 1, 3, and 5 years in GEO. (C) Construction of a nomogram based on risk score and stage in TCGA. (D) Survival prediction for 1, 3, and 5 years in TCGA.
Immune cell infiltration of risk groups
The deconvolution method-based CIBERSORT algorithm revealed the proportion of 22 immune cells of patients in different risk groups. The results of immune cells proportion in the training and the validation set show that macrophages M0, T cells gamma delta, T cells CD8, T cells CD4 memory resting, and macrophages M2 are the five most abundant immune cell types in the patients’ immune system (Figs. 7A and 7B). Difference analysis shows that there are differences in the infiltration of the 5 immune cells in high-risk and low-risk patients in the training set (Fig. 7E). The 8 types of immune cells have different infiltration differences in various risk groups in the validation set (Fig. 7F).
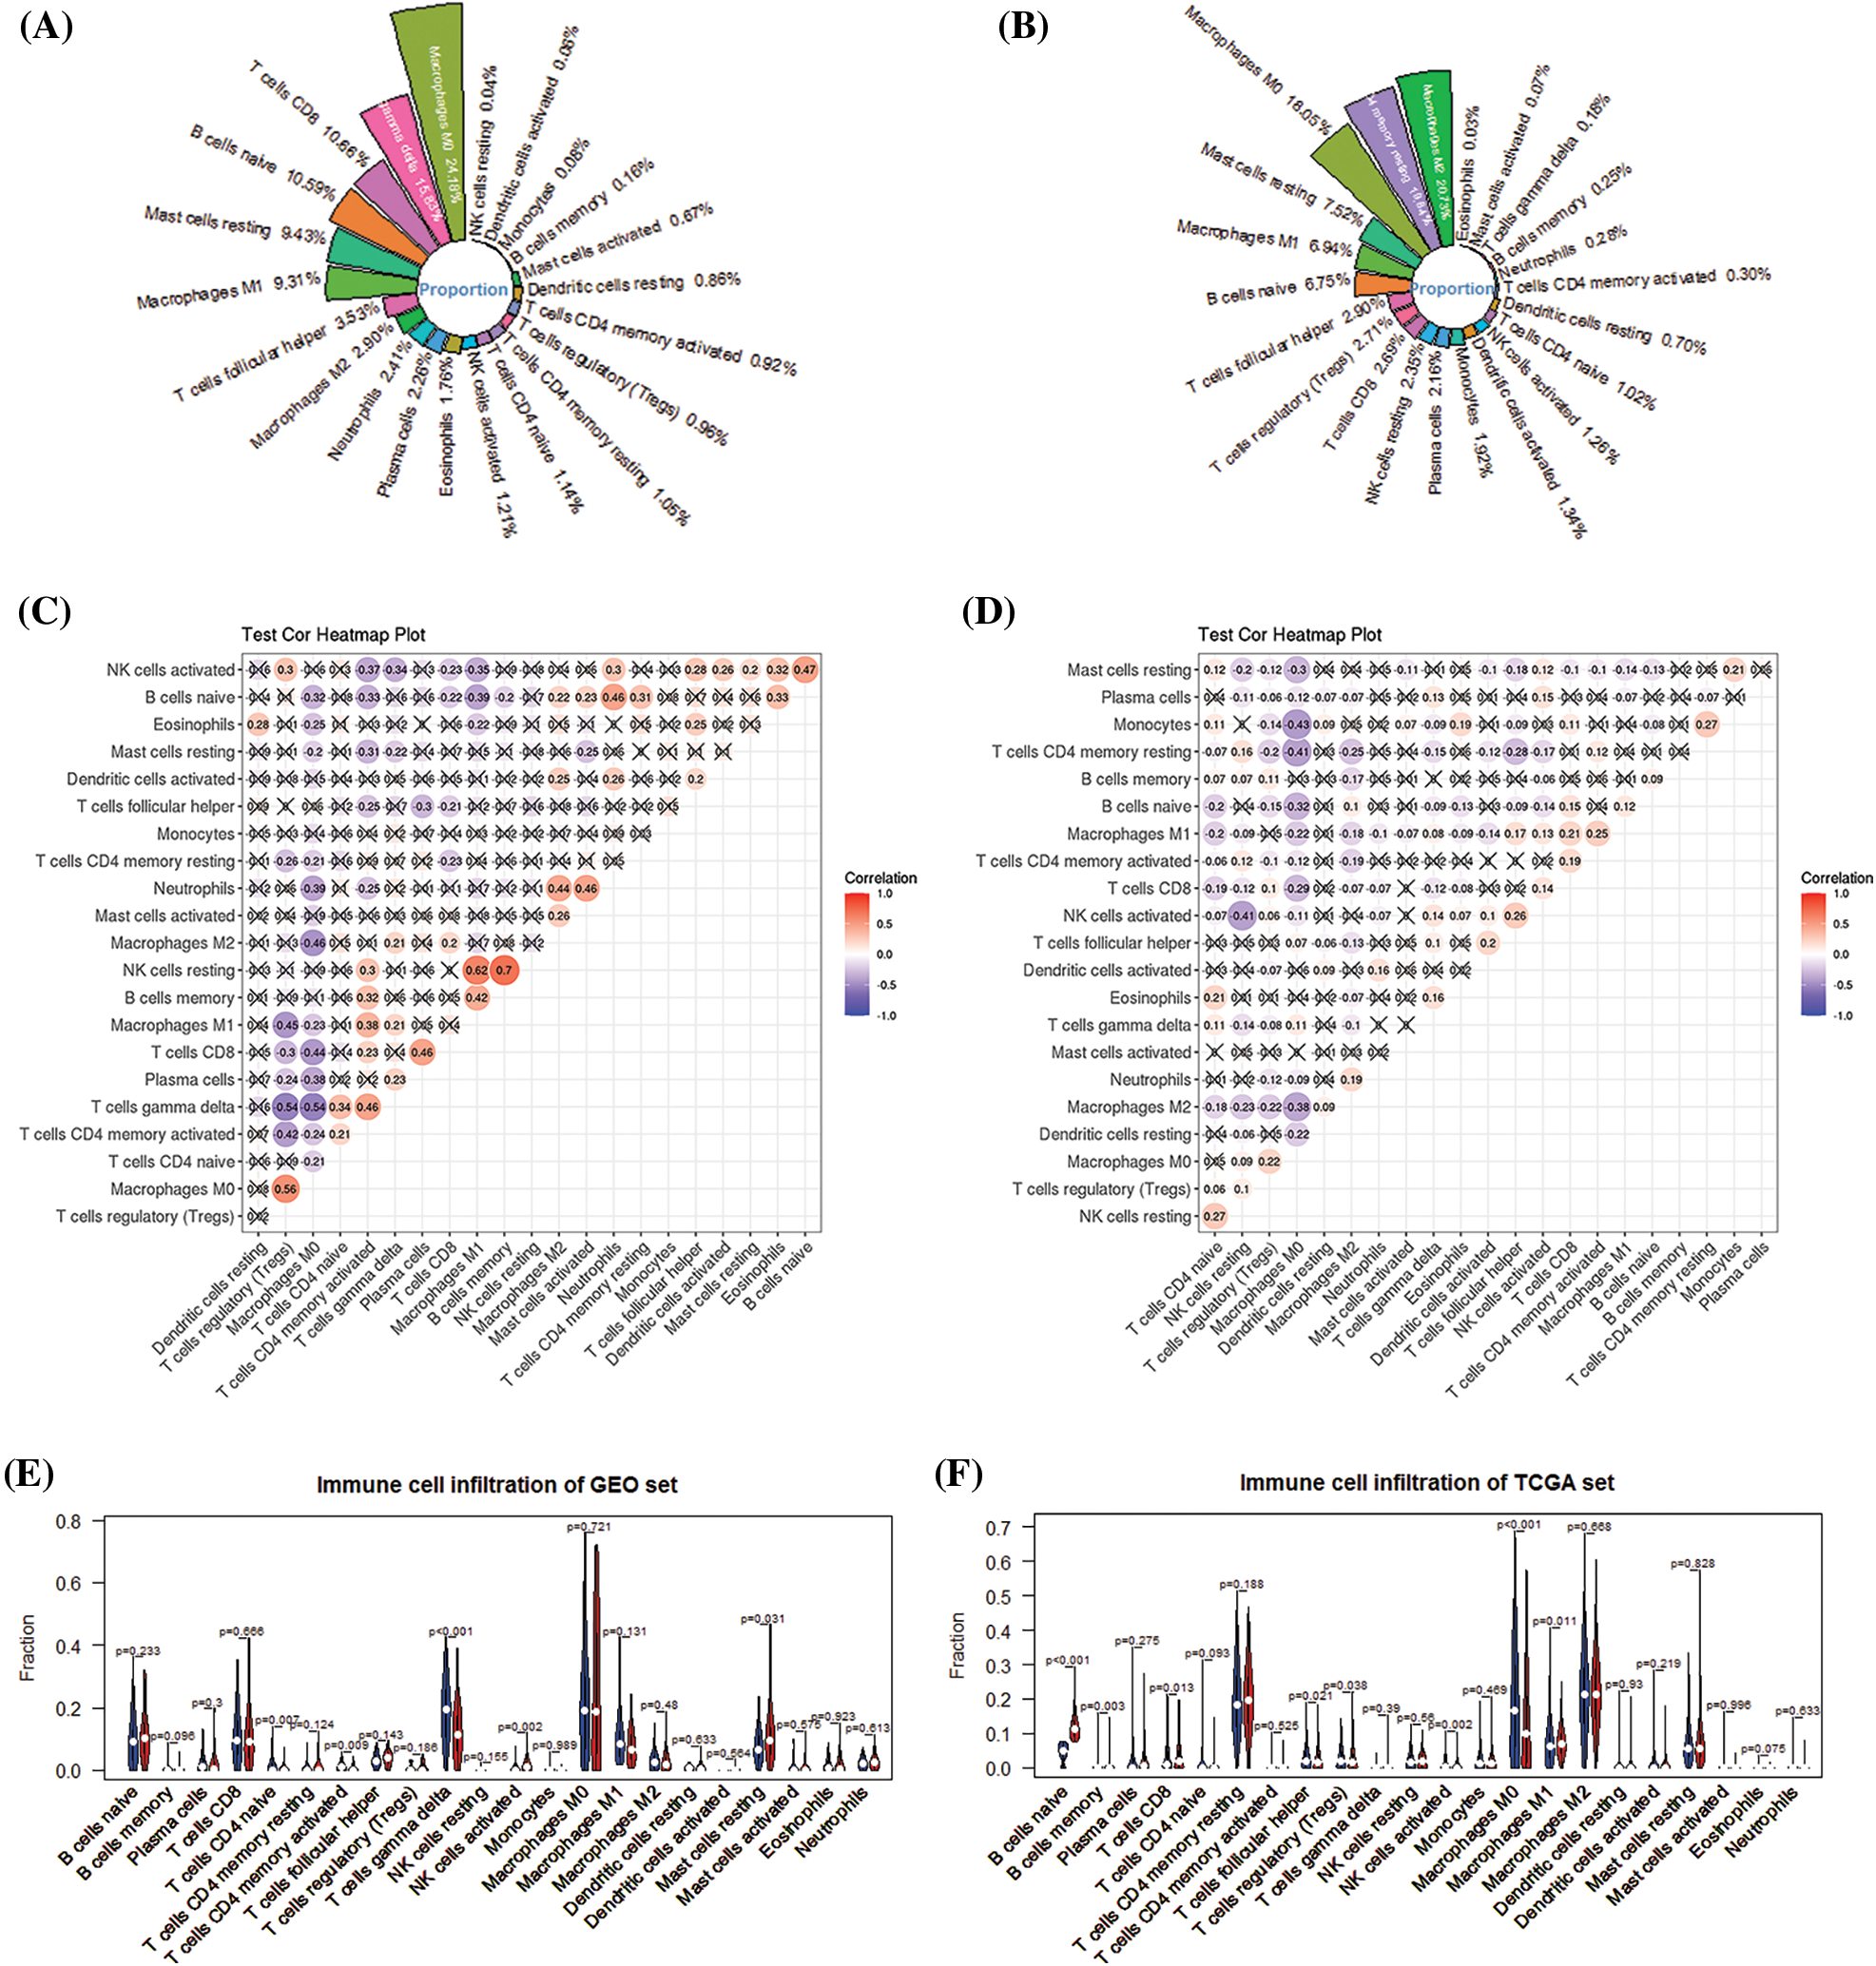
Figure 7: Analysis of the level of immune infiltration in the immune microenvironment of breast cancer. (A) Immune infiltration ratio of 22 immune cells in GEO. (B) Immune infiltration ratio of 22 immune cells in TCGA. (C) Correlation among 22 immune cells in GEO. (D) 22 immune cells in TCGA. (E) The difference in the infiltration of 22 immune cells in the high- and low-risk groups of the GEO cohort. (F) The difference in the infiltration of 22 immune cells in the high- and low-risk groups of the TCGA cohort.
TIMER obtained the immune infiltration changes mediated by prognostic markers of IRGs (Fig. 8). The results showed that in the prognostic signature of 5-IRGs (IL6ST, PLCG1, PLXNA1, TBK1, and VAV3), the high expression of each IRG significantly increased the infiltration level of 6 immune cells. And the low expression of PLCG1 and PLXNA1 significantly promotes the purity of the tumor, and the increased expression of TBK1 and VAV3 can significantly promote the tumor’s purity.
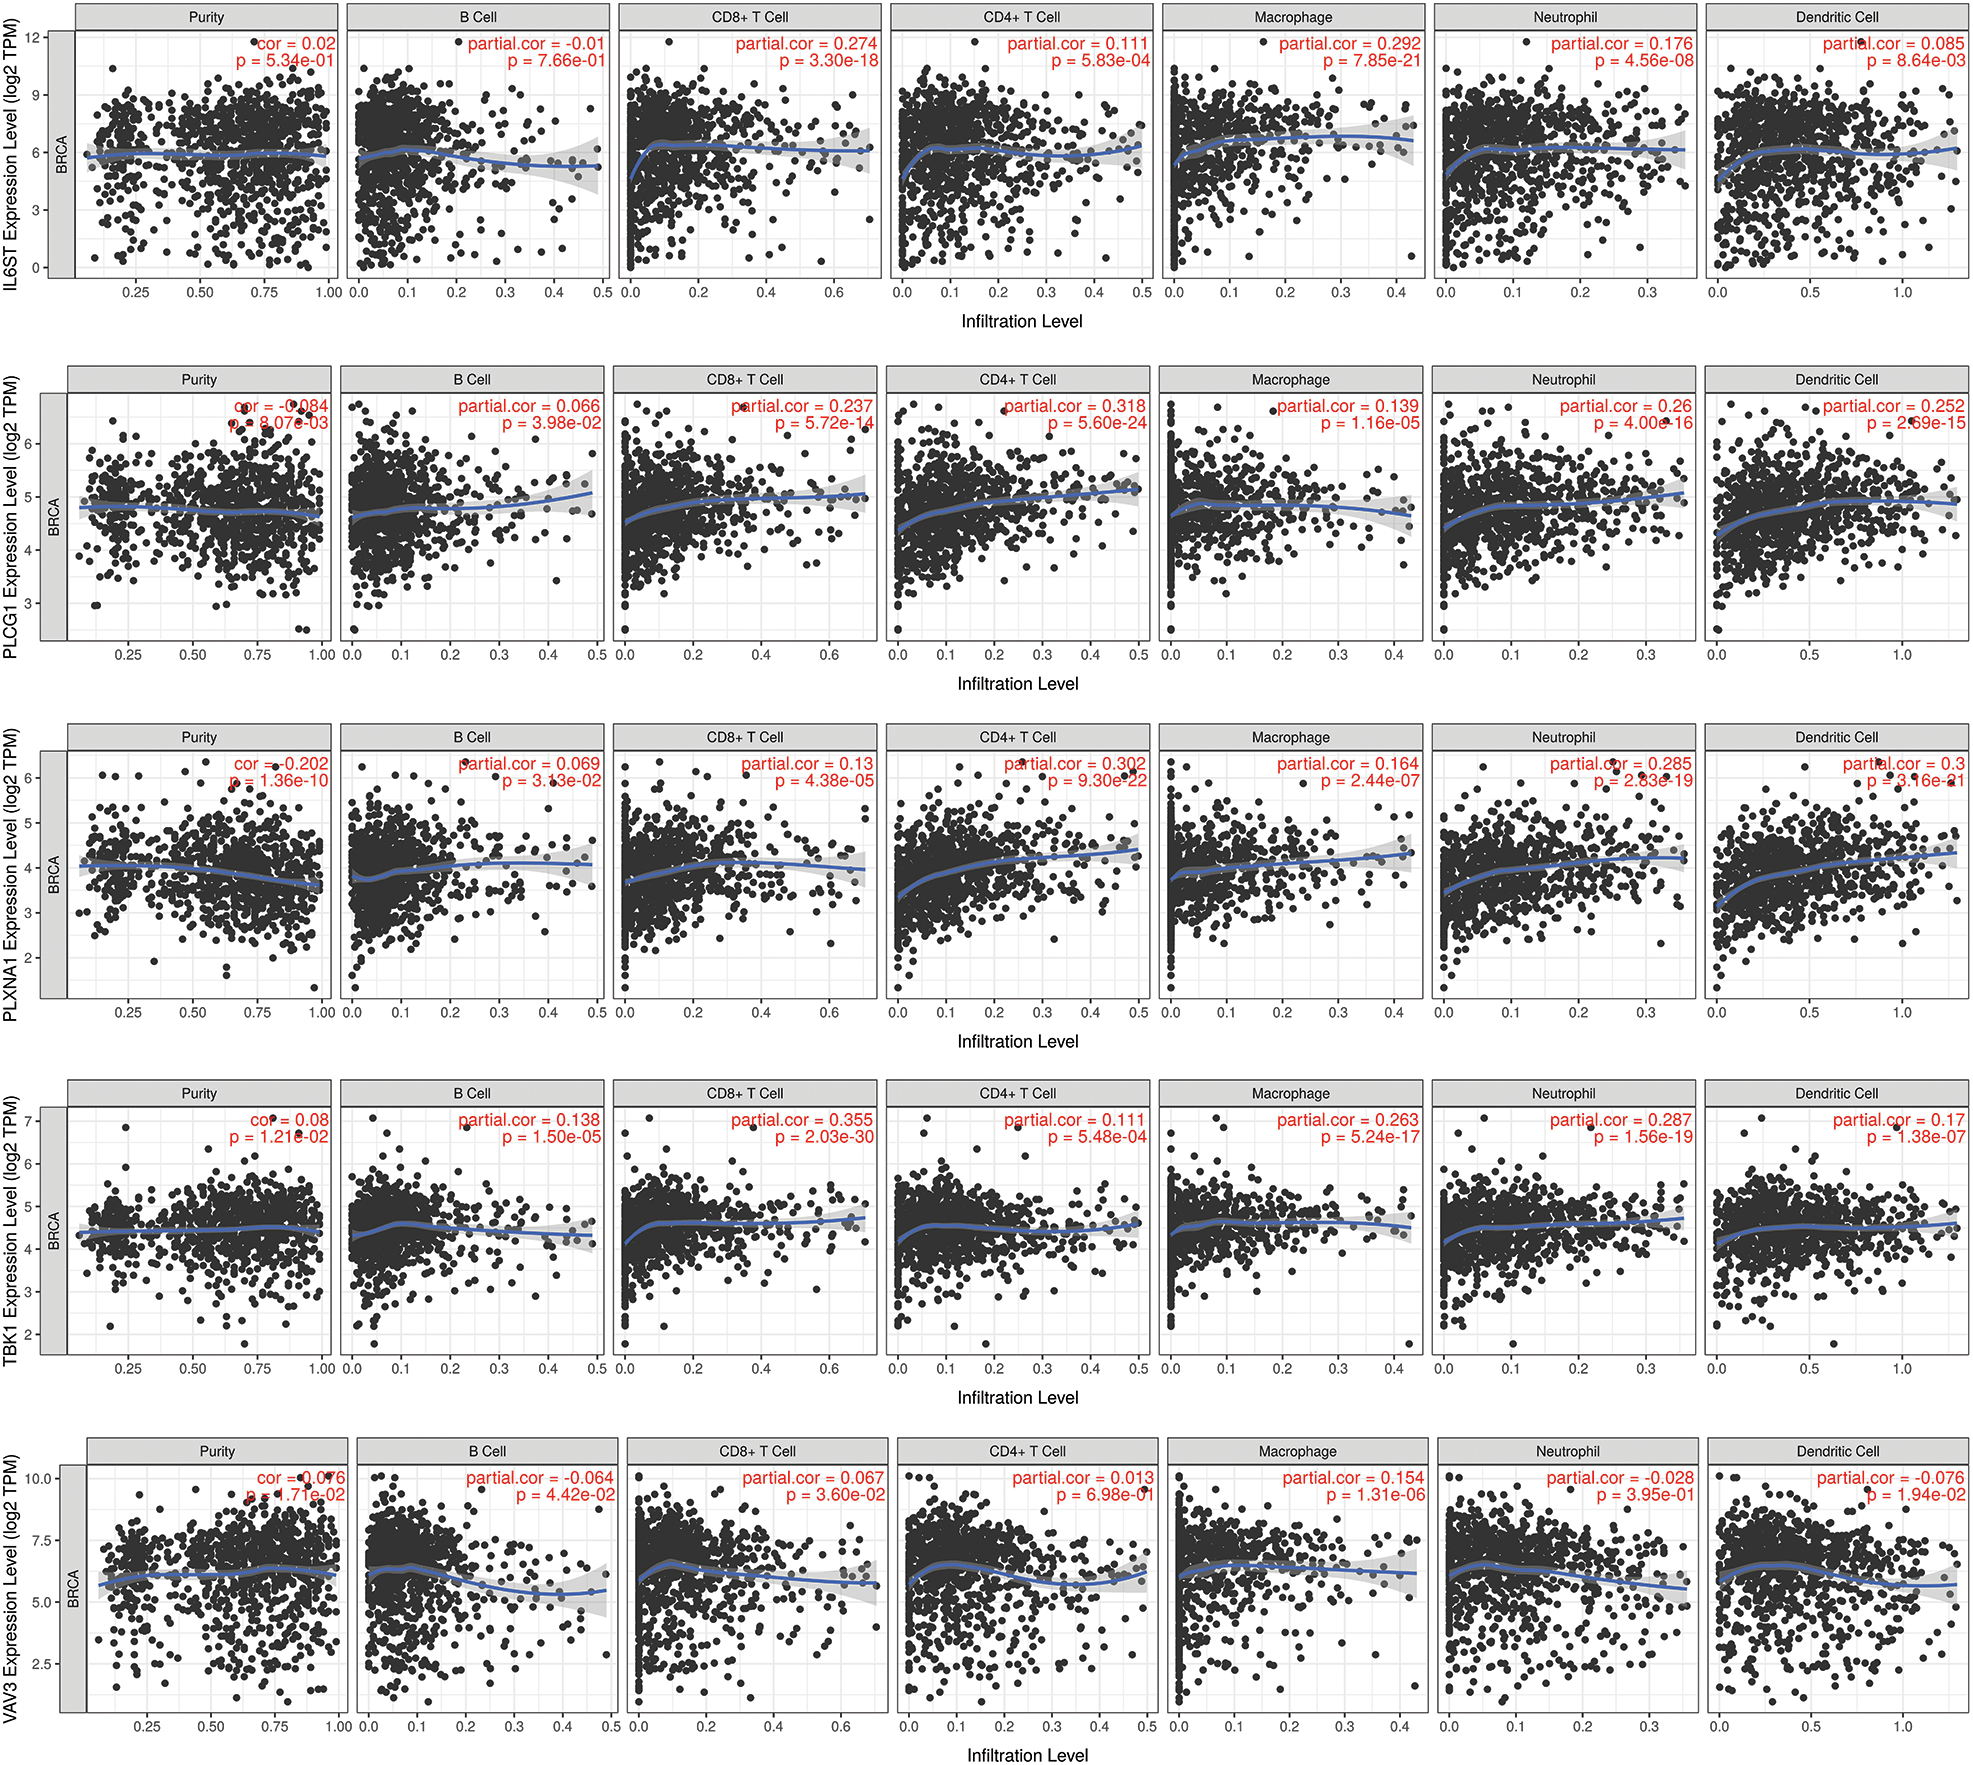
Figure 8: TIMER analysis. The prognostic marker-mediated immune infiltration changes were obtained through TIMER to prove the intuitive gene regulation.
Pathway Differences GSEA shows 6 pathways that differ between high- and low-risk patients (Fig. 9). The 6 pathways are cytokine signaling in immune system, developmental biology, innate immune system, proteasome, adaptive immune system, cell cycle and GPCR ligand binding.
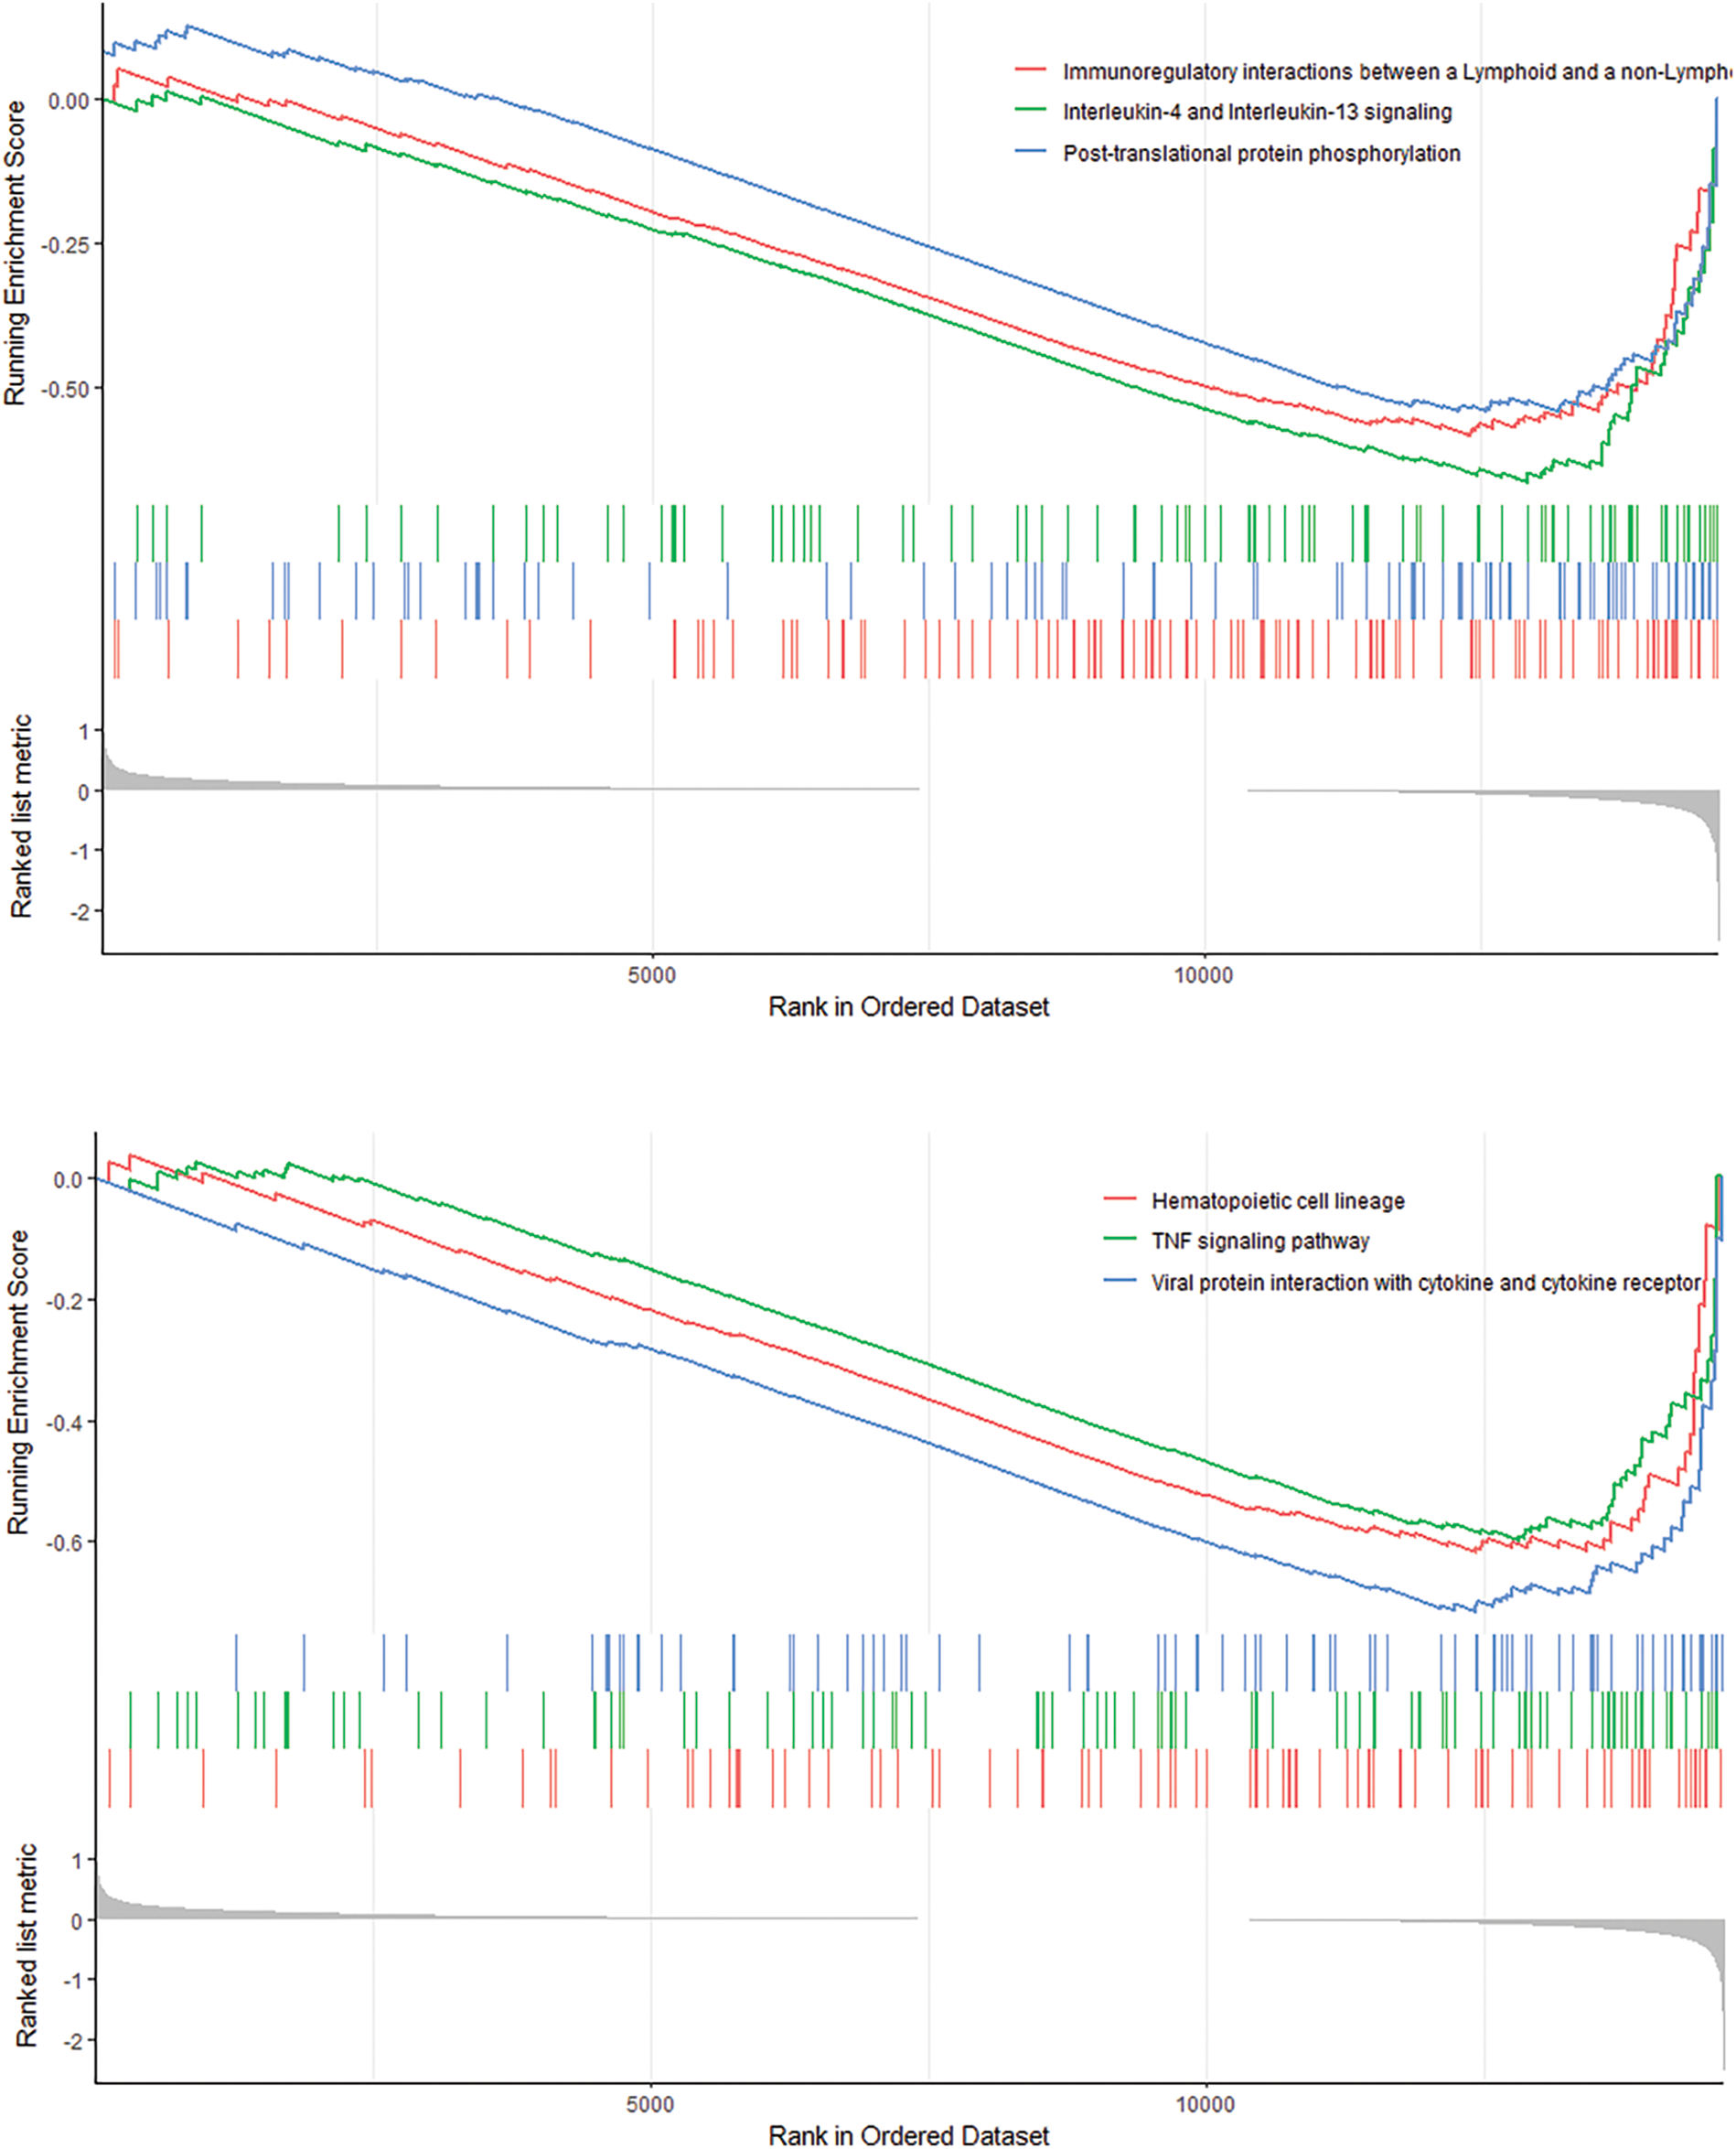
Figure 9: GSEA analysis revealed 6 pathways that there are significant differences between high-risk and low-risk patients.
Breast cancer is a disease that seriously threatens women’s health worldwide. Prognostic prediction is the most effective way to reduce breast cancer mortality (Desantis et al., 2011). However, it is difficult to achieve this goal due to the lack of specific biomarkers. The study used WGCNA to construct a co-expression network to screen out highly immune-related prognostic genes. Subsequently, the 5-IRG genes signatures were successfully constructed from highly IRGs through COX regression and LASSO COX analysis. The survival and tROC curves show that the prognostic signature has a strong predictive capability. Then, a nomogram composed of risk score and grade markers was constructed by combining with the risk score of the prognostic signature and multiple clinical characteristics. CIBERSORT and TIMER algorithm-based analysis confirmed significant differences in tumor-infiltrating immune cells between high- and low-risk groups. Besides, GSEA shows 6 pathways that differ between high- and low-risk patients.
We successfully constructed a prognostic signature based on IRGs through WGCNA and LASSO COX algorithms for the prognostic stratification of breast cancer. The LASSO COX algorithm solved the over-fitting problem that often occurs in the construction of prognostic models in the past (Meng et al., 2020). The risk score based on the prognostic signature showed that the overall survival of patients in the high-risk group was significantly shorter than that of the patients in the low-risk group. Moreover, the nomogram shows good performance in predicting the overall survival rate. The tROC analysis shows that the AUCs of the 1-, 3-, 5-year OS is 0.776, 0.739, and 0.766, which is comparable to the previous models (Piñero-Madrona et al., 2020; Wu et al., 2021), indicating our model has good prognostic performance.
The study uses various bioinformatics analyses to determine potential immune targets related to the prognosis of breast cancer. The immunotherapy and prognosis of breast cancer previously discussed by authors did not screen prognostic genes (Baxevanis et al., 2021; Choi et al., 2017). However, we conducted a WGCNA analysis to identify the modular genes most related to breast cancer prognosis. In addition, previous studies did not report the immune infiltration characteristics of the prognostic biomarkers of breast cancer (Chen et al., 2015; Wang et al., 2020). In the study, the TIMER and CIBERSORT algorithms calculated the change of immune cell infiltration, which promotes prognosis prediction in breast cancer. And we performed univariate COX regression and LASSO COX to determine 5-IRGs signature. These results provided a prospect for exploring breast cancer-related treatment methods and prognostic prediction.
The 5-IRGs signatures demonstrated good predictive capability for patients’ survival. IL6ST (gp130), an essential signaling subunit of interleukin-6 cytokine family receptors, plays a vital role in promoting the growth and metastasis of breast cancer (Ibrahim et al., 2017; Ren et al., 2013). Besides, IL6ST serves as a potential therapeutic target for breast cancer and participates in cancer development (Selander et al., 2004; Tian et al., 2019). PLCG1 is highly correlated with tumorigenesis and the development of breast cancer. PLCG1 regulated EGF receptor-driven invasion (Li et al., 2009), cell proliferation, and apoptosis of BC cells (Markova et al., 2010). FGFR1 promotes the occurrence of small cell carcinoma, and PLCG1 is the effector of FGFR1 signal transduction (Kim et al., 2020). PLXNA1 is a member of the Plexin A family and is involved in regulating malignant cells and nervous tissue in cancer specimens (Müller et al., 2007). PLXNA1 may be a biomarker for identifying breast cancer cases vulnerable to immunotherapy (Naik et al., 2017). The increase of PLXNA1 expression promotes the growth of prostate tumors and impacts the tumor’s biochemical recurrence, metastasis, and poor survival rate (Ren et al., 2018). TBK1 (Tumor Necrosis Factor TNF) is a ubiquitously expressed serine-threonine kinase, belonging to “non-standard” IκB kinases (IKKs) (Fitzgerald et al., 2003). Cytokines regulated by TBK1 affect tumor microenvironment and angiogenesis (Czabanka et al., 2008). TBK1’s autophagy regulation and anti-tumor immunity play an important role in melanoma and non-small cell lung cancer (Cooper et al., 2017; Durand et al., 2018; Eskiocak et al., 2017). VAV3 oncogene is involved in various cell signal transduction processes, including cytoskeletal organization, calcium influx, gene transcription, cell transformation, cell proliferation, and apoptosis (Bustelo, 1996). It is the upstream mediator of Ras-related C3 botulinum toxin substrate 1, enhancing the transcriptional activity of estrogen receptor alpha (ER-α) in breast cancer cells (Rosenblatt et al., 2011). Also, VAV3 is epigenetically regulated in breast cancer development (Loss et al., 2010). And studies have shown VAV3 was an independent prognostic risk factor in gastric cancer (Tan et al., 2017). Chen et al. (2015) found that the up-regulated VAV3 leads to a poor prognosis of BC patients, consistent with our results.
We used the deconvolution algorithm to infer the proportion of 22 immune cell subgroups from the tumor transcriptome. And we found that macrophages M0, macrophages M2, T gamma delta cells, T CD4 memory resting cells, and T CD8 cell infiltration are highly correlated. The interaction between tumor and immune cells affects tumor development, and also serves as a prognostic feature of immunotherapy. The study shows that M0 macrophages, M2 macrophages, Tγδ cells, T CD4 memory resting cells, and T CD8 cell infiltration are highly correlated. They are also the five most abundant immune cell types in the patient’s immune system. Macrophage-related cells inhibit T cell proliferation through the interaction of PD-1/PD-L1 cells to eliminate CD8+ T cells, one of the critical suppressors of tumor cells. Suppressing the immune activity of CD8+ T cells causes the tumor cells in TME to escape (Fang et al., 2021). As the main component of the immune microenvironment, macrophages are a very heterogeneous cell population. Macrophages M0 are mainly derived from the extravasation of monocytes in the blood circulatory system. Noy and Pollard (2014) found that the M2 macrophage with a prominent immunomodulatory function and demonstrated a poor prognosis. A higher proportion of M2 macrophages in breast cancer is associated with insufficient chemotherapy response, suggesting a potential drug resistance (Denardo et al., 2011). In the previous literature, T cells CD8 is mainly involved in adaptive immune defense, the most common is a prognostic association, and kill cancer cells through multiple mechanisms. There is also this discussion about FOXP3+ regulatory T cells CD4 memory resting in some malignant tumors. The results demonstrated the potential of tumor-related T cells and macrophages as breast cancer biomarkers and may provide a guide for future immunotherapy.
Immune-related gene features involve six signaling pathways, namely the immunomodulatory interaction between lymphocytes and non-lymphocytes, interleukin-4 and interleukin-13 signaling pathways, protein phosphorylation after translation; hematopoietic cell lineage, tumor necrosis factor signaling pathway, the interaction of viral proteins with cytokines and cytokine receptors. The tumor necrosis factor signaling pathway (TNF-α) is one of the essential pro-inflammatory cytokines found in the TME of breast cancer patients and promotes tumor progression and metastasis. Thus, TNF-α affects the development of breast cancer tumors, including primary tumor development, metastasis, and disease recurrence (Cruceriu et al., 2020).
Breast cancer is heterogeneous, and the gene signature of the study is immune-related genes. In the study, different immune infiltrating cells were calculated based on the risk scores of 5 immune gene signatures. And the high-risk group was associated with a poor prognosis. Therefore, identifying relevant immune genes and differential immune cells is beneficial to breast cancer immunotherapy. Breast tumor cells with defective DNA damage response activate the STING/TBK1/IF3 pathway, recruiting pro-inflammatory cytokines and T cells. Therefore, a combination of drugs and immunotherapy is more effective in treating breast cancer (Brown et al., 2021). PLCG1 and VAV3 are key molecules of TCR signal transduction. TCR initiates a complex cascade of signal events, leading to cytoskeletal reorganization and transcription upregulation required for T cell activation (Kogure and Kataoka, 2017). VAV3 regulates a variety of cell signaling pathways by mediating the activities of Rho family members, including the signaling pathways of T cell and B cell receptors in vertebrates (Shen et al., 2017). Therefore, the gene signature provided may guide breast cancer immunotherapy.
We use an integrative bioinformatics method to investigate breast cancer IRGs. The prognostic 5-IRGs signatures effectively improve the prognostic prediction and immune infiltration of breast cancer patients and are expected to provide more effective immunotherapy targets for the prognosis assessment of breast cancer.
Author Contribution: The authors confirm contribution to the paper as follows: Study conception and design: Fei He; data collection and analysis: Ke Pang; draft manuscript preparation: Junxia Liu. All authors reviewed the results and approved the final version of the manuscript.
Availability of Data and Materials: All data appear in the paper were obtained from GEO, TCGA and Immport database.
Funding Statement: Science and Technology Innovation Project of Social People’s Livelihood, Yongchuan District, Chongqing (Ycstc, 2017cb5502).
Conflicts of Interest: The authors declare that they have no conflicts of interest to report regarding the present study.
Abubakar M, Figueroa J, Ali HR, Blows F, Lissowska J et al. (2019). Combined quantitative measures of ER, PR, HER2, and KI67 provide more prognostic information than categorical combinations in luminal breast cancer. Modern Pathology 32: 1244–1256. DOI 10.1038/s41379-019-0270-4. [Google Scholar] [CrossRef]
Alsaleem MA, Ball G, Toss MS, Raafat S, Aleskandarany M et al. (2020). A novel prognostic two-gene signature for triple negative breast cancer. Modern Pathology 33: 2208–2220. DOI 10.1038/s41379-020-0563-7. [Google Scholar] [CrossRef]
Baxevanis CN, Fortis SP, Perez SA (2021). The balance between breast cancer and the immune system: Challenges for prognosis and clinical benefit from immunotherapies. Seminars in Cancer Biology 72: 76–89. DOI 10.1016/j.semcancer.2019.12.018. [Google Scholar] [CrossRef]
Brown MC, Mosaheb MM, Mohme M, Mckay ZP, Holl EK et al. (2021). Viral infection of cells within the tumor microenvironment mediates antitumor immunotherapy via selective TBK1-IRF3 signaling. Nature Communications 12: 1858. DOI 10.1038/s41467-021-22088-1. [Google Scholar] [CrossRef]
Bustelo XR (1996). The VAV family of signal transduction molecules. Critical Reviews™ in Oncogenesis 7: 65–88. DOI 10.1615/CritRevOncog.v7.i1-2.50. [Google Scholar] [CrossRef]
Coleman R, Gregory W, Marshall H, Wilson C, Holen I (2013). The metastatic microenvironment of breast cancer: Clinical implications. Breast 22: S50–S56. DOI 10.1016/j.breast.2013.07.010. [Google Scholar] [CrossRef]
Cooper JM, Ou YH, Mcmillan EA, Vaden RM, Zaman A et al. (2017). TBK1 provides context-selective support of the activated AKT/mTOR pathway in lung cancer. Cancer Research 77: 5077–5094. DOI 10.1158/0008-5472.CAN-17-0829. [Google Scholar] [CrossRef]
Cruceriu D, Baldasici O, Balacescu O, Berindan-Neagoe I (2020). The dual role of tumor necrosis factor-alpha (TNF-α) in breast cancer: Molecular insights and therapeutic approaches. Cellular Oncology 43: 1–18. DOI 10.1007/s13402-019-00489-1. [Google Scholar] [CrossRef]
Czabanka M, Korherr C, Brinkmann U, Vajkoczy P (2008). Influence of TBK-1 on tumor angiogenesis and microvascular inflammation. Frontiers in Bioscience 13: 7243–7249. DOI 10.2741/3225. [Google Scholar] [CrossRef]
Chen X, Chen S, Liu XA, Zhou WB, Ma RR et al. (2015). VAV3 oncogene is upregulated and a poor prognostic factor in breast cancer patients. Oncology Letters 9: 2143–2148. DOI 10.3892/ol.2015.3004. [Google Scholar] [CrossRef]
Choi J, Gyamfi J, Jang H, Koo JS (2017). The role of tumor-associated macrophage in breast cancer biology. Histology and Histopathology 33: 133–145. [Google Scholar]
Denardo DG, Brennan DJ, Rexhepaj E, Ruffell B, Shiao SL et al. (2011). Leukocyte complexity predicts breast cancer survival and functionally regulates response to chemotherapy. Cancer Discovery 1: 54–67. DOI 10.1158/2159-8274.CD-10-0028. [Google Scholar] [CrossRef]
Desantis C, Howlader N, Cronin KA, Jemal A (2011). Breast cancer incidence rates in U.S. women are no longer declining. Cancer Epidemiology Biomarkers & Prevention 20: 733–739. DOI 10.1158/1055-9965.EPI-11-0061. [Google Scholar] [CrossRef]
Durand JK, Zhang Q, Baldwin AS (2018). Roles for the IKK-related kinases TBK1 and IKKε in cancer. Cells 7: 139. DOI 10.3390/cells7090139. [Google Scholar] [CrossRef]
Eisenstein M (2015). Medicine: Eyes on the target. Nature 527: S110–S112. DOI 10.1038/527S110a. [Google Scholar] [CrossRef]
Eskiocak B, Mcmillan EA, Mendiratta S, Kollipara RK, Zhang H et al. (2017). Biomarker accessible and chemically addressable mechanistic subtypes of BRAF melanoma. Cancer Discovery 7: 832–851. DOI 10.1158/2159-8290.CD-16-0955. [Google Scholar] [CrossRef]
Fang W, Zhou T, Shi H, Yao M, Zhang D et al. (2021). Progranulin induces immune escape in breast cancer via up-regulating PD-L1 expression on tumor-associated macrophages (TAMs) and promoting CD8+ T cell exclusion. Journal of Experimental & Clinical Cancer Research 40: 4. DOI 10.1186/s13046-020-01786-6. [Google Scholar] [CrossRef]
Finak G, Bertos N, Pepin F, Sadekova S, Souleimanova M et al. (2008). Stromal gene expression predicts clinical outcome in breast cancer. Nature Medicine 14: 518–527. DOI 10.1038/nm1764. [Google Scholar] [CrossRef]
Fitzgerald KA, Mcwhirter SM, Faia KL, Rowe DC, Latz E et al. (2003). IKKε and TBK1 are essential components of the IRF3 signaling pathway. Nature Immunology 4: 491–496. DOI 10.1038/ni921. [Google Scholar] [CrossRef]
Gordon B, Gadi VK (2020). The role of the tumor microenvironment in developing successful therapeutic and secondary prophylactic breast cancer vaccines. Vaccines 8: 529. DOI 10.3390/vaccines8030529. [Google Scholar] [CrossRef]
Greaney ML, Sprunck-Harrild K, Ruddy KJ, Ligibel J, Barry WT et al. (2015). Study protocol for young & strong: A cluster randomized design to increase attention to unique issues faced by young women with newly diagnosed breast cancer. BMC Public Health 15: 37. DOI 10.1186/s12889-015-1346-9. [Google Scholar] [CrossRef]
Hu M, Yao J, Cai L, Bachman KE, van den Brûle F et al. (2005). Distinct epigenetic changes in the stromal cells of breast cancers. Nature Genetics 37: 899–905. DOI 10.1038/ng1596. [Google Scholar] [CrossRef]
Ibrahim SA, Gadalla R, El-Ghonaimy EA, Samir O, Mohamed HT et al. (2017). Syndecan-1 is a novel molecular marker for triple negative inflammatory breast cancer and modulates the cancer stem cell phenotype via the IL-6/STAT3, Notch and EGFR signaling pathways. Molecular Cancer 16: 57. DOI 10.1186/s12943-017-0621-z. [Google Scholar] [CrossRef]
Kaanane H, Senhaji N, Berradi H, Benchakroun N, Benider A et al. (2019). Association of variants in IL6-related genes with lung cancer risk in Moroccan population. Lung 197: 601–608. DOI 10.1007/s00408-019-00261-0. [Google Scholar] [CrossRef]
Kim KB, Kim Y, Rivard CJ, Kim DW, Park KS (2020). FGFR1 is critical for RBL2 loss-driven tumor development and requires PLCG1 activation for continued growth of small cell lung cancer. Cancer Research 80: 5051–5062. DOI 10.1158/0008-5472.CAN-20-1453. [Google Scholar] [CrossRef]
Kogure Y, Kataoka K (2017). Genetic alterations in adult T-cell leukemia/lymphoma. Cancer Science 108: 1719–1725. DOI 10.1111/cas.13303. [Google Scholar] [CrossRef]
Li B, Geng R, Wu Q, Yang Q, Sun S et al. (2020). Alterations in immune-related genes as potential marker of prognosis in breast cancer. Frontiers in Oncology 10: 333. DOI 10.3389/fonc.2020.00333. [Google Scholar] [CrossRef]
Li S, Wang Q, Wang Y, Chen X, Wang Z (2009). PLC-γ1 and Rac1 coregulate EGF-induced cytoskeleton remodeling and cell migration. Molecular Endocrinology 23: 901–913. DOI 10.1210/me.2008-0368. [Google Scholar] [CrossRef]
Loss LA, Sadanandam A, Durinck S, Nautiyal S, Flaucher D et al. (2010). Prediction of epigenetically regulated genes in breast cancer cell lines. BMC Bioinformatics 11: 305. DOI 10.1186/1471-2105-11-305. [Google Scholar] [CrossRef]
Markova B, Albers C, Breitenbuecher F, Melo J, Brümmendorf T et al. (2010). Novel pathway in Bcr-Abl signal transduction involves Akt-independent, PLC-γ1-driven activation of mTOR/p70S6-kinase pathway. Oncogene 29: 739–751. DOI 10.1038/onc.2009.374. [Google Scholar] [CrossRef]
Meng T, Huang Z, Wei Q, Qin H (2020). The Construction and analysis of ceRNA network and patterns of immune infiltration in colon adenocarcinoma metastasis. Frontiers in Cell and Developmental Biology 4: 688. DOI 10.3389/fcell.2020.00688. [Google Scholar] [CrossRef]
Müller MW, Giese NA, Swiercz JM, Ceyhan GO, Esposito I et al. (2007). Association of axon guidance factor semaphorin 3A with poor outcome in pancreatic cancer. International Journal of Cancer 121: 2421–2433. DOI 10.1002/(ISSN)1097-0215. [Google Scholar] [CrossRef]
Naik A, Al-Zeheimi N, Bakheit CS, Al Riyami M, Al Jarrah A et al. (2017). Neuropilin-1 associated molecules in the blood distinguish poor prognosis breast cancer: A cross-sectional study. Scientific Reports 7: 3301. DOI 10.1038/s41598-017-03280-0. [Google Scholar] [CrossRef]
Noy R, Pollard JW (2014). Tumor-associated macrophages: From mechanisms to therapy. Immunity 41: 49–61. DOI 10.1016/j.immuni.2014.06.010. [Google Scholar] [CrossRef]
Piñero-Madrona A, Ripoll-Orts F, Sánchez-Méndez JI, Chaves-Benito A, Gómez-De La Bárcena MR et al. (2020). External validation of a prognostic model based on total tumor load of sentinel lymph node for early breast cancer patients. Breast Cancer Research and Treatment 181: 339–345. DOI 10.1007/s10549-020-05623-4. [Google Scholar] [CrossRef]
Qian JX, Yu M, Sun Z, Jiang AM, Long B (2020). A 17-gene expression-based prognostic signature associated with the prognosis of patients with breast cancer: A STROBE-compliant study. Medicine 99: e19255. DOI 10.1097/MD.0000000000019255. [Google Scholar] [CrossRef]
Ren L, Wang X, Dong Z, Liu J, Zhang S (2013). Bone metastasis from breast cancer involves elevated IL-11 expression and the gp130/STAT3 pathway. Medical Oncology 30: 634. [Google Scholar]
Ren S, Wei GH, Liu D, Wang L, Hou Y et al. (2018). Whole-genome and transcriptome sequencing of prostate cancer identify new genetic alterations driving disease progression. European Urology 73: 322–339. [Google Scholar]
Rosenblatt AE, Garcia MI, Lyons L, Xie Y, Maiorino C et al. (2011). Inhibition of the Rho GTPase, Rac1, decreases estrogen receptor levels and is a novel therapeutic strategy in breast cancer. Endocrine-Related Cancer 18: 207. [Google Scholar]
Selander KS, Li L, Watson L, Merrell M, Dahmen H et al. (2004). Inhibition of gp130 signaling in breast cancer blocks constitutive activation of Stat3 and inhibits in vivo malignancy. Cancer Research 64: 6924–6933. [Google Scholar]
Shen Y, Zhang Y, Han Y, Su P, Gou M et al. (2017). A novel VAV3 homolog identified in lamprey, Lampetra japonica, with roles in lipopolysaccharide-mediated immune response. International Journal of Molecular Sciences 18: 2035. [Google Scholar]
Sledge GW, Mamounas EP, Hortobagyi GN, Burstein HJ, Goodwin PJ et al. (2014). Past, present, and future challenges in breast cancer treatment. Journal of Clinical Oncology 32: 1979–1986. DOI 10.1200/JCO.2014.55.4139. [Google Scholar] [CrossRef]
Steven A, Seliger B (2018). The role of immune escape and immune cell infiltration in breast cancer. Breast Care 13: 16–21. DOI 10.1159/000486585. [Google Scholar] [CrossRef]
Tan B, Li Y, Shi X, Fan L, Zhao Q et al. (2017). Expression of VAV3 protein and its prognostic value in patients with gastric cancer. Pathology-Research and Practice 213: 435–440. DOI 10.1016/j.prp.2017.01.028. [Google Scholar] [CrossRef]
Tian J, Chen X, Fu S, Zhang R, Pan L et al. (2019). Bazedoxifene is a novel IL-6/GP130 inhibitor for treating triple-negative breast cancer. Breast Cancer Research and Treatment 175: 553–566. DOI 10.1007/s10549-019-05183-2. [Google Scholar] [CrossRef]
Villarreal-Garza C, Aguila C, Magallanes-Hoyos MC, Mohar A, Bargalló E et al. (2013). Breast cancer in young women in Latin America: An unmet, growing burden. Oncologist 18: 1298–1306. DOI 10.1634/theoncologist.2013-0321. [Google Scholar] [CrossRef]
Wang M, Zhang H, Yang F, Qiu R, Zhao X et al. (2020). suppresses cellular proliferation and migration via IL6ST: A potential noninvasive diagnostic biomarker for breast cancer. Journal of Cellular Physiology 235: 4890–4901. DOI 10.1002/jcp.29367. [Google Scholar] [CrossRef]
Wu F, Chen W, Kang X, Jin L, Bai J et al. (2021). A seven-nuclear receptor-based prognostic signature in breast cancer. Clinical and Translational Oncology 23: 1292–1303. DOI 10.1007/s12094-020-02517-1. [Google Scholar] [CrossRef]
Xie P, Ma Y, Yu S, An R, He J et al. (2020). Development of an immune-related prognostic signature in breast cancer. Frontiers in Genetics 10: 1390. DOI 10.3389/fgene.2019.01390. [Google Scholar] [CrossRef]
Zhu B, Tse LA, Wang D, Koka H, Zhang T et al. (2019). Immune gene expression profiling reveals heterogeneity in luminal breast tumors. Breast Cancer Research 21: 147. DOI 10.1186/s13058-019-1218-9. [Google Scholar] [CrossRef]
 | This work is licensed under a Creative Commons Attribution 4.0 International License, which permits unrestricted use, distribution, and reproduction in any medium, provided the original work is properly cited. |