DOI:10.32604/biocell.2022.018427
| BIOCELL DOI:10.32604/biocell.2022.018427 | |
| Article |
A novel prognostic target-gene signature and nomogram based on an integrated bioinformatics analysis in hepatocellular carcinoma
1Department of Engineering Structure and Mechanics, School of Science, Wuhan University of Technology, Wuhan, 430070, China
2Department of Geotechnical Engineering, Wuhan University of Technology, Wuhan, 430070, China
3Engineering Laboratory of Zhejiang Province for Pharmaceutical Development of Growth Factors & Biomedicine Collaborative Innovation Center of Wenzhou, Institute of Life Sciences, Wenzhou University, Wenzhou, 325035, China
*Address correspondence to: Qingjia Chi, qingjia@whut.edu.cn; Da Sun, sunday@wzu.edu.cn
Received: 03 August 2021; Accepted: 23 September 2021
Abstract: There is currently no effective solution to the problem of poor prognosis and recurrence of HCC. The technology of immunotherapy and prognosis of genetic material has made continuous progress in recent years. In the study, a 5-gene signature was established for the prognosis of HCC through biological information, and the immune infiltration of HCC patients was studied. After studied HCC patients’ immune infiltration, the paper screened the differential target genes of miR-126-3p in HCC downloaded from TCGA database, and uses WGCNA method to select the modular genes highly relevant to M2 macrophage. Then we use LASSO and COX regression analysis technology to establish the 5-gene signature. The nomogram is established by combining the prognostic score and clinical phenotype. Cibersort was empolyed to observe the immune infiltration in HCC patients. We revealed the biological pathways of HCC-related genes through GSEA and Metascape. The bioinformatics analysis of 2495 differential target genes finally constructed a 5-gene signature with a reliable prognostic ability (CDCA8, SLC41A3, PPM1G, TCOF1, GRPEL2). The combination of prognostic score and AJCC_Stage resulted in a more reliable prognosis ability. At the same time, 10 immune cells that are differentially expressed in HCC patients were also found. 8 GSEA pathways related to the prognosis were found. In the study, a reliable 5-gene signature was established based on the differential target gene of miR-126-3p to study the immune infiltration in HCC patients. It provides help for HCC-related prognosis research and immunotherapy.
Keywords: Hepatocellular carcinoma; Prognostic signature; Differentially expressed genes; microRNA
| Abbreviations | |
| HCC: | hepatocellular carcinoma |
| AUC: | area under curve |
| DETGs: | differentially expressed target genes |
| GEO: | gene expression omnibus |
| HCC: | hepatocellular carcinoma |
| K–M: | Kaplan–Meier |
| LASSO: | least absolute shrinkage and selection operator |
| OS: | overall survival |
| ROC: | receiver operating characteristic |
| RS: | risk score |
| TCGA: | the cancer genome atlas |
| WGCNA: | weighted gene co-expression network analysis |
| GSEA: | gene set enrichment analysis |
Primary hepatocellular carcinoma (HCC) and the corresponding chronic hepatitis or liver cirrhosis are widely regarded as precancerous lesions (Kanai et al., 1997). This disease is the third most common cause of death from cancer for human-beings (Pinato et al., 2020). The occurrence and progression of HCC are related to many factors (HBV infection, eating habits and drinking, etc.) (Piñero et al., 2020). Because there are no nerves in the liver tissue, most cancers have entered the advanced stage when patients feel pain and other discomfort. Untimely diagnosis leads to an extremely poor prognosis of patients. Owing to the high recurrence and metastasis characteristics of HCC, patients even lose the chance of radical treatment (Giannini et al., 2015). Therefore, a new and reliable method for the diagnosis and prognosis of liver cancer is urgently needed.
Carcinogenesis is a multi-step process that is caused by changes in signal pathways triggered by multiple genes that transform normal cells into malignant cells (Fantini et al., 2015). microRNAs (miRNAs) are small non-coding RNAs. As a kind of genetic material, miRNAs affect many biological processes of cancer by regulating genes. Studies have shown that the interacting genes revealed by HCC-related pathways are potential biomarkers and therapeutic targets for cancer (Guo et al., 2020). Simultaneously, in vivo detection technology feasibility has been improved, providing technical support for theoretical research on prognosis using genes. Therefore, the study of prognostic analysis of HCC human patients through the construction of multi-gene signatures is of great value. Studies reported hsa-miR-126-3p was differentially expressed and the progonostic role in various kinds of cancers (Han et al., 2020a; Nowicki et al., 2021). However, the prognostic role remainded to be expolored in liver cancer. Therefore, the study studied the expression of hsa-miR-126-3p, and established a prognostic gene-signature with the target genes of hsa-miR-126-3p.
Studies have shown that cancer development is closely linked to the immune system, especially the tumor microenvironment in human bodies (Han et al., 2020b). The HCC tumor immune microenvironment involves a series of non-cancer cell types, including normal liver cells, endothelial cells, pericytes, hepatic stellate cells (HSCs), portal fibroblasts and differential immune cell subgroups (Hou et al., 2020). Studies have shown that a variety of immunotherapy programs may significantly change the clinical outcome of HCC (Elsegood et al., 2017; Khemlina et al., 2017). Therefore, investigating the immune infiltration of HCC patients may be of great help to the judgment of cancer progression and prognosis.
In the paper, hsa-miR-126-3p and its target genes in liver cancer tissues were studied. Based on the TCGA and GEO databases, the 5-gene signature was constructed through WGCNA, LASSO regression analysis and other bioinformatics methods. The nomogram and survival curve are used to verify the 5-gene signature. Subsequently, we investigated the immune infiltration in HCC patients through the Cibersort deconvolution method. In this paper, the expression levels of 22 immune cells are related to gene expression levels, and the changes in the proportion of immune cells are analyzed. Finally, the tool GSEA was used to enrich the genes in HCC patients, 8 pathways were found (cell cycle, ECM–receptor interaction, herpes simplex virus 1 infection, p53 signaling pathway, inositol phosphate metabolism, microRNAs in cancer, phosphatidylinositol signaling system, renal cell carcinoma), GO and KEGG pathways related to HCC were found. The paper links the differential expression of genes, the level of immune infiltration, survival time, and clinical phenotypes in HCC patients, and provides help for HCC prognosis study and immunotherapy.
Twelve databases based on miRwalk2.0 (http://zmf.umm.uni-heidelberg.de/apps/zmf/mirwalk2) identified potential target genes of miRNA-126-3p for subsequent research.
Both the transcriptome information expression matrix and clinical information matrix of HCC patients are downloaded from the TCGA database (https://cancergenome.nih.gov). The transcriptome expression matrix is composed of the expression levels of MiRNAs and genes in tissue samples and normal samples. The clinical information matrix is composed of visit information such as the age, survival time, tumor grade, tumor type, pathological stage of patients with tumor tissue samples. The tumor samples in the clinical information matrix correspond to the tumor tissue samples in the transcriptome expression matrix. Genes that were not recorded in more than a quarter of the samples were eliminated. The transcriptome information expression matrix was standardized by FPKM. Clinical samples with zero survival time were excluded. The HCC-related data set downloaded from the GEO database (https://www.ncbi.nlm.nih.gov/geo) is used as an external verification set for 5-gene signatures.
By selecting the method of analyzing the expression of miRNA-126-3p in each sample of the HCC transcriptome from the TCGA database, we observed the difference in the expression of miRNA-126-3p in the tumor group samples and the normal group samples, and study its clinical significance. To observe the differential expression of miRNA, we compared the expression of miRNA-126-3p in tumor samples and normal samples in groups. Based on the R language program package “survival”, the survival curves of the tumor group and the normal group are drawn. Based on the R language program package “ROCR” to draw the ROC curve of the tumor group and the normal group, with AUC value greater than 0.7 and P-value less than 0.05 as the standard, the differential expression of miRNA-126-3p in HCC patient samples was determined.
To study the various immune cells infiltration levels in HCC patients, we uploaded the gene expression matrix of HCC patient samples to the Cibersort website (https://CIBERSORT.stanford.edu/). Based on the Cibersort deconvolution method, we can get the expression levels of 22 kinds of immune cells for each sample. The immune cells with the highest level of infiltration are selected, and the individual expression of the sample is used as the clinical phenotype for subsequent WGCNA analysis.
To study the difference in immune infiltration level between samples from high-risk groups and low-risk ones, we used the average of expression of 22 kinds of immune cells in samples from different risk groups as the ratio of immune cell infiltration. Then, we set perm = 1000 and selected immune cells with P < 0.05 as immune cells with significant differential expression. Visualization completed based on R language package “vioplot” and “ggplot2” Identification of differential target genes and modular genes.
Utilizing comparing the identified potential target genes with the genes in the transcriptome matrix in the TCGA database, the common genes were screened out. The common gene was screened based on the R language program package “DESeq2” with |logFC| > 1, P < 0.05 as thresholds, and used as a differential target gene (DETG) for subsequent research.
We analyzed the DETG obtained by WGCNA, and selected the modular gene by combining the sample gene expression with clinical information. This process is based on the R language package “wgcna”. WGCNA is a statistical method that constructs genes into a gene-weighted co-expression network through weighted processing of gene expression. The co-expressed gene set was identified through the analysis, the modules and the phenotype data were associated with the analysis, and the potential core genes were discovered.
First, performing a cluster analysis on the expression profile, calculate the Pearson correlation coefficient of the gene, and establish a correlation matrix.
Next, we build the adjacency matrix:
Among them, β is empolyed to indicate the weighted value which conforms to the scale-free network law (fit value R2 to 0.85). The gene pair correlation index aij is used to construct an adjacency matrix A. aij equals the β square of the correlation coefficient Sij.
Finally, the topological adjacency matrix was constructed:
So far, we believe that genes with similar expressions are functionally related and can be clustered into the same module based on the correlation. Genes that cannot be successfully aggregated into a certain module are oligogenes and are not included in the follow-up study due to weak correlation. According to the tree cutting method, the number of modules and the number of genes gathered in each module can be set. Then we imported the clinical data of the patient sample and correspond to the expression sample one-to-one, calculate the correlation and significance of the clinical traits and each module. And the module gene with the strongest correlation with the clinical phenotype can be taken as the modular gene.
Gene ontology and KEGG pathway
Based on the online tool Metascape (https://metascape.org/), the modular gene was enriched with GO Biological Processes, GO Cellular Components, GO Molecular Functions and KEGG. Enrichment is performed under the condition of perm = 1000, and the P-value is arranged from small to large. The enrichment of genes into pathways is visualized through the R package “GOplot”.
Development of prognostic model
Genes related to patients’ overall survival (OS) were identified through univariate Cox and Lasso Cox regression. Firstly, univariate COX regression analysis was used, with P < 0.05 as the standard, to initially screen out genes related to OS. Subsequently, the selected genes were analyzed by LASSO regression, and the LASSO analysis coefficient was calculated for subsequent risk model construction. LASSO regression applied the L1 norm summation method to punish the model parameters to fit the model properly,
Among them βi is a set of variables of the model, and λ controls the complexity of the model. Through LASSO regression analysis, an accurate and streamlined regression model was established. In this paper, the ten genes with the smallest partial likelihood deviation in the LASSO regression analysis were selected for ROC analysis, and they were sorted according to the AUC value. The top five genes with the AUC value were applied to construct the prognostic gene signature. The risk score (RS) of each sample can be calculated linearly:
In the equation, n is the number of genes contained in the final prognostic signature model. Coefi means the LASSO coefficient of gene i. Expi is the expression value of gene i. we selected the median of RS in HCC patient samples to complete the cutoff value, divided the patient samples into two groups accroding to their each RS, and completed the visualization of the relationship between different risk groups and patient survival. Simultaneously, based on the R language package “timeROC”, K-M curve and time-dependent ROC curve are applied to estimate the prognostic and diagnostic value of gene signature.
The patient’s risk score and other clinical information were analyzed together to analyze the variables, and the second univariate and multivariate COX regression analysis was performed. The C-index index of the regression analysis model is calculated to evaluate the predictive ability of the regression model for patient survival. The R program package “rms” is used to incorporate the prognostic factors obtained from the COX regression into the nomogram and calibration chart construction. Set the parameter perm = 1000, and select the 6-node difference fitting method to verify the consistency between the patient's survival prognosis and the real survival situation.
According to the predicted expression value of RS based on the patient sample, and the median as the screening criterion, the patient samples were divided into high risk or low risk groups. Based on the R speech package “limma”, the logFC value of the high and low risk group genes is calculated. Use the R package “clusterprofiler” to perform GSEA (Gene Set Enrichment Analysis) analysis on the whole genome. GSEA can find the biological pathways that are significantly enriched by the two sets of samples through the amount of gene expression, and find the phenotype with the expression pattern of the gene set closer. Set perm = 1000, and use |NES| > 1, P < 0.05 as the screening conditions to determine the significantly enriched gene set. Obtain and visualize the enriched pathways.
The R language package analyzed by WGCNA is called on the “R v3.6.1” platform. The rest of the R language packages for statistical analysis are all called on the “R v4.0.2” platform. P value less than 0.05 is considered to have statistically significant reliability. AUC value greater than 0.7 is considered to have significant specificity. TCGA database (https://cancergenome.nih.gov). miRwalk 2.0 website (http://zmf.umm.uni-heidelberg.de/apps/zmf/mirwalk2). GEO database (https://www.ncbi.nlm.nih.gov/geo). Cibersort website (https://CIBERSORT.stanford.edu/). Online tool Metascape (https://metascape.org/).
Transcriptome and clinical data
We downloaded 372 HCC tumor tissue samples and 50 normal tissue samples from the TCGA database to study the expression level of miRNA-126-3p; download the gene expression matrix of HCC samples to obtain 19753 gene expression data. A total of 8671 potential target genes of miR-126-3p were identified for subsequent analysis. 8372 overlapped genes were prepared for the following study (Fig. 1A). The expression difference analysis of each gene finally determined that 5838 DEGs genes were studied, a total of 4760 up-regulated genes and 1078 down-regulated genes were identified (Fig. 1B). Downloaded 378 samples of clinical data, and eliminated 6 samples with missing visit information, which corresponded to samples of HCC tumor gene expression.
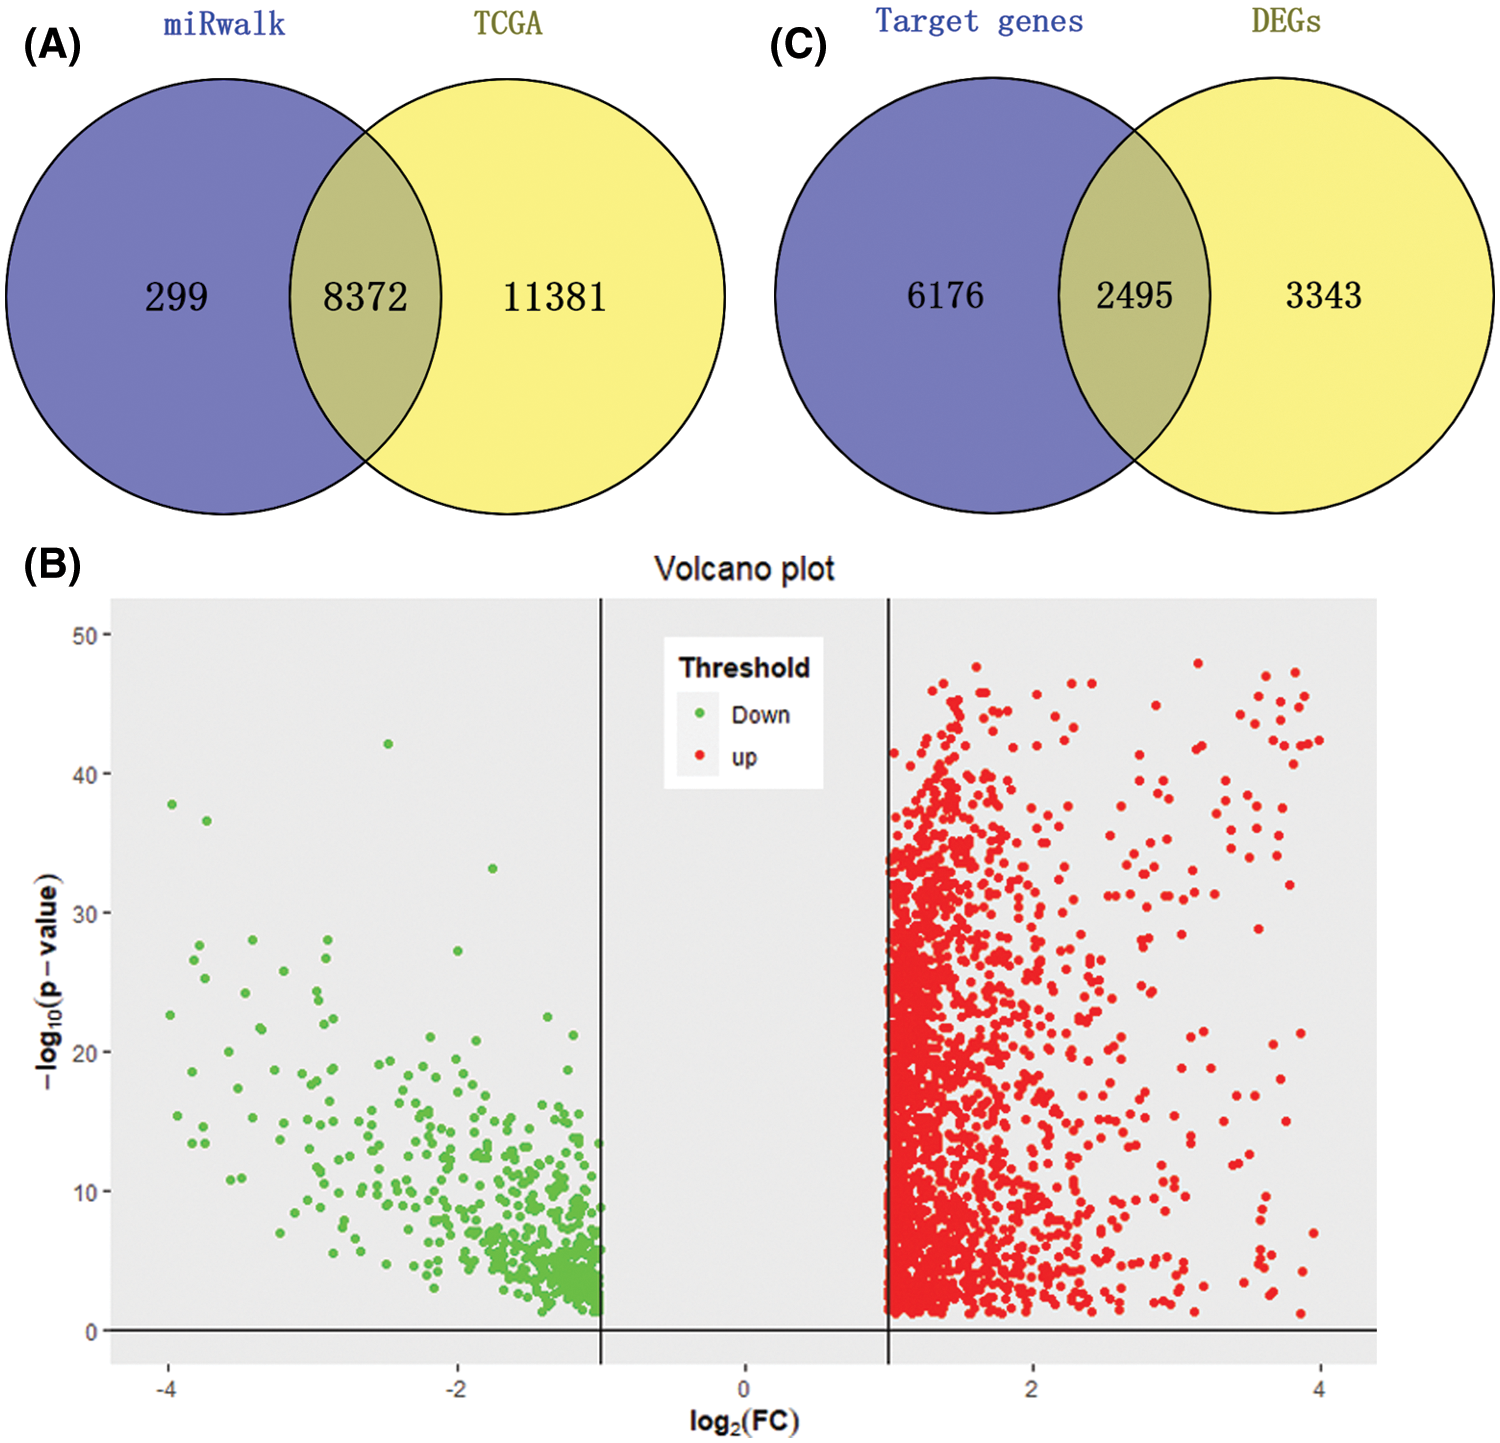
Figure 1: DETGs’ identification. (A) Venn plot for TCGA database and miRwalk database, a total of 8372 potential target genes were selected. (B) Volcano plot for DEGs, a total of 4760 up-regulated genes and 1078 down-regulated genes were identified. (C) Venn plot for DEGs and target genes, 2495 genes were overlapped and defined as DETGs.
The paper obtained 21218 gene expression data in 219 tumor samples in GSE14520 in GEO data, and obtained clinical information of tumor samples through platform GPL3921-25447. Two samples with a survival time of 0 are eliminated, and the remaining data is used for 5-gene signature verification.
Clinical performance of miRNA-126-3p
By comparing miR-126-3p expression in tumor samples and normal samples, the expression of miR-126-3p in HCC tumor tissues was down-regulated (P = 2.9e−8) (Fig. 2A). Simultaneously, the expression of miR-126-3p has better recognition in tumor samples and normal samples (AUC = 0.7789, P = 0.029) (Fig. 2B). K–M curve analysis illustrated that the survival time of samples with low expression of miR-126-3p was significantly shortened (P = 0.0064) (Fig. 2C).
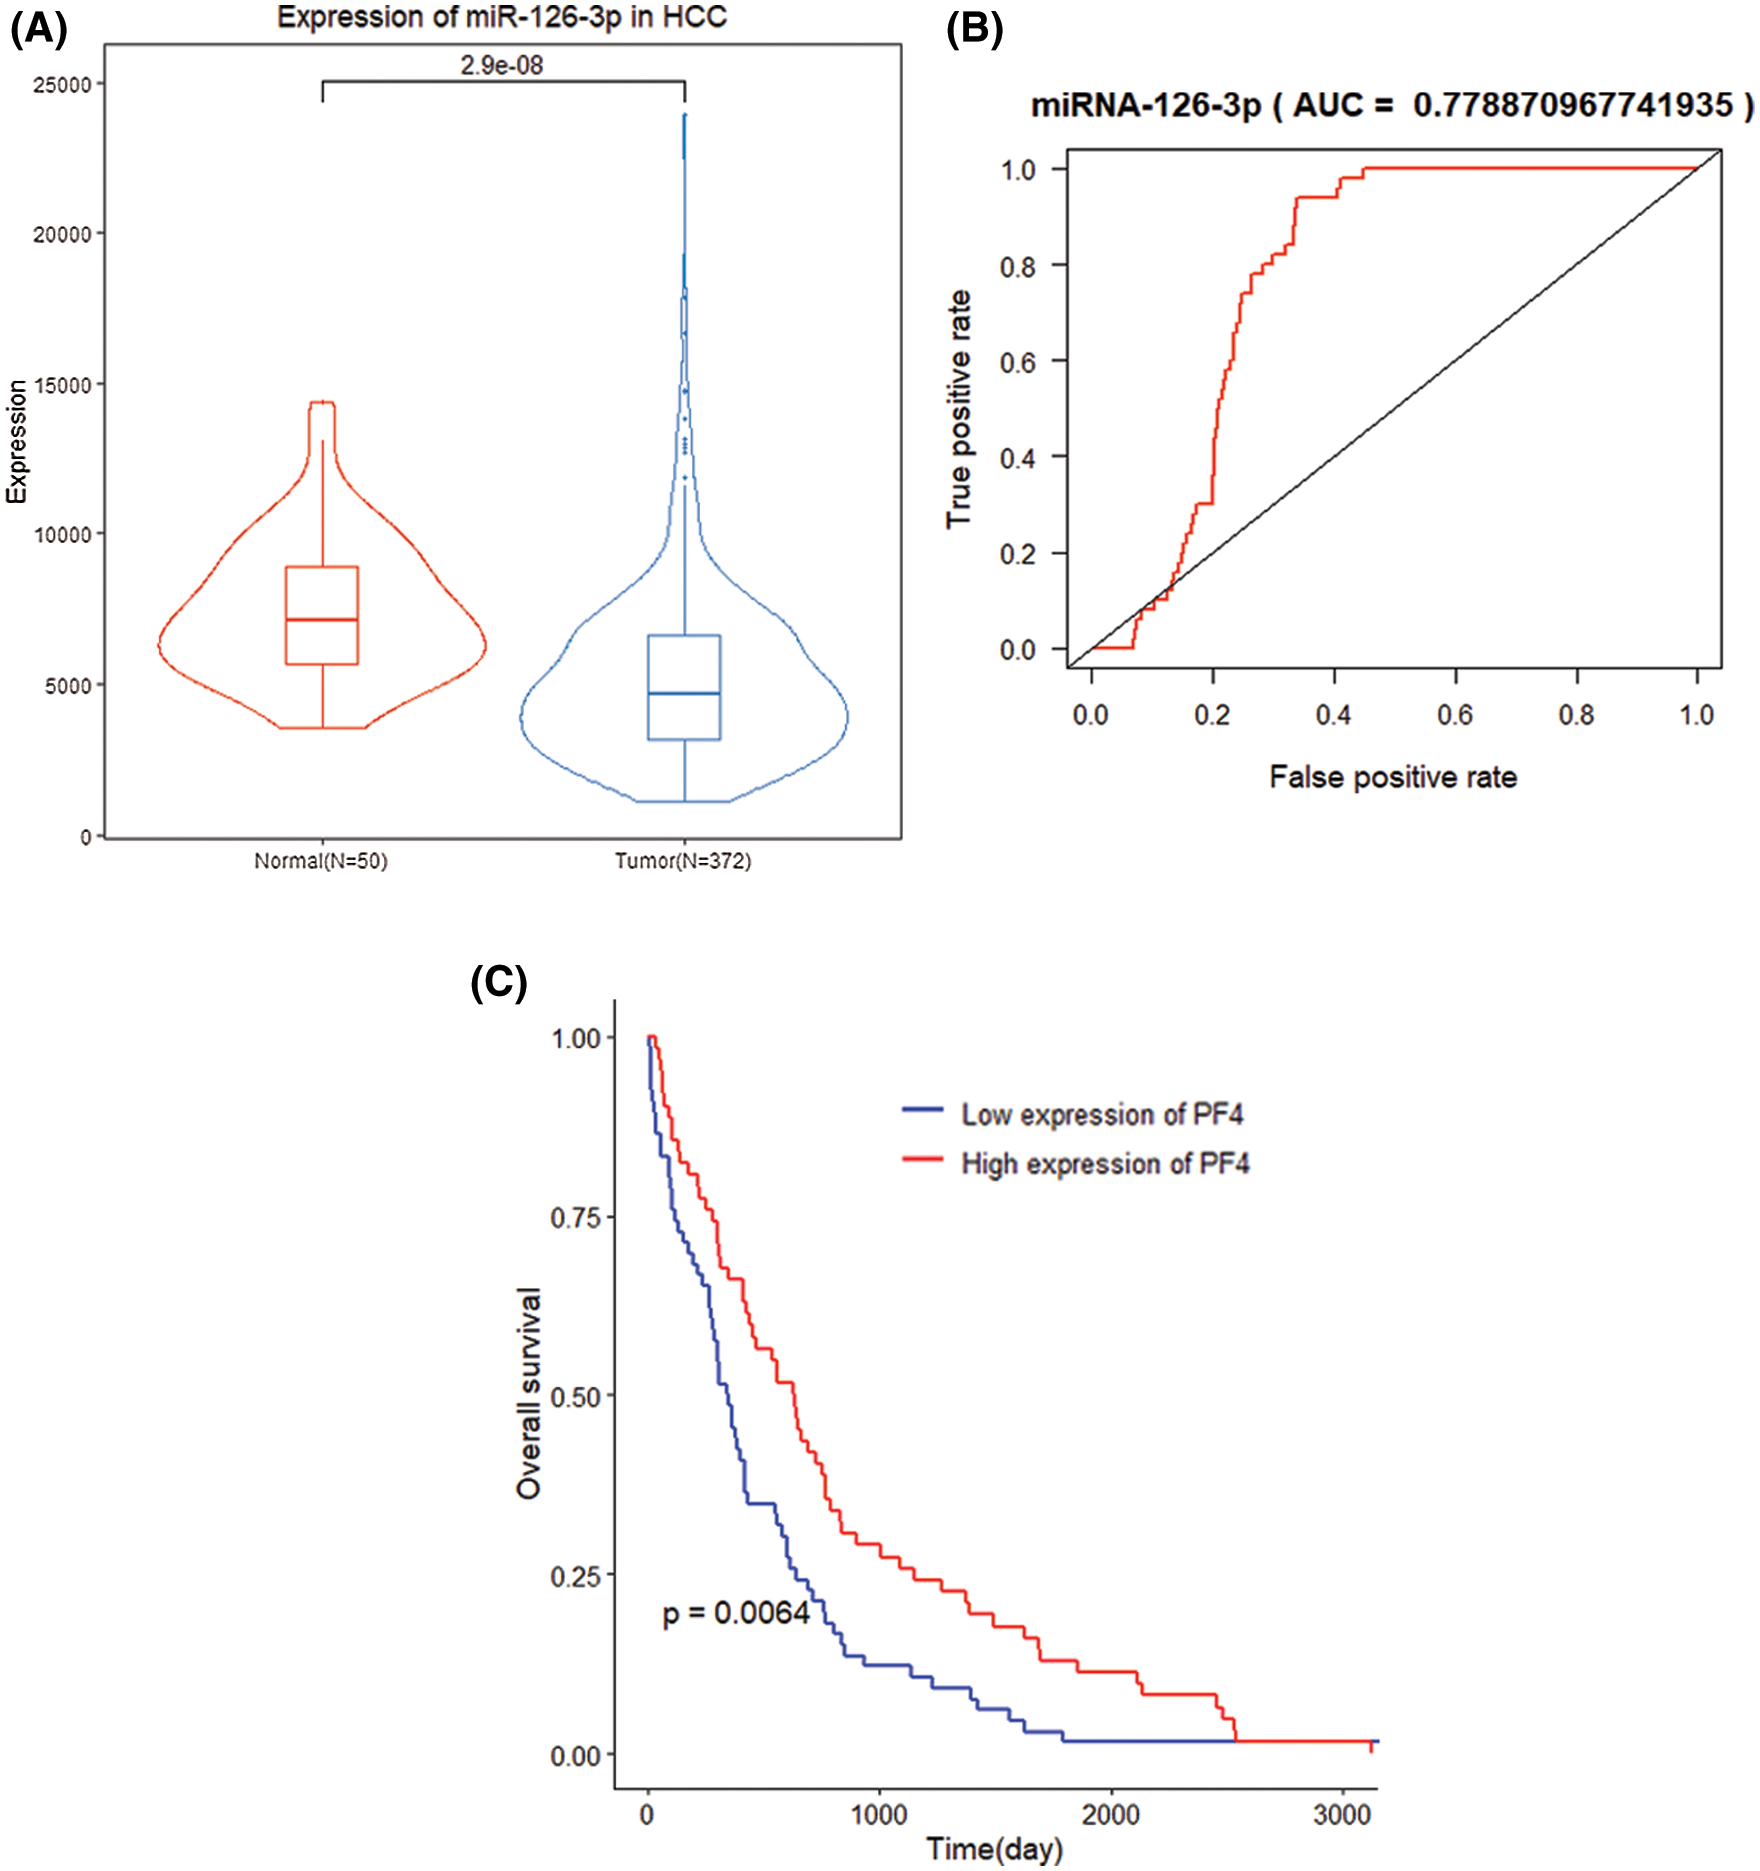
Figure 2: Clinical performance of miR-126-3p in HCC patients. (A) Differential expression of miR-126-3p between HCC group and normal group. (B) ROC curve of two groups with a high AUC value. (C) K-M analysis for differential miR-126-3p expression patients.
Selection of modular genes highly relevant to macrophages
By comparing the target genes of miR-126-3p with the DEGs obtained by pretreatment, we obtained 2495 overlapping genes. Among the overlapping genes, there are 2033 up-regulated genes and 462 down-regulated genes (Fig. 1C). Based on the WGCNA algorithm, we established a scale-free co-expression network with 2495 overlapping genes under the condition of β = 8. According to the tree cutting method, setting the parameters minModuleSize = 50 and mergeCutHeight = 0.15 as the conditions, we got 4 modules with 833 oligogenes. By calculating the Pearson correlation coefficient of each module and the patient's clinical information, we found that the turquoise module and ISUP_Grade (cor = 0.35, P = 6e−12) showed the most significant positive correlation (Figs. 4A and 4B). At the same time, the turquoise module has a significant positive correlation with AJCC_Stage (cor = 0.2, P = 3e−4) and Pathology Tumor (cor = 0.2, P = 1e−4). The turquoise module is negatively correlated with the expression of macrophages M2 (cor = −0.21, P = 3e−5), which is the most prominently expressed macrophages in patients (Fig. 3). Therefore, we identified 833 genes in the turquoise module as the modular genes that are the key to research in this study (Figs. 4C and 4D).
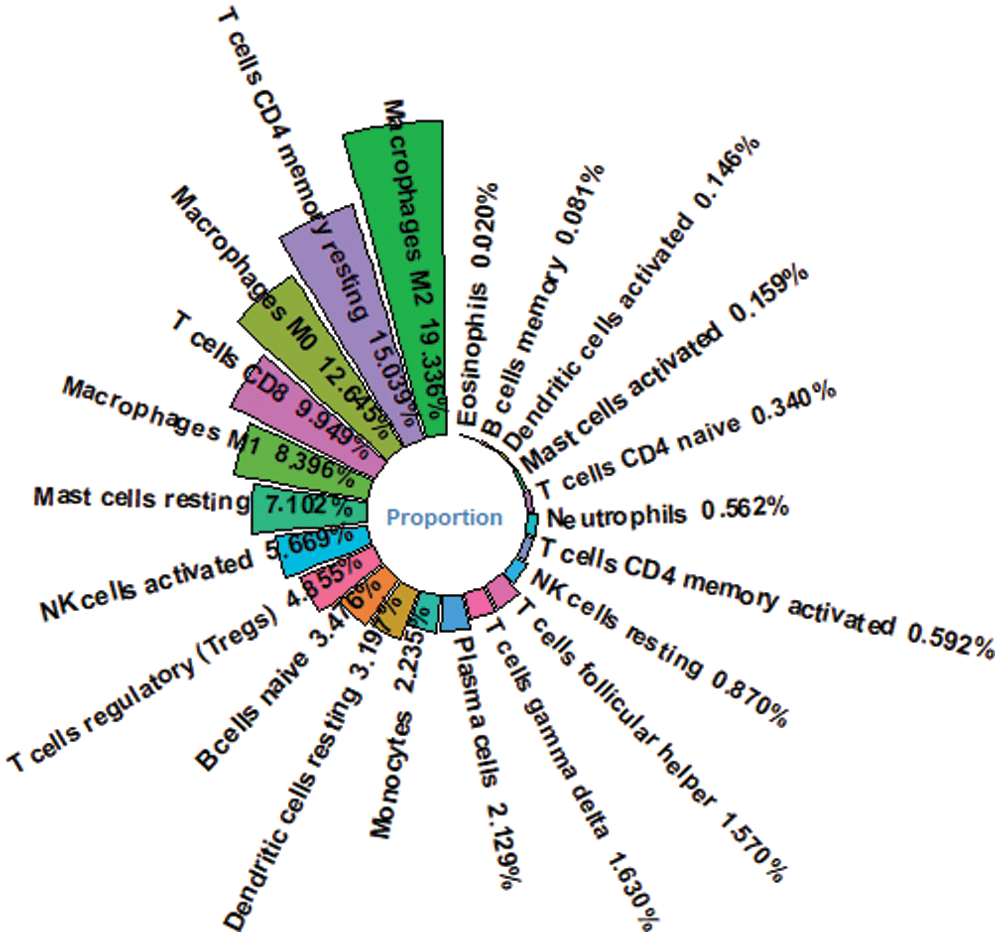
Figure 3: Proportion of immune cells for HCC patients. Macrophage M2 is the most abundant immune cell in HCC patients’ immune microenvironment.
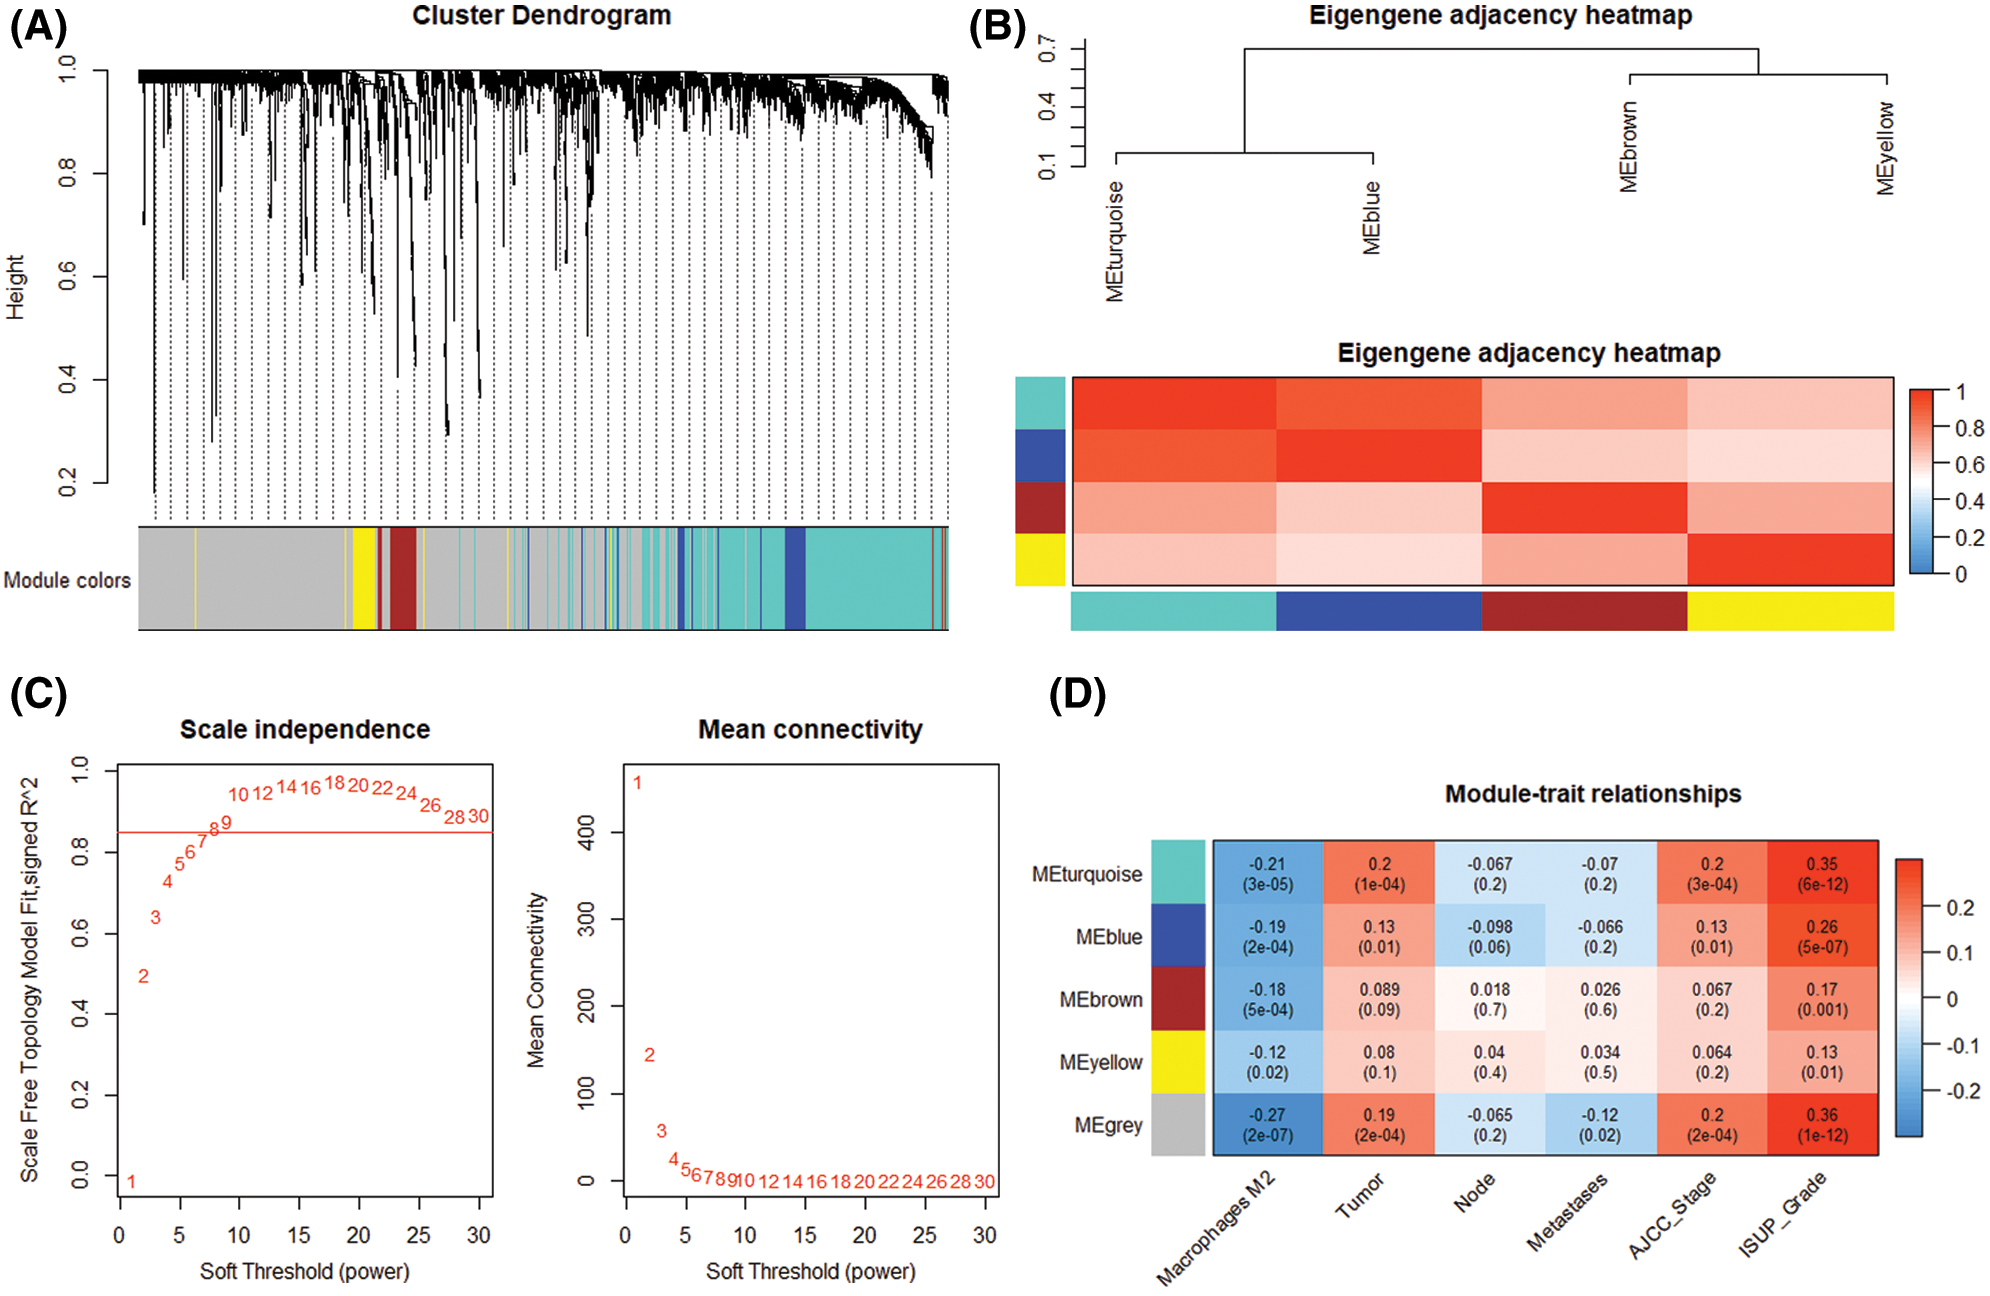
Figure 4: Modular gene selection. (A) Cluster Dendorgram. Genes were clustered into 4 modules by tree cutting method, failed to clustered ones marked grey. (B) Eigengene adjacency heatmap. Pairwise correlation between four modules. (C) Scale independence and mean connection. (D) Module-trait relationships. Correlations between genes and clinical trait in modules and P-value.
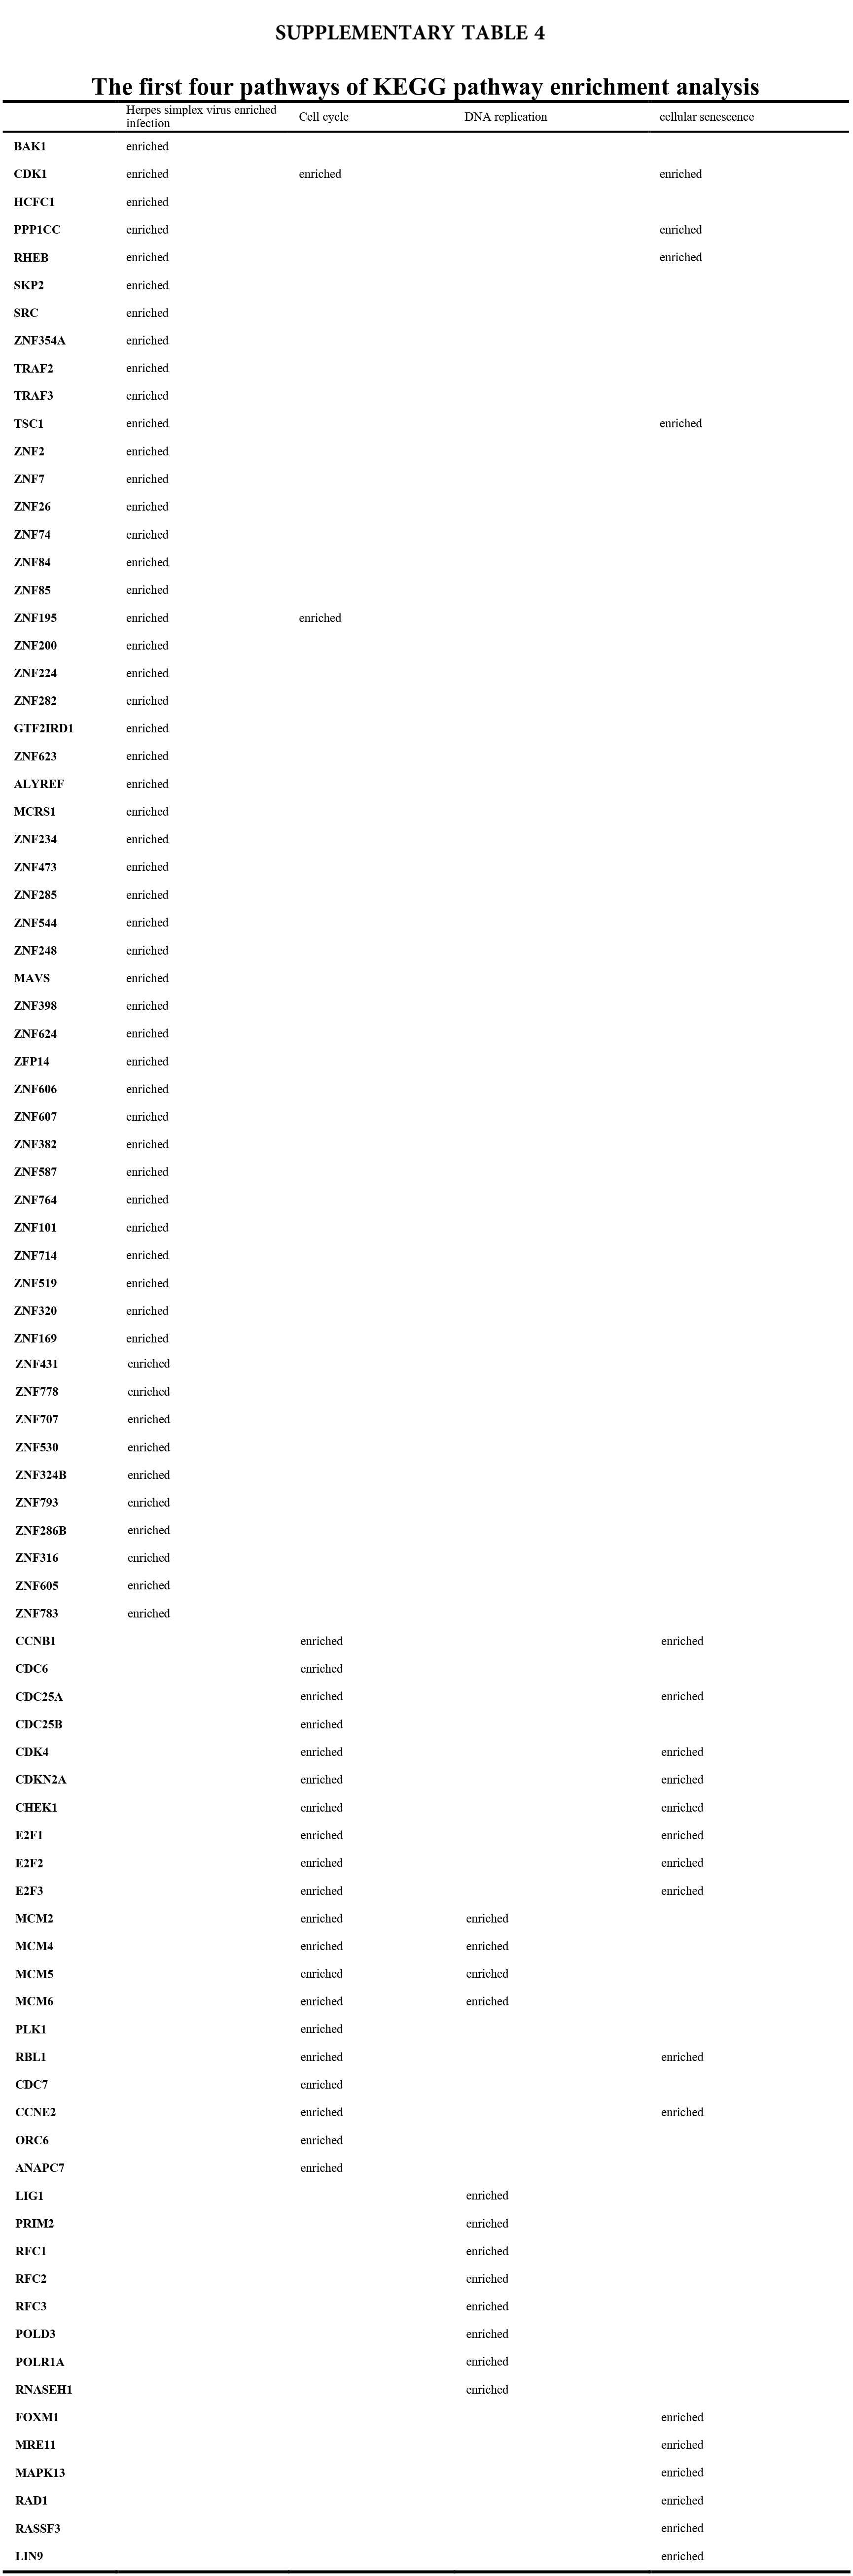
We accomplished the GO and KEGG enrichment analysis of the modular genes obtained by WGCNA analysis. In the GO biological processes analysis, 109 genes were enriched in the DNA repair pathway. 44 genes were enriched into DNA replication pathway. 45 genes were enriched into the DNA recombination pathway. 60 genes were enriched into the DNA conformation change pathway (Fig. 5A). In cellular components analysis, 117 genes were enriched in the chromosomal region pathway. 49 genes were enriched into the spindle pathway. 52 genes were enriched into the centrosome pathway. 16 genes were enriched into the replication fork pathway (Fig. 5B). In molecular functions analysis, 36 genes were enriched in catalytic activity, acting on DNA pathway. 58 genes were enriched into the chromatin binding pathway. 27 genes were enriched into the helicase activity pathway. 64 genes were enriched into the transcription coregulator activity pathway (Fig. 5C). In the KEGG analysis, 54 genes were enriched into the Herpes simplex virus 1 infection pathway. 22 genes were enriched into the cell cycle pathway. 12 genes were enriched into the DNA replication pathway. 20 genes were enriched into the cellular senescence pathway (Fig. 5D). All the above-enriched genes are up-regulated genes (Suppl. Tables 1–4).
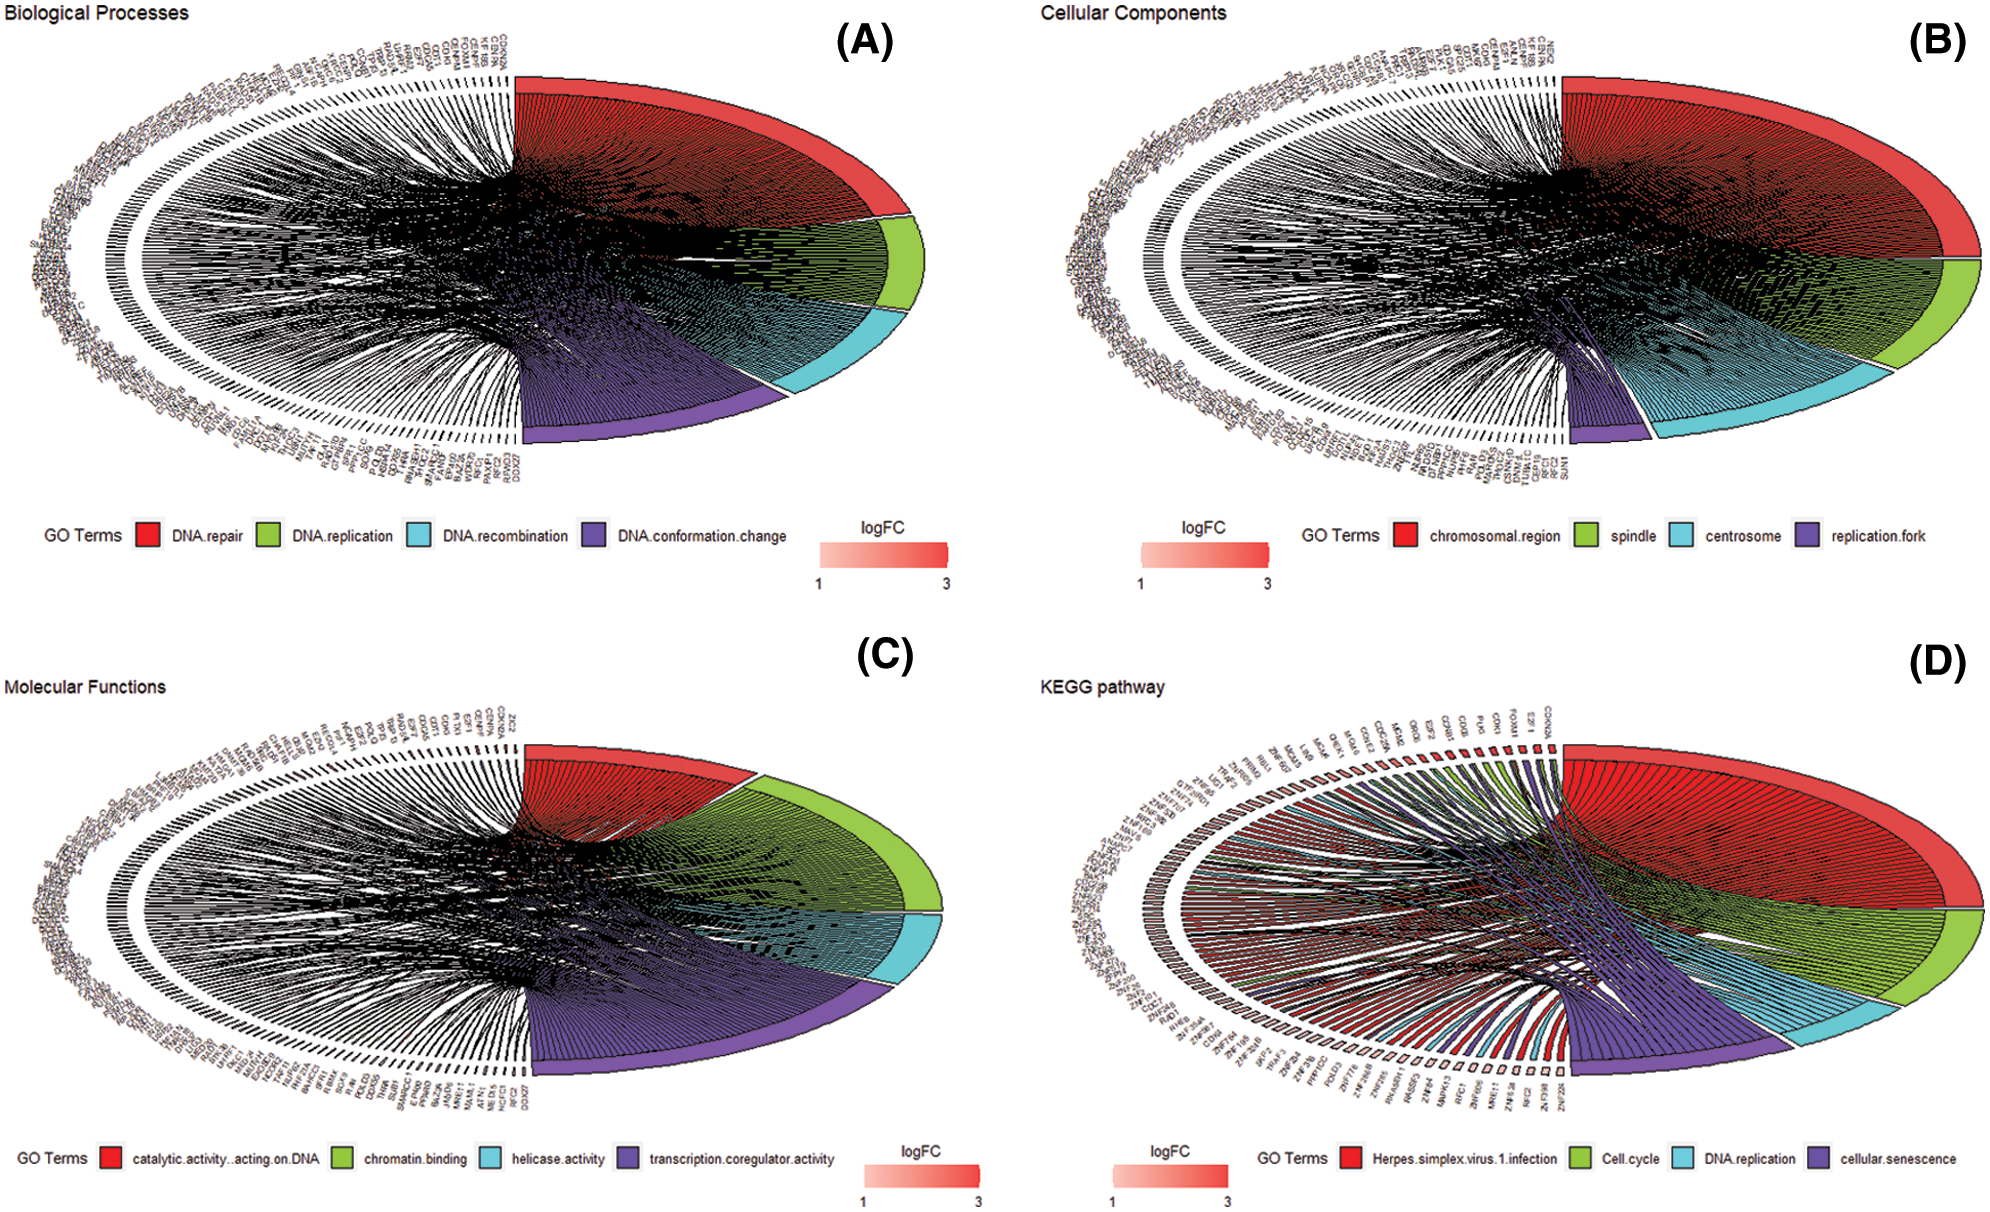
Figure 5: GO and KEGG enrichment analysis. (A) Biological Process enrichment analysis. (B) Cellular Component enrichment analysis. (C) Molecular Function enrichment analysis. (D) KEGG pathway enrichment analysis.
Construction of target gene signature and nomogram
Through univariate COX regression analysis of 833 modular genes, we confirmed 511 genes significantly related to OS (P < 0.01). Based on the LASSO regression analysis of 511 genes, 10 genes (TCOF1, SLC41A3, FARSB, PFKFB4, OLA1, PPM1G, GRPEL2, CDCA8, MAFG, MEX3A) (Fig. 6) that are significantly related to the patient’s prognosis were further determined (Fig. 7A). Through ROC analysis of these 10 genes, we selected 5 genes with diagnostic significance to construct the gene signature CDCA8 (AUC = 0.9773), SLC41A3 (AUC = 0.9749), PPM1G (AUC = 0.9704), TCOF1 (AUC = 0.9701), GRPEL2 (AUC = 0.9631) (Figs. 6A–6E). The prognosis of these 5 genes does not influence clinical phenotype.
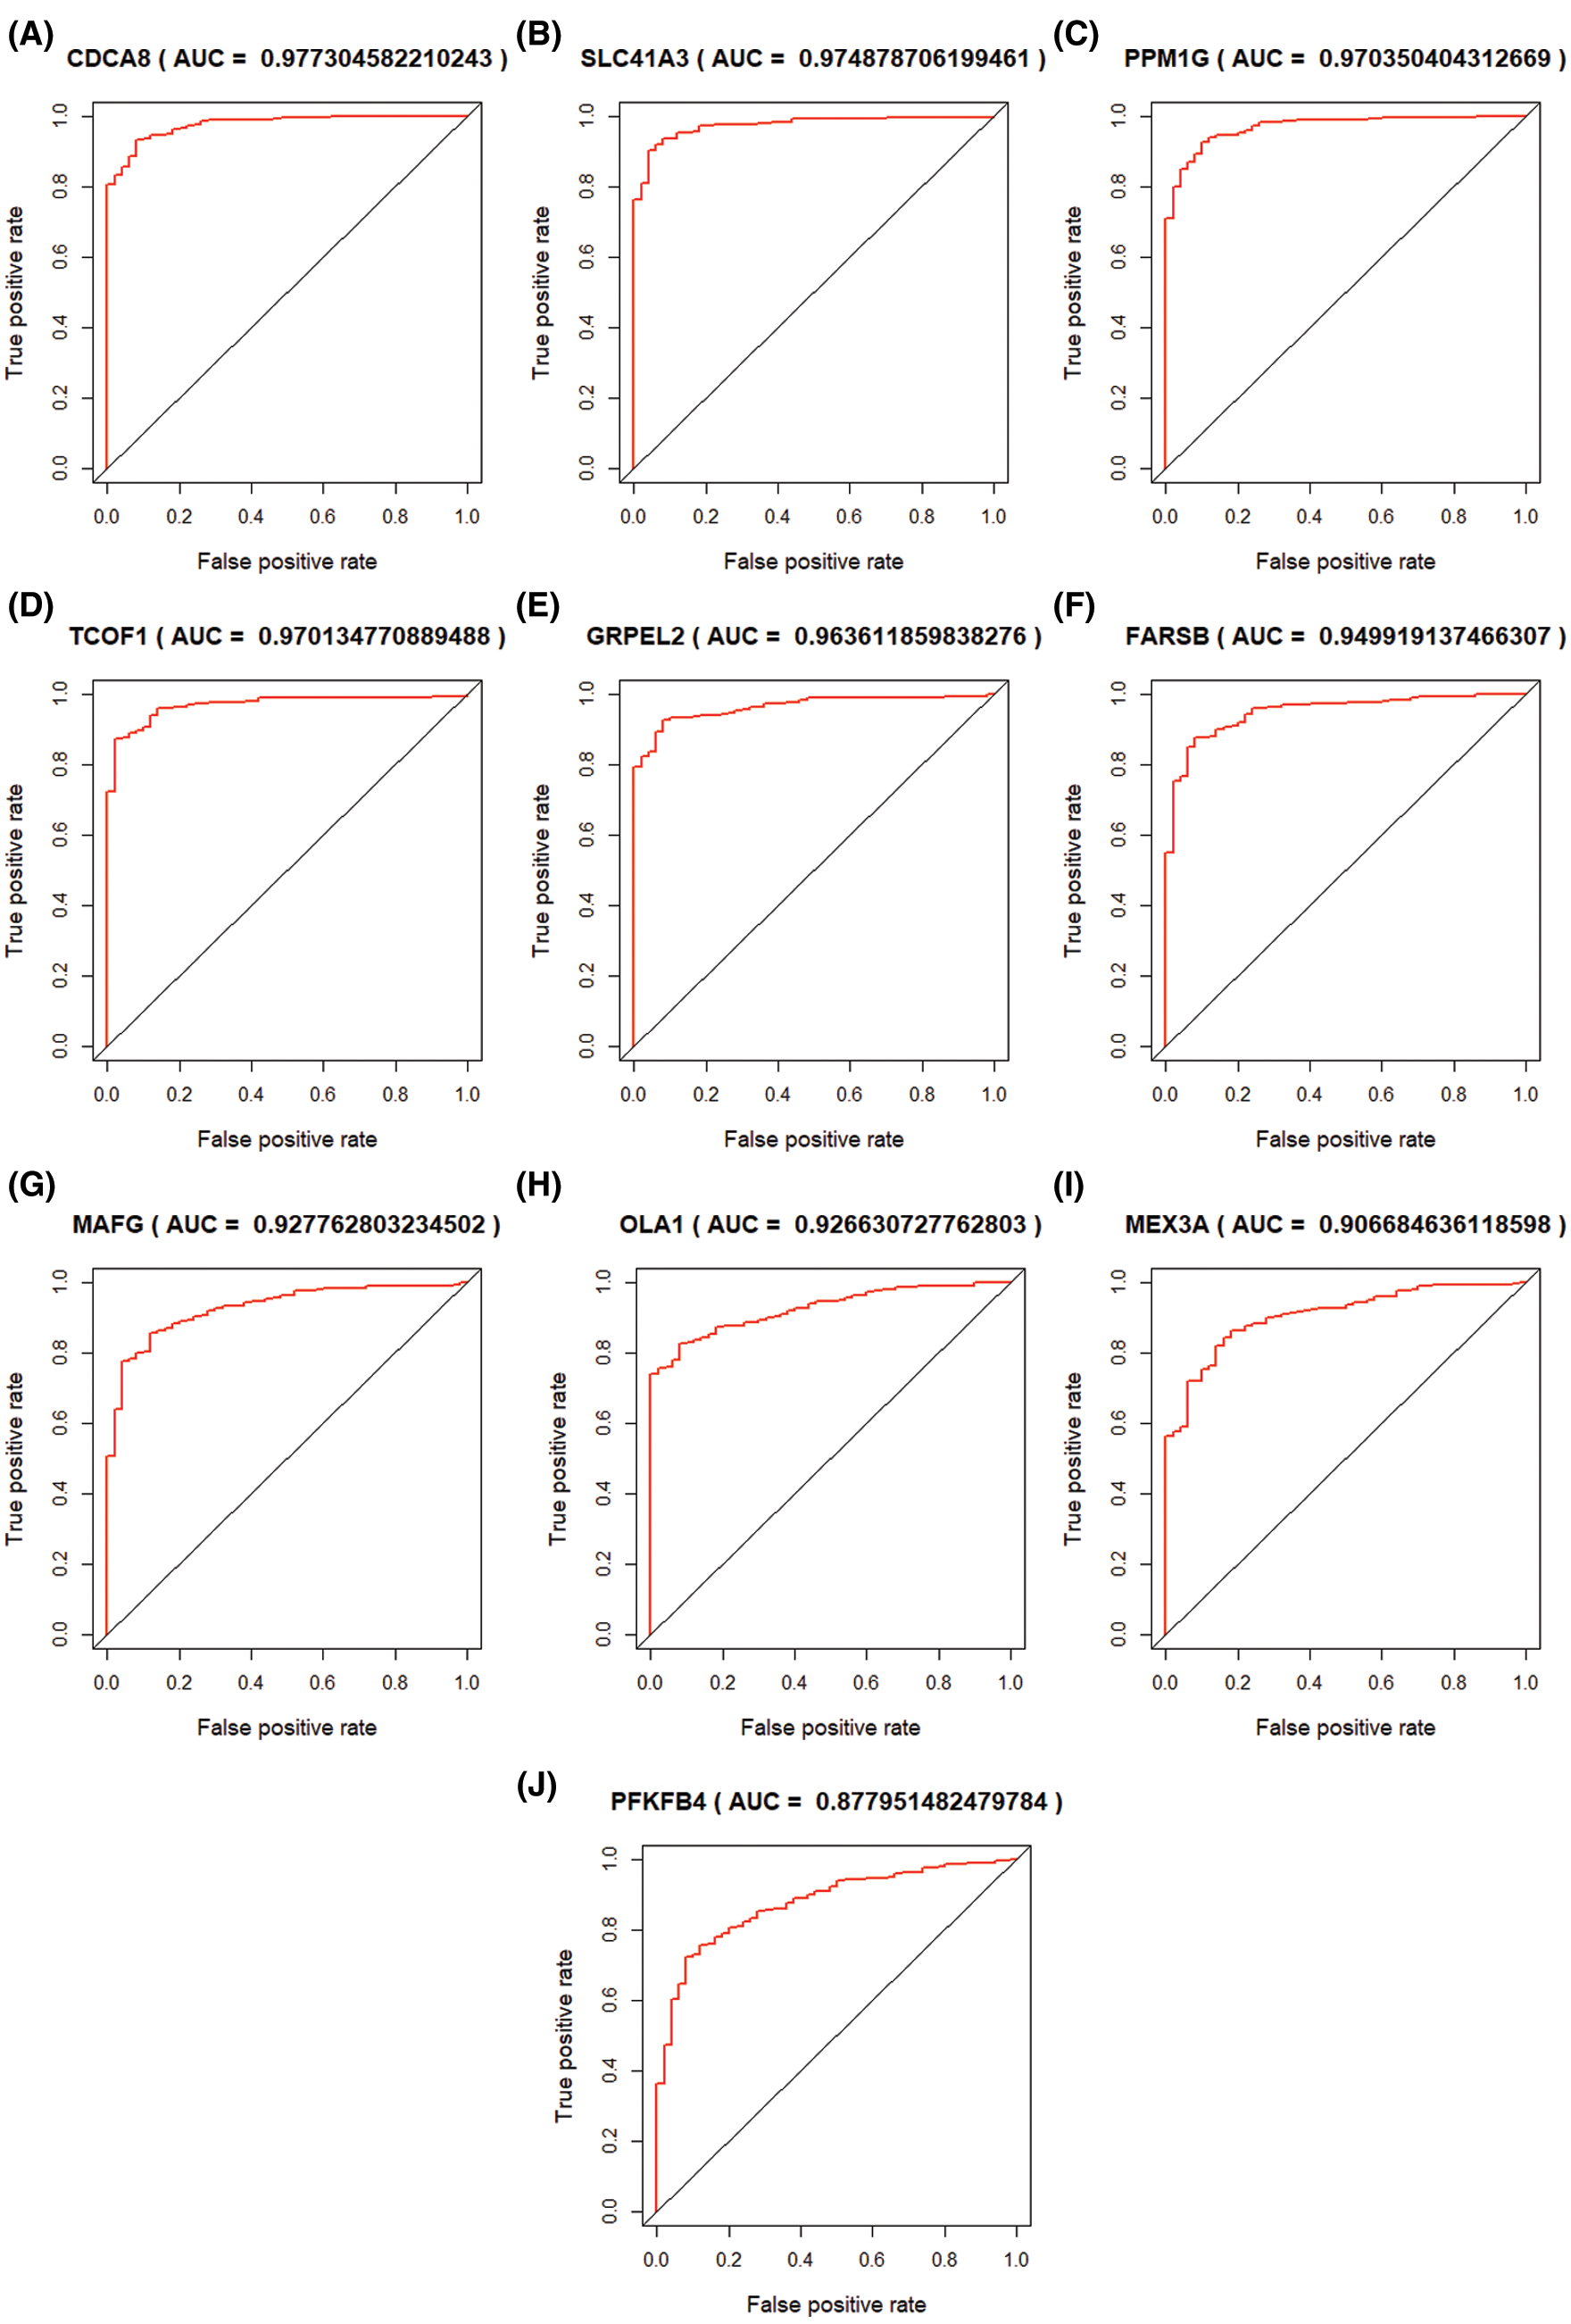
Figure 6: ROC curve of LASSO COX regression analysis result. 10 hub genes were selected and ordered by AUC value.
Finally, a prognostic formula is constructed based on gene expression and the corresponding LASSO coefficient, which is:
RS = 0.0324 × Expression of CDCA8 + 0.0087 × Expression of SLC41A3 + 0.0103 × Expression of PPM1G + 0.0039 × Expression of TCOF1 + 0.0954 × Expression of GRPEL2.
The median of the RS value was taken as the cutoff value, and 169 patient samples with RS values higher than the cutoff value were divided into high-risk groups, and 169 patients with RS values lower than the cutoff value were ranked into low-risk groups (Fig. 7B). By observing the dot-line and scatter plots that express the relationship between the two groups and the survival of patients, it is easy to find low-risk patients’ survival situation is better (Fig. 7C). By observing the heat map of signature gene expression in high and low-risk groups, RS increases with the increase of signature genes expression (Fig. 7D).
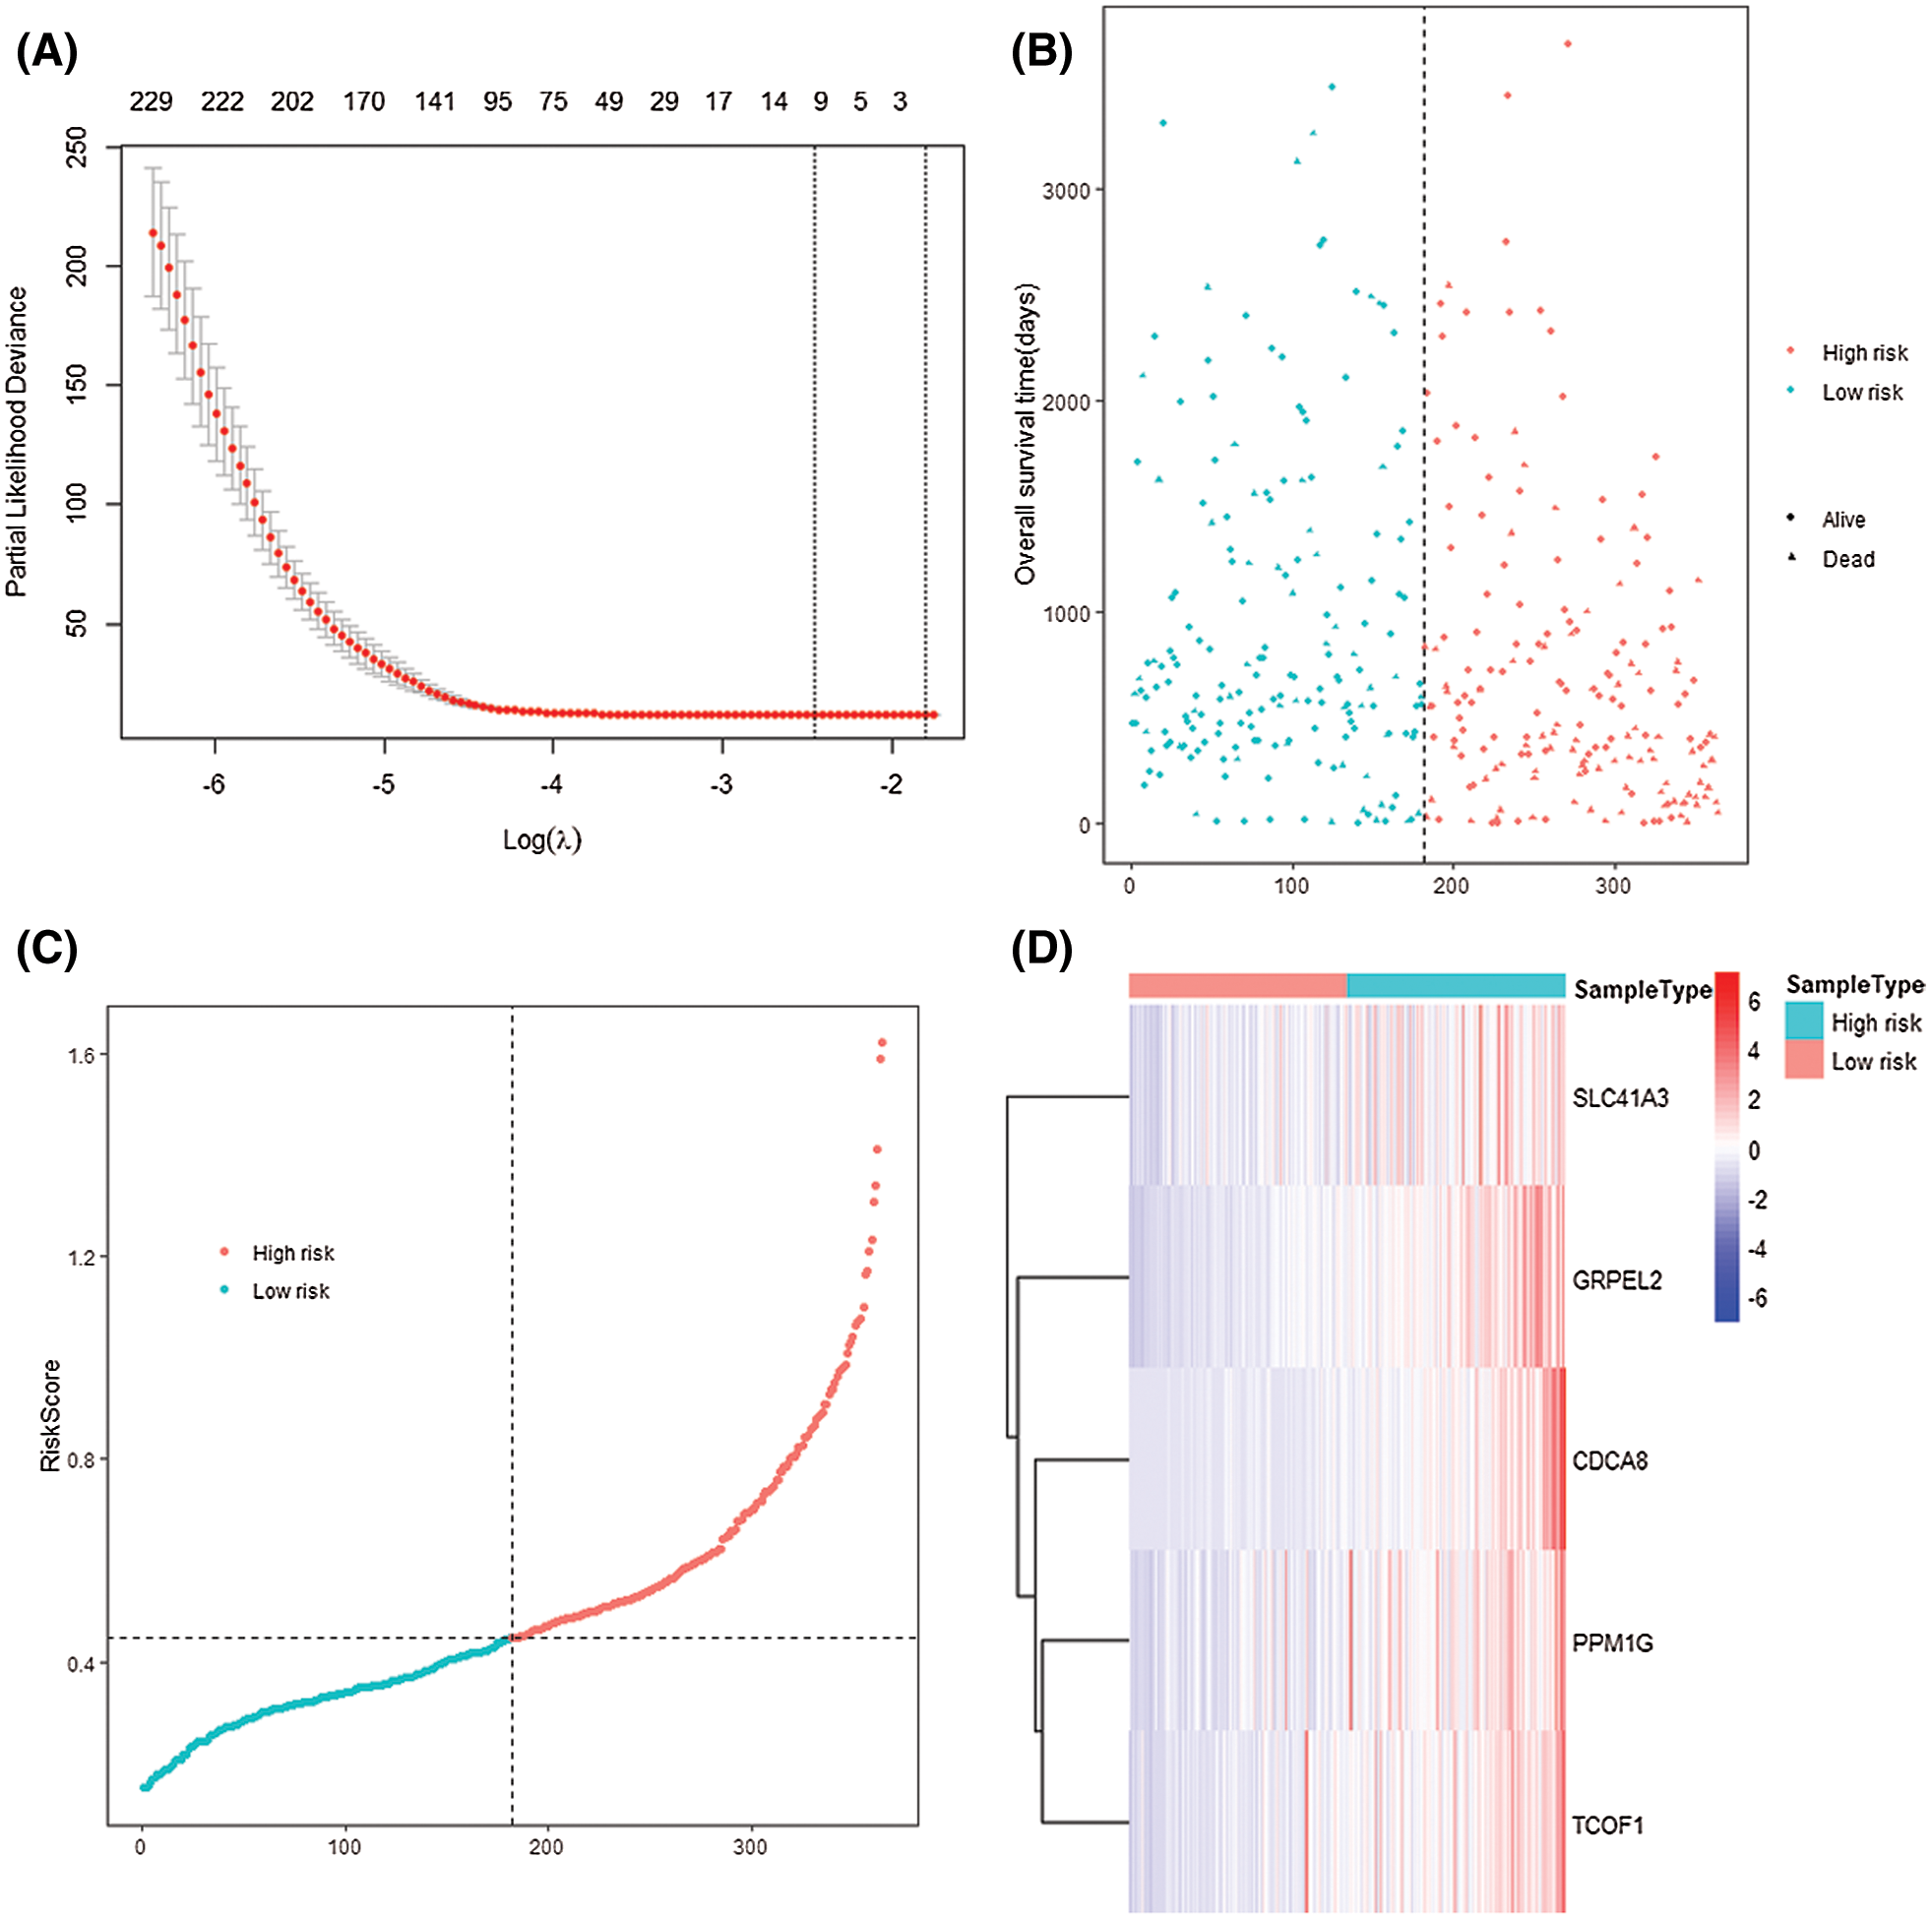
Figure 7: 5-gene-signature established and patients were divided into two groups by their risk score. (A) LASSO COX regression analysis. (B) Scatter plot of different RS patients’ survival. (C) Dot-line plot of patients’ risk score. Patient samples were divided into two groups according to their each RS, chose the median as the cut-off value. (D) Heatmap of the 5 signature genes in two risk groups.
The risk score obtained based on this gene signature has diagnostic significance for the survival prediction of HCC patients at 1 year (AUC = 0.791), 3 years (AUC = 0.686), and 5 years (AUC = 0.645). At the same time, the K–M curve of gene level grouping also shows that low-risk samples’ prognosis is significantly better (P < 0.0001) (Figs. 8A and 8B). The differential expression of 5 signature genes was studied. CDCA8 (P < 2.22e−16), SLC41A3 (P = 1.5e−11), PPM1G (P < 2.2e−16), TCOF1 (P < 2.2e−16), GRPEL2 (P < 2.2e−16) In the high-risk group, the expression was high (Figs. 8C–8E).
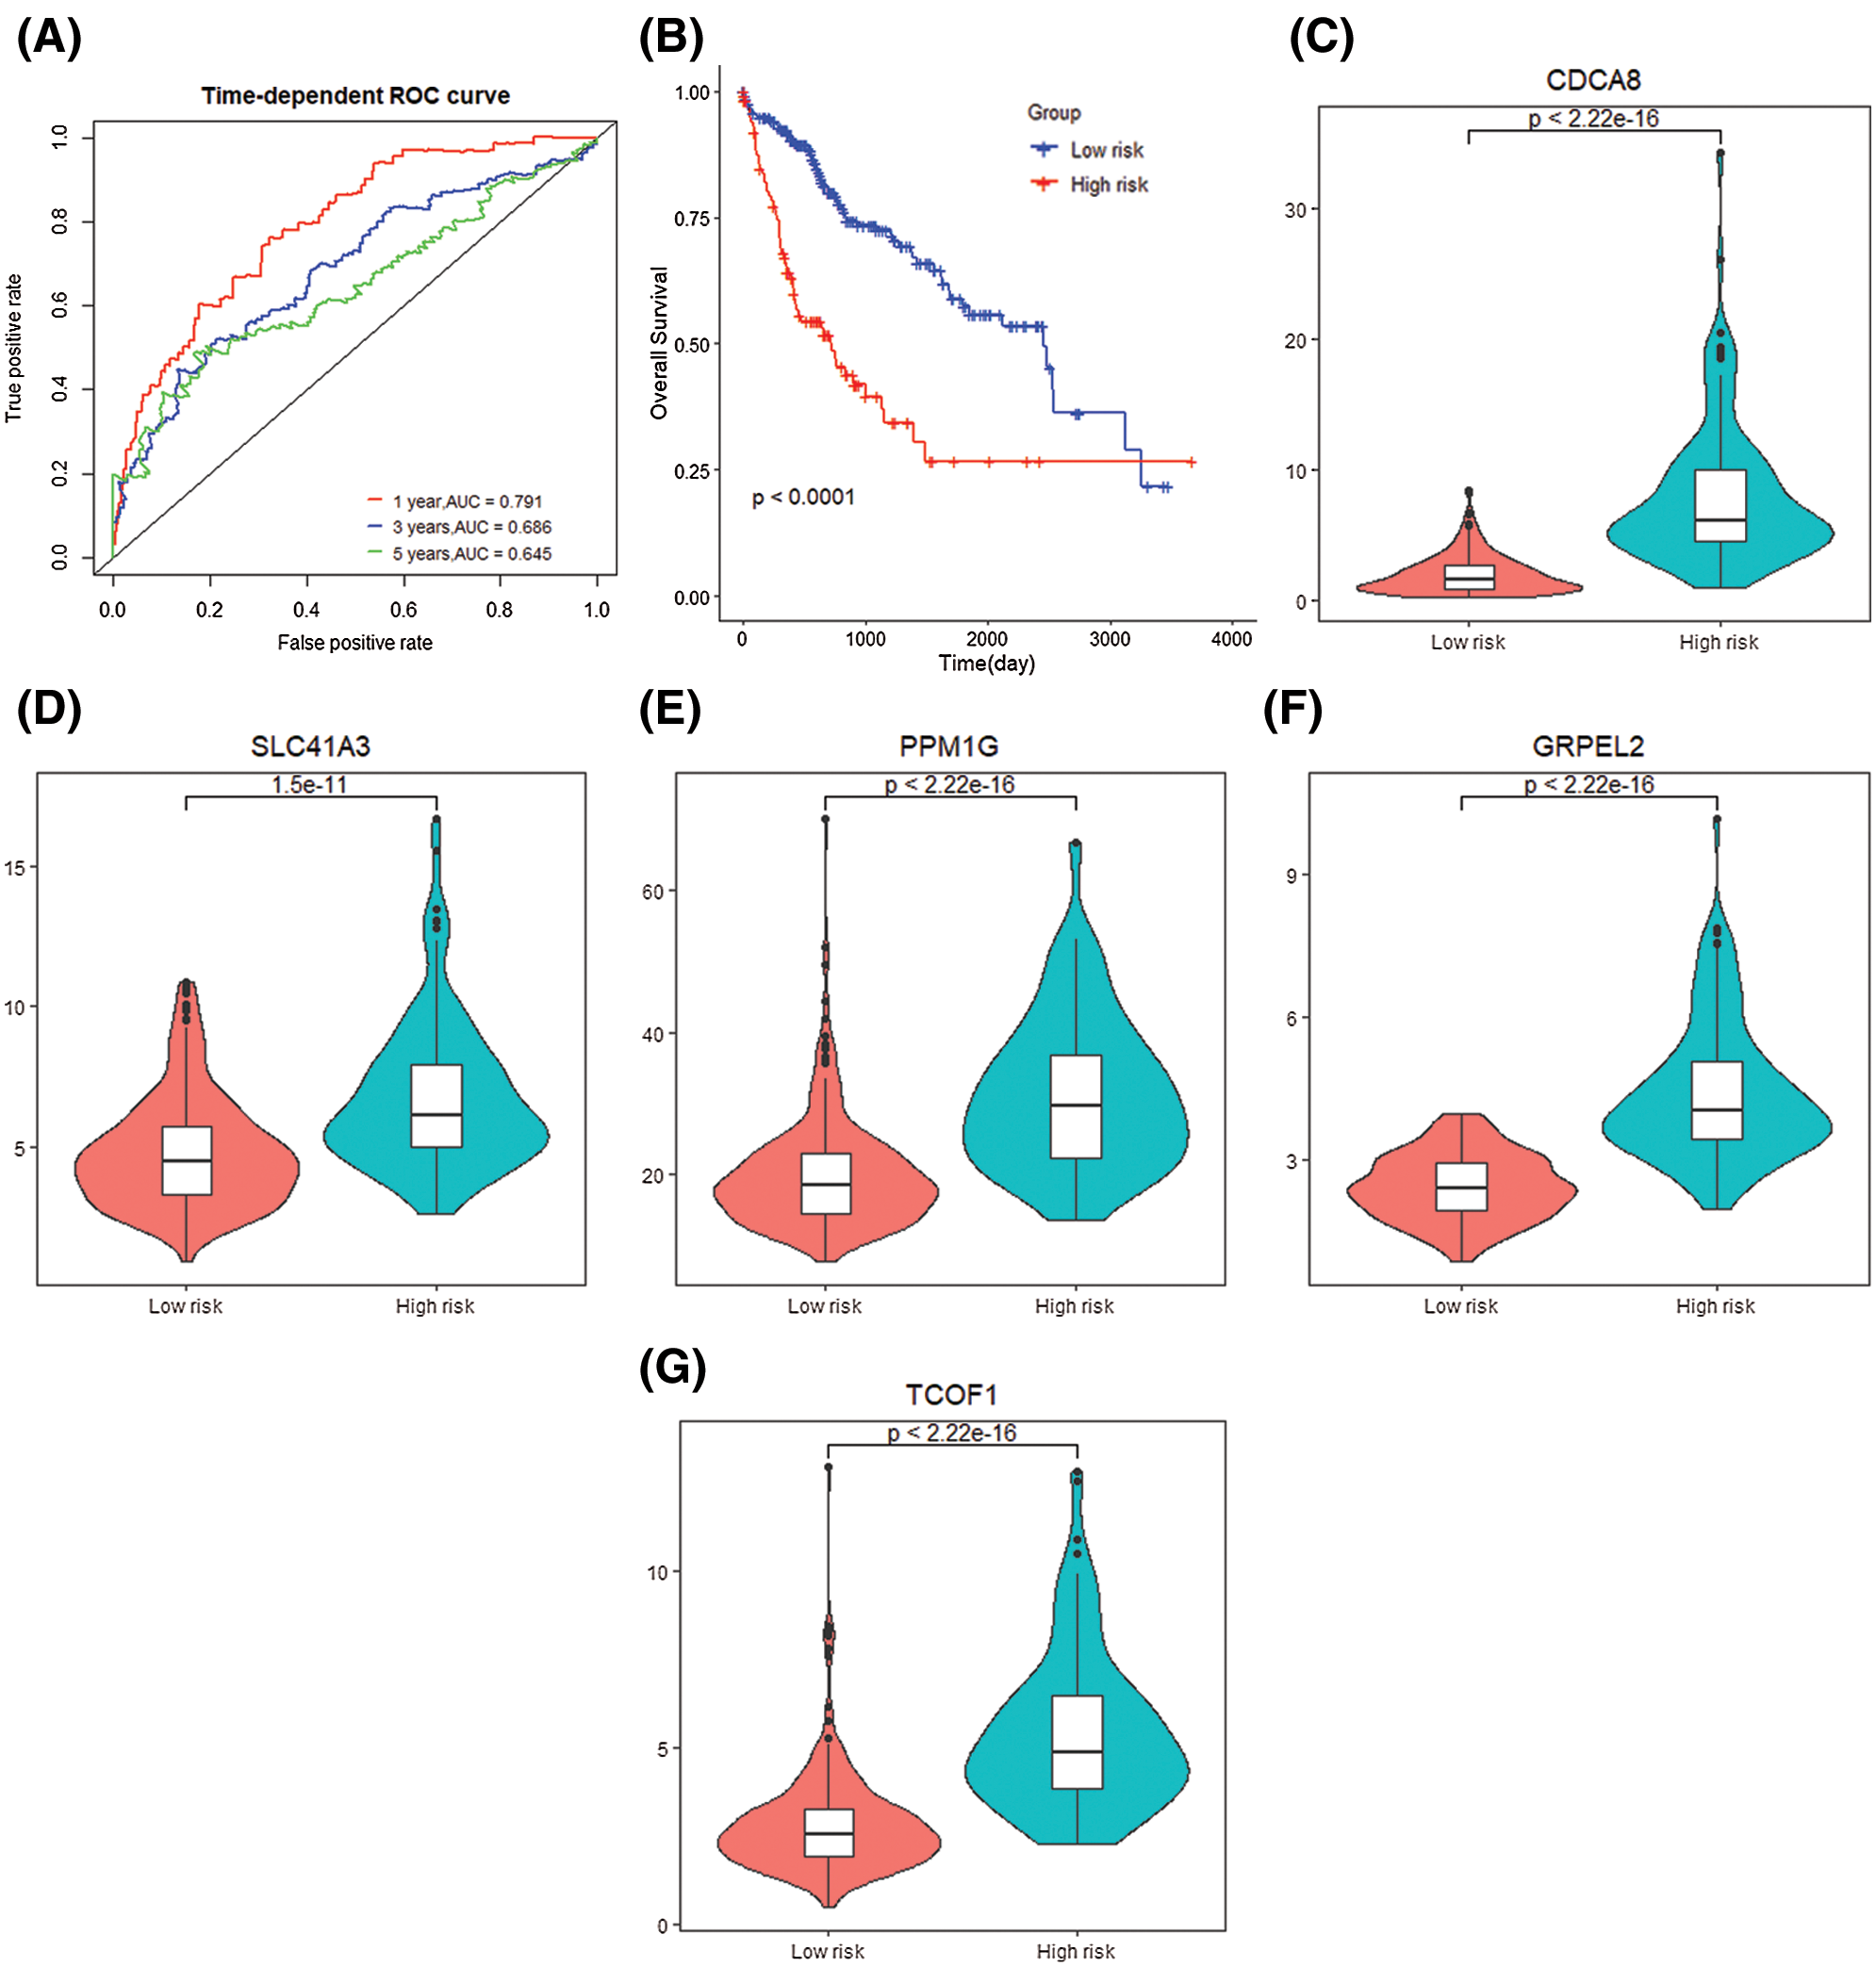
Figure 8: Gene signature prognosis. (A) Time dependent ROC curve for two risk groups. (B) K–M plot for two risk groups survival. (C–G) Signature genes differential expression in two groups.
We performed univariate and multivariate COX regression on RS and AJCC_Stage to explore the prognostic performance of the 5-gene gene signature. Univariate COX analysis illustrated that risk score and AJCC_Stage highly correlated with the survival of patients (P < 0.05). Nomogram analysis shows that the nomogram created by RS and AJCC_Stage (C-index = 0.644) is better than the nomogram created by RS (C-index = 0.607) or AJCC_Stage (C-index = 0.593) (Fig. 9A). Analyze the results separately. Simultaneous analysis of the prediction results of 1-year, 3-year and 5-year overall survival rate shows that the nomogram analysis based on the joint establishment of RS and AJCC_Stage has a better predictive ability for HCC patients (Fig. 9B).
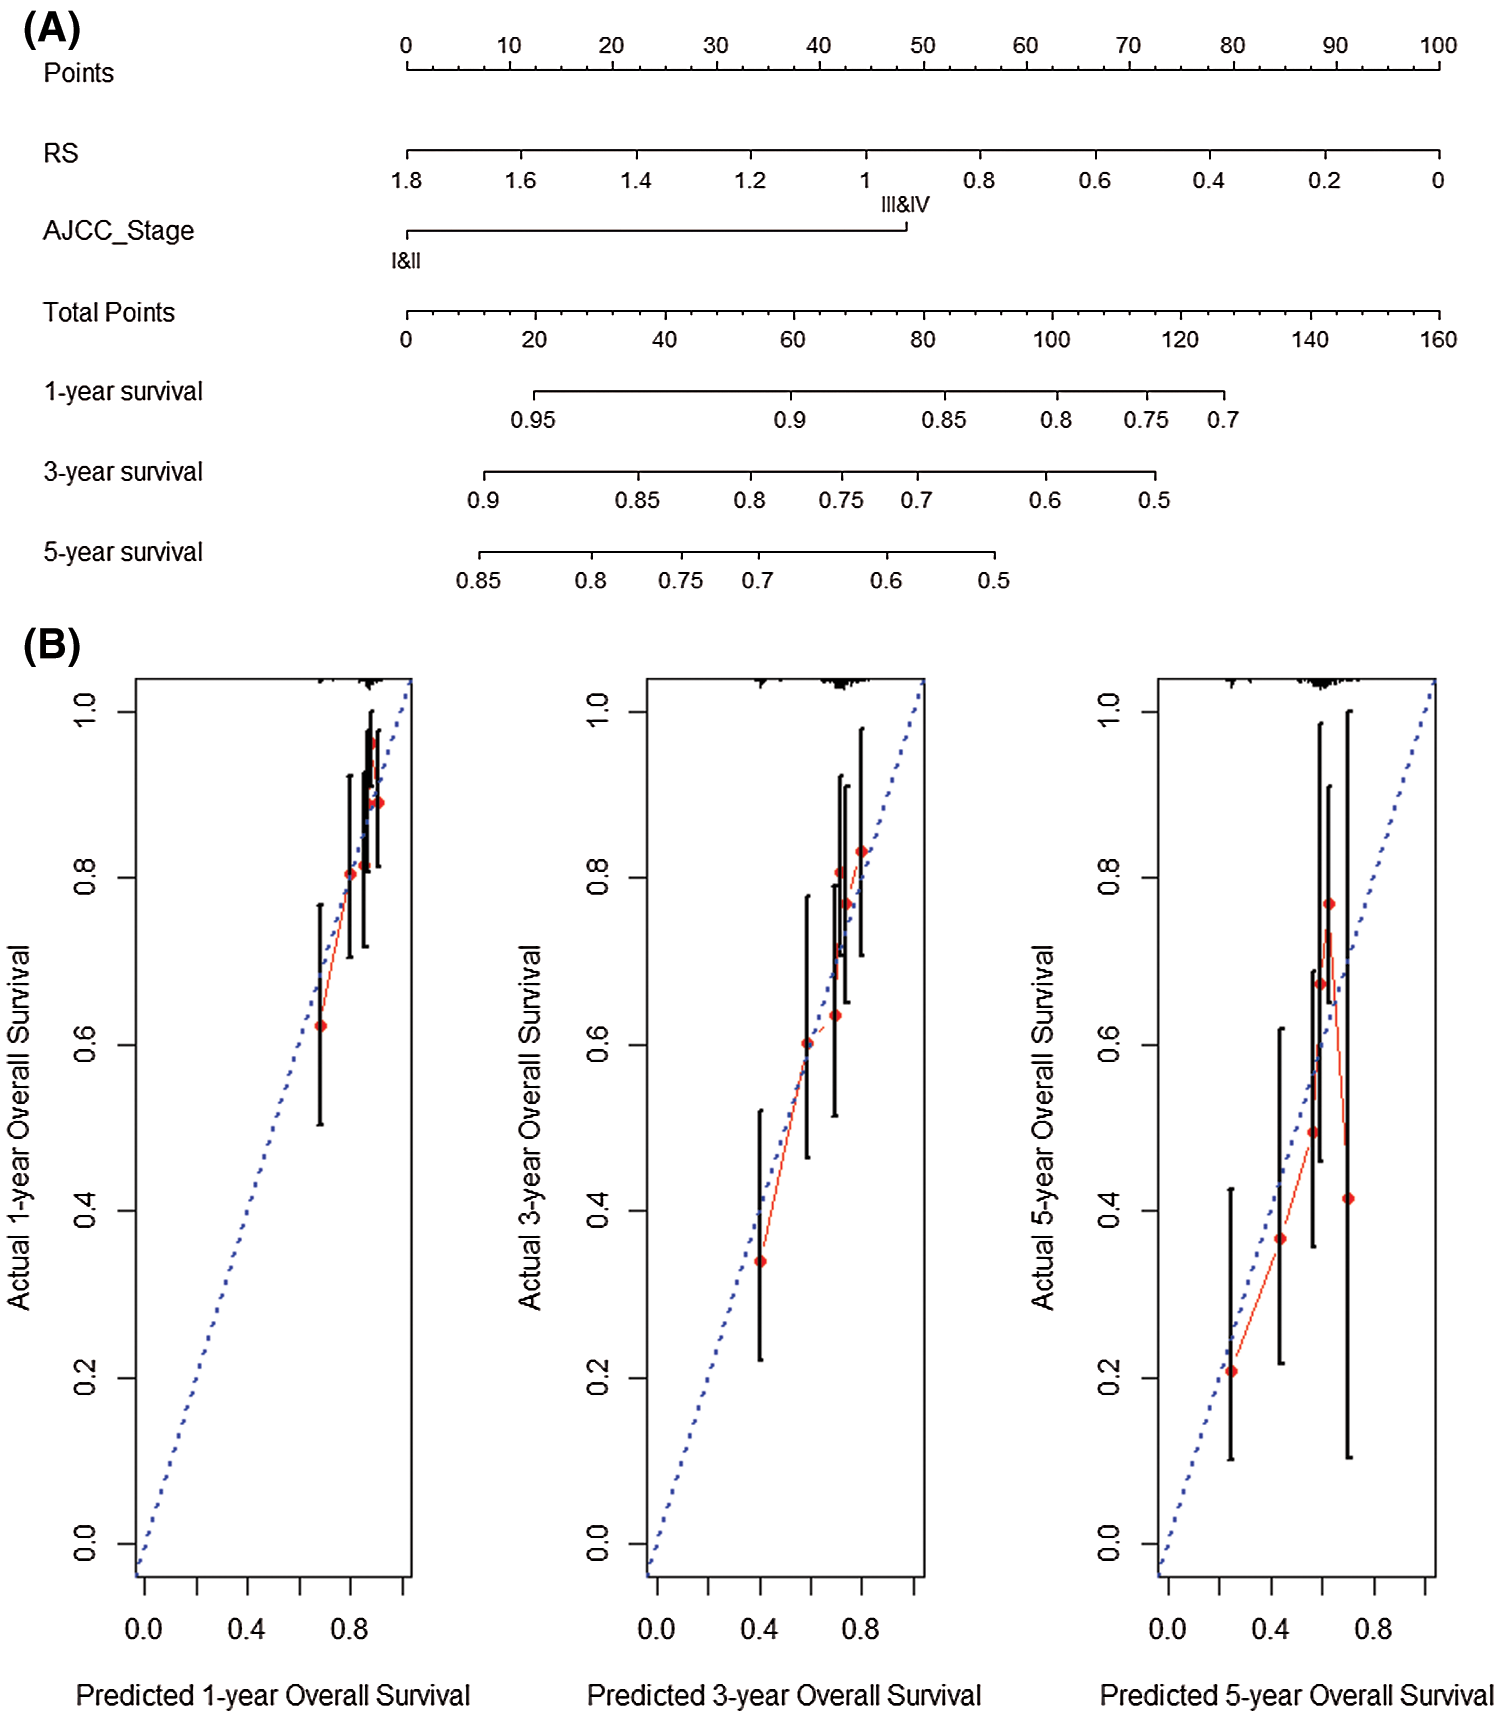
Figure 9: Nomogram analysis prognosis. (A) Nomogram created by RS and AJCC_Stage. (B) Prediction results of 1-year, 3-year and 5-year overall survival rate.
According to the obtained 5-gene signature, the 1-year (AUC = 0.656), 3-year (AUC = 0.597), and 5-year (AUC = 0.605) survival predictions of data set GSE14520 for HCC patients have diagnostic significance. K–M curve demonstrated the high-risk samples showed a low overall survival time and poor prognosis (P < 0.0001) (Figs. 10A and 10B). The 5 genes that make up the gene signature CDCA8 (P = 9.1e−11), SLC41A3 (P = 1.5e−11), PPM1G (P = 0.0041), TCOF1 (P = 0.0037), GRPEL2 (P < 2.2e−16) High expression in the high-risk group (Figs. 10C–10G).
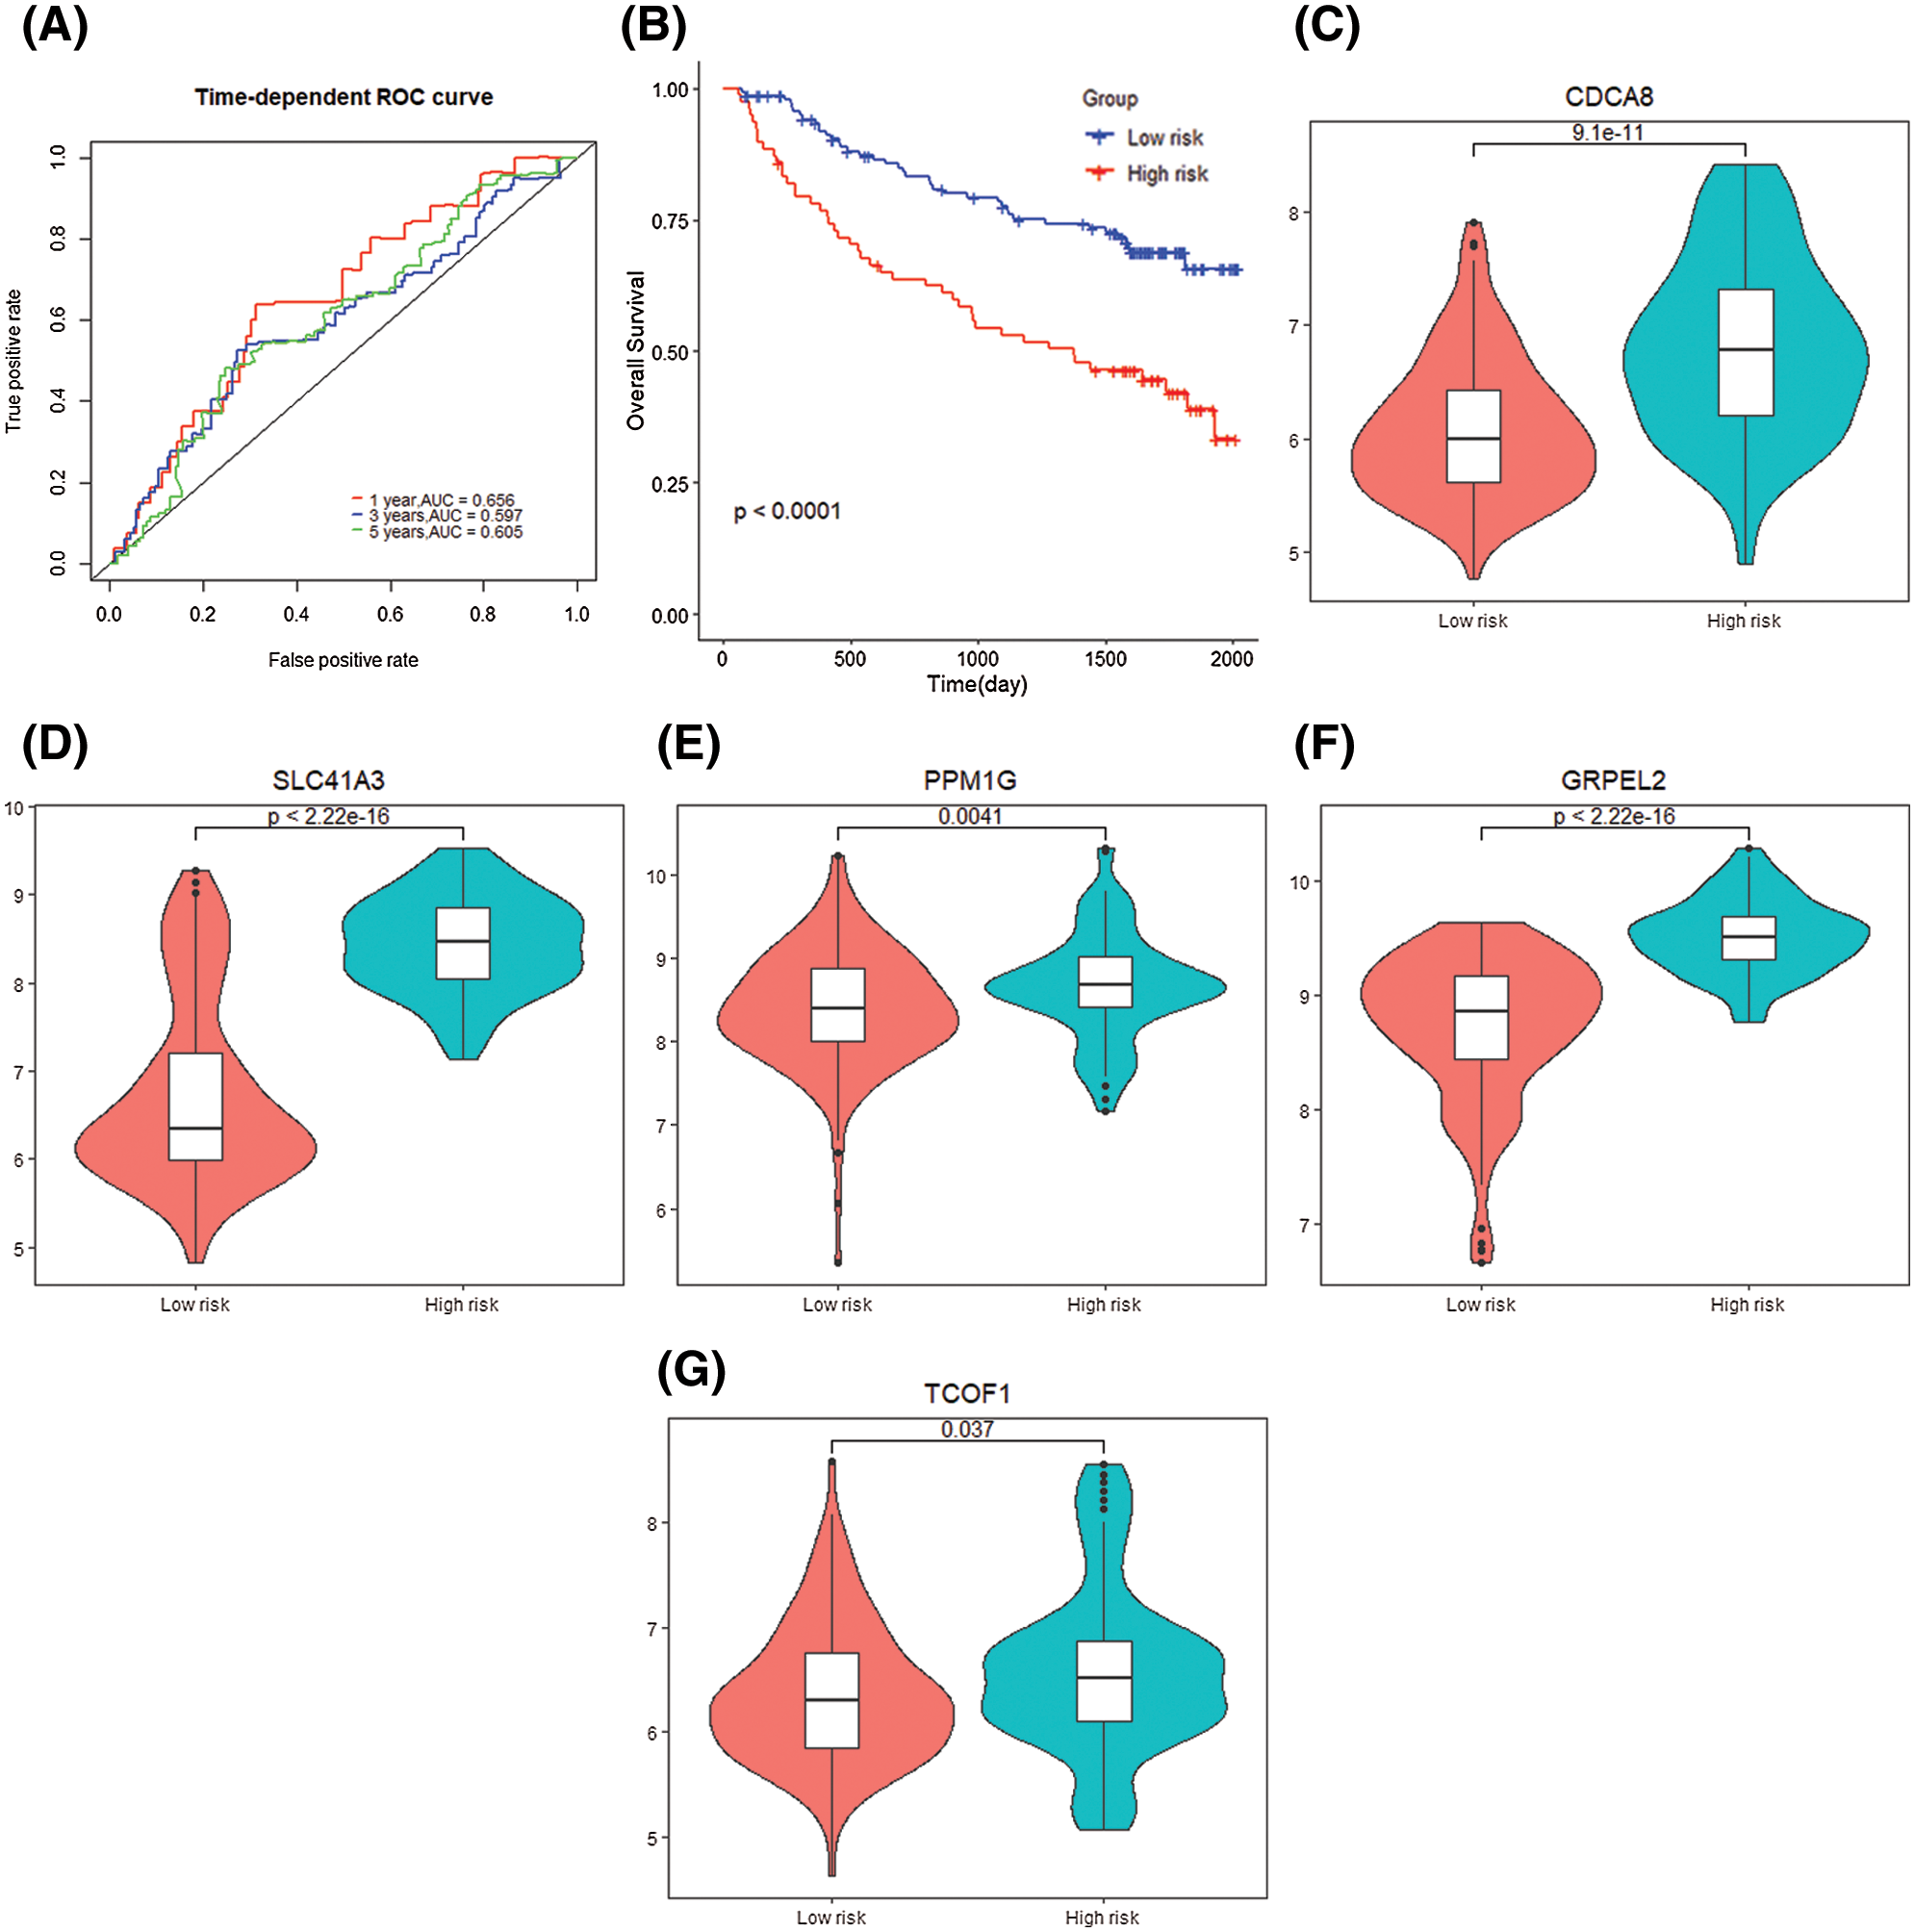
Figure 10: Gene signature verification with GSE14520 dataset. (A) Time dependent ROC curve for two risk groups in GSE14520 dataset. (B) K–M plot for two risk groups survival in GSE14520 dataset. (C–G) Signature genes differential expression in two groups.
Subsequently, the sample RS and AJCC_Stage in the data set GSE14520 were used to complete univariate multivariate COX regression analysis, and jointly constructed a nomogram (C-index = 0.765) with good prognostic ability (Fig. 11A). At the same time, the 1-year, 3-year and 5-year prediction-true survival curves obtained better fitting results (Fig. 11B).
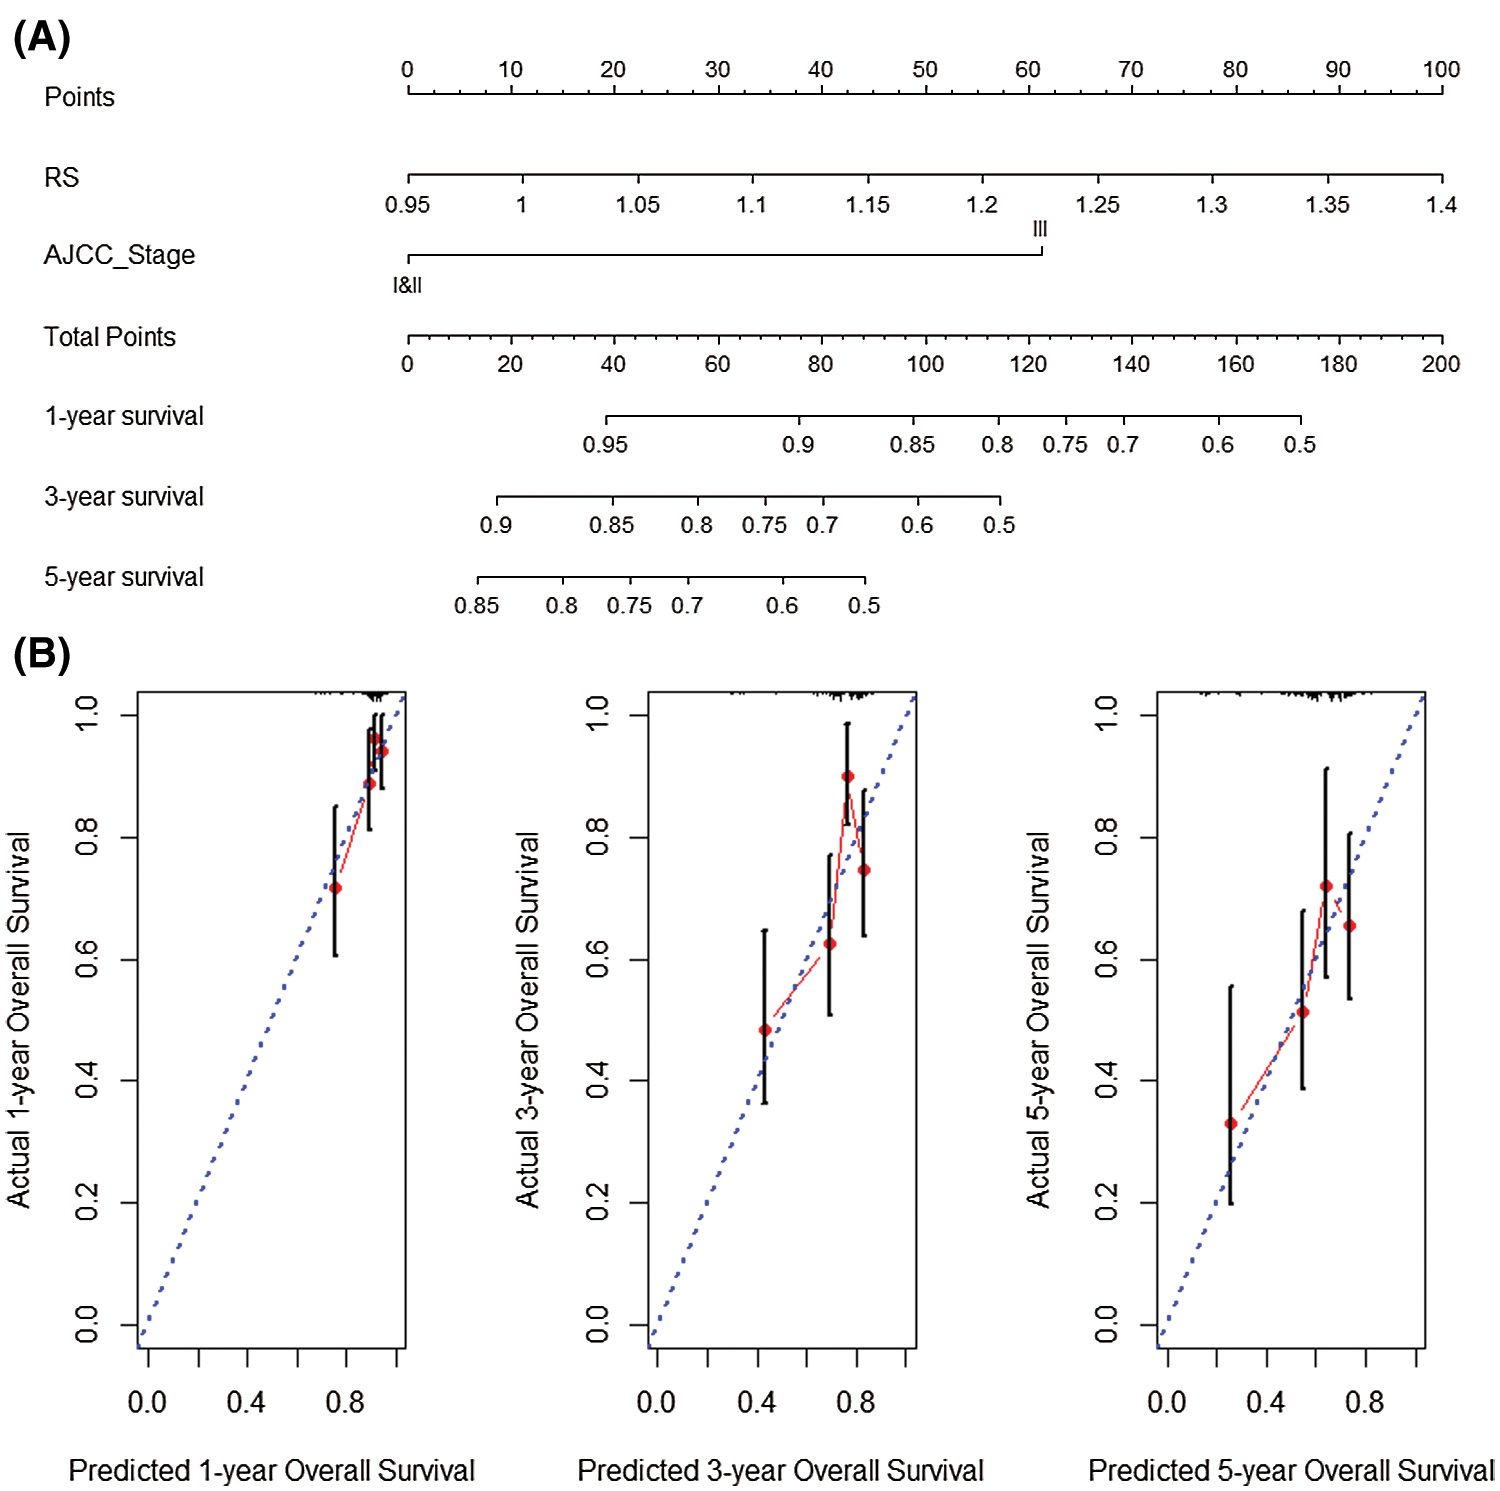
Figure 11: Nomogram analysis verification with GSE14520 dataset. (A) Nomogram created by RS and AJCC_Stage in GSE14520 dataset. (B) Prediction results of 1-year, 3-year and 5-year overall survival rate in GSE14520 dataset.
Immune infiltration and GSEA between high- and low- group
We obtained the proportion of 22 immune cells in each patient by applying Cibersort’s deconvolution method. The top five subtypes of immune cells in the HCC patient group are (19.336%), T cells CD4 memory resting (15.039%), Macrophages M0 (12.645%), T cells CD8 (9.949%), and macrophages M1 (8.396%) (Fig. 3). Based on the method of dividing risk groups according to RS, the top five subtypes in the high-risk samples we obtained are Macrophages M2 (17.735%), Macrophages M0 (16.725%), and T cells CD4 memory resting (13.368%), T cells CD8 (9.949%), macrophages M1 (8.158%) (Fig. 12A). The top five subtypes of immune cells in the low-risk samples we obtained were Macrophages M2 (20.919%), T cells CD4 memory resting (17.039%), T cells CD8 (10.036%), Macrophages M0 (8.631%), macrophages M1 (8.627%) (Fig. 12B). Subsequently, we compared the immune infiltration situation of the high-risk group and the low-risk group, using P < 0.05 as the screening condition, and determined a total of 10 immune cells with significant differential expression. Among the 10 immune cells, T cells CD4 memory resting, T cells regulartory (Tregs), NK cells resting, monocytes, and macrophages M2 were reduced in the high-risk group, while the expression of B cells memory, T cells CD4 memory activated, and T cells follicular helper, macrophages M0 and neutrophils in the high-risk group was significantly higher than in the low-risk group (Fig. 12C).
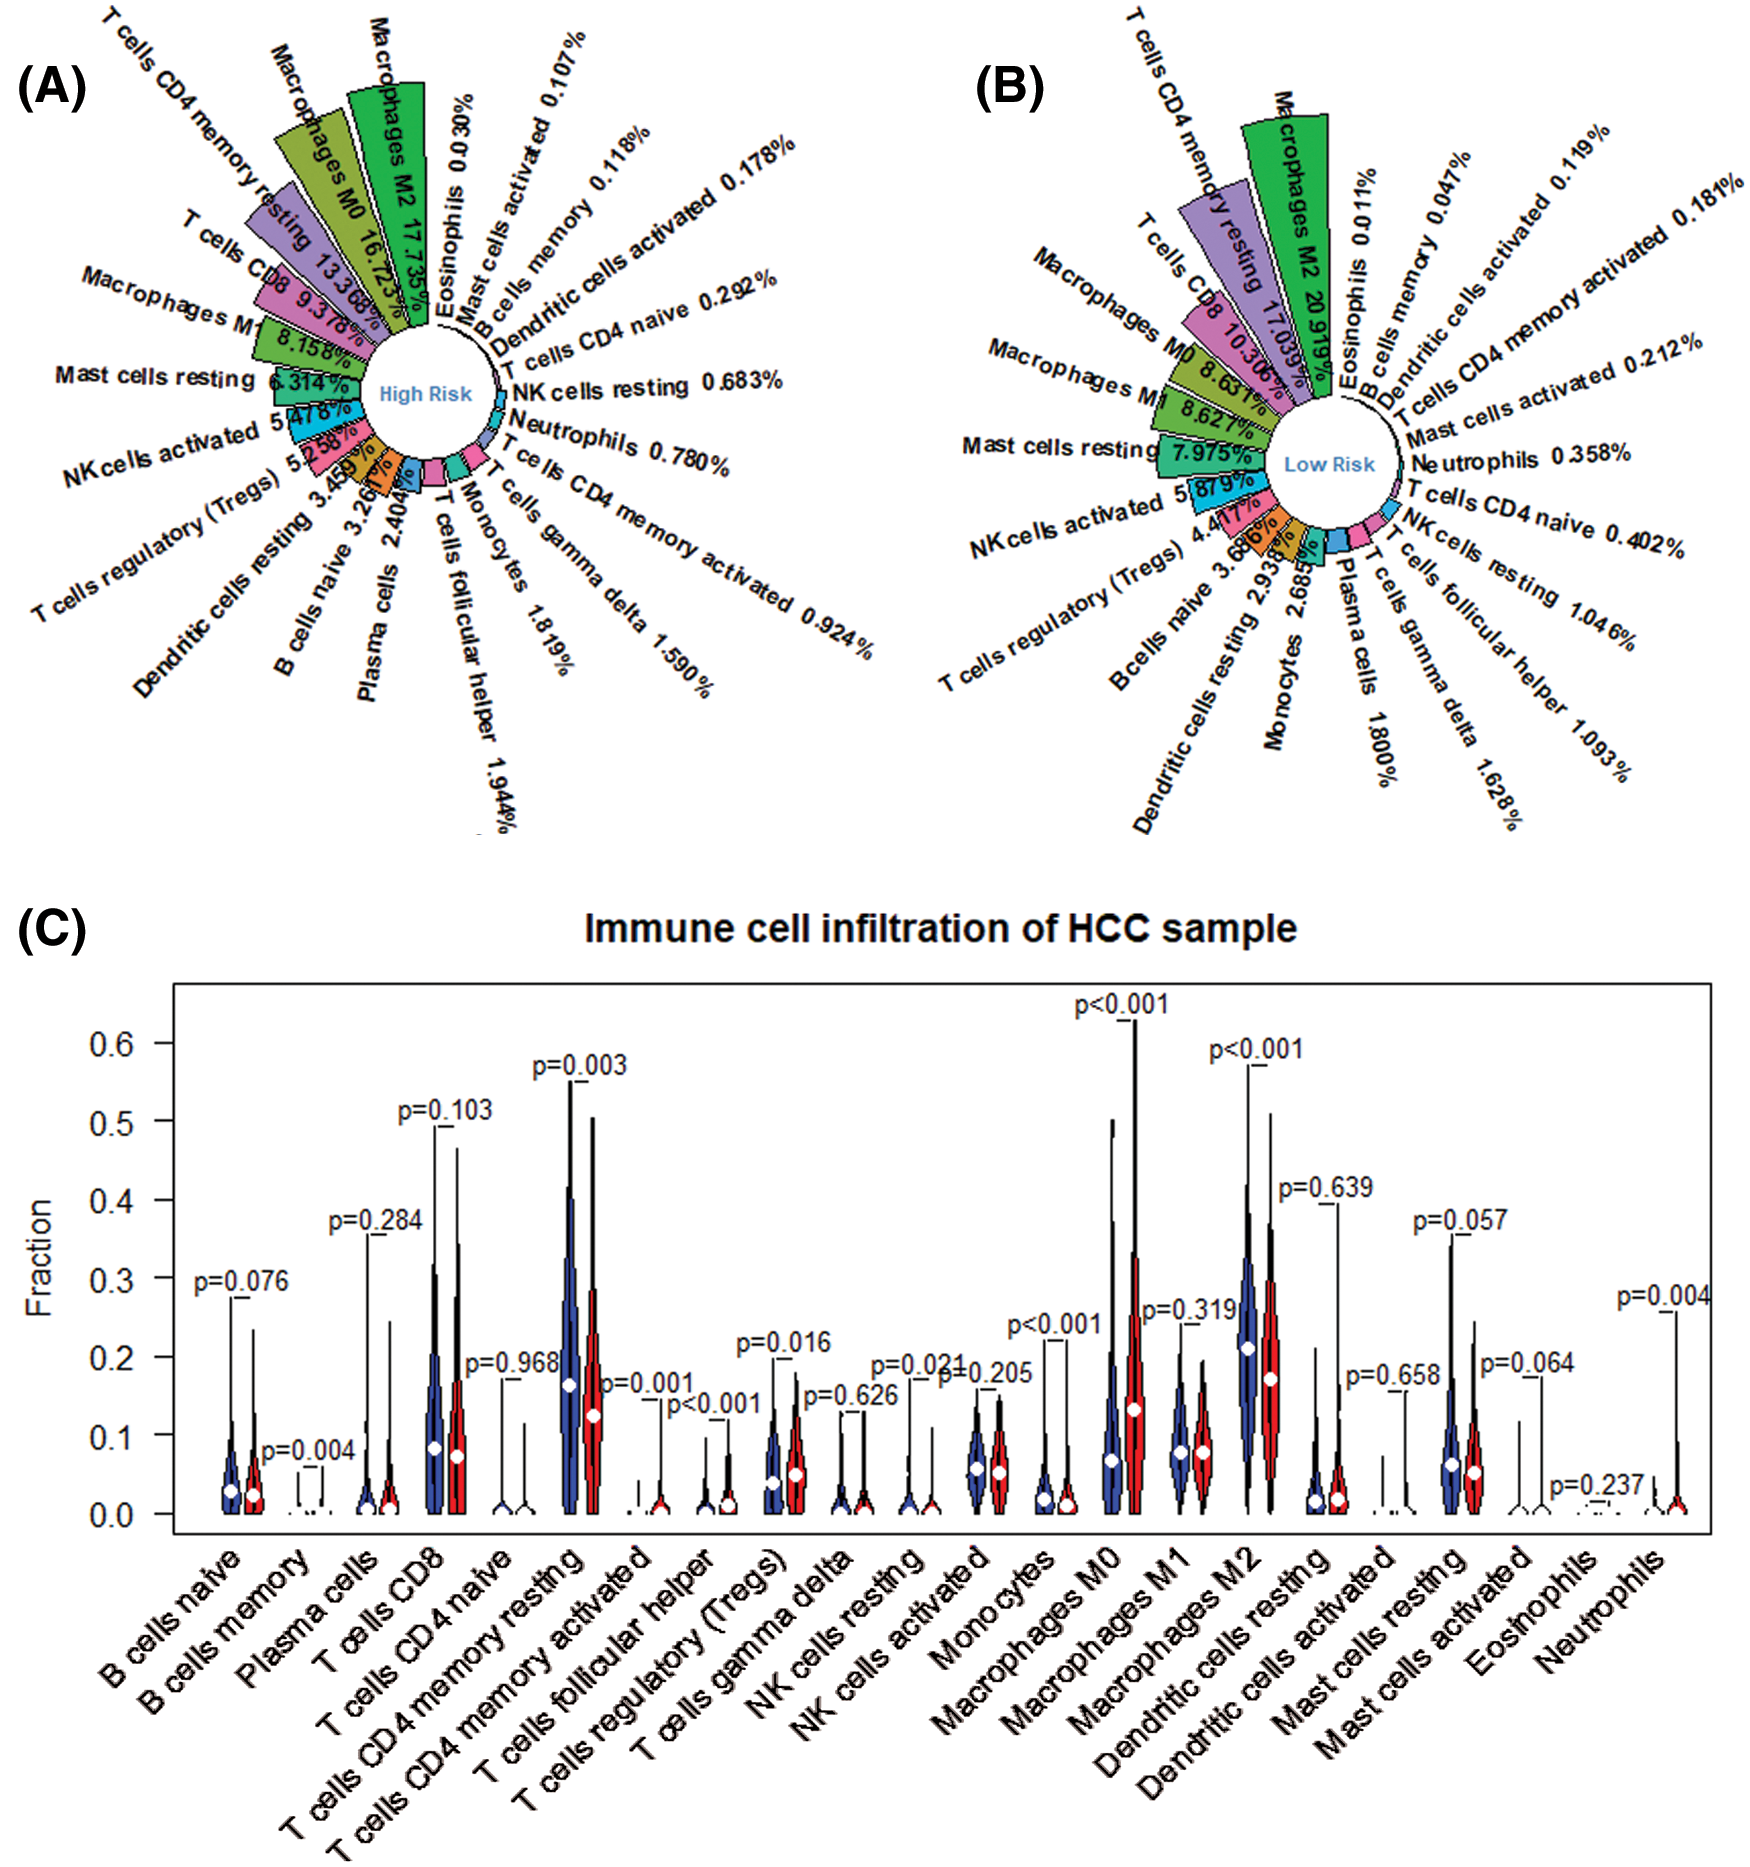
Figure 12: Differential expression of immune cell between high risk group and low risk ones. (A) Immune infiltration in high risk group. (B) Immune infiltration in low risk group. (C) Differential immune infiltration between high risk group (red) and low risk one (blue).
Eight pathways were analyzed by GSEA based on the gene expression of high- and low-risk patients: Cell cycle, ECM-receptor interaction, Herpes simplex virus 1 infection, p53 signaling pathway, Inositol phosphate metabolism, MicroRNAs in cancer, Phosphatidylinositol signaling system, Renal cell carcinoma (Fig. 13).
Figure 13: (Continued)
As a malignant tumor disease, the development process of HCC is highly related to the expression of transcriptome genetic material (Boyault et al., 2007). At the same time, the process of HCC tumor growth is very complicated, and it is affected by a variety of genetic materials and immune microenvironment. Therefore, the investigation of multiple genetic materials and the comprehensive investigation of multiple genetic materials need to be completed urgently. The study started with the differentially expressed microRNAs in HCC patients, found the core differential target genes of this miRNA by constructing a weighted gene co-expression network, and finally constructed a prognostic model through COX regression analysis and LASSO regression analysis. The survival analysis and nomogram confirmed that the proposed model has better predictive ability. The model and immune infiltration were investigated comprehensively, and the immune infiltration of patients with different prognostic scores was observed.
MicroRNAs are small non-coding endogenous regulatory RNA molecules that bind to target mRNA through base pairing, thereby regulating gene expression at the post-transcriptional level. Studies have shown that miR-126-3p is related to the development of HCC (Du et al., 2014). At the same time, some target genes of miR-126-3p are indeed involved in the relevant pathways of HCC (Lou et al., 2018). However, the construction of a prognostic model based on the target gene of miR-126-3p has not yet been completed. This study first analyzed the expression and prognosis of miR-126-3p in HCC patients. The obvious low expression of miRNA and outstanding prognostic differences proved that miR-126-3p has great research value in HCC. Then, by clustering the differential target genes of miR-126-3p with respect to HCC, a gene-weighted co-expression network was constructed. The differential target gene expression level is linked with the clinical phenotype Macrophages M2 expression level, Tumor, Node, Metastases, AJCC_Stage, ISUP_Grade, and the core genes are screened out. These genes are more closely related to other genes and are also more closely associated with the clinical phenotype of HCC patients. In this study, the core genes were enriched and analyzed. The main enriched KEGG pathways include Herpes simplex virus 1 infection, Cell cycle, DNA replication, and cellular senescence, and found the main ways for these core genes to regulate the development of HCC. The TNM staging system of the American Joint Committee on Cancer (AJCC_Stage) is based on the most important prognostic indicators, namely: tumor number (Tumor), lymph node positive and distant metastasis (Node), and whether there is vascular invasion (Metastases) in the tumor (Xing et al., 2016). And the ISUP_Grade grading system has the dual benefits of predicting patient outcomes and promoting patient communication (Egevad et al., 2016). This article links the expression of Macrophages M2 in patients with clinical phenotypes such as AJCC_Stage, ISUP_Grade and the patient’s survival time, and completes the high correlation between differential target genes and clinical phenotypes to ensure that the core genes screened have better prognosis. Studies have shown that in the process of Herpes simplex virus 1 (HSV-1) infection, the level of IFI16 protein is greatly reduced. IFI16 interacts with tumor suppressor proteins p53 and BRCA1 and affects the process of tumor development (Llaca, 2016). At the same time, cell cycle and DNA replication have long been studied and proved to be highly relevant to the process of cancer, and the molecular mechanism of cell transformation has been proposed, which may help determine potential targets for improving cancer treatment (Hartwell and Kastan, 1994; Tachibana et al., 2005; Zhang et al., 2016b). Similarly, cellular senescence has also been studied extensively and has an impact on the progression and prognosis of cancer (Hartwell and Kastan, 1994; Tachibana et al., 2005; Zhang et al., 2016b). Therefore, this study found the primary way that miRNA-126-3p differentially target genes in HCC affect tumor progression. It also proved that the modular-genes obtained by screening significantly related to the prognosis of cancer.
In the study, univariate COX regression analysis and LASSO regression analysis were used to select the 10 genes with the smallest partial likelihood deviation among the core genes. In order to make the prediction model have a more accurate prognostic ability, this study selected the 5 genes with the largest expression differences (CDCA8, SLC41A3, PPM1G, TCOF1, GRPEL2) by drawing ROC curves to complete the construction of gene signatures. Studies have shown that Cell division cycle associated 8 (CDCA8) as a component of the chromosome complex, it participates in the formation of the mitotic spindle (Jeon et al., 2017). According to research, CDCA8 is highly correlated with activating inflammation-induced motility, manifesting in liver tissues and affecting lung tissues and breast tissues (Zhou et al., 2015). Meanwhile, the significant pathways of CDCA8 are metabolism of proteins and cell cycle, same as the major pathway of GRPEL2. Both of the two genes up-regulated in HCC, may suppress hepatocellular carcinoma growth. As reported CDCA8 can prevent HCC tumors keep growing by altering protein expression. In this study, the expression of CDCA8 in the high-risk group was significantly increased, which is consistent with previous studies. SLC41A3 encodes protein with cation transmembrane transport protein activity, which may help Mg2+ transport (de Baaij et al., 2016). At the same time, a lot of research work has included the gene SLC41A3 in their gene signatures (Liu et al., 2020; Zhou et al., 2020b). The ectopic expression of PPM1G enhances the stability of p27 protein and delays the progression of the cell cycle from G1 to S phase (Sun et al., 2016). PPM1G dephosphorylates USP7S, which plays a major role in cancer prevention, thereby affecting the progress of cancer (Khoronenkova et al., 2012). The significant pathways of PPM1G are mRNA splicing, development Dopamine D2 receptor transactivation of EGFR. And the epidermal growth factor receptor (EGFR) is reported as a rational target for cancer therapy because it is commonly expressed at a high level in a variety of solid tumours and implicated in the control of cell survival, proliferation, metastasis and angiogenesis (Ciardiello and Tortora, 2003). Thus, PPM1G may influence the survival, proliferation, metastasis of tumor cells. TCOF1 may cause tumor formation by affecting the expression of p53 (Al-Sayegh, 2009). Increased p53 protein levels in response to DNA damage activate a G1-phase cell cycle checkpoint (Graeber et al., 1994). It affected the proliferation of HCC in the liver tissue. And it affect the proliferation and division of bone marrow cells in the bone marrow, leading to the occurrence of leukemia (Kastan et al., 1991). Research has shown that GrpEL2 as a stress resistant protein in higher vertebrates, can maintain the activity of molecular chaperone under specific conditions (Srivastava et al., 2017). The expression level is multiplied by the corresponding LASSO regression coefficient and summed to obtain the prognostic score of each sample. Subsequently, the median of the overall prognostic score of the HCC sample was selected as the cutoff value, and the high-scoring samples were classified as the high-risk group and the low-scoring samples as the low-risk group. The time-dependent ROC curve and K–M survival curve results show that the scoring formula has credible prognostic ability.
Subsequently, the prognostic score and clinical data AJCC_Stage were used as variables for multivariate COX regression analysis, and the nomogram C-index = 0.644 was constructed, indicating that it also has a good prognostic ability. Stage III&IV patients’ risk score is higher than I&II one’s with a long span, as seen from the nomogram. It means high-risk patients’ primary tumor is larger, metastasis of the tumor in the distant organs and tissues is farther and the involvement of local lymph nodes is worse, considering from the pathological aspect. The analysis from the validation data set confirmed the results. Although some people have investigated these genes (Luyao et al., 2017), and proposed a variety of biological beacons for HCC, including protein symbols (Nan et al., 2018), RNA symbols (Zhou et al., 2020a), 22-gene signature (Zhou et al., 2020b), 4-lncRNA signature (Zhang et al., 2016a), but no one has constructed a gene signature for the target genes of differentially expressed miRNAs. The 5-gene signature was finally grouped based on the risk score, and 8 GSEA pathways that differentiated into high and low groups enriched by HCC genes were found.
In the study, the immune status of HCC patients was linked with gene expression, and the proportion of 22 immune cells was analyzed. It was observed that Macrophages M2, which has the highest level of infiltration in patients, had a significant decrease in infiltration level in the high-risk group. According to research, Macrophages M2 activity can promote cell proliferation and tissue repair (Mills, 2012). At the same time, it was observed that the infiltration level of macrophages M0 showed a significant upward trend from low risk to high risk, which may be caused by the differentiation of M2 to M0. T cell CD4 memory resting after stimulation in culture produced a wide range of T-cell cytokines, inhibiting spontaneous tumour necrosis factor-alpha (Brennan et al., 2008). And it shown that T cell CD8 is involved in the process of liver cirrhosis, a high-risk factor for liver cancer (Behboudi and Pereira, 2010). These research conclusions are consistent with the results of the work. This study links the target genes of miRNA with the level of immune cell infiltration, observes the changes in the level of immune cell infiltration, enhances the accuracy of the prognosis of gene signatures, and also investigates the immune infiltration of HCC.
The study innovatively selected the differential target genes of miRNAs differentially expressed in HCC patients as the research object, and applied WGCNA technology to find the core differential target genes to ensure the correctness of subsequent analysis and provide a guarantee for the prognostic ability of gene signatures. At the same time, LASSO regression analysis is used to construct gene signatures, which avoids the excessive punishment of coefficients. In the process of constructing the gene signature, the gene is screened to ensure that the obtained gene signature is highly correlated with the patient’s survival prognosis. Finally, AJCC_Stage and survival time are used as variables to construct a nomogram, which further improves the prognostic ability.
In summary, the paper revealed five hub genes that significantly associated with patients’ prognosis and immune cell infiltration in HCC. And the paper constructed a 5-gene signature (CDCA8, SLC41A3, PPM1G, TCOF1, GRPEL2) and a nomogram based on the differential target genes of miRNA-126-3p, which have been verified to have a good prognostic ability. The comprehensive evaluation of patient gene signature may help guide us to more effective immunotherapy strategies.
Author Contributions: Conceptualization, Qingjia Chi; Methodology, Qingjia Chi and Rui Xu; Validation, Rui Xu and Qibiao Wu; Formal Analysis, Rui Xu and Qibiao Wu; Investigation, Yuhan Gong, Yongzhe Wu; Writing–Original Draft Preparation, Rui Xu and Qibiao Wu; Writing–Review & Editing, Yuhan Gong, Yongzhe Wu; Visualization, Rui Xu and Qibiao Wu; Supervision, Qingjia Chi; Project Administration, Qingjia Chi and Da Sun; Funding Acquisition, Qingjia Chi and Da Sun. All authors reviewed the results and approved the final version of the manuscript.
Availability of Data and Materials: The datasets analysed during the current study are available in the TCGA database (https://cancergenome.nih.gov). miRwalk 2.0 website (http://zmf.umm.uni-heidelberg.de/apps/zmf/mirwalk2). GEO database (https://www.ncbi.nlm.nih.gov/geo). Cibersort website (https://CIBERSORT.stanford.edu/).
Funding Statement: The study was supported by grants from the National Natural Science Foundation of China (51901160).
Conflicts of Interest: The authors declare that they have no conflicts of interest to report regarding the present study.
Al-Sayegh K (2009). Identification of apoptosis pathway in Treacher Collins syndrome, (Doctoral Dissertation). [Google Scholar]
Behboudi S, Pereira SP (2010). Alpha-fetoprotein specific CD4 and CD8 T cell responses in patients with hepatocellular carcinoma. World Journal of Hepatology 2: 256. DOI 10.4254/wjh.v2.i7.256. [Google Scholar] [CrossRef]
Boyault S, Rickman DS, de Reyniès A, Balabaud C, Rebouissou S et al. (2007). Transcriptome classification of HCC is related to gene alterations and to new therapeutic targets. Hepatology 45: 42–52. DOI 10.1002/hep.21467. [Google Scholar] [CrossRef]
Brennan FM, Smith NM, Owen S, Li C, Amjadi P et al. (2008). Resting CD4+ effector memory T cells are precursors of bystander-activated effectors: A surrogate model of rheumatoid arthritis synovial T-cell function. Arthritis Research & Therapy 10: R36. DOI 10.1186/ar2390. [Google Scholar] [CrossRef]
Ciardiello F, Tortora G (2003). Epidermal growth factor receptor (EGFR) as a target in cancer therapy: Understanding the role of receptor expression and other molecular determinants that could influence the response to anti-EGFR drugs. European Journal of Cancer 39: 1348–1354. DOI 10.1016/S0959-8049(03)00235-1. [Google Scholar] [CrossRef]
de Baaij JH, Arjona FJ, van Den Brand M, Lavrijsen M, Lameris AL et al. (2016). Identification of SLC41A3 as a novel player in magnesium homeostasis. Scientific Reports 6: 1. DOI 10.1038/srep28565. [Google Scholar] [CrossRef]
Du C, Lv Z, Cao L, Ding C, Owusu-Ansah KG et al. (2014). MiR-126-3p suppresses tumor metastasis and angiogenesis of hepatocellular carcinoma by targeting LRP6 and PIK3R2. Journal of Translational Medicine 12: S5. DOI 10.1186/s12967-014-0259-1. [Google Scholar] [CrossRef]
Egevad L, Delahunt B, Srigley JR, Samaratunga H (2016). International Society of Urological Pathology (ISUP) grading of prostate cancer-An ISUP consensus on contemporary grading. American Journal of Surgical Pathology 40: 433–435. [Google Scholar]
Elsegood CL, Tirnitz-Parker JE, Olynyk JK, Yeoh GC (2017). Immune checkpoint inhibition: Prospects for prevention and therapy of hepatocellular carcinoma. Clinical & Translational Immunology 6: e161. DOI 10.1038/cti.2017.47. [Google Scholar] [CrossRef]
Fantini M, Benvenuto M, Masuelli L, Frajese GV, Tresoldi I et al. (2015). In vitro and in vivo antitumoral effects of combinations of polyphenols, or polyphenols and anticancer drugs: Perspectives on cancer treatment. International Journal of Molecular Sciences 16: 9236–9282. DOI 10.3390/ijms16059236. [Google Scholar] [CrossRef]
Graeber TG, Peterson JF, Tsai M, Monica K, Fornace AJJr et al. (1994). Hypoxia induces accumulation of p53 protein, but activation of a G1-phase checkpoint by low-oxygen conditions is independent of p53 status. Molecular and Cellular Biology 14: 6264–6277. [Google Scholar]
Giannini EG, Farinati F, Ciccarese F, Pecorelli A, Rapaccini GL et al. (2015). Prognosis of untreated hepatocellular carcinoma. Hepatology 61: 184–190. DOI 10.1002/hep.27443. [Google Scholar] [CrossRef]
Guo L, Wang Z, Du Y, Mao J, Zhang J et al. (2020). Random-forest algorithm based biomarkers in predicting prognosis in the patients with hepatocellular carcinoma. Cancer Cell International 20: 394. DOI 10.1186/s12935-020-01274-z. [Google Scholar] [CrossRef]
Han D, Li L, Ge X, Li D, Zhang X (2020a). MicroRNA expression integrated analysis and identification of novel biomarkers in small cell lung cancer: A meta-analysis. Translational Cancer Research 9: 3339–3353. DOI 10.21037/tcr.2020.04.12. [Google Scholar] [CrossRef]
Han S, Huang K, Gu Z, Wu J (2020b). Tumor immune microenvironment modulation-based drug delivery strategies for cancer immunotherapy. Nanoscale 12: 413–436. DOI 10.1039/C9NR08086D. [Google Scholar] [CrossRef]
Hartwell LH, Kastan MB (1994). Cell cycle control and cancer. Science 266: 1821–1828. DOI 10.1126/science.7997877. [Google Scholar] [CrossRef]
Hou J, Zhang H, Sun B, Karin M (2020). The immunobiology of hepatocellular carcinoma in humans and mice: Basic concepts and therapeutic implications. Journal of Hepatology 72: 167–182. DOI 10.1016/j.jhep.2019.08.014. [Google Scholar] [CrossRef]
Jeon TW, Ko MJ, Seo YR, Baik IH, Hwang I et al. (2017). Knockdown of cell division cycle-associated 8 (CDCA8) suppresses hepatocellular carcinoma growth via the upregulation of tumor suppressor ATF3. Cancer Research 77: 3113. [Google Scholar]
Kanai Y, Ushijima S, Hui AM, Ochiai A, Tsuda H et al. (1997). The E-cadherin gene is silenced by CpG methylation in human hepatocellular carcinomas. International Journal of Cancer 71: 355–359. DOI 10.1002/(ISSN)1097-0215. [Google Scholar] [CrossRef]
Kastan MB, Radin AI, Kuerbitz SJ, Onyekwere O, Wolkow CA et al. (1991). Levels of p53 protein increase with maturation in human hematopoietic cells. Cancer Research 51: 4279–4286. [Google Scholar]
Khemlina G, Ikeda S, Kurzrock R (2017). The biology of Hepatocellular carcinoma: Implications for genomic and immune therapies. Molecular Cancer 16: 3. DOI 10.1186/s12943-017-0712-x. [Google Scholar] [CrossRef]
Khoronenkova SV, Dianova II, Ternette N, Kessler BM, Parsons JL et al. (2012). ATM-dependent downregulation of USP7/HAUSP by PPM1G activates p53 response to DNA damage. Molecular Cell 45: 801–813. DOI 10.1016/j.molcel.2012.01.021. [Google Scholar] [CrossRef]
Liu J, Lu J, Ma Z, Li W (2020). A nomogram based on a three-gene signature derived from AATF coexpressed genes predicts overall survival of hepatocellular carcinoma patients. BioMed Research International 2020: 1–17. DOI 10.1155/2020/7310768. [Google Scholar] [CrossRef]
Lou W, Chen J, Ding B, Chen D, Zheng H et al. (2018). Identification of invasion-metastasis-associated microRNAs in hepatocellular carcinoma based on bioinformatic analysis and experimental validation. Journal of Translational Medicine 16: 1952. DOI 10.1186/s12967-018-1639-8. [Google Scholar] [CrossRef]
Luyao Z, Huixing H, Lihuan C, Long Y (2017). Expressions of CDCA8 and INCENP mRNAs in hepatocellular carcinoma and their clinical significance. Chinese Journal of Cancer Biotherapy 24: 158–167. [Google Scholar]
Llaca MA (2016). Study of the DNA sensor IFI16 in cancer and herpes simplex virus type 1 infection (Doctoral Dissertation). Department of Molecular Biology, Faculty of Sciences of the Autonomous University of Madrid. [Google Scholar]
Mills C (2012). M1 and M2 macrophages: Oracles of health and disease. Critical Reviews in Immunology 32: 463–488. DOI 10.1615/CritRevImmunol.v32.i6.10. [Google Scholar] [CrossRef]
Nan F, Li P, Xueting L (2018). A novel fluorescent probe targeting lysosome for rapid imaging of HCC biomarker alpha-L-fucosidase. Free Radical Biology and Medicine 128: S56–S57. DOI 10.1016/j.freeradbiomed.2018.10.106. [Google Scholar] [CrossRef]
Nowicki M, Szemraj J, Wierzbowska A, Pluta A, Grzybowska-Izydorczyk O et al. (2021). Alterations in microRNA expression during hematopoietic stem cell mobilization. Biology 10: 668. DOI 10.3390/biology10070668. [Google Scholar] [CrossRef]
Pinato DJ, Guerra N, Fessas P, Murphy R, Mineo T et al. (2020). Immune-based therapies for hepatocellular carcinoma. Oncogene 39: 3620–3637. DOI 10.1038/s41388-020-1249-9. [Google Scholar] [CrossRef]
Piñero F, Tanno M, Soteras GA, Baña MT, Dirchwolf M et al. (2020). Argentinian clinical practice guideline for surveillance, diagnosis, staging and treatment of hepatocellular carcinoma. Annals of Hepatology 19: 546–569. DOI 10.1016/j.aohep.2020.06.003. [Google Scholar] [CrossRef]
Srivastava S, Savanur MA, Sinha D, Birje A, Vigneshwaran R et al. (2017). Regulation of mitochondrial protein import by the nucleotide exchange factors GrpEL1 and GrpEL2 in human cells. Journal of Biological Chemistry 292: 18075–18090. DOI 10.1074/jbc.M117.788463. [Google Scholar] [CrossRef]
Sun C, Wang G, Wrighton KH, Lin H, Songyang Z et al. (2016). Regulation of p27Kip1 phosphorylation and G1 cell cycle progression by protein phosphatase PPM1G. American Journal of Cancer Research 6: 2207. [Google Scholar]
Tachibana K EK, Gonzalez MA, Coleman N (2005). Cell-cycle-dependent regulation of DNA replication and its relevance to cancer pathology. Journal of Pathology: A Journal of the Pathological Society of Great Britain and Ireland 205: 123–129. DOI 10.1002/(ISSN)1096-9896. [Google Scholar] [CrossRef]
Xing M, Kokabi N, Prajapati HJ, Close O, Ludwig JM et al. (2016). Survival in unresectable AJCC stage I and II HCC and the effect of DEB-TACE: SEER versus tertiary cancer center cohort study. Journal of Comparative Effectiveness Research 5: 141–154. DOI 10.2217/cer.15.54. [Google Scholar] [CrossRef]
Zhang J, Baddoo M, Han C, Strong MJ, Cvitanovic J et al. (2016a). Gene network analysis reveals a novel 22-gene signature of carbon metabolism in hepatocellular carcinoma. Oncotarget 7: 49232–49245. DOI 10.18632/oncotarget.10249. [Google Scholar] [CrossRef]
Zhang J, Dai Q, Park D, Deng X (2016b). Targeting DNA replication stress for cancer therapy. Genes 7: 51. DOI 10.3390/genes7080051. [Google Scholar] [CrossRef]
Zhou H, Wang L, Huang J, Jiang M, Zhang X et al. (2015). High EGFR_1 Inside-Out Activated Inflammation-Induced Motility through SLC2A1-CCNB2-HMMR-KIF11-NUSAP1-PRC1-UBE2C. Journal of Cancer 6: 519–524. DOI 10.7150/jca.11404. [Google Scholar] [CrossRef]
Zhou L, Zhu W, Wang G, Cao X, Zhang X et al. (2020a). Investigation of microRNA expression signatures in HCC via microRNA Gene Chip and bioinformatics analysis. Pathology-Research and Practice 216: 152982. DOI 10.1016/j.prp.2020.152982. [Google Scholar] [CrossRef]
Zhou T, Cai Z, Ma N, Xie W, Gao C et al. (2020b). A novel ten-gene signature predicting prognosis in hepatocellular carcinoma. Frontiers in Cell and Developmental Biology 8: 42817. DOI 10.3389/fcell.2020.00629. [Google Scholar] [CrossRef]
 | This work is licensed under a Creative Commons Attribution 4.0 International License, which permits unrestricted use, distribution, and reproduction in any medium, provided the original work is properly cited. |