DOI:10.32604/biocell.2022.018221
| BIOCELL DOI:10.32604/biocell.2022.018221 | |
| Article |
Prognostic tumor microenvironment gene and the relationship with immune infiltration characteristics in metastatic breast cancer
1Department of Medical Oncology, The First Affiliated Hospital of Hainan Medical University, Haikou, 570102, China
2Clinical Laboratory Center, The First Affiliated Hospital of Anhui University of Chinese Medicine, Hefei, 230031, China
3Department of Clinical Laboratory, The First Affiliated Hospital of Xinjiang Medical University, Urumqi, 830054, China
*Address correspondence to: Changcheng Yang, yanggreatwall@hainmc.edu.cn; Yanda Lu, yandalu986@163.com
#These authors contributed equally to this work
Received: 07 July 2021; Accepted: 15 September 2021
Abstract: The aim of this study was to reveal genes associated with breast cancer metastasis, to investigate their intrinsic relationship with immune cell infiltration in the tumor microenvironment, and to screen for prognostic biomarkers. Gene expression data of breast cancer patients and their metastases were downloaded from the GEO, TCGA database. R language package was used to screen for differentially expressed genes, enrichment analysis of genes, PPI network construction, and also to elucidate key genes for diagnostic and prognostic survival. Spearman’s r correlation was used to analyze the correlation between key genes and infiltrating immune cells. We screened 25 hub genes, FN1, CLEC5A, ATP8B4, TLR7, LY86, PTGER3 and other genes were differentially expressed in cancer and paraneoplastic tissues. However, patients with higher expression of CD1C, IL-18 breast cancer had a better prognosis in the 10 years survival period, while patients with high expression of FN1, EIF4EBP1 tumors had a worse prognosis. In addition, TP53 and HIF1 genes are closely related to the signaling pathway of breast cancer metastasis. In this study, gene expression of ATP8B4 and CD1C were correlated with cancer tissue infiltration of CD8+ T lymphocytes, while GSE43816, GSE62327 and TCGA databases showed that CD8+ T lymphocytes were closely associated with breast cancer progression. Functional enrichment analysis of genes based on expression differences yielded key genes of prognostic value in the breast cancer microenvironment.
Keywords: Tumor microenvironment; Immune infiltration; Prognostic biomarker; Metastatic breast cancer
Breast cancer is the most common malignancy in women worldwide and the most common cancer surpassed lung cancer (Sung et al., 2021). Currently, with the increasing life expectancy of breast cancer and the rapid development of tumor diagnostic technology, breast cancer can be detected early, which lead to its increasing incidence (Sung et al., 2021). In addition, great progress has been made in the comprehensive treatment of breast cancer, such as targeted anti-HER2 therapy and endocrine therapy, but the prognosis of patients is still not very optimistic (Qiu et al., 2021; Yuan et al., 2020). Since metastasis of breast cancer seriously affects the prognosis of patients, we still do not fully understand the underlying molecular mechanisms of its development. Therefore, it is of great importance to explore the underlying molecular mechanisms of breast cancer development by identifying new diagnostic and prognostic biomarkers and potential therapeutic targets.
Currently, numerous studies have confirmed that tumorigenesis, progression and prognosis are closely related to tumor tissue gene expression (Li et al., 2021b; Lin et al., 2017; Zhang et al., 2019). The genetic expression features of the tumor microenvironment (TME) play an important impact in predicting the clinical outcome of tumor treatment (Llanos et al., 2021; Yang et al., 2021). The TME is mainly composed of cells and extracellular matrix. The cells in TME include lymphocytes, tumor-associated macrophages, tumor-associated fibroblasts, mesenchymal cells, endothelial cells, and other cells in addition to tumor cells. Immune cells and stromal cells are the two main non-tumor cells that are important for tumor diagnosis and assessment of tumor prognosis. Moreover, studies had found that altered gene expression in tumor tissue might lead to changes in non-tumor cell infiltration. For example, SFRP4 positively correlates with infiltration of FOXP3+ Treg cells in hepatocellular carcinoma, and downregulation of SFRP4 in tumor cells affects T cell recruitment (Yang et al., 2019b). It has also been found that high expression of PRC1 was associated with low macrophage infiltration in HCC tissues, which in turn lead to poor prognosis (Zhou et al., 2020a). Studies have reported genes closely related to breast cancer such as BRCA1, BRCA2, ATM, CHEK2, etc. (Dorling et al., 2021). These genes can be used not only for cancer diagnosis, but also seriously affect the development, metastasis, and treatment outcome of breast cancer. Studies have confirmed that BRCA gene mutations may not directly drive immune infiltration, but the number of infiltrating lymphocytes and monocytes is significantly higher in breast cancer tissues with decreased BRCA expression (Kubli et al., 2019; Solinas et al., 2019). However, understanding of the key genes and their associated immune cell infiltration significantly associated with breast cancer prognosis is still very limited.
In this study, we first obtain differentially expressed gene signatures from the Gene Expression Omnibus (GSE) datasets and The Cancer Genome Atlas (TCGA) to evaluate genes associated with breast cancer metastasis. Then, functional analyses such as diagnosis and prediction of prognosis of disease were performed for important genes. In addition, we evaluate the relationship between relevant genes and infiltrating immune cells to provide an immunological basis for the tumor microenvironment and to reveal potential immunotherapeutic approaches.
Breast cancer datasets acquisition and processing
The workflow of analysis in our study is illustrated in Fig. S1. Gene expression datasets and corresponding clinical information of breast cancer patients were collected from the dataset of GEO (Barrett et al., 2013) and the TCGA dataset included 1124 patients, and those microarray data without clinical information were discarded. In our study, 2 GEO datasets contained GSE62327 (Triulzi et al., 2015) (7 cases in the pre-radiation group and 7 cases in the post-radiation group) and GSE43816 (Gruosso et al., 2016) (14 cases in the disease group and 10 cases in the control group) were downloaded (https://www.ncbi.nlm.nih.gov/geo/) (Tables S1–S3). The primary data for the GSE62327 generated by Affymetrix Human Gene 1.1 ST Array [transcript (gene) version]). And the primary data for the GSE43816 generated by Illumina HumanHT-12 WG-DASL V4.0 R2 expression beadchip. The Cancer Genome Atlas (TCGA) data referenced in this study were available in a public repository from TCGA website (https://portal.gdc.cancer.gov/).
Differential gene expression analysis
The differential expression mRNAs were analyzed according to breast cancer and normal groups using the limma package (Ritchie et al., 2015). Log fold change (logFC) > 1.0 and adjusted P-value < 0.05 were set as the threshold for differential genes. The results of differential analysis of mRNA will be presented using volcano plot (ggplot2) and heat map (pheatmap) (https://CRAN.R-project.org/package=pheatmap). Where the volcano plot is plotted with ggplot2 and the heatmap is plotted with the pheatmap package.
The metascape (http://metascape.org) (Zhou et al., 2019) database was used to analyze the gene ontology (GO) enrichment analysis of the list of differentially expressed mRNA target genes after intersection, mainly including biological processes (BP), cellular component (CC), molecular function (MF); the parameters were set P < 0.01, minimum count >3, enrichment factor >1.5. The GSEA method (Subramanian et al., 2005) enriched differential mRNAs for expression-related pathways, and the groups were aligned 10,000 times for each analysis. The KEGG pathways dataset from curated gene sets was selected as the reference set. The threshold for statistically significant GSEA analysis was set at a corrected P-value < 0.05 and FDR < 0.25. The results of the enrichment analysis will be characterized by the corrected P-value as well as the NES. GSEA enrichment analysis and visualization were performed using GSEA native software.
The STRING database (http://string-db.org, version 11) (Szklarczyk et al., 2019) was used to construct the protein–protein interaction network. All the differential mRNA intersections after the associated differential molecules were put into the database for analysis, and the interaction threshold was set to 0.4. Cytoscape software (Shannon et al., 2003) was used to visualize the molecular interaction network. a plug-in for Cytoscape software: CytoHubba (Chin et al., 2014) was used to analyze the hub gene in the network.
We extracted marker gene of 24 immune cells and analyzed the infiltration of 24 immune cells within the tumor using the EPIC method (Racle et al., 2017), and analyzed the degree of correlation of the HUB gene and the expression matrix with these 24 cells using the Spearman correlation method.
Most of the statistical analyses in this study were done by the bioinformatics tools mentioned above. Other statistical analyses such as ROC curve analysis, survival curve analysis, etc. were performed by the R language package with version 3.4.1. The different expression levels of the genes were analyzed by two-tailed Student’s t-test and the GO terms and KEGG signaling pathway were done by Fisher’s test. Spearman’s r correlation analysis was used to analyze the correlation of non-normally distributed data. P-values less than 0.05 were considered statistically significant.
Screening of differentially gene expression changes in breast cancer
According to appropriate criteria in GEO database, two genome-wide gene expression datasets (GSE43816 and GSE62327) on the chemotherapy of breast cancer were selected and analyzed using the R project limma package with a threshold of adjust P-value < 0.01 and |log2 FC| > 3.0. In GSE43816 datasets, a total of 5190 mRNAs were screened out, of which 3166 up-regulated mRNA and 2024 down-regulated mRNA were identified (Figs. 1A and 1B). In GSE62327 datasets, there were 2938 up-regulated mRNA and 703 down-regulated mRNA in the comparison of chemotherapy versus non-chemotherapy of breast cancer (Figs. 1C and 1D). To clarify the genetic changes between metastatic and non-metastatic breast cancer, we compared TCGA data to make new discoveries. As shown in the volcano plot, the data from TCGA were analyzed and 7566 differentially expressed mRNAs (including 3759 were upregulated and 3807 were downregulated) were identified (Figs. 1E and 1F). When we intersected the GEO chemotherapy dataset and the dataset of breast cancer survival status, there were 81 differentially expressed genes that were upregulated (Fig. 2A). When we take the dataset of TCGA chemotherapy and metastasis and the GSE dataset to intersect, there were totally 74 upregulated mRNAs that were commonly found in four datasets (Fig. 2B).

Figure 1: Heatmap and volcano plot of differentially expressed mRNA of breast cancer in TCGA and GEO datasets. Heatmap and volcano plot of differentially expressed mRNA in breast cancer chemotherapy vs. non-chemotherapy data in GSE43816 dataset (A–B). Heatmap and volcano plot of differentially expressed genes in breast cancer chemotherapy vs. non-chemotherapy microarray data in GSE62327 dataset (C–D). Heatmap and volcano plot of differential mRNA expression in TCGA breast cancer metastasis or not (E–F). The x-axis represents the logarithm in base 2 and the y-axis represents the negative logarithm in base 10 of the false discovery rate (FDR). Each dot in the heatmap represents a gene. Brown dots represent down-regulated mRNAs, red dots represent up-regulated mRNAs, and black dots represent genes with no differences.

Figure 2: Intersection of differential genes with metastasis-associated genes. Intersection of differentially upregulated genes in three datasets (GSE43816, GSE62327 and TCGA) (A). Intersection of co-expressed genes with metastasis-associated genes (B).
Functional of pathway enrichment analysis of differential genes
In order to explore the biological functions of different genes, we analyzed and visualized the enrichment of 79 differential genes in the GO pathway (Figs. 3A–3C, Table S4); the enrichment results were mainly presented in the three directions of BP, MF, and CC of the GO pathway; the enrichment results revealed that the differential genes were mainly involved in biological processes such as reproductive structure development, epithelial to mesenchymal transition, cellular aldehyde metabolic process and extracellular matrix disassembly. We also found that it is closely related to the hypodifferentiation process: epithelial cell differentiation, which occurs mainly in the cellular matrix: extracellular matrix and is closely related to molecular functions such as ion binding. In summary, differential genes are mainly involved in the metastatic process and can promote epithelial to mesenchymal transition of cells. The results of the KEGG pathway enrichment analysis of differential genes show that differential genes are mainly associated with calcium signaling pathway, circadian entrainment, inflammatory mediator regulation of trp channels, pathways in cancer, neuroactive ligand-receptor interaction, and other biological processes (Figs. 3D–3F, Table S5).

Figure 3: KEGG/GO pathway enrichment analysis of differential genes. GO pathway enrichment analysis of biological process, cellular component, and molecular function of differential genes (A–C). KEGG signaling pathway enrichment analysis of differential genes and the interrelationship between signaling pathways (D–F).
Enrichment analysis of grouped GSEA based on tumor metastasis
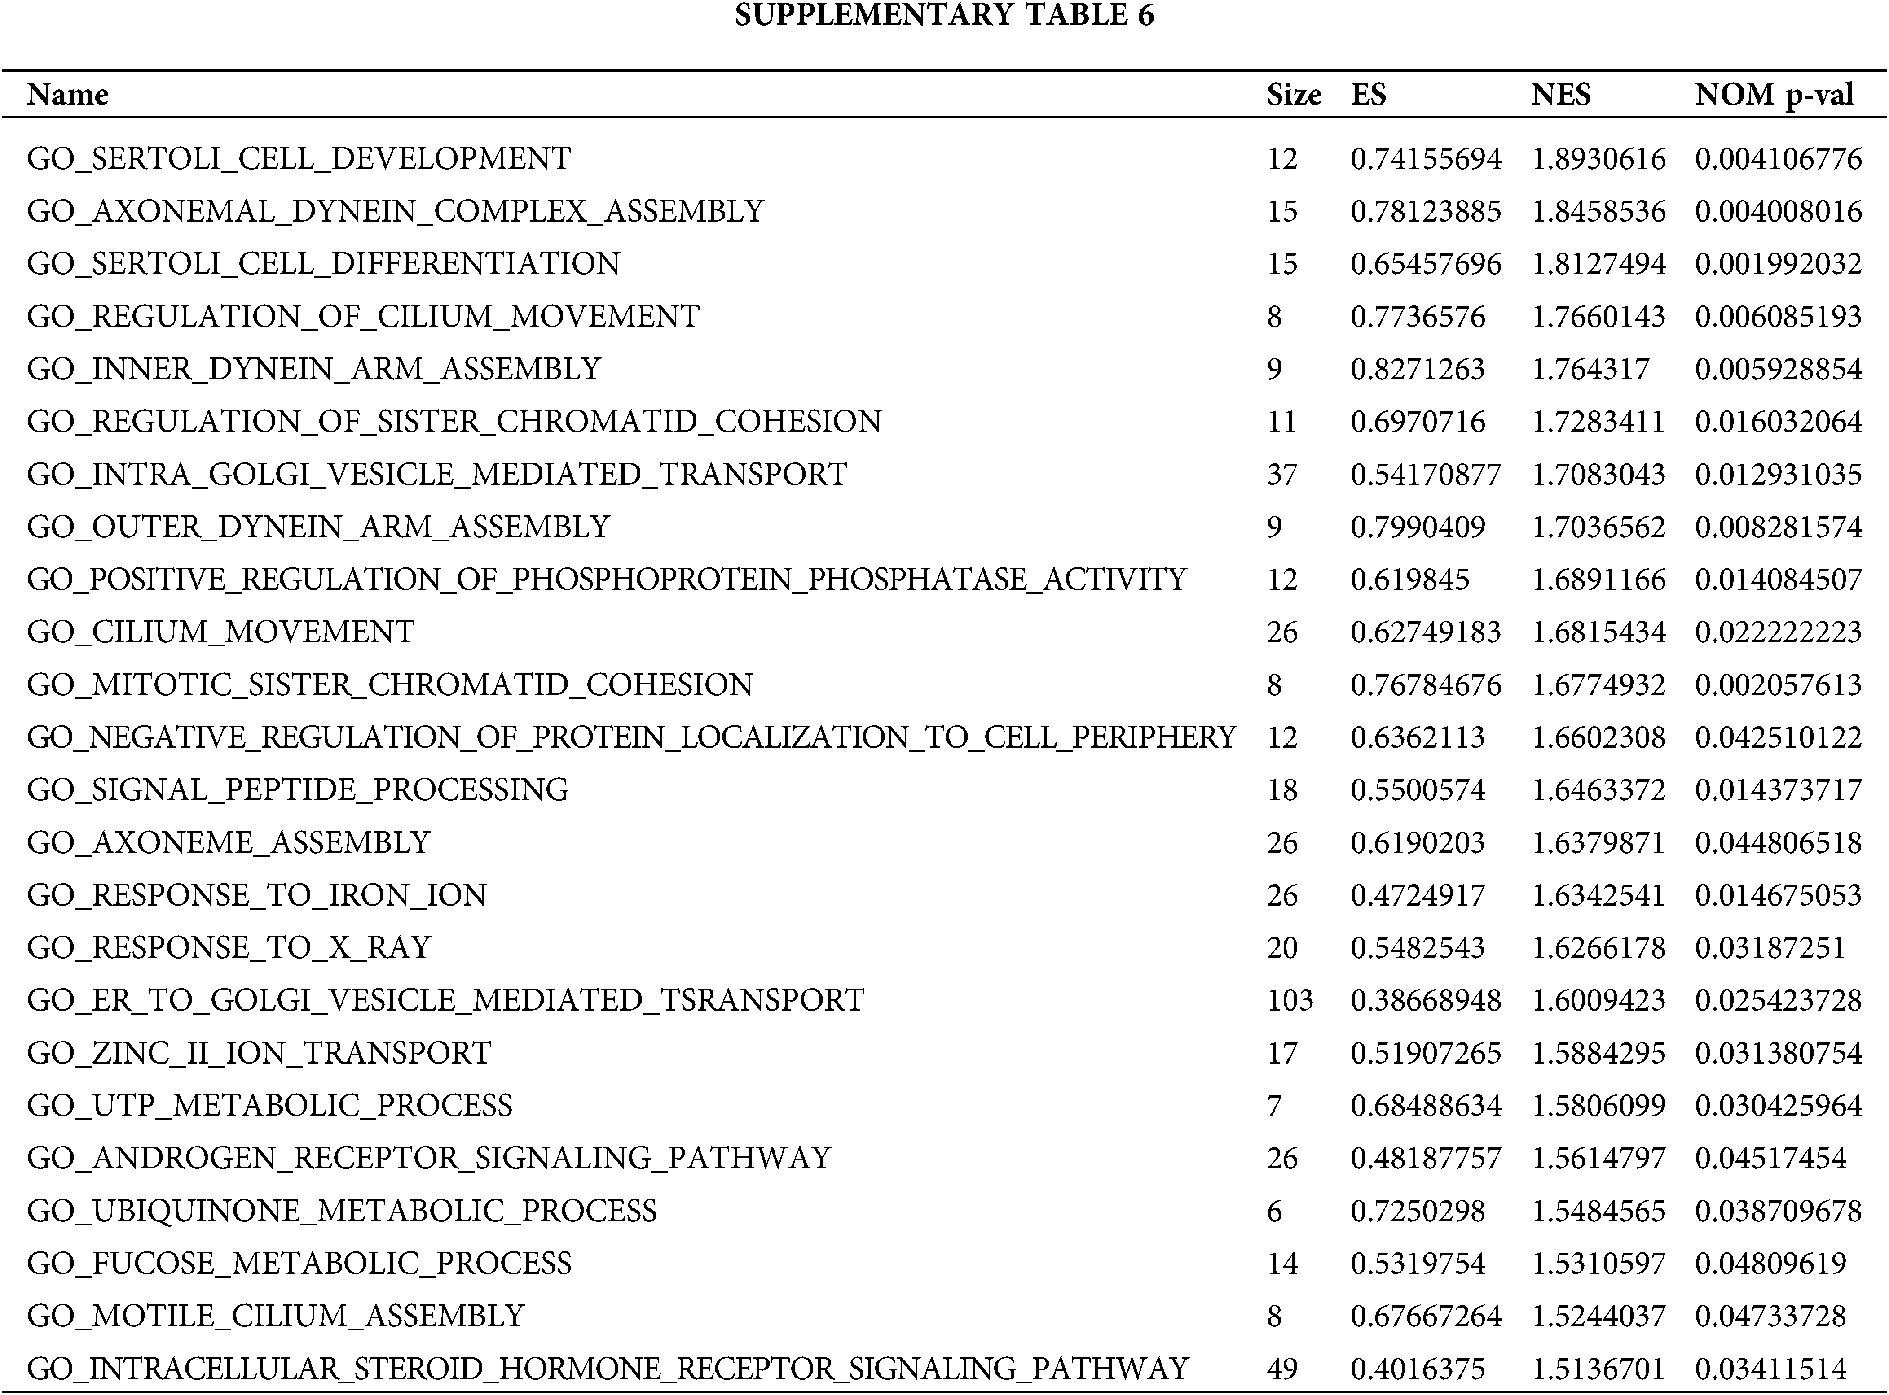
Based on the metastasis or not and grouping of TCGA samples, we obtained positive correlation pathway enrichment (Figs. 4A–4C, Table S6) and found that the grouping of high metastasis was more likely to be involved in biological processes of cell metastasis-related and chemotherapy-tolerant signaling pathways such as cell development, cell differentiation, regulation of cilium movement, cilium movement, response to iron ion, response to X-ray, myelin assembly. Similarly, we also obtained the negative pathway enrichment pathway (Figs. 4D–4F, Table S6) and found that the low metastasis subgroup was more likely to participate in natural killer cell mediated immunity, leukotriene biosynthetic process, positive regulation of BMP signaling pathway, response to oxygen radical leukotriene metabolic process, monocyte differentiation and other biological processes.

Figure 4: Grouped GSEA enrichment analysis based on metastasis expression. Positive correlation pathway enrichment (A–C) and negative correlation pathway enrichment pathway (D–F) were obtained based on metastasis or not and grouping of TCGA samples.
PPI network interactions and top HUB genes
In order to understand the interaction between different genes in the three database intersections, we obtained the interaction network map of tumor metastasis-related genes by PPI networks (Fig. 5A). We then performed the identification of the core molecules of the network graph (Fig. 5B) and finally obtained the top 25 HUB genes (Figs. 5B–5D, Table S7). These 25 HUB genes are IL-18, CD1C, PTGER3, TP53, TSC2, STK11, NPY, BCL1, TLR7, CD80, PRTOR, C3AR1, MAPK, FN1, LY86, CCL2, BAX, BID, TNFSF10, FADD, CLEC5A, PARP1, ATP8B4, TMEM30A, EIF4EBP1. Then we selected these hub different genes for following analysis.

Figure 5: PPI network interactions of key invasion-associated genes and top HUB genes. The interplay network map was obtained by subjecting the co-expression metastasis-related genes after intersection to PPI network interplay analysis (A). The identification of the core molecules of the network map was performed and finally the top 25 HUB genes were obtained (B–D).
Analysis of expression levels based on key genes and survival analysis in TCGA breast cancers
To further confirm the expression of hub genes in breast cancer, we examined the expression of 25 hub genes in TCGA database and subjected these genes to correlation analysis of TCGA expression in breast cancer, we found that in the screened differential genes TLR7, LY86, CLEC5A, CXCR4, PARP1, FN1 were expressed at lower levels in breast cancer cancer than in the paracancer (P < 0.05, Figs. 6I, 6K, 6O, 6Q, 6R, and 6S). On the other hand, PTGER3, ATP8B4 was expressed at higher levels in cancer than in the paracancer (P < 0.05, Figs. 6N and 6X), and then we subjected the related genes to survival analysis to determine the prognosis. Overall survival (OS) was performed to obtain risk coefficients and determine the prognosis for the relevant target genes. During the 10 years survival period, we found that lower expression of FN1, EIF4EBP1, TP53 had lower risk coefficients and were positively associated with good prognosis (P < 0.05, Figs. 7B, 7C and 7Q). However, high expression of CD1C, PTGER3, IL18 gene had lower risk factors and longer overall survival (P < 0.05, Figs. 7A, 7I, and 7L).

Figure 6: Analysis of expression levels based on key genes in TCGA breast cancers. About 25 genes obtained were analyzed for expression levels in TCGA, and the expression levels of TLR7, LY86, CLEC5A, CXCR4, PARP1, FN1, PTGER3, ATP8B4 which had significant differences between cancer and paracancer, were identified (A–Y).

Figure 7: Screening of meaningful key genes in TCGA based on OS. Target gene identification by OS prognostic analysis was performed to obtain OS levels for risk factors and relevant prognosis. In the 10 years survival period, breast cancers with high expression of CD1C, PTGER3, IL18 gene were significantly better than low expression (P < 0.05) (A, I, L). However, Low expression of FN1, EIF4EBP1, TP53 in breast cancer showed higher OS in the 10 years survival period (P < 0.05) (B, C, Q). Although high expression of other hub genes possessed higher OS, it was not statistically significant (P > 0.05) (D–H, J, K, R–Y).
Genes with differential expression levels after ROC diagnostic prediction analysis
In order to further clarify the clinical diagnostic value of genes with significant differential expression, we subjected these genes to ROC predictive diagnostic analysis and found that FN1, LY86, IL-18, CD1C, C3AR1, TLR7, and TMEM30A genes were genetic indicators with significant predictive diagnoses, and their diagnostic ROC curves had areas under the curves (AUC) of 0.968, 0.966, 0.897, 0.874, 0.846, 0.812, and 0.781, respectively (Figs. 8A and 8B).

Figure 8: Predictive analysis of ROC diagnosis based on genes with differential expression. Genes with significant differential expression were subjected to ROC predictive diagnostic analysis, and CD1C, TLR7, FN1, IL18, C3AR1, LY86 were found to be genetic indicators with significant predictive diagnosis (A–B).
Screening of key transcription factors for key genes and analysis of interplay networks and functions
In order to further screen the target transcription factors of key genes associated with metastasis, in this study, we took two key genes, TP53 and HIF1A, as examples, and obtained the transcription factors and their interplay networks that had binding to multiple differential genes through network interactions (Fig. 9A). Based on the network interactions between TP53 and HIF1A and the functional analysis of the pathway (Figs. 9B and 9C), we found that TP53 and HIF1A are mainly involved in cell-cell adhesion, focal adhesion, cell adhesion molecules cams and cell cycle. In addition, the GSEA pathway enrichment analysis of the target gene TP53 and HIF1A interaction network revealed that these two classical genes were mainly enriched to cell cycle, cell adhesion molecules after low expression (Figs. 9D and 9E).

Figure 9: Screening of targeting key transcription factors based on key gene prediction and their interaction network and functional analysis. Key transcription factor prediction based on HIF1A and TP53 yielded multiple transcription factors and their interplay networks (A). GO signaling pathway and functional analysis of HIF1A (B–C). GSEA pathway enrichment analysis of the target gene interaction network of TP53 (D–E).
Risk prediction of key metastasis-associated genes
To further identify risk factors associated with disease progression, we performed univariate and multivariate COX regression analysis and created forest plots for prediction and analysis based on metastasis-related genes and clinicopathological data, and found that Event (non-metastatic breast cancer had a low risk factor = 0.096, P < 0.001) (Fig. 10A), CD1C expression for predicting breast cancer recurrence and metastasis and OS (risk factor = 1.08719, P = 0.01392) (Fig. 10A), BCL1 expression for breast cancer recurrence and metastasis and OS (risk factor 1.129, P = 0.018) (Fig. 10A). However, although the risk coefficients of genes such as TLR7, CCR1, HRH4, HTR1D, P2RY13, FN1 were high, these genes were not statistically significant for predicting breast cancer (P > 0.05, Figs. 10B–10E).

Figure 10: Risk prediction of key metastasis-associated genes and forest plotting, Univariate and multifactorial COX regression analysis based on metastasis-associated genes and clinicopathological data were performed to further identify factors and associated indicators with significant risk for disease progression by drawing forest plots (A–E).
Analysis of immune infiltration assessment of key genes
Finally, we performed immune infiltration assessment analysis of the screened related genes in the breast cancer TCGA database to assess their correlation analysis with CD8+ T cells. In the immune infiltration assessment analysis of this study, we found that ATP8B4 showed a negative correlation with immune CD8+ T-cell infiltration with an R-value of −0.134 (P < 0.01, Fig. 11A). In addition, FN1 also showed a significant negative correlation with the proportion of immune CD8+ T-cell infiltration, with an R-value = −0.368 (P < 0.01, Fig. 11E). However, as shown in the figure, TLR7, LY86, IL18, and CD1C showed positive correlation with the infiltration proportion of CD8+ T cells with R-values of 0.347, 0.257, 0.451, and 0.253, respectively, and their P-values were all less than 0.01 (Figs. 11B–11D and 11F).

Figure 11: Immune infiltration assessment analysis based on key gene prediction. The screened target genes were analyzed in the breast cancer TCGA database for immune infiltration assessment, and the correlation analysis of the screened genes (ATP8B4, TLR7, LY86, IL18, FN1, CD1C) with CD8+ T cells was evaluated (A–H).
Evaluation of immune cell infiltration from TCGA, GEO sample data
To further clarify the immune status in breast cancer tissues, samples from TCGA and GEO were evaluated for immune cell infiltration and mesenchymal cell infiltration, resulting in the infiltration of immune cells CD4+, CD8+ T cells and other mesenchymal cells in the relevant datasets, as well as the proportion of each immune cell. As shown by the immune infiltration levels of metastatic and non-metastatic samples of breast cancer in the TCGA dataset, cancer-associated fibroblasts, vascular endothelial cells, and CD8+ T cells are strongly associated with breast cancer metastasis (Figs. 12A–12C); In addition, the levels of CD8+ T cells, B cells, and NK cells were higher in the group of chemotherapy without metastasis than in the group of chemotherapy with metastasis and the group of non-chemotherapy with metastasis, while the levels of CD8+ T cells, NK cells in the levels in the group of non-chemotherapy without metastasis were higher than those in the group of non-chemotherapy with metastasis (Fig. S2A). The immune infiltration levels of the GSE43816 dataset suggest that vascular endothelial cells, CD4+ T cells, CD8+ T cells, cancer-associated fibroblasts are closely related to breast cancer progression (Figs. 12D–12F). Moreover, the expression levels of CD8+ T cells, B cells, CD4+ T cells, and NK cells were higher in the chemotherapy group than in the non-chemotherapy group (Fig. S2B). The GSE62327 dataset on the level of immune infiltration in breast cancer tissues suggested that cancer-associated fibroblasts, vascular endothelial cells, and CD8+ T cells were strongly associated with breast cancer progression (Figs. 12G–12I). Furthermore, the expression levels of CD8+ T cells, B cells, and NK cells were higher in the chemotherapy-sensitive group of breast cancer than in the chemoresistant group (Fig. S2C).

Figure 12: Evaluation of immune cell infiltration based on TCGA, GEO sample data. Samples in TCGA, GEO were evaluated for immune cell infiltration and mesenchymal cell infiltration to obtain the immune cell ratio for each sample in TCGA dataset. The level of immune infiltration in metastatic and non-metastatic samples of breast cancer in TCGA dataset (A–C), in GSE43816 dataset (D–F) and in GSE62327 dataset (G–I), respectively.
With the rapid development of genetic testing technologies (e.g., microarray technology, sequencing technology, etc.) and the establishment of genetic databases, genes associated with cancer are increasingly analyzed and validated as new targets (Wang et al., 2016). However, most of the current studies do not correlate oncogenes with immune cells infiltrated in TME, which may affect the immunotherapeutic response to cancer. In this study, we sought to explore the gene expression associated with chemotherapy and metastasis of breast cancer, to obtain important genes with prognostic and diagnostic value, and to analyze their associated signaling pathways to understand the progression of breast cancer patients. By comparing the transcriptional expression profiles of breast cancer patients and metastasis groups, a total of 81 genes involved in chemotherapy-related breast cancer gene expression and 79 genes associated with breast cancer metastasis were identified. These genes were mainly involved in reproductive structure development, epithelial to mesenchymal transition, cellular aldehyde metabolic process, extracellular matrix disassembly, epithelial cell differentiation and other biological processes. Moreover, the main genes associated with metastasis were CXCR4, ERBB2, EIF4EBP1, TSC2, MAPK1, CCL2, RPTOR, BCL2, STK11, TP53, PARP1, FADD, TNFSF10, BID, BAX and so on. However, FN1, CLEC5A, ATP8B4, TLR7, LY86 PTGER3 expression significantly predicted the overall survival of breast cancer patients. Subsequently, the expression of genes including CD1C, TLR7, FN1, IL18, C3AR1, LY86 were included in the ROC curve analysis of breast cancer diagnosis and the associated risk prediction analysis. Importantly, ATP8B4 and FN1 expression were significantly associated with CD8+ T immune cell infiltration by Spearman’s correlation analysis.
Chemotherapy is still the main strategy for the treatment of cancer. However, studies have confirmed that chemotherapy may promote cancer metastasis and tumor metastasis is an important factor contributing to poor tumor prognosis (Karagiannis et al., 2017; Keklikoglou et al., 2019). In this study, by analyzing GSE43816, GSE62327, and TCGA datasets, we identified some differential genes associated with breast cancer metastasis, and the enrichment results showed that these genes are closely related to cell stromal remodeling, epithelial mesenchymal transition, intracellular metabolism, and hypofractionation process of cells. Several studies have confirmed that EMT not only confers the ability of tumor cells to invade and metastasize, but also is a major factor affecting the efficacy of chemotherapy (Li and Kang, 2016). Furthermore, epithelial mesenchymal transformation affect changes in internal cellular metabolism, involving cytoskeletal alterations and matrix remodeling, and further affects cell differentiation (Ijaz et al., 2014; Tsubakihara and Moustakas, 2018). Currently, the main signaling pathways associated with EMT are TGF-β signaling pathway, Wnt signaling pathway and Notch signaling pathway (Kyuno et al., 2021). In the present study, the main signaling pathways involved in the differential genes were Calcium signaling pathway, NOD-like receptor signaling pathway and mTOR signaling pathway, which were also found to affect EMT directly or indirectly in previous studies (Figiel et al., 2019; Hu et al., 2018; Luo et al., 2021). Our study also found that high metastasis of breast cancer is closely related to biological processes such as cell development, cell differentiation, and regulation of ciliary motility, while in low metastasis natural killer cell-mediated immunity, leukotriene biosynthesis process, positive regulation of BMP signaling pathway, leukotriene metabolic process in response to oxygen free radicals, and monocyte differentiation. Thus, by searching for key genes associated with altered metastatic ability after chemotherapy resistance in breast cancer, these genes can be studied not only as targets for future new drugs, but also as relevant biomarkers to reflect the effect of cancer chemotherapy. It is important to note that additional prospective studies are needed as well to further validate these findings due to sample size limitations in the dataset.
Next, we performed overall survival analysis and ROC curve analysis on some of the screened HUB genes. Firstly, we found that the expression levels of FN1, CLEC5A, ATP8B4, TLR7, and LY86 genes were higher in breast cancer tissues than in paracancerous tissues, while the expression levels of PTGER3 genes were lower in breast cancer tissues than in paracancerous tissues. Consistent with previous studies, in addition to ATP8B4 and LY86, FN1, CLEC5A and TLR7 were found to be highly expressed in breast cancer cells or tissues by clinical trial or bioinformatics studies, but PTGER3 expression was reduced in breast cancer, and the expression levels of these genes affects the prognosis of breast cancer (Bao et al., 2019; Semmlinger et al., 2018; Shi et al., 2020; Zhang et al., 2021; Zhang et al., 2020). Moreover, these genes play an important role in the progression of several other cancers, for example, FN1 and CLEC5A have been reported to promote proliferation, invasion and metastasis of gastric cancer and glioblastoma (Fan et al., 2019; Han et al., 2020; Wang et al., 2020; Yang et al., 2019a). In line with other findings (Inoue et al., 2019; Milioli et al., 2017; Saatci et al., 2020), we also found a significant positive correlation between low expression of IL18 genes and good prognosis of breast cancer through survival curves, while high expression of FN1 and C3AR1 genes implied poor disease prognosis. Finally, we verified that some genes (e.g., FN1, LY86, IL-18, CD1C, C3AR1, TLR7, and TMEM30A) have good diagnostic efficacy in predicting the development of breast cancer by ROC curves, and all of these genes may be used as potential biomarkers.
To further confirm the relationship between key genes and breast cancer metastasis, in the present study TP53 and HIF1A genes were used as examples, and we found that TP53 and HIF1A are mainly involved in the biology of cell-cell adhesion, cell adhesion molecules cams and cell cycle processes. Many studies have confirmed that TP53 and HIF1A genes are closely related to the metastasis of tumors (Li et al., 2021a; Tang et al., 2021; Tiwari et al., 2020). In our study, CD1C and ATP8B4 were closely associated with recurrence, metastasis, and prognosis of breast cancer. Curiously, we found that the ATP8B4 gene was negatively correlated with CD8+ T lymphocyte infiltration in breast cancer tissues, whereas CD1C was positively correlated with CD8+ T lymphocyte infiltration in cancer tissues. In addition, we also found that genes such as TLR7, LY86, and IL18 were positively correlated with the proportion of CD8+ T lymphocytes infiltrating in cancerous tissues. Recent studies have shown that IL-18 and its receptor can activate specific high expression of CD8+ T cells, suggesting a correlation between IL-18 not only with CD8+ T cells, but also its pathway to tumor-killing effector cell function (Zhou et al., 2020b). And the results by all three databases, GSE43816, GSE62327, and TCGA, showed a close relationship between CD8+ T cells and the progression of breast cancer. However, whether CD1C and ATP8B4 are abundantly expressed in many malignancies, are associated with migration of regulatory T cells, and their role in tumor-associated immunosuppression still need further experimental study.
In our study, we extracted genes of prognostic value from the GEO and TCGA databases based on functional enrichment analysis of breast cancer metastasis. These genes can be used to predict the occurrence and prognosis of breast cancer patients and show their potential to be biomarkers for breast cancer diagnosis as well as prognosis. In addition, further study of the relevant genes will help to understand the immune status of the tumor microenvironment and explore potential therapeutic targets. However, there are still some limitations of this study. First, in order to provide a comprehensive picture of the factors and effects affecting the microenvironmental phenotype of breast cancer, additional clinical features of breast cancer patients should be included in subgroup analysis. Second, the small sample size in the dataset may lead to biased results or high false positive rates, and the sample size will be appropriately increased in future studies on the immune microenvironment of breast cancer. Third, the data obtained such as altered genes and associated enriched signaling pathways were retrieved from public databases, and experiments are needed to validate these findings. Fourth, up- and down-regulation of genes may not be the real cause of the altered tumor microenvironment (e.g., lymphocyte infiltration) and breast cancer metastasis, so further mechanistic studies of these genes are needed.
Acknowledgement: We thank the TCGA and GEO databases for providing the platform and contributors for uploading their meaningful datasets.
Availability of Data and Materials: The datasets analyzed in the current study are available in the GEO (https://www.ncbi.nlm.nih.gov/geo/) and TCGA database (https://portal.gdc.cancer. gov/).
Ethics Approval: TCGA and GEO both are public databases. The patients involved in the database have obtained ethical approval in the original studies. Users can download relevant data for research and publish relevant articles. Our study is based on these open source data, so there are no ethical issues.
Authors’ Contribution: The authors confirm contribution to the paper as follows: study conception and design: Changcheng Yang and Yanda Lu; data collection: Lu Yang, Fen Huang, Yang Wen and Boke Zhang; analysis and interpretation of results: Lu Yang, Yun Liu, Boke Zhang, Jiangzheng Zeng and Mengsi Yu; draft manuscript preparation: Lu Yang, Boke Zhang and Changcheng Yang. All authors reviewed the results and approved the final version of the manuscript.
Funding Statement: This work was supported by Hainan Provincial Natural Science Foundation of China (No. 820RC765).
Conflicts of Interest: The authors declare that they have no conflicts of interest to report regarding the present study.
Bao Y, Wang L, Shi L, Yun F, Liu X et al. (2019). Transcriptome profiling revealed multiple genes and ECM-receptor interaction pathways that may be associated with breast cancer. Cellular & Molecular Biology Letters 24: 38. DOI 10.1186/s11658-019-0162-0. [Google Scholar] [CrossRef]
Barrett T, Wilhite S, Ledoux P, Evangelista C, Kim I et al. (2013). NCBI GEO: Archive for functional genomics data sets--update. Nucleic Acids Research 41: D991–D995. DOI 10.1093/nar/gks1193. [Google Scholar] [CrossRef]
Chin C, Chen S, Wu H, Ho C, Ko M, Lin C (2014). cytoHubba: Identifying hub objects and sub-networks from complex interactome. BMC Systems Biology 8: S11. DOI 10.1186/1752-0509-8-S4-S11. [Google Scholar] [CrossRef]
Dorling L, Carvalho S, Allen J, González-Neira A, Luccarini C et al. (2021). Breast cancer risk genes—Association analysis in more than 113,000 women. The New England Journal of Medicine 384: 428–439. DOI 10.1056/NEJMoa1913948. [Google Scholar] [CrossRef]
Fan H, Ni Q, Fan Y, Ma Z, Li Y (2019). C-type lectin domain family 5, member A (CLEC5A, MDL-1) promotes brain glioblastoma tumorigenesis by regulating PI3K/Akt signalling. Cell Proliferation 52: e12584. DOI 10.1111/cpr.12584. [Google Scholar] [CrossRef]
Figiel S, Bery F, Chantôme A, Fontaine D, Pasqualin C et al. (2019). A novel calcium-mediated EMT pathway controlled by lipids: An opportunity for prostate cancer adjuvant therapy. Cancers 11: 1814. DOI 10.3390/cancers11111814. [Google Scholar] [CrossRef]
Gruosso T, Mieulet V, Cardon M, Bourachot B, Kieffer Y et al. (2016). Chronic oxidative stress promotes H2AX protein degradation and enhances chemosensitivity in breast cancer patients. EMBO Molecular Medicine 8: 527–549. DOI 10.15252/emmm.201505891. [Google Scholar] [CrossRef]
Han C, Jin L, Ma X, Hao Q, Lin H, Zhang Z (2020). Identification of the hub genes RUNX2 and FN1 in gastric cancer. Open Medicine 15: 403–412. DOI 10.1515/med-2020-0405. [Google Scholar] [CrossRef]
Hu B, Ding G, Fu P, Zhu X, Ji Y et al. (2018). NOD-like receptor X1 functions as a tumor suppressor by inhibiting epithelial-mesenchymal transition and inducing aging in hepatocellular carcinoma cells. Journal of Hematology & Oncology 11: 28. DOI 10.1186/s13045-018-0573-9. [Google Scholar] [CrossRef]
Ijaz T, Pazdrak K, Kalita M, Konig R, Choudhary S et al. (2014). Systems biology approaches to understanding Epithelial Mesenchymal Transition (EMT) in mucosal remodeling and signaling in asthma. The World Allergy Organization Journal 7: 13. DOI 10.1186/1939-4551-7-13. [Google Scholar] [CrossRef]
Inoue N, Li W, Fujimoto Y, Matsushita Y, Katagiri T et al. (2019). High serum levels of interleukin-18 are associated with worse outcomes in patients with breast cancer. Anticancer Research 39: 5009–5018. DOI 10.21873/anticanres.13691. [Google Scholar] [CrossRef]
Karagiannis G, Pastoriza J, Wang Y, Harney A, Entenberg D et al. (2017). Neoadjuvant chemotherapy induces breast cancer metastasis through a TMEM-mediated mechanism. Science Translational Medicine 9: 131672. DOI 10.1126/scitranslmed.aan0026. [Google Scholar] [CrossRef]
Keklikoglou I, Cianciaruso C, Güç E, Squadrito M, Spring L et al. (2019). Chemotherapy elicits pro-metastatic extracellular vesicles in breast cancer models. Nature Cell Biology 21: 190–202. DOI 10.1038/s41556-018-0256-3. [Google Scholar] [CrossRef]
Kubli S, Bassi C, Roux C, Wakeham A, Göbl C et al. (2019). AhR controls redox homeostasis and shapes the tumor microenvironment in BRCA1-associated breast cancer. Proceedings of the National Academy of Sciences of the United States of America 116: 3604–3613. DOI 10.1073/pnas.1815126116. [Google Scholar] [CrossRef]
Kyuno D, Takasawa A, Kikuchi S, Takemasa I, Osanai M, Kojima T (2021). Role of tight junctions in the epithelial-to-mesenchymal transition of cancer cells. Biochimica et Biophysica Acta. Biomembranes 1863: 183503. DOI 10.1016/j.bbamem.2020.183503. [Google Scholar] [CrossRef]
Li H, Peng C, Zhu C, Nie S, Qian X et al. (2021a). Hypoxia promotes the metastasis of pancreatic cancer through regulating NOX4/KDM5A-mediated histone methylation modification changes in a HIF1A-independent manner. Clinical Epigenetics 13: 18. DOI 10.1186/s13148-021-01016-6. [Google Scholar] [CrossRef]
Li W, Kang Y (2016). Probing the fifty shades of EMT in metastasis. Trends in Cancer 2: 65–67. DOI 10.1016/j.trecan.2016.01.001. [Google Scholar] [CrossRef]
Li W, Qin Y, Zhou R, Liu Y, Zhang G (2021b). High expression of SIX1 is an independent predictor of poor prognosis in endometrial cancer. American Journal of Translational Research 13: 2840–2848. [Google Scholar]
Lin H, Sun S, Lu X, Chen P, Chen C et al. (2017). CCR10 activation stimulates the invasion and migration of breast cancer cells through the ERK1/2/MMP-7 signaling pathway. International Immunopharmacology 51: 124–130. DOI 10.1016/j.intimp.2017.07.018. [Google Scholar] [CrossRef]
Llanos A, Yao S, Singh A, Aremu J, Khiabanian H et al. (2021). Gene expression of adipokines and adipokine receptors in the tumor microenvironment: Associations of lower expression with more aggressive breast tumor features. Breast Cancer Research and Treatment 185: 785–798. DOI 10.1007/s10549-020-05972-0. [Google Scholar] [CrossRef]
Luo X, Cao M, Gao F, He X (2021). YTHDF1 promotes hepatocellular carcinoma progression via activating PI3K/AKT/mTOR signaling pathway and inducing epithelial-mesenchymal transition. Experimental Hematology & Oncology 10: 35. DOI 10.1186/s40164-021-00227-0. [Google Scholar] [CrossRef]
Milioli H, Tishchenko I, Riveros C, Berretta R, Moscato P (2017). Basal-like breast cancer: Molecular profiles, clinical features and survival outcomes. BMC Medical Genomics 10: 19. DOI 10.1186/s12920-017-0250-9. [Google Scholar] [CrossRef]
Qiu Y, Yang L, Liu H, Luo X (2021). Cancer stem cell-targeted therapeutic approaches for overcoming trastuzumabresistance in HER2-positive breast cancer. Stem Cells 39: 1125–1136. [Google Scholar]
Racle J, De Jonge K, Baumgaertner P, Speiser D, Gfeller D (2017). Simultaneous enumeration of cancer and immune cell types from bulk tumor gene expression data. eLife 6: e26476. DOI 10.7554/eLife.26476. [Google Scholar] [CrossRef]
Ritchie M, Phipson B, Wu D, Hu Y, Law C et al. (2015). limma powers differential expression analyses for RNA-sequencing and microarray studies. Nucleic Acids Research 43: e47. DOI 10.1093/nar/gkv007. [Google Scholar] [CrossRef]
Saatci O, Kaymak A, Raza U, Ersan P, Akbulut O et al. (2020). Targeting lysyl oxidase (LOX) overcomes chemotherapy resistance in triple negative breast cancer. Nature Communications 11: 2416. DOI 10.1038/s41467-020-16199-4. [Google Scholar] [CrossRef]
Semmlinger A, Von Schoenfeldt V, Wolf V, Meuter A, Kolben T et al. (2018). EP3 (prostaglandin E2 receptor 3) expression is a prognostic factor for progression-free and overall survival in sporadic breast cancer. BMC Cancer 18: 431. DOI 10.1186/s12885-018-4286-9. [Google Scholar] [CrossRef]
Shannon P, Markiel A, Ozier O, Baliga N, Wang J et al. (2003). Cytoscape: A software environment for integrated models of biomolecular interaction networks. Genome Research 13: 2498–2504. DOI 10.1101/gr.1239303. [Google Scholar] [CrossRef]
Shi S, Xu C, Fang X, Zhang Y, Li H et al. (2020). Expression profile of Toll-like receptors in human breast cancer. Molecular Medicine Reports 21: 786–794. [Google Scholar]
Solinas C, Marcoux D, Garaud S, Vitória J, van den Eynden G et al. (2019). BRCA gene mutations do not shape the extent and organization of tumor infiltrating lymphocytes in triple negative breast cancer. Cancer Letters 450: 88–97. DOI 10.1016/j.canlet.2019.02.027. [Google Scholar] [CrossRef]
Subramanian A, Tamayo P, Mootha V, Mukherjee S, Ebert B et al. (2005). Gene set enrichment analysis: A knowledge-based approach for interpreting genome-wide expression profiles. Proceedings of the National Academy of Sciences of the United States of America 102: 15545–15550. DOI 10.1073/pnas.0506580102. [Google Scholar] [CrossRef]
Sung H, Ferlay J, Siegel R, Laversanne M, Soerjomataram I et al. (2021). Global Cancer Statistics 2020: GLOBOCAN estimates of incidence and mortality worldwide for 36 cancers in 185 countries. CA: A Cancer Journal for Clinicians 71: 209–249. [Google Scholar]
Szklarczyk D, Gable A, Lyon D, Junge A, Wyder S et al. (2019). STRING v11: Protein-protein association networks with increased coverage, supporting functional discovery in genome-wide experimental datasets. Nucleic Acids Research 47: D607–D613. DOI 10.1093/nar/gky1131. [Google Scholar] [CrossRef]
Tang Q, Efe G, Chiarella A, Leung J, Chen M et al. (2021). Mutant p53 regulates Survivin to foster lung metastasis. Genes & Development 35: 528–541. DOI 10.1101/gad.340505.120. [Google Scholar] [CrossRef]
Tiwari A, Tashiro K, Dixit A, Soni A, Vogel K et al. (2020). Loss of HIF1A from pancreatic cancer cells increases expression of PPP1R1B and degradation of p53 to promote invasion and metastasis. Gastroenterology 159: 1882–1897. DOI 10.1053/j.gastro.2020.07.046. [Google Scholar] [CrossRef]
Triulzi T, De Cecco L, Sandri M, Prat A, Giussani M et al. (2015). Whole-transcriptome analysis links trastuzumab sensitivity of breast tumors to both HER2 dependence and immune cell infiltration. Oncotarget 6: 28173–28182. DOI 10.18632/oncotarget.4405. [Google Scholar] [CrossRef]
Tsubakihara Y, Moustakas A (2018). Epithelial-mesenchymal transition and metastasis under the control of transforming growth factor β. International Journal of Molecular Sciences 19: 3672. DOI 10.3390/ijms19113672. [Google Scholar] [CrossRef]
Wang H, Yin Y, Wang P, Xiong C, Huang L et al. (2016). Current situation and future usage of anticancer drug databases. Apoptosis: An International Journal on Programmed Cell Death 21: 778–794. DOI 10.1007/s10495-016-1250-5. [Google Scholar] [CrossRef]
Wang Q, Shi M, Sun S, Zhou Q, Ding L et al. (2020). CLEC5A promotes the proliferation of gastric cancer cells by activating the PI3K/AKT/mTOR pathway. Biochemical and Biophysical Research Communications 524: 656–662. DOI 10.1016/j.bbrc.2019.10.122. [Google Scholar] [CrossRef]
Yang B, Xie J, Li Z, Su D, Lin L et al. (2021). Seven-gene signature on tumor microenvironment for predicting the prognosis of patients with pancreatic cancer. Gland Surgery 10: 1397–1409. DOI 10.21037/gs-21-28. [Google Scholar] [CrossRef]
Yang C, Wang Y, Sims M, Cai C, Pfeffer L (2019a). MicroRNA-1 suppresses glioblastoma in preclinical models by targeting fibronectin. Cancer Letters 465: 59–67. DOI 10.1016/j.canlet.2019.08.021. [Google Scholar] [CrossRef]
Yang M, Tao L, Yang J, Jiang Y, Fu X et al. (2019b). SFRP4 is a prognostic marker and correlated with Treg cell infiltration in pancreatic ductal adenocarcinoma. American Journal of Cancer Research 9: 363–377. [Google Scholar]
Yuan C, Xie Z, Bian J, Huo J, Daily K (2020). Outcomes of primary endocrine therapy in elderly women with stage I-III breast cancer: A SEER database analysis. Breast Cancer Research and Treatment 180: 819–827. DOI 10.1007/s10549-020-05591-9. [Google Scholar] [CrossRef]
Zhang D, An X, Yu H, Li Z (2021). The regulatory effect of 6-TG on lncRNA-miRNA-mRNA ceRNA network in triple-negative breast cancer cell line. Bioscience Reports 41: BSR20203890. DOI 10.1042/BSR20203890. [Google Scholar] [CrossRef]
Zhang G, Zhong L, Luo H, Wang S (2019). MicroRNA-155-3p promotes breast cancer progression through down-regulating CADM1. OncoTargets and Therapy 12: 7993–8002. DOI 10.2147/OTT. [Google Scholar] [CrossRef]
Zhang L, Liu Q, Mu Q, Zhou D, Li H et al. (2020). MiR-429 suppresses proliferation and invasion of breast cancer via inhibiting the Wnt/β-catenin signaling pathway. Thoracic Cancer 11: 3126–3138. DOI 10.1111/1759-7714.13620. [Google Scholar] [CrossRef]
Zhou P, Zheng G, Li Y, Wu D, Chen Y (2020a). Construction of a circRNA-miRNA-mRNA network related to macrophage infiltration in hepatocellular carcinoma. Frontiers in Genetics 11: 1026. DOI 10.3389/fgene.2020.01026. [Google Scholar] [CrossRef]
Zhou T, Damsky W, Weizman OE, Mcgeary MK, Hartmann KP et al. (2020b). IL-18BP is a secreted immune checkpoint and barrier to IL-18 immunotherapy. Nature 583: 609–614. DOI 10.1038/s41586-020-2422-6. [Google Scholar] [CrossRef]
Zhou Y, Zhou B, Pache L, Chang M, Khodabakhshi A et al. (2019). Metascape provides a biologist-oriented resource for the analysis of systems-level datasets. Nature Communications 10: 1523. DOI 10.1038/s41467-019-09234-6. [Google Scholar] [CrossRef]

FIGURE S1: The workflow of analysis in our study.

FIGURE S2: Expression of immune cell infiltration based on TCGA, GEO sample data. The level of immune cell in metastatic and non-metastatic samples of breast cancer in TCGA dataset (A). The level of immune cell in chemotherapy and non-chemotherapy samples of breast cancer in GSE43816 dataset (B). The level of immune cell in chemotherapy sensitive and chemotherapy resistant samples of breast cancer in GSE62327 dataset (C).


 | This work is licensed under a Creative Commons Attribution 4.0 International License, which permits unrestricted use, distribution, and reproduction in any medium, provided the original work is properly cited. |